Abstract
We report the discovery and confirmation of the Transiting Exoplanet Survey Satellite (TESS) single-transit, warm and dense sub-Saturn, TIC 139270665 b. This planet is unusually dense for its size: with a bulk density of 2.13 g cm−3 (0.645RJ, 0.463MJ), it is the densest warm sub-Saturn of the TESS family. It orbits a metal-rich G2 star. We also found evidence of a second planet, TIC 139270665 c, with a longer period of  days and minimum mass
  of
of  MJ. First clues of TIC 139270665 b's existence were found by citizen scientists inspecting TESS photometric data from sector 47 in 2022 January. Radial velocity measurements from the Automated Planet Finder combined with TESS photometry and spectral energy distributions via EXOFASTv2 system modeling suggested a
  day orbital period for TIC 139270665 b and also showed evidence for the second planet. Based on this estimated period, we mobilized the Unistellar citizen science network for photometric follow-up, capitalizing on their global distribution to capture a second transit of TIC 139270665 b. This citizen science effort also served as a test bed for an education initiative that integrates young students into modern astrophysics data collection. The Unistellar photometry did not definitively detect a second transit, but did enable us to further constrain the planet's period. As a transiting, warm, and dense sub-Saturn, TIC 139270665 b represents an interesting laboratory for further study to enhance our models of planetary formation and evolution.
Export citation and abstract BibTeX RIS

Original content from this work may be used under the terms of the Creative Commons Attribution 4.0 licence. Any further distribution of this work must maintain attribution to the author(s) and the title of the work, journal citation and DOI.
1. Introduction
The scientific exploration of exoplanets has revealed a striking diversity of planetary systems very different from our own. Our solar system is not the archetype of all planetary systems. The rapid success in exoplanet science over roughly three decades is in part owed to large survey missions such as Kepler (Borucki et al. 2010) and the Transiting Exoplanet Survey Satellite (TESS; Ricker et al. 2014). While hot Jupiters (orbital periods <10 days and masses ≥0.25MJ) are now recognized as rarities (Mayor et al. 2011; Wright et al. 2012; Petigura et al. 2018), their existence has prompted us to revisit and revise our planetary formation and evolutionary models. These revisions include origin hypotheses such as in situ formation, disk migration, and high-eccentricity tidal migration (Dawson & Johnson 2018; Fortney et al. 2021). As our investigations broaden to include lesser documented exoplanets, such as warm Jupiters (gas giants with periods >10 days and <100 days), we further the refinement of our planetary birth and evolution models. Additionally, the merging of new technologies and outreach initiatives has empowered citizen astronomers (e.g., the general public, educators, and students) to fill a critical role in exoplanet discovery and follow up (Fischer et al. 2012; Mousis et al. 2014; Gomez & Fitzgerald 2017; Zellem et al. 2020; Kokori et al. 2022a, 2022b; Peluso et al. 2023). Consequently, this can drive us into a new era where democratized astronomical research can benefit both the professional and nonprofessional community.
Warm Jupiters are of particular interest to us because they are less prevalent (Jones et al. 2003; Wittenmyer et al. 2010; Santerne et al. 2016) and their existence prompts us to further question our formation and migration theories since it is unknown why they did not migrate closer to become hot Jupiters or remain in orbits farther out (Dawson & Johnson 2018). Additional interest stems from the desire to better understand the observed orbital "period valley" that warm Jupiters occupy between their hot and cold counterparts (Wittenmyer et al. 2010; Mayor et al. 2011; Wright et al. 2012; Santerne et al. 2016). To capture the diversity of other giant planetary phenomena in the not too hot or too cold regions, researchers might propose the more encompassing term "warm giants." This would include a variety of planetary types in addition to warm Jupiters, such as warm Neptunes and warm Saturns. These warm giants may provide clues to internal planetary structures with their lack of inflated atmospheres, unlike their hot counterparts (Fortney & Nettelmann 2010; Grieves et al. 2022). Additionally, in our solar system, as noted by Brady et al. (2018), there is a distinct size gap among planets, with none found between the sizes of 4.0 R⊕ (Uranus) and 9.1 R⊕ (Saturn). This void offers an intriguing area of study presented by warm giants.
Although warm giants are exciting to study, they are hard to detect. Most wide-field photometry surveys have limitations for longer-period exoplanets, such as warm giants with P > 10 days (Bakos et al. 2004; Pollacco et al. 2006; Bakos et al. 2013). Even so, there is high enthusiasm for TESS's wide-field surveys of bright stars (Ricker et al. 2014), which we anticipate to discover more than 10,000 new exoplanets in its lifetime (Barclay et al. 2018). Among TESS exoplanets discovered to date, a significant portion of TESS Objects of Interest (TOIs) exhibit a short-period system, with a median orbital period of 5.42 days. Since TESS's observational baseline window only allots 27 days for most stars observed, longer-period exoplanets are less likely to be caught. However, it has been predicted that single-transit events from TESS light curves may produce hundreds of potential longer-period exoplanets (Cooke et al. 2018; Villanueva et al. 2019). Currently, the NASA Exoplanet Archive reports only 27 confirmed TESS exoplanets with 10 < P < 100 days and a confirmed mass 0.25 < MJ < 13. 36 Of TESS exoplanets with P > 100 days, only four have been confirmed (Kostov et al. 2021; Dalba et al. 2022; Heitzmann et al. 2023; Mireles et al. 2023). Since the TESS pipeline relies on observing repeated transits for detection, the majority of TOIs are not single transits. There are approximately ∼120 single-transit TESS candidates currently proposed, but only a few that have been confirmed to date (Villanueva et al. 2019; Díaz et al. 2020; Dalba et al. 2022; Hobson et al. 2022).
Sub-Saturns, a category of exoplanets with sizes between 4.0 and 8.0 R⊕ (Petigura et al. 2017a) are considered to be rare (Brady et al. 2018; Addison et al. 2021). Filtering for those in a "warm" orbit, Exoplanet Archive reports 15 TESS-confirmed sub-Saturns, with eight having mass constraints (see footnote 37). While being less in mass than Jovians (Jontof-Hutter et al. 2014; Petigura et al. 2017a), the large size and mass of sub-Saturns may be attributed to their expansive envelopes of H/He (Lopez & Fortney 2014; Petigura et al. 2017a). Because of the lower masses of sub-Saturns found to date, Petigura et al. (2017a) suggest that methods of runaway accretion of gas that explain Jupiter's large mass envelope may not have occurred. Instead, alternative ideas such as formation in a gas-depleted disk have been suggested (Lee & Chiang 2015; Lee et al. 2018). Discovering and studying more sub-Saturns will help researchers better understand their formation environment and migration histories.
Due to the unknown timing of the next transit event for single-transit TOIs, their follow up is challenging due to the need for extensive photometry. An emerging solution is to leverage the collective efforts of the growing global citizen science community to increase observation time across many geographic regions. Unlike professional telescopes, which are concentrated in select regions, citizen scientists are dispersed across the world, offering a unique geographic advantage for continuous and diverse observation opportunities. The impact and usefulness of citizen astronomer programs such as NASA's Exoplanet Watch (Zellem et al. 2020), ExoClock (Kokori et al. 2022a, 2022b), the Kilodegree Extremely Little Telescope Follow-Up Network (Collins et al. 2018), and the Unistellar Exoplanet Campaign (Peluso et al. 2023) are significant. They not only help address some of the infrastructural challenges faced by professional telescopes but also offer a broader pool of photometry for follow up, confirmation, and possible discovery. Further, programs like these allow opportunities for educators and students to participate in professional exoplanet campaigns (Collins et al. 2018; Fowler 2019; Edwards et al. 2020; Sarva et al. 2020; Mizrachi et al. 2021; Peluso et al. 2023), where they can learn by doing and likely improve motivation, learning, and self-efficacy (Freeman et al. 2014), as well as contribute the important photometry needed for the challenging follow up of exoplanets like our single-transit TOIs. This is a symbiotic relationship in which astrophysical research, education, and community engagement are combined, which we will refer to in this paper as "AstroReMixEd" for brevity.
In this paper, we announce the discovery and confirmation of the TESS warm and dense sub-Saturn, TIC 139270665 b, orbiting a metal-rich G2 star with V = 10.385 and a distance of  . This planet stands out as the most densely constrained warm sub-Saturn known and represents a rare TESS single-transit event that was subsequently confirmed through ground-based follow-ups. Section 2 details TESS's initial observations and our subsequent spectroscopic and photometric follow-ups. Section 3 combines observations to discuss the radial velocity (RV) validation of the planet using ExoFastv2 model fits across TESS data, a stellar spectral energy distribution (SED) analysis, and the efforts by the Unistellar citizen science network to capture a second transit. Interestingly, our RV data also gives evidence of the nontransiting orbiting planetary companion, TIC 139270665 c, which has high value for future investigations. In Section 4, we discuss TIC 139270665 b and the impact of this unique and high-density warm sub-Saturn and the implications its existence may have on our planetary formation and migration theories. Additionally, we describe the rewarding nature of involving high school students in these observations for learning and personal enrichment, as well as the lessons learned from our citizen science campaign. Lastly, in Section 5, we summarize our discoveries.
2. Observations
2.1. TESS Photometry
TIC 139270665 was observed by the TESS extended mission in Year 4, sector 47 with a 2 minutes cadence from 2021 December 31 to 2022 January 27. TESS photometry was initially processed by the Science Processing Operations Centers (SPOC) pipeline (Jenkins et al. 2016). Highlighting the value of citizen science collaboration, the transit was found in the SPOC light curve by a group of citizen scientists called the Visual Survey Group (Kristiansen et al. 2022) that has been finding transiting planets, including other warm giants (Dalba et al. 2022), in space telescope data since the Kepler era.
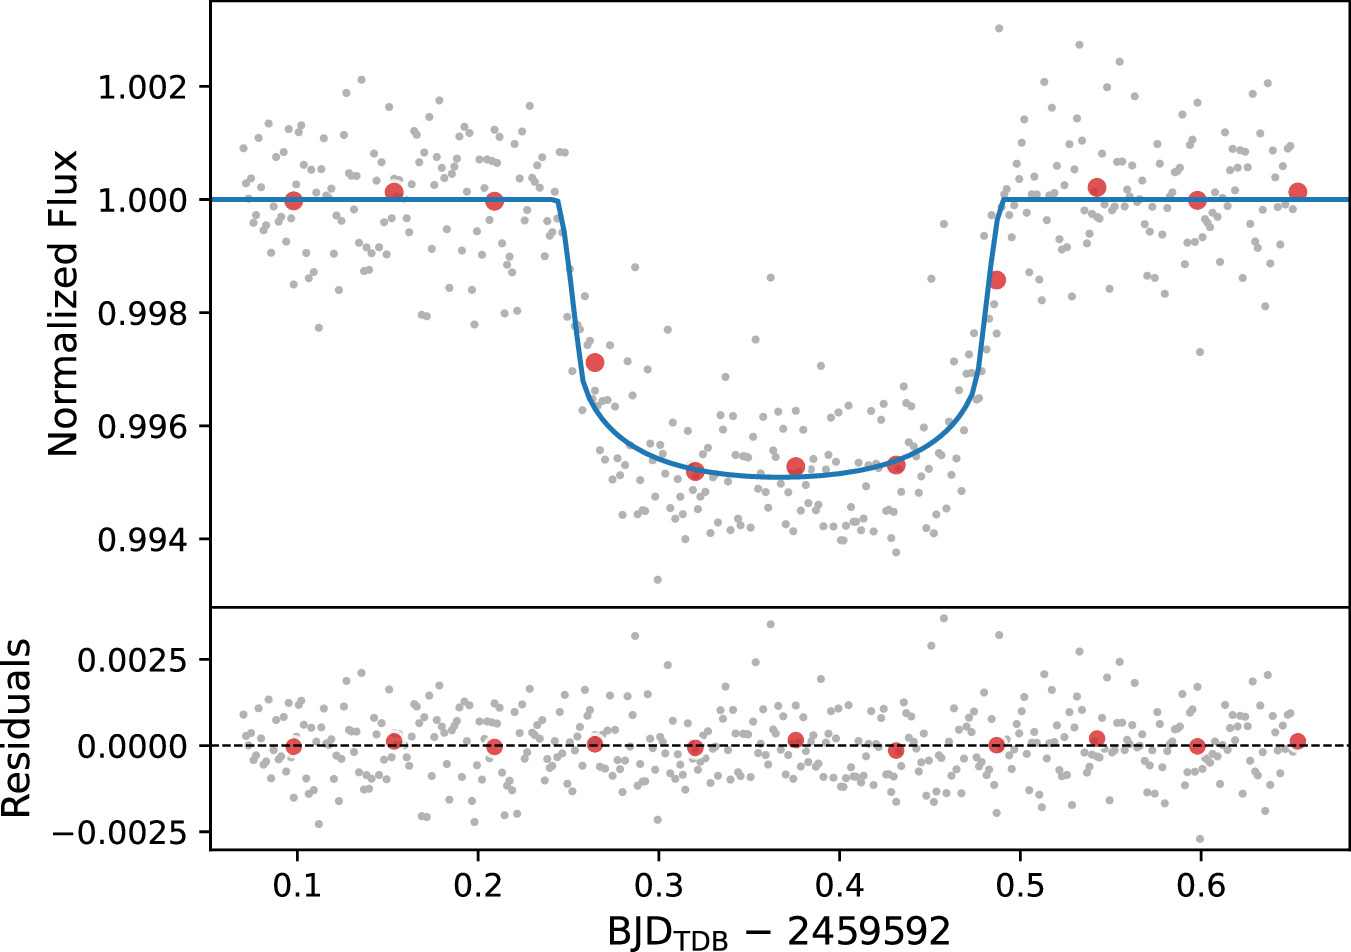
Our own re-reduction using archival TESS light curves (Team 2021) reproduced the initial discovery made by the Visual Survey Group, and this data was subsequently used in the joint modeling of the planetary system. For our reduction, we accessed the TESS data with the lightkurve package (Lightkurve Collaboration et al. 2018) and flattened the data using the lightkurve.flatten routine with a window_length = 501 and default polyorder. This produced a light curve showing a single transit of TIC 139270665 b, as seen in Figure 1. This independent recovery of the transit motivated us to follow-up TIC 139270665 with RV measurements, which then led us to initiate the Unistellar Citizen Science Network (UCSN) to attempt to detect a second transit of TIC 139270665 b.
Figure 1. Single TESS transit of TIC 139270665 b (0.645RJ ) in Sector 47 detected on 2022 January 12. Long-cadence TESS data are gray, bins of 80 minutes are red (purely for visual aid), and the best-fit EXOFASTv2 model is blue. See Section 3.1 for EXOFASTv2 details.
Download figure:
Standard image High-resolution image2.2. Speckle Imaging
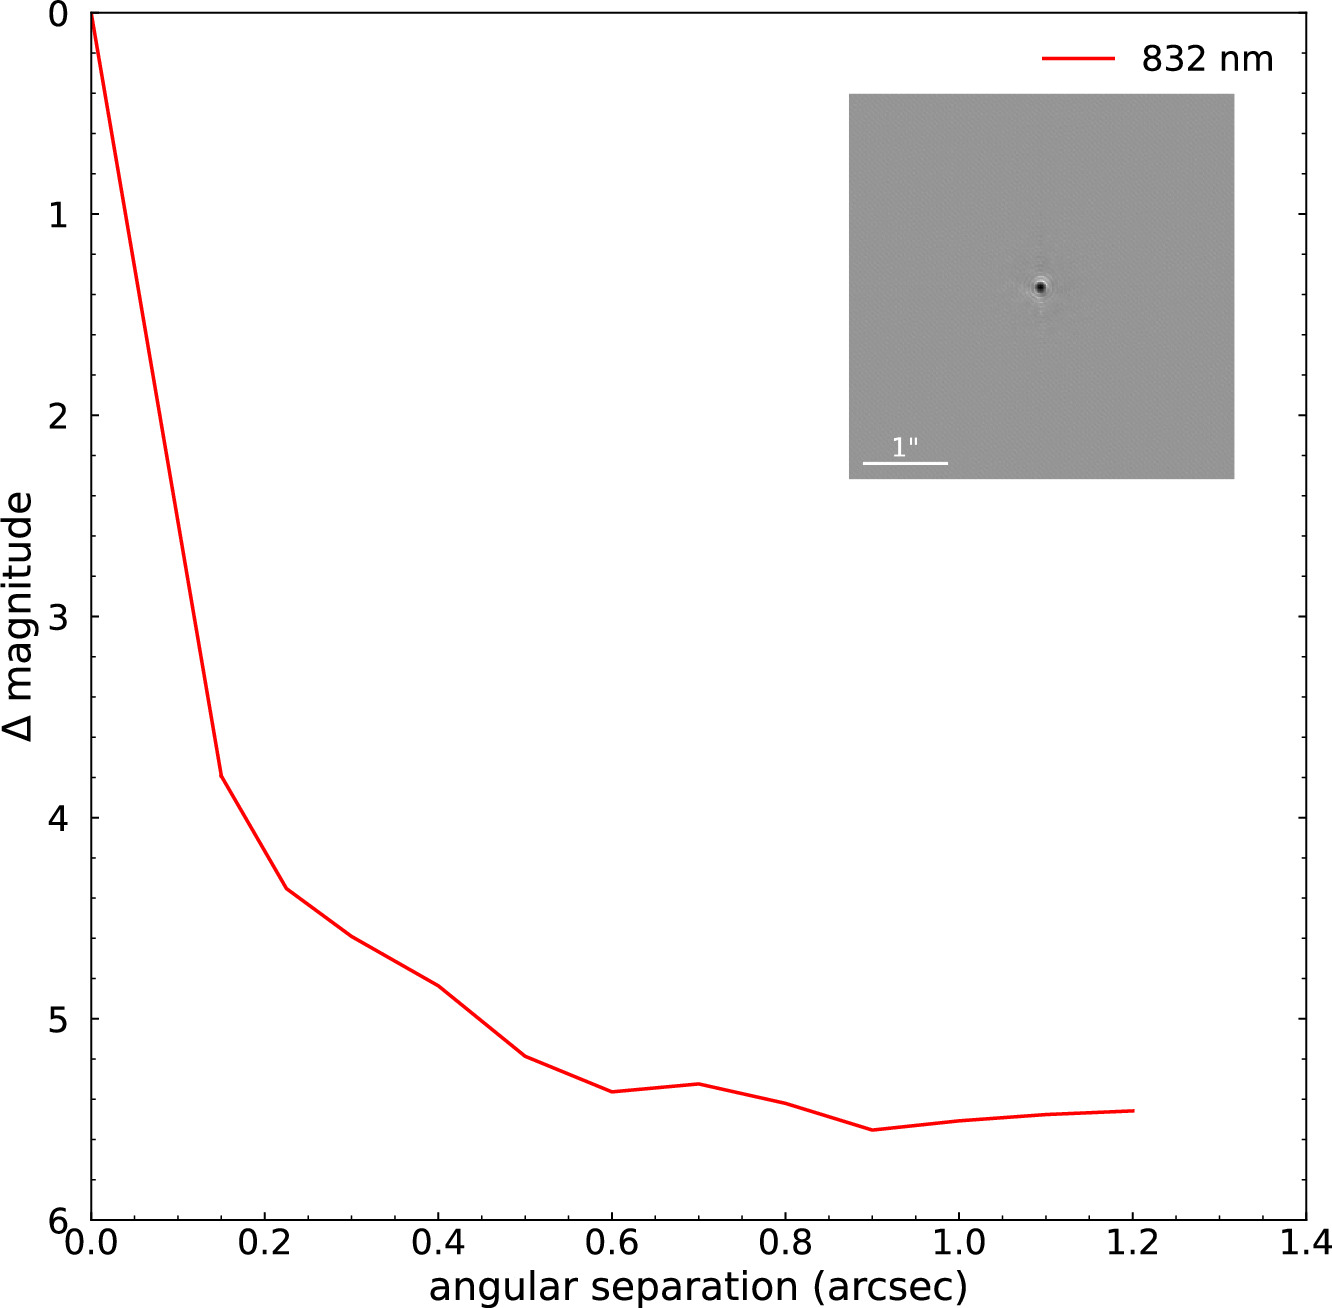
We observed TIC 139270665 with the WIYN telescope at the Kitt Peak National Observatory on 2022 April 20 using the NN-Explore Exoplanet Stellar Speckle Imager (NESSI) instrument (Scott et al. 2018). Observations with NESSI were taken using the 832 nm filter on the red camera, and the image reconstruction was performed following the methods of Howell et al. (2011) to generate contrast curves that indicate relative magnitude limits at varying angular separations from the star at the 5σ level. Our high-resolution image led to a nondetection of any nearby companion stars within the examined range. This is illustrated in Figure 2, where our observations using the WIYN telescope achieved a contrast of approximately 4 mag at an angular separation of 0 2 and indicated a nondetection of sources with Δm ranging between 5 and 5.5 for separations from 0
 45 to 1
 2 from TIC 139270665.
Figure 2. Limiting magnitude Δm at the 5σ level for the nondetection of a neighboring star based on the speckle imaging from WIYN NESSI. The inset shows the speckle image at 832 nm.
Download figure:
Standard image High-resolution image2.3. APF and HIRES Spectroscopy
After the single-transit discovery by the Visual Survey Group, we began RV follow up in order to measure TIC 139270665 b's orbit, mass, and to confirm the detection as a genuine planet. To this end, we initiated a Doppler monitoring campaign with the Automated Planet Finder (APF) at Lick Observatory (Radovan et al. 2014; Vogt et al. 2014). The APF leverages the capabilities of the Levy spectrograph, a high-resolution (R ≈ 114,000) slit-fed optical echelle spectrometer (Radovan et al. 2010). Using standard iodine techniques, we derived RV measurements from the collected data with the Levy spectrograph. Observations utilizing APF began shortly after the TESS signal was discovered, with the first APF measurements occurring in 2022 March, but ended shortly thereafter because of the target setting. APF resumed observations in 2022 September and continued observing with varying cadence through 2023 June, except for 2 months when APF closed during the bad rain season in California in 2023 March and April. After cutting three spectra for low count values, our reported APF observations result in 59 measured RVs, which are listed in Table 3 of the
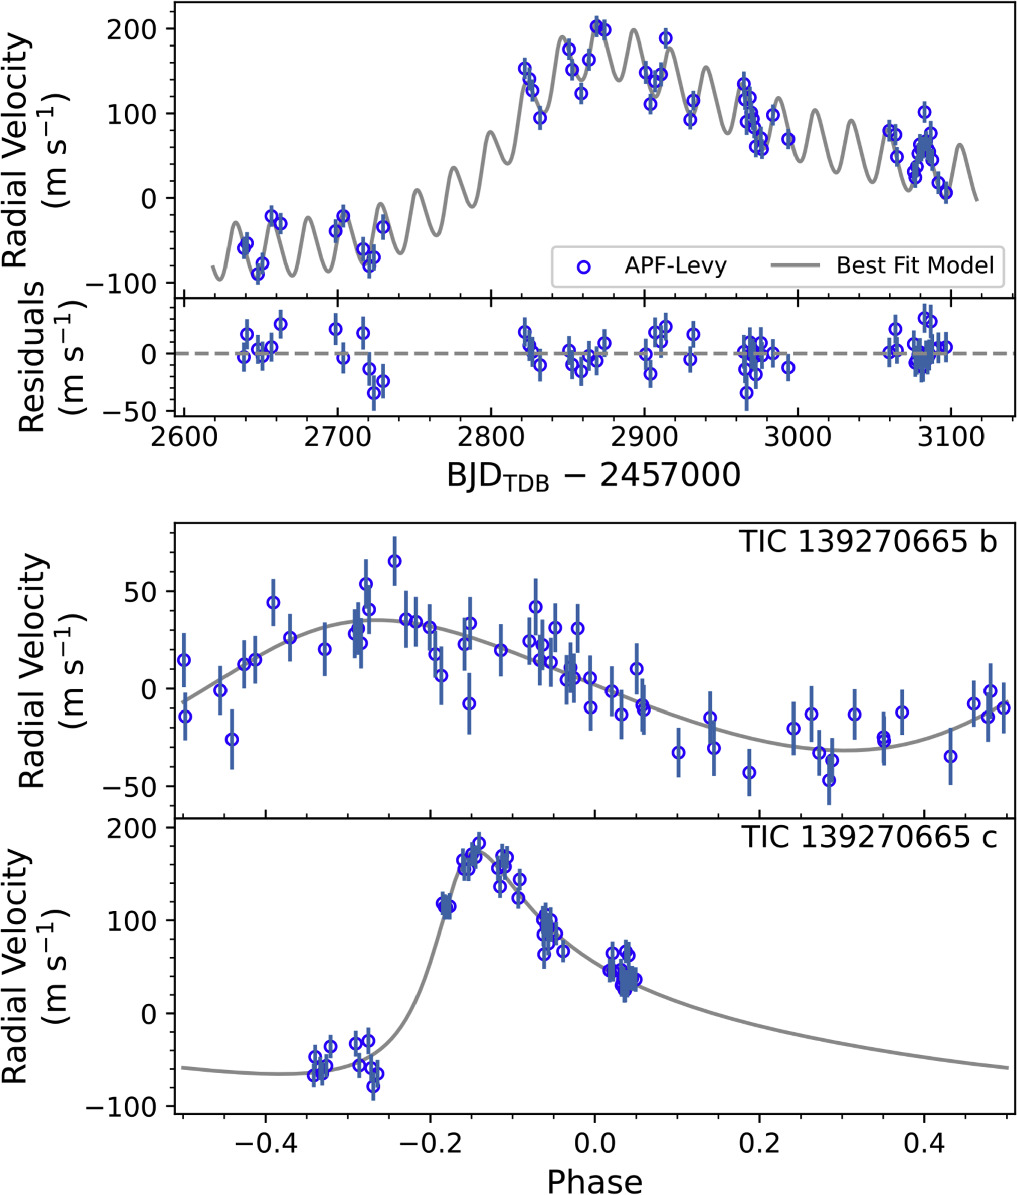
Figure 3. APF RVs of TIC 139270665. The top panel is the entire time series, while the bottom two panels are planet b's and c's Keplerian signals separated and phase-folded on the best-fit TC values.
Download figure:
Standard image High-resolution imageIn addition to our observations with APF, we also secured a high signal-to-noise ratio (S/N) spectrum from the W. M. Keck Observatory. This was achieved with the High Resolution Echelle Spectrometer (HIRES) on its Keck I telescope (Vogt et al. 1994). With the collected spectrum, we sought to rule out potential false positives and gain additional insights into TIC 139270665. Utilizing SpecMatch (Petigura et al. 2017b), we carried out a basic spectroscopic analysis to measure parameters Teff,  , [Fe/H], and
  . The
. The  was measured to be 4.2 ± 1.0 km s−1.
Furthermore, the high-S/N spectrum from Keck-HIRES was adapted to serve as a template spectrum for our APF RVs (Butler et al. 1996), ensuring consistency and accuracy across our measurements. We used HIRES to obtain this spectrum because it is much more time efficient than getting a similarly high-S/N spectrum with APF.
2.4. Unistellar Citizen Science Photometry
Unistellar Enhanced Vision Telescopes (eVscopes) are portable, digital, smart telescopes manufactured and distributed by Unistellar. The UCSN contains over 10,000 eVscopes in more than 60 countries. All current eVscope models are Newtonian-style reflectors with an aperture of 114 mm, focal length of 450 mm, and use a low-noise high-quantum-efficiency Sony CMOS sensor at the prime focus. 37 Full details on eVscope technical specifications (Marchis et al. 2020) and how the science team engages the network and processes Unistellar exoplanet data are in our Unistellar Exoplanet Campaign paper (Peluso et al. 2023) and other published works that have successfully employed eVscopes for transit photometry data (Zellem et al. 2020; Dalba et al. 2022; Pearson et al. 2022; Perrocheau et al. 2022; Wang et al. 2022).
To validate or refine TIC 139270665 b's orbit by observing its anticipated transits, we scheduled observations with Unistellar citizen astronomers. While the RV data provided constraints on the planet's orbital period (see Section 3.1), there were still uncertainties regarding the exact transit timing. In light of this, the globally distributed nature of UCSN and its abundant on-sky time were advantageous, and allowed us to gather many observations over large windows of time. Our outreach to the UCSN community included blog posts, 38 updates on our exoplanet-dedicated Unistellar Citizen Science Slack channel, and a special overnight TIC 139270665 b observing campaign outreach event for Bay Area, California high school students in the Chabot Space & Science Center's Galaxy Explorer program (2023 February 18–19). 39
UCSN observations to search for five additional transits of TIC 139270665 b occurred in 2022 December and 2023 February–April, and resulted in 271 hr of data across 62 total data sets from 39 unique eVscopes and 46 eVscope operators in 10 countries. Of the eVscope operators, three were SETI Institute scientists, 16 were high school student citizen scientists, and 27 were nonstudent citizen scientists. High school students worked in pairs to operate eight eVscopes at the Chabot outreach event. In 2023 February, our coverage contained 25 data sets, encompassing 139.4 hr distributed within a 3σ observing window of 3 days. However, only 8% of the February photometry ended up falling within the highest-probability predicted transit time using our final EXOFASTv2 period from Table 1 in Section 3.1. We also had observing campaigns in 2022 December, 2023 March, and two in 2023 April that had 11 data sets spanning 43 hr, seven data sets totaling 21.3 hr, 16 data sets of 60.1 hr, and three data sets of 7.2 hr, respectively. Given the extensive data from 2023 February, which also covered the highest percentage of the most probable transit time from our EXOFASTv2 model fit, it stands out as the data set offering the highest likelihood for a transit detection. See Table 4 in the
Table 1. Median Values and 68% Confidence Interval for TIC 139270665
| Parameter | Units | Values | |
|---|---|---|---|
| Stellar parameters | |||
| M* | Mass (M☉) |

| |
| R* | Radius (R☉) |

| |
| L* | Luminosity (L☉) |

| |
| FBol | Bolometric flux (cgs) |

| |
| ρ* | Density (cgs) |

| |

| Surface gravity (cgs) |

| |
| Teff | Effective temperature (K) |

| |
| [Fe/H] | Metallicity (dex) |

| |
| [Fe/H]0 | Initial metallicity a | 0.146 ± 0.059 | |
| Age | Age (Gyr) |

| |
| EEP | Equal evolutionary phase b |

| |
| AV | V-band extinction (mag) |

| |
| σSED | SED photometry error scaling |

| |
| ϖ | Parallax (mas) | 6.766 ± 0.031 | |
| d | Distance (pc) |

| |
| Planetary parameters | b | c | |
| P | Period (days) |

|

|
| RP | Radius (RJ) |

| ⋯ |
| MP | Mass (MJ) | 0.463 ± 0.046 | ⋯ |

| Minimum mass (MJ) | 0.463 ± 0.046 |

|
| TC | Time of conjunction (BJDTDB) |

|

|
| a | Semimajor axis (AU) |

|

|
| i | Inclination (degrees) |

| ⋯ |
| e | Eccentricity |

|

|
| ω* | Argument of periastron (degrees) |

|

|
| Teq | Equilibrium temperature c (K) |

|

|
| τcirc | Tidal circularization timescale (Gyr) | 9800 ± 2000 |

|
| K | RV semi-amplitude (m/s) |

|

|
| RP /R* | Radius of planet in stellar radii |

| ⋯ |
| a/R* | Semimajor axis in stellar radii |

|

|
| δ |

| 0.00425 ± 0.00012 | ⋯ |
| δTESS | Transit depth in TESS (fraction) |

| ⋯ |
| τ | Ingress/egress transit duration (days) |

| ⋯ |
| T14 | Total transit duration (days) |

| ⋯ |
| b | Transit impact parameter |

|

|
| bS | Eclipse impact parameter |

| ⋯ |
| τS | Ingress/egress eclipse duration (days) |

| ⋯ |
| TS,14 | Total eclipse duration (days) |

| ⋯ |
| ρP | Density (cgs) |

| ⋯ |
| loggP | Surface gravity |

| ⋯ |
| Θ | Safronov number | 0.226 ± 0.022 | ⋯ |
| 〈F〉 | Incident flux (109 erg s−1 cm−2) |

|

|
| TP | Time of periastron (BJDTDB) |

|

|
| TS | Time of eclipse (BJDTDB) |

|

|

|

|

| |

| -0.084 ± 0.046 |

| |
| Wavelength parameters | TESS | ||
| u1 | Linear limb-darkening coefficient |

| |
| u2 | Quadratic limb-darkening coefficient | 0.290 ± 0.049 | |
| Telescope parameters | APF | ||
| γrel | Relative RV offset (m/s) |

| |
| σJ | RV jitter (m/s) |

| |
| Transit Parameters: | TESS UT 2022-01-12 (TESS) | ||
| σ2 | Added variance |

| |
| F0 | Baseline flux |

| |
Notes. See Table 3 in Eastman et al. (2019) for a detailed description of all parameters.
a The metallicity of the star at zero-age main sequence. b Corresponds to static points in a star's evolutionary history. See Section 2 in Dotter (2016). c Assumes no albedo and perfect redistribution.Download table as: ASCIITypeset image
3. Results
3.1. EXOFASTv2 System Modeling
We used the EXOFASTv2 modeling suite (Eastman et al. 2013, 2019) to derive the stellar and planetary parameters of the system. We used 59 RVs from APF and no priors for the orbital period, since we only had a single transit from the TESS photometry. The EXOFASTv2 model we applied was tailored to simultaneously fit the TESS photometry, RVs, and stellar SEDs derived from archival photometry. Crucial priors were set on the stellar Teff and [Fe/H], based on results from the SpecMatch analysis. Additionally, we set priors for parallax from the Gaia Data Release 3 data sets (Gaia Collaboration et al. 2021; Lindegren et al. 2021) and for extinction using Galactic dust maps (Schlafly & Finkbeiner 2011). The fitting process was continued until most parameters met standard EXOFASTv2 convergence criteria, namely Tz
> 1000 and Gelman–Rubin statistic (GR) < 1.01. However, some parameters associated mainly with the outer planet c—namely mass,  , TC
,
  , and
, and  —achieved GR values between 1.01 and 1.1. Given the incomplete orbit of this planetary companion, such results were anticipated.
Our primary focus remained on the inner planet, TIC 139270665 b, which we confirm in this study with a mass 0.463 ± 0.046MJ
, bulk density 2.13 g cm−3, orbital period  , and eccentricity
  . As we are deferring a detailed follow up and study of TIC 139270665 c to a later paper (contingent upon acquiring a more extended RV baseline), we halted the EXOFAST runs prior to achieving full convergence on this planetary companion. It is worth noting, however, that our preliminary estimates place this outer object's minimum mass of
  MJ
within the planetary regime. TIC 139270665 c's minimum mass, as well as all relevant stellar and planetary parameters for TIC 139270665 and TIC 139270665 b from our EXOFASTv2 model fit, are presented in Table 1.
3.2. Unistellar Network Light Curves
The improved constraints on TIC 139270665 b's orbital period from the EXOFASTv2 modeling provided predicted transit windows for future attempts to detect a second transit via photometric follow up with UCSN. However, we note that when searching for the transit with UCSN, we were chasing a moving target and therefore the uncertainties in the predicted mid-transit times were high. RV collection was ongoing during that process, so the best-fit orbital period was regularly changing. Even small changes to the period were then propagated over all the orbits that had occurred since the initial single-transit discovery by TESS. This is a particular challenge facing any single-transit follow-up effort.
To account for the uncertainty in mid-transit times, our UCSN campaigns spanned multiple days surrounding each of the five predicted transit windows between 2022 December and 2023 April. Initial examination of the UCSN photometry did not reveal a clear transit signal for any of the five predicted transits.
With no clear detection from the individual light curves, we performed a joint modeling of all light curves via a Markov Chain Monte Carlo (MCMC) approach with the emcee package (Foreman-Mackey et al. 2013). Employing the EXOFASTv2 TIC 139270665 b planetary parameters (i, e, ω*, u1, u2) from Table 1, these parameters were initialized in our log-likelihood function through the batman package (Kreidberg 2015). Normal priors, centered on these parameters and scaled by their respective uncertainties (e.g., the EXOFASTv2 errors from P, RP /R*, and TC ), were used to guide our MCMC analysis. Additional details on the MCMC parameterization are in Appendix A.
With the median length of individual Unistellar light curves only 3.97 hr long, and the expected transit duration being 5.9 hr, we introduced an offset parameter to normalize the relative fluxes of each light curve with respect to an out-of-transit mean of 1. This offset adjustment aids the MCMC simulation in navigating and effectively sampling the parameter space, ensuring that data—particularly those captured entirely within an expected transit—are accurately normalized. We initialized the walker locations for most offsets with a flat prior in the range (−0.001, 0.001), although we did have custom ranges for four data sets, as detailed in Appendix A. The MCMC model contained 65 dimensions: three for the planet's P, RP /R*, and TC parameters, and 62 offset values, one corresponding to each Unistellar data set. We kept the a, i, e, ω*, and u1 and u2 wavelength parameters of limb-darkening fixed.
The estimated values for P, RP
/R*, and TC
from the resulting posterior distributions are given in Table 2, and the marginalized distributions are provided in Figure 13 in the
Table 2. MCMC Posterior Distributions and Confidence Intervals for P, RP /R*, and TC
| Parameter | Max Likelihood | 68.3% Confidence Range | 99.7% Confidence Range |
|---|---|---|---|
| P | 23.627585 | ± 0.000252 | ± 0.007389 |
| RP /R* | 0.065792 | ± 0.000508 | ± 0.001894 |
| TC | 2459592.366264 | ± 0.000515 | ± 0.002011 |
Download table as: ASCIITypeset image
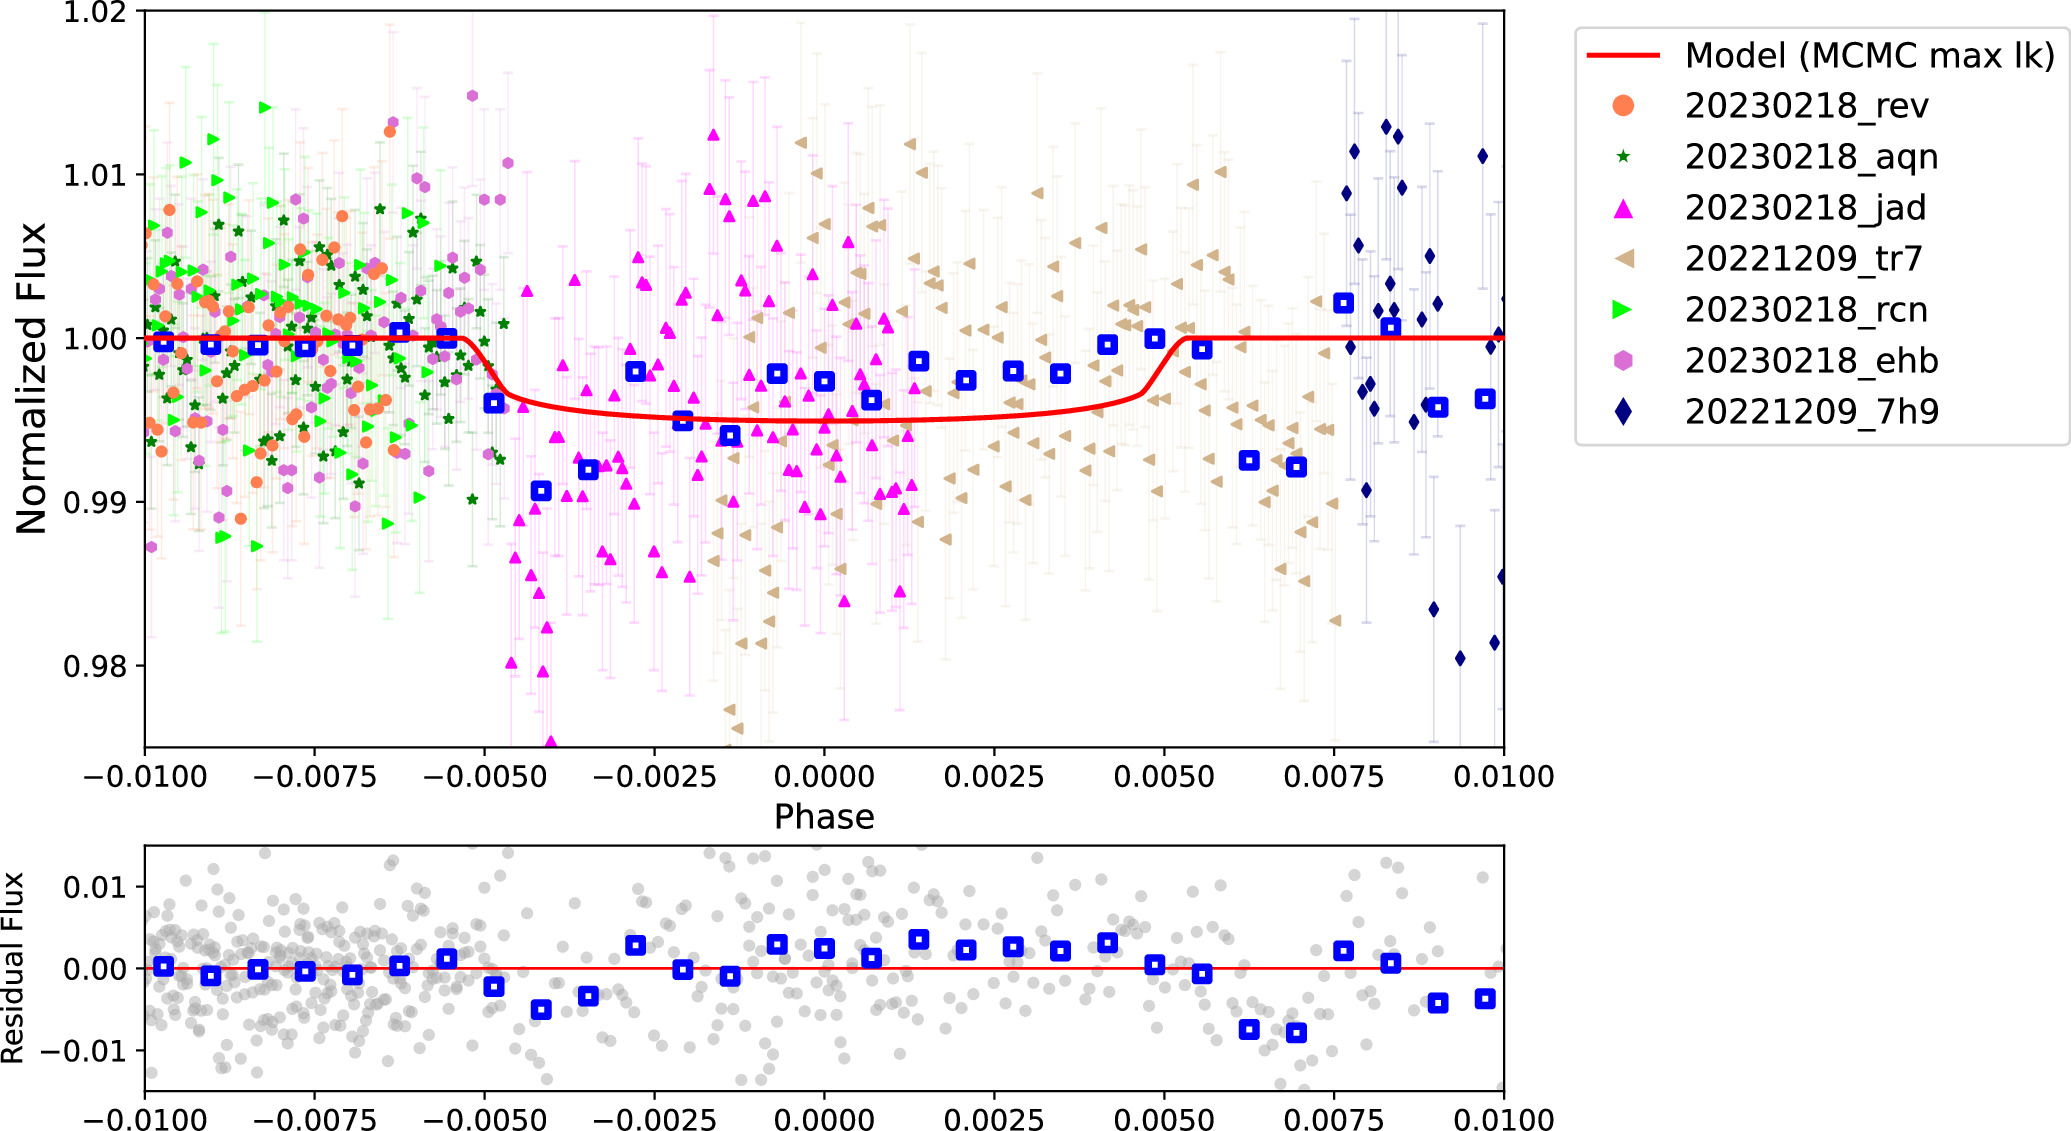
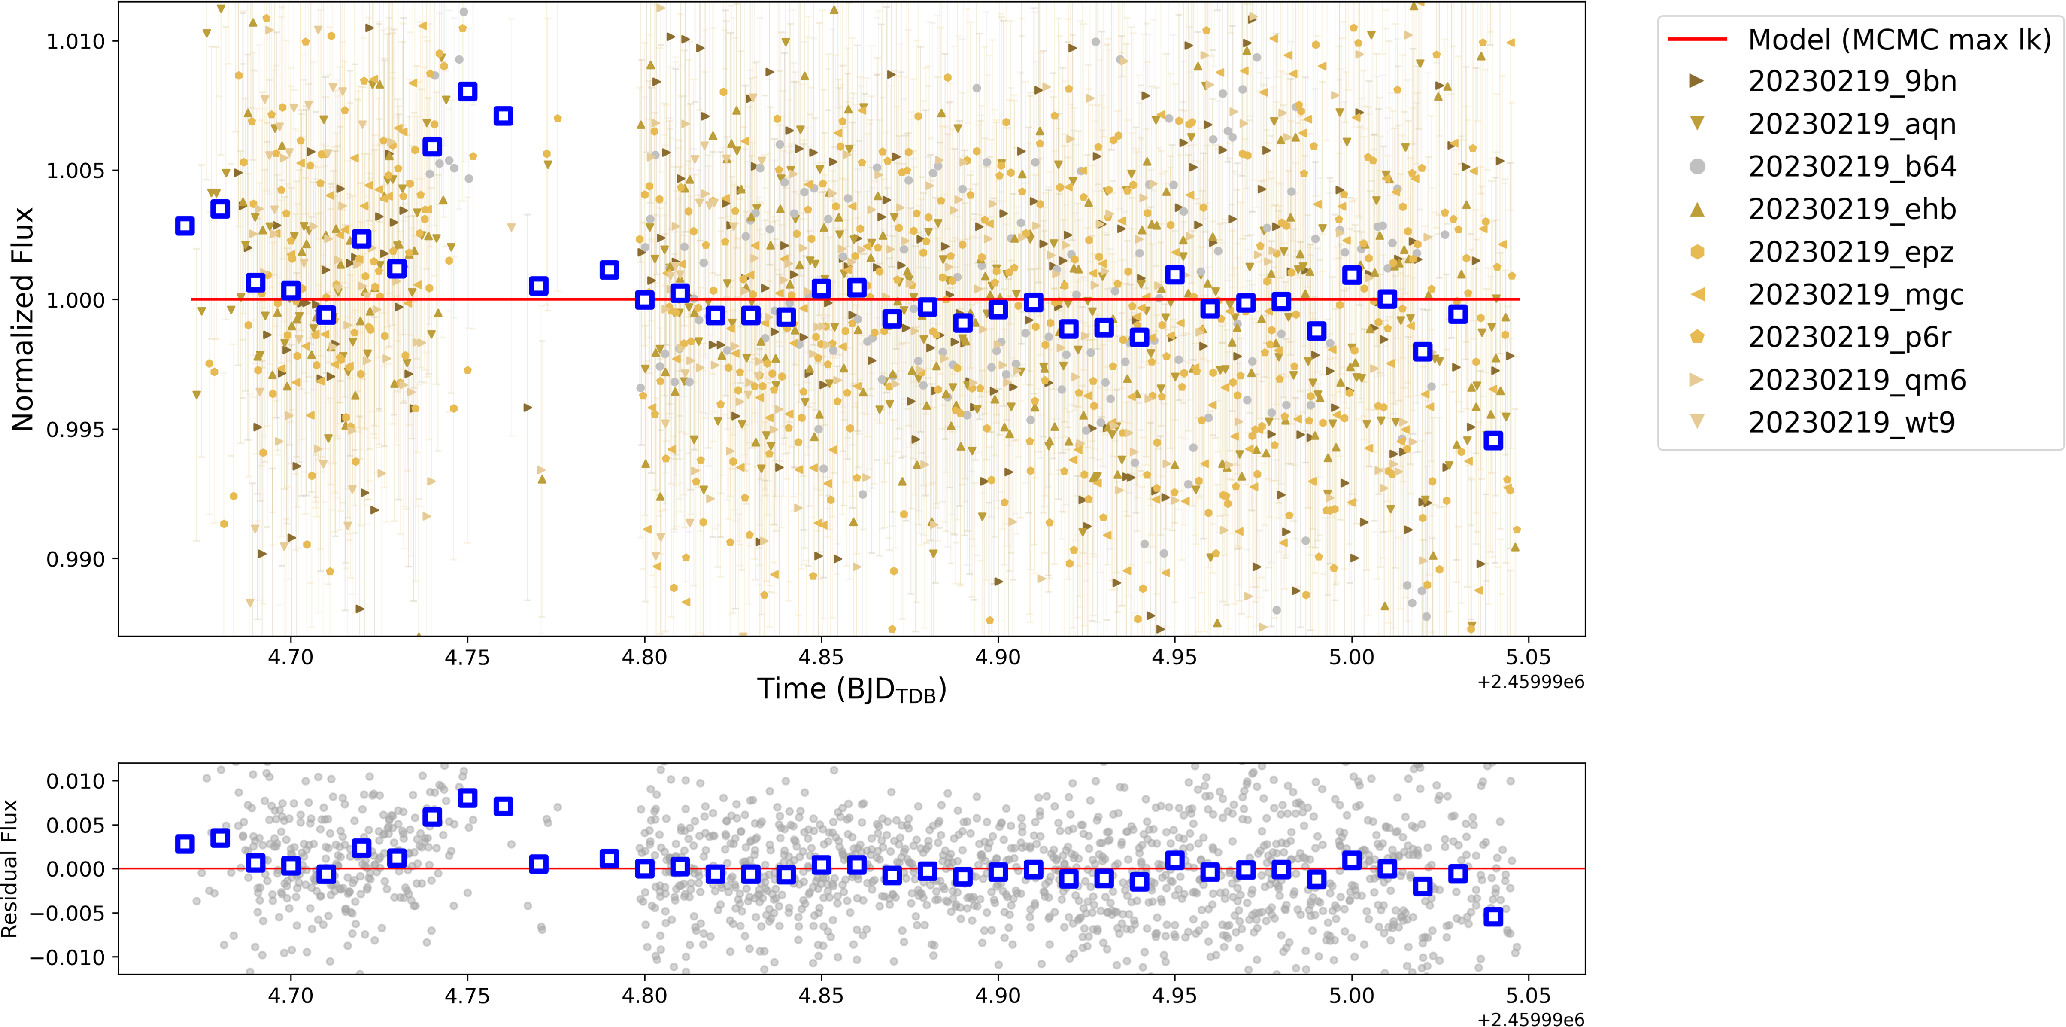
We constructed a best-fit batman model (Kreidberg 2015) from the MCMC's maximum-likelihood parameters, then phase-folded our data and the model to visualize the quality of fit, shown in Figure 4. The results do not indicate a transit was detected with statistical certainty in comparison to a flat model given the phase-folded light-curve data. The level of noise and systematic error, particularly at critical times near predicted ingress and egress, were unfortunately high, primarily due to bursts of poor weather and brief gaps in telescope coverage. Additionally, there is insufficient data spanning across at least two stages of the transit (i.e., baseline plus ingress or egress), which makes a confident declaration of even a partial transit challenging. Thus, we can neither confirm nor rule out detections of either ingress or egress individually. We do note, however, that long flat sections of the light curve with high S/N allowed the MCMC to rule out some of the period parameter space still allowed by the EXOFASTv2 modeling (e.g., phases −0.01 to −0.005 in Figure 4).
Figure 4. Normalized and phase-folded light curve from seven of our Unistellar citizen scientist data sets with the MCMC maximum-likelihood model fit (top) and residuals from the best-fit model (bottom). Unistellar data are labeled with observation date and abbreviated serial number, e.g., "YYYYMMDD_abc," where "abc" represents serial number. The max-likelihood period value was P = 23.627 days. The blue squares represent the weighted means of the individual relative fluxes within each phase bin. On average, each blue square represents about 28.3 data points.
Download figure:
Standard image High-resolution imageWhile we did not detect transits with statistical certainty in our UCSN data, valuable insights for citizen science exoplanet follow-ups were discovered from this analysis, as detailed in Section 4. A deeper discussion on the examination of the UCSN photometry during the five predicted transit windows and analysis of the multimodal posterior space associated with our many independent UCSN data sets can be found in Appendix A.
4. Discussion
4.1. An Unusually High-density Sub-Saturn
TIC 139270665 is a metal-rich  M⊙ and
  R⊙ solar-like G2V star hosting at least one, but likely two, planets. TIC 139270665 b is an exoplanet confirmed from a single TESS transit and subsequent RV detection. We characterize it as a warm sub-Saturn exoplanet with a radius of 0.645RJ
(7.23 R⊕), a mass of 0.463MJ
, an orbital period of 23.624 days, and an equilibrium temperature of 703 K. Additionally, we report its density as 2.13 g cm−3, which is more dense than any of the gas giants in our solar system.
40
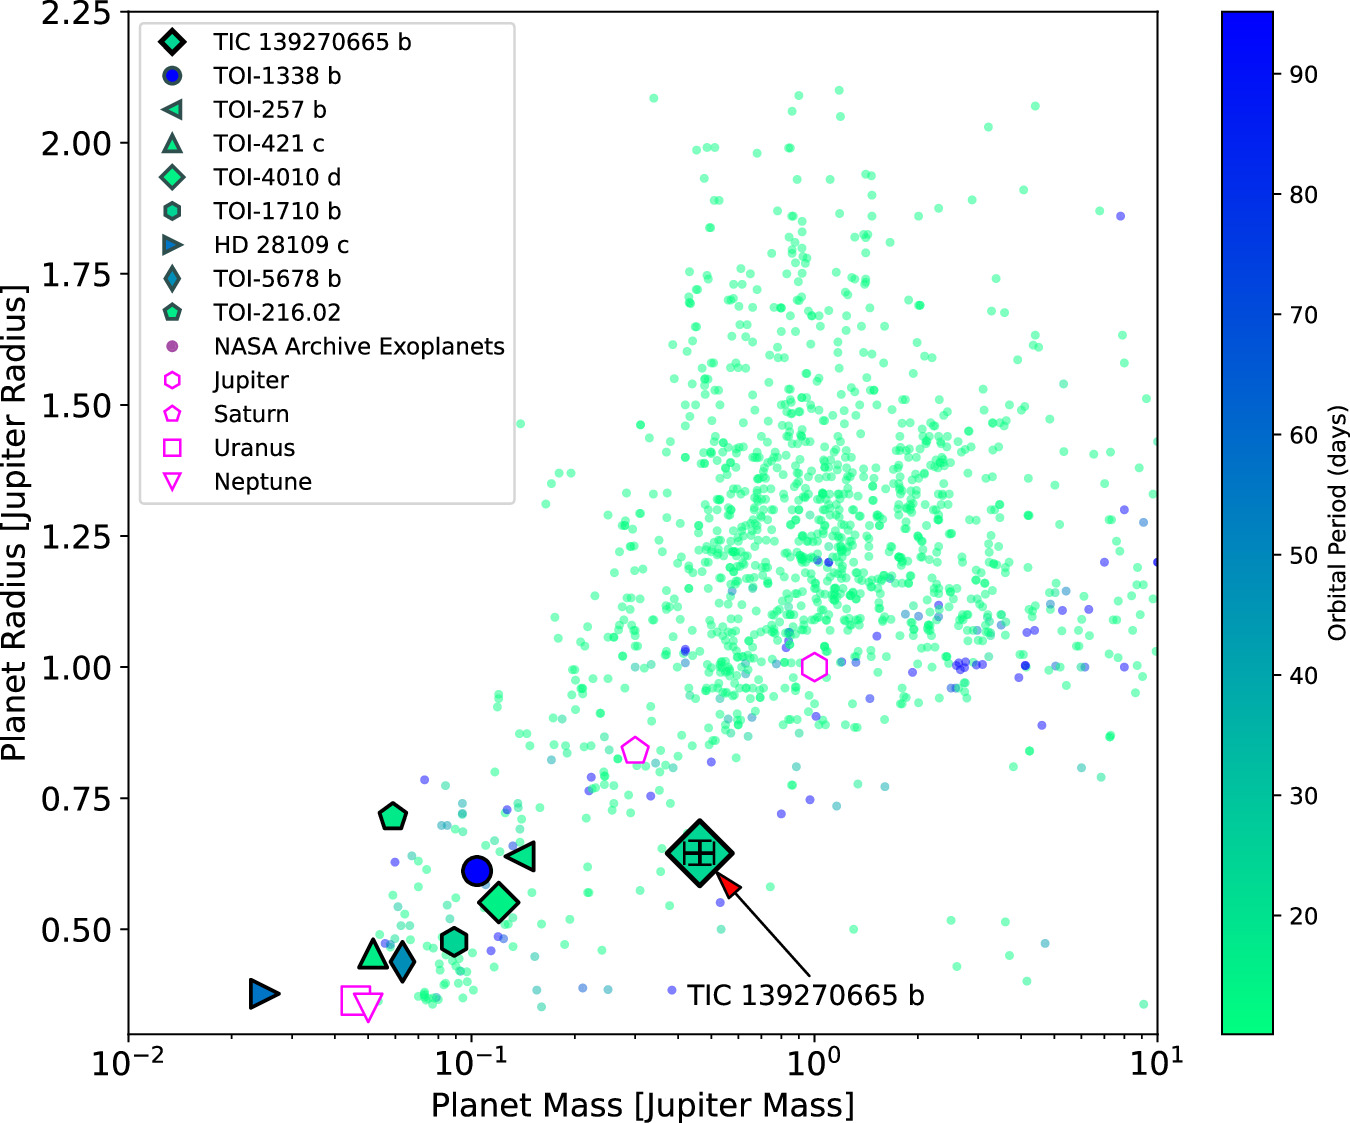
Comparing TIC 139027665 b to other discovered TESS exoplanets in its class shows that it is also the densest TESS sub-Saturn known to date. Among the TESS-confirmed warm sub-Saturns, only eight possess a constrained mass (see footnote 37), and we note their densities are <1 g cm−3 (Addison et al. 2021; Carleo et al. 2020; Kostov et al. 2020; Dawson et al. 2021; Dransfield et al. 2022; König et al. 2022; Kunimoto et al. 2023; Ulmer-Moll et al. 2023). TOI-1710 b is the next most dense after TIC 139270665 b, with a density of 0.940 g cm−3 (König et al. 2022). The average density of all the other eight warm sub-Saturns is 0.681 g cm−3. In Figure 5, we give TIC 139270665 b context by comparing to these and other discovered exoplanets.
Figure 5. Mass vs. radius for confirmed exoplanets including TIC 139270665 b. TOIs noted in the legend represent other dense warm sub-Saturns. Solar system planets (magenta outline) have P ≫ 100 days. This demonstrates TIC 139270665 b's discovery and high density to be a valuable addition to our taxonomy of planets to help us further understand the evolutionary history of such bodies. 1σ error bars for TIC 139270665 b are displayed in black.
Download figure:
Standard image High-resolution imageThe empirical planet mass–radius relationship of Chen & Kipping (2017) shows that radius increases with mass for sub-Jovian worlds and then this relation inverts to become slightly negative for masses above ∼0.41MJ . TIC 139270665 b's mass places it approximately at that inflection point, meaning we would expect its radius to be most likely 1RJ or larger. Instead, we find it to be just 0.645RJ , far into the small-radius tail of the mass–radius relation's distribution. This raises multiple questions about the planet's formation and evolution.
Exploring the reasons for TIC 139270665 b's mass and size dynamics, we note that sub-Saturns can possess similar physical dimensions but diverge significantly in mass. The formation of this planetary type, particularly one like TIC 139270665 b, might lack a runaway gas accretion phase that other Jovians undergo (Petigura et al. 2017a). An alternative explanation suggests they might take shape within a gas-depleted disk, leaving them enhanced in heavy elements (Lee & Chiang 2015; Lee et al. 2018). Contemplating its history, it also is conceivable that TIC 139270665 b may have lost a portion of its atmosphere at some earlier time when it orbited closer to its star. The early intense UV and X-ray fluxes from a youthful star might have led to substantial envelope loss due to photoevaporation (Lopez et al. 2012) that was then followed by an outward migration. It is also worth considering that the outer planet, TIC 139270665 c, introduces an added layer of complexity to this system. Its likely high eccentricity could indicate an intricate dynamical past for this interesting planetary system.
To explore deeper into the density of TIC 139270665 b, future studies might consider employing a combination of planet structure models, as detailed by Thorngren & Fortney (2019), and spectroscopic analyses to determine its heavy-element composition and potential formation history. With TIC 139270665's  measured at a relatively low value of 4.2 ± 1.0 km s−1, it makes the star a good candidate for future RV observations for further characterization and study. Additionally, we recommend future photometry for long-term transit modeling to search for transit timing variations to help to narrow down the nature of planet c and search for other possible nontransiting exoplanets in the system. We also considered the possibility of suggesting the following up of TIC 139270665 b with the JWST for transmission spectroscopy. While it is a candidate for JWST spectroscopic follow up, using the transmission spectroscopy metric (TSM) by Kempton et al. (2018) we find a TSM of 28.3, which makes this a less than ideal candidate. Another consideration could be to attempt direct imaging of reflected-light planets with future coronagraphic instruments on 30 m class or space-based telescopes because of the system's proximity to Earth.
There are some types of planets to which our current observations are not sensitive and may remain undetected in this system. In particular, planets or brown dwarfs on low-inclination orbits close to the star would have very weak RV signals and be undetectable by direct imaging or transits. Also, planets with very long periods (>1000 days) would require a longer RV baseline for detection.
To fully understand the nuances of planets like TIC 139270665 b and c, we need a larger observational sample of such planets. As our field gathers more data, we will likely improve our ability to categorize and refine our formation and evolutionary history models of these interesting exoplanets.
4.2. Unistellar Network Photometry and Education and Outreach Opportunities
Regarding our photometry from the Unistellar Network, we do not have enough data at the most critically important phases of the transit to draw definitive conclusions for declaring a transit or lack of transit with high confidence. It is challenging to constrain a single-transit TESS candidate like TIC 139270665 b, even with updated parameters from the EXOFASTv2 model fit in Table 1. While the RV data reveals the orbital period, it still includes large uncertainties and does not provide the exact timing for a transit follow up. The uncertainties from the only TESS-observed transit in 2022 January, combined with those from the RV data, compound over each orbital period to make predicting subsequent transits less and less precise. By the time UCSN was deployed to capture a potential second transit, around 11 months had passed since the single transit was observed by TESS. During this time, about 14 orbital periods of TIC 139270665 b would have passed, however TESS did not detect any additional transits as it was no longer observing TIC 139270665 after 2022 January. This led to an uncertainty window of roughly 10–11 hr on the expected mid-transit time when UCSN attempted to catch another transit in 2022 December. Furthermore, ground-based follow-up observations are challenged by an average nighttime duration of only 8 hr. This limited window restricts visibility of the planet, and it is crucial within this time frame to capture not only the transit (at least the ingress or egress) but also the essential out-of-transit baseline data. Despite the 271 hr of eVscope data collected, we needed more to confidently capture a second transit for this planet. We also highlight the challenges posed by constraints of citizen science telescopes, like eVscopes, emphasizing the necessity for a comprehensive consideration of these limitations in terms of photometric precision and accuracy when planning observations with this type of equipment.
Even though we were unable to constrain the period and transit timing from our UCSN photometry, there are valuable insights and lessons for campaigns such as this in the future. The multimodal period posterior from the MCMC (e.g., the second family of solutions in Figure 11 in the
Lastly, we provide a proof-of-concept that citizen astronomer campaigns such as ours can offer more than a mere data-collection tool for researchers. Instead, they can be a platform where educators, students, and citizen astronomers can engage in genuine scientific endeavors to bridge the gap between advanced astrophysical research and community engagement and student learning. We name such an initiative "AstroReMixEd," to symbolize this harmonious fusion of astrophysical research, education, and community engagement. Our 16 Chabot Space & Science Center Galaxy Explorer high school students reported high excitement and engagement leading up to and during our overnight observation session of TIC 139270665 b. High school students learned introductory photometry skills and participated in advanced exoplanet observation planning and execution. Students also reported an increased excitement to know that their data, whether we detected a transit or not, would be useful, and that they would be included as co-authors in this publication. Some of these students were galvanized by this experience and are now undertaking new research activities and plans to study and pursue careers in physics or astrophysics in college and beyond. With new telescope technology and innovative education programs and events such as these (e.g., Galaxy Explorer's TIC 139270665 b observation and others detailed in Peluso et al. 2023), students can learn by doing, and we can also simultaneously further modern astrophysical research. AstroReMixEd initiatives could be a win-win scenario for both research and education, and could contribute to the ambitious goal of democratizing science and astronomy for all.
5. Conclusion
The investigation of single-transit events offers researchers a window into worlds beyond those that orbit in the "hot zone" of their stars (e.g., hot Jupiters) and provides insights into the evolution of planetary systems beyond our own. The paradigm of our own solar system, namely gas giants only residing far from their stars beyond the snow line, is now known to be just one type of the many diverse planetary systems in our expanding Universe.
Here we detail and confirm the planetary nature of a new warm and uniquely dense sub-Saturn, TIC 139270665 b, with a 0.645RJ (7.23 R⊕) and a mass of 0.463MJ . Contextualized among other similar exoplanets, TIC 139270665 b emerges as the densest known TESS sub-Saturn, illuminating the dynamism and diversity of exoplanetary systems awaiting discovery. Citizen scientists from the Visual Survey Group discovered the TESS single transit by TIC 139270665 b in 2022 January (Figure 1), and then we initiated RV follow up in 2022 March with APF (Section 2.3). After we confidently ruled out a stellar binary (Figure 2) and our RV data confirmed TIC 139270665 b's existence (Figure 3), we engaged citizen scientists from the Unistellar Network. UCSN was selected due to its growing track record of success in exoplanet follow up and its globally distributed network (see Section 2.4).
TIC 139270665 b orbits a G2 star in approximately 23.6 days and is of a rare class of warm sub-Saturns with a density of 2.13 g cm−3. Our RV data also reveal TIC 139270665 b to have the longer-period outer planet, TIC 139270665 c, with a high eccentricity and a minimum mass, consistent with being another planet. Future work will aim to conduct additional transit follow-ups of TIC 139270665 b with UCSN to firmly detect a second transit. We encourage further work to quantify TIC 139270665 b's bulk heavy elements, as well as more observations and characterization of the outer planetary companion. There is also room for study on the dynamics of this system with its interactions between the eccentric outer planet c and the more circular, lower-mass inner planet b. Future work should aim to further investigate TIC 139270665's system dynamics and planetary compositional intricacies.
Furthermore, UCSN offered the potential to underscore a dual objective with our photometry campaign: merging hands-on educational experiences with the rigor of actual scientific investigation. In this symbiotic approach, students do not simply learn by doing: they actively contribute to and shape the frontier of modern astrophysics, thereby proving that educational empowerment and cutting-edge research can be harmoniously interwoven (i.e., AstroReMixEd). Although UCSN was unable to tightly constrain TIC 139270665 b's period via a second transit detection, valuable lessons were learned about ground-based citizen astronomer campaigns, a proof-of-concept for combining education and astronomical research was realized, and possible transit times were negated when high-S/N flat segments of the Unistellar light curves ruled out an ingress or egress.
As the technical capabilities of our astronomical community expand, so too does the scope of our data-collection methods and results. For instance, the soon to be operational Vera C. Rubin Observatory is set to launch an ambitious time-domain survey. The anticipated data sets from Rubin Observatory will be immense, with its Legacy Survey of Space and Time alone projecting over 35 billion entries that will necessitate collaboration with citizen scientists to follow up on transient events (Higgs 2023). The growing prominence of citizen scientist endeavors underscores their invaluable role in shaping the future of scientific research. Additionally, citizen science may also help to revolutionize the field of education with more initiatives such as AstroReMixEd, where both the research community, students, and public can contribute directly to the rewarding field of astronomy and astrophysics.
Acknowledgments
The scientific data highlighted in this paper was partially sourced from the Unistellar Network, a collaborative effort between Unistellar and the SETI Institute. We extend our gratitude to Frédéric Gastaldo for financially supporting the foundational phase of the Unistellar Citizen Science project. The observations from Unistellar for TIC 139270665 b were also part of the NASA citizen science Unistellar Network Investigating TESS Exoplanets (UNITE) program. We express our heartfelt appreciation to the citizen astronomers who shared their invaluable data for these observations. The overnight observation of TIC 139270665 by the Galaxy Explorer high school students, hosted at the Chabot Space & Science Center, was made possible thanks to the unwavering support of their dedicated staff. We extend our deepest gratitude to Jenna Lowe, Daniel Stanton, and the entire Chabot team for their invaluable contribution and support. We would also like to thank all the Galaxy Explorer high school students for their hard work, motivation, and excitement around planning and participating in the observation event.
This study benefited from the kind contribution of the Gordon and Betty Moore Foundation. D.P., P.D., and T.E.'s efforts were in part funded by the NASA Citizen Science Seed Funding Program with grant No. 80NSSC22K1130. P.D.'s work also has been supported by the National Science Foundation Astronomy and Astrophysics Postdoctoral Fellowship under award AST-1903811 and the 51 Pegasi b Postdoctoral Fellowship, courtesy of the Heising-Simons Foundation. D.D. acknowledges support from the NASA Exoplanet Research Program grant No. 18-2XRP182—0136.
We have utilized resources from the NASA Exoplanet Archive, a service managed by the California Institute of Technology, in collaboration with the National Aeronautics and Space Administration as part of the Exoplanet Exploration Program. Observations in the paper made use of the NN-EXPLORE Exoplanet and Stellar Speckle Imager (NESSI). NESSI was funded by the NASA Exoplanet Exploration Program and the NASA Ames Research Center. NESSI was built at the Ames Research Center by Steve B. Howell, Nic Scott, Elliott P. Horch, and Emmett Quigley. We also express our gratitude to Ken and Gloria Levy for their generous support in the creation of the Levy Spectrometer on the APF. Our appreciation extends to the University of California and Google for their backing of Lick Observatory, and to the UCO staff for their dedication in both scheduling and managing the Lick Observatory telescopes. Portions of the data discussed in this paper were sourced from the W. M. Keck Observatory, a joint venture between the California Institute of Technology, the University of California, and NASA. The authors acknowledge and respect the significant cultural value and importance that the summit of Maunakea holds within the indigenous Hawaiian community. We express our profound gratitude for the privilege of conducting observations from this sacred site.
This research incorporates data gathered by the TESS mission, a project generously funded by NASA's Science Mission Directorate. We recognize and value the public TESS data derived from pipelines at both the TESS Science Office and the TESS Science Processing Operations Center. We also acknowledge data from TESS that was sourced from the MAST data archive at the Space Telescope Science Institute (STScI). The STScI operates under the care of the Association of Universities for Research in Astronomy, Inc., in accordance with NASA contract NAS 5-26555.
To educators globally, we extend our profound appreciation. Your contributions are pivotal. The world looks to you to continue kindling inspiration and guiding future generations.
Facilities: TESS - , Automated Planet Finder (Levy), Keck:I (HIRES), Unistellar Enhanced Vision Telescopes (eVscopes, citizen science network).
Data: All the TESS data used in this paper can be found in MAST:10.17909/t9-nmc8-f686. All the NASA Exoplanet Archive data can be found on the NASA Exoplanet Archive:10.26133/NEA1
Software: SpecMatch (Petigura et al. 2017b), lightkurve (Lightkurve Collaboration et al. 2018), EXOFASTv2 (Eastman et al. 2013, 2019), emcee (Foreman-Mackey et al. 2013), batman (Kreidberg 2015).
Appendix A: UCSN Photometry: Transit Window and MCMC Posterior Analysis
A.1. Observed Transit Windows
For our five UCSN transit window campaigns and multimodal posterior analysis, we provide extended details here.
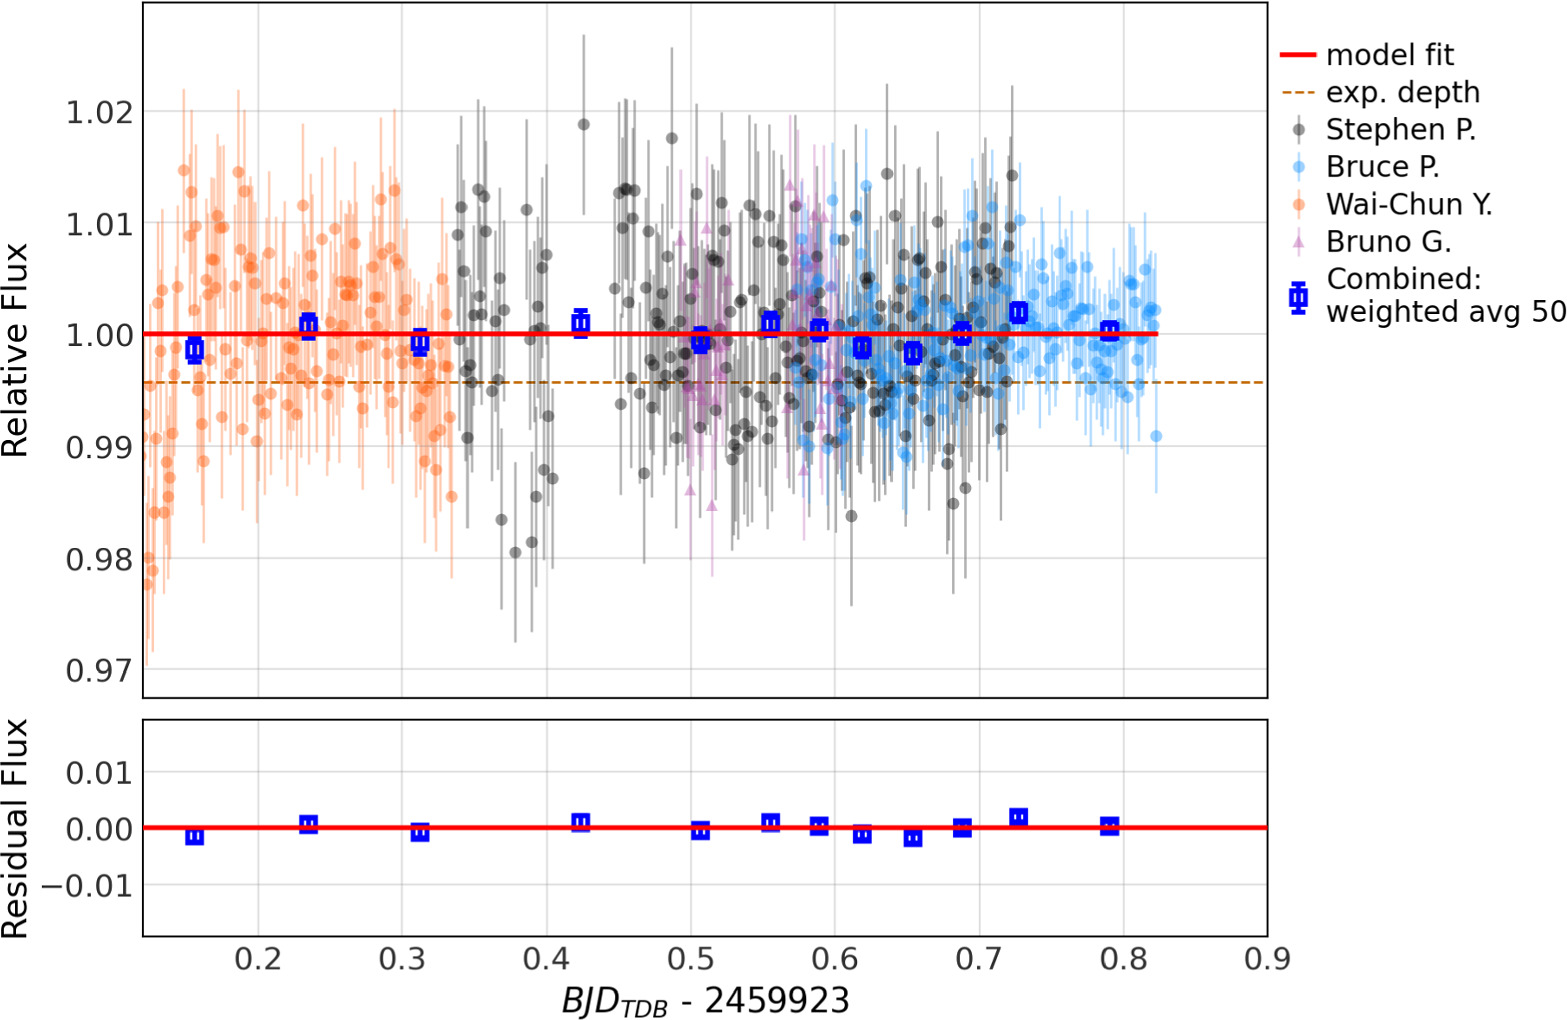
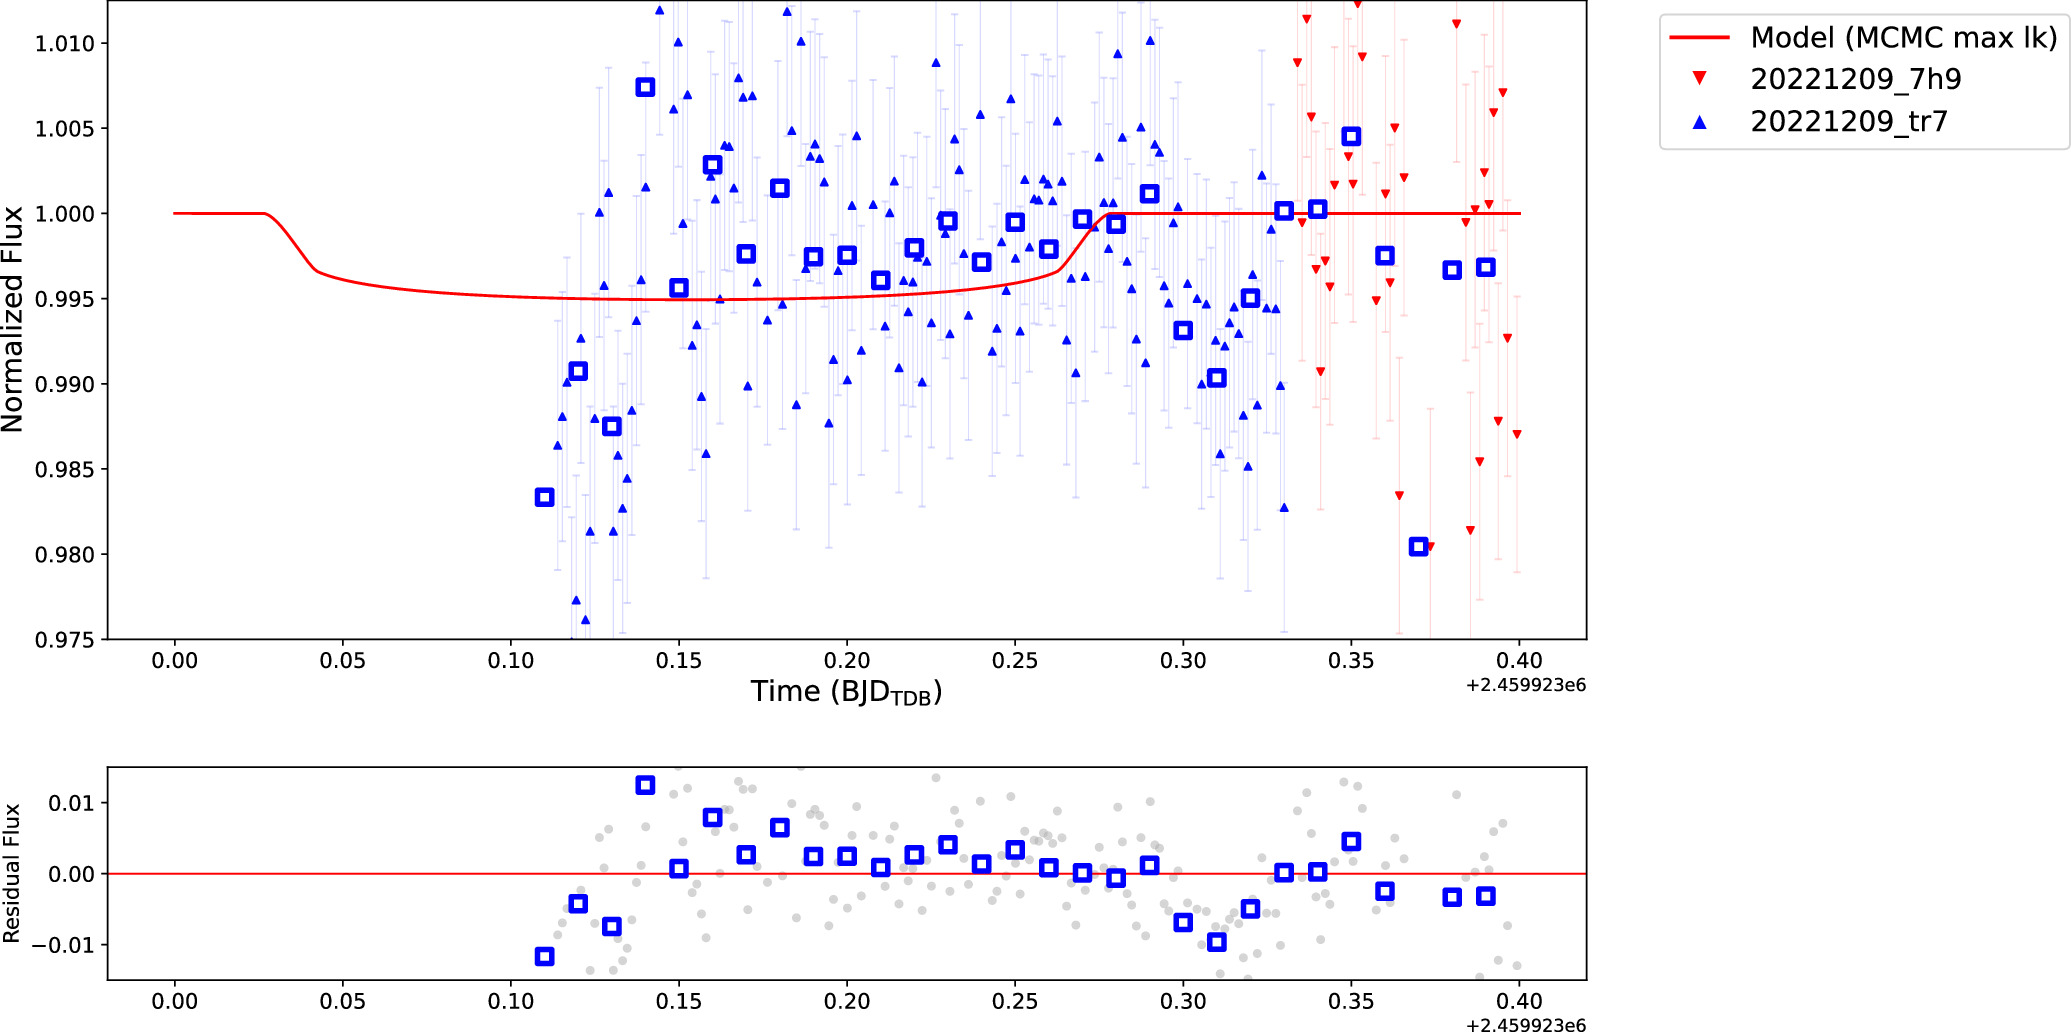
In our 2022 December UCSN campaign, we examined 11 data sets across four nights of observations. None of these data sets showed significant evidence of an ingress or egress, either individually or in the combined light curve. Figure 6 shows a flat subsection of the light curve from the 2022 December campaign. The data quality is representative of the larger light curve, with a standard deviation of 0.11% in the binned fluxes from our 2 minutes integration images. Short-term systematic trends in individual data sets like the one seen in the first ∼20 flux measurements, particularly those at the start or end of an observation when airmass was high, were considered unlikely to be true ingress or egress signals.
Figure 6. Example subsection of the December light curve from 2022 December 9, which we reported back to UCSN observers. This represents data from four citizen astronomer observers from one of four days during the 2022 December campaign. Colored points are fluxes measured from images totaling 2 minutes of integration each. Blue squares are weighted averages of 50 individual flux points. The dashed line is the predicted depth of TIC 139270665 b's transit. This light curve was chosen to present here as it had the most observers and data for the 4 day December campaign. We note the photometric stability and precision, which allows sensitivity to <1% transit depths and improved where we had overlapping data sets from multiple telescopes. The other individual December light curves were similarly flat, with no transit detection, or there was not enough coverage or data to make substantial conclusions.
Download figure:
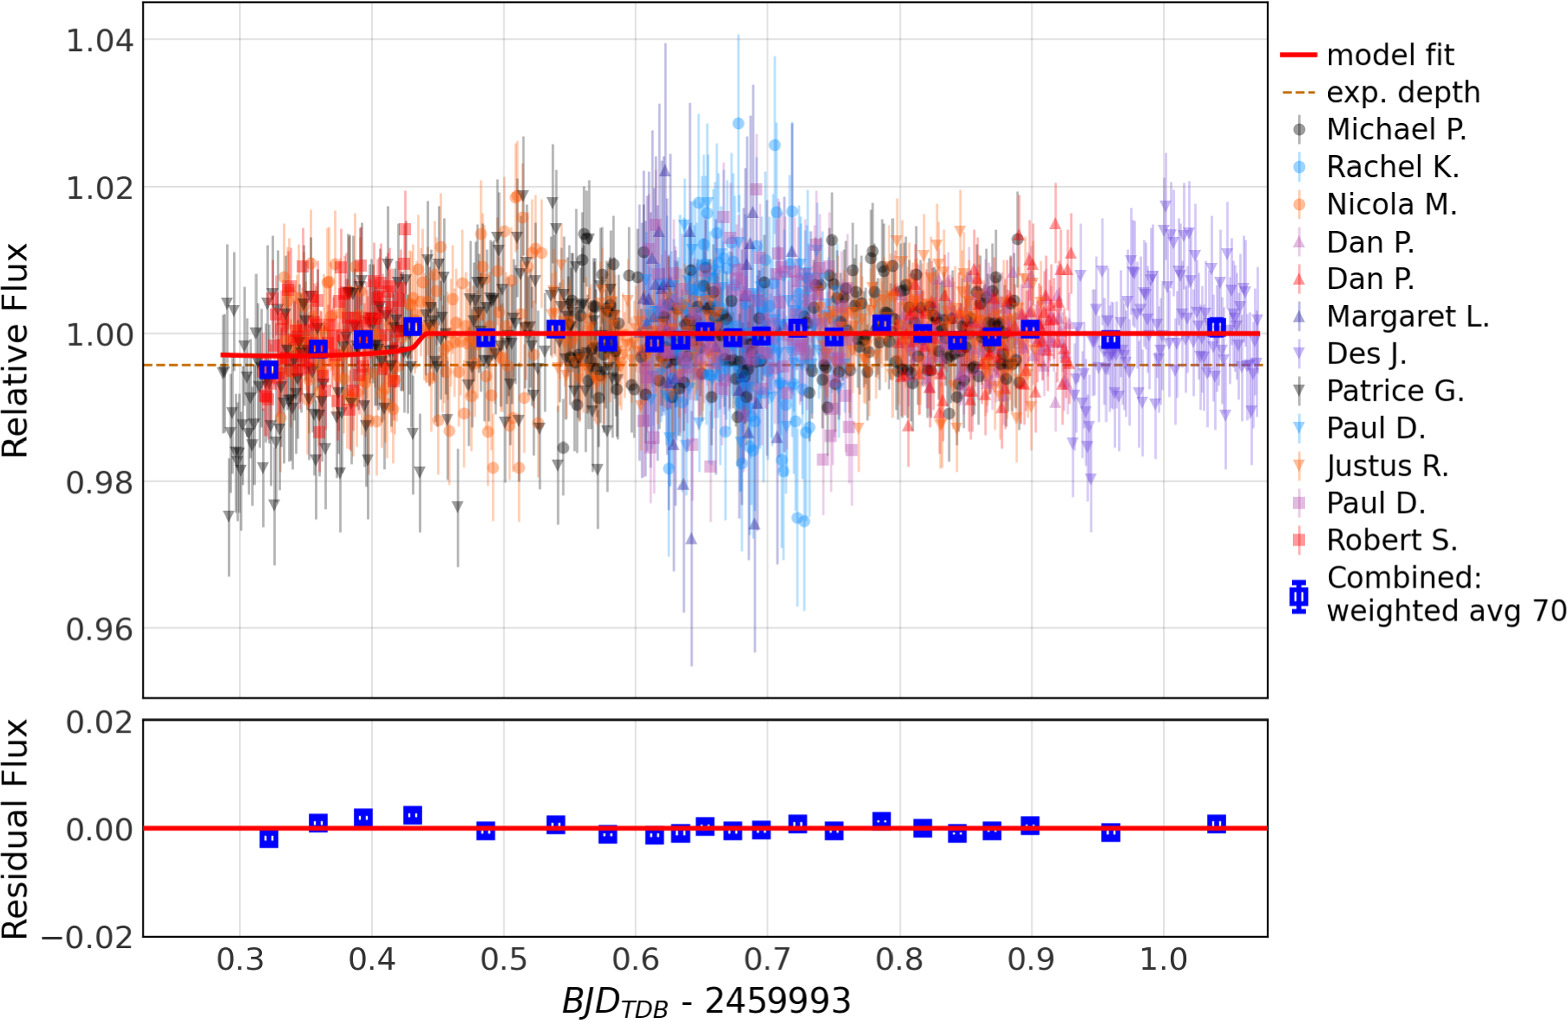
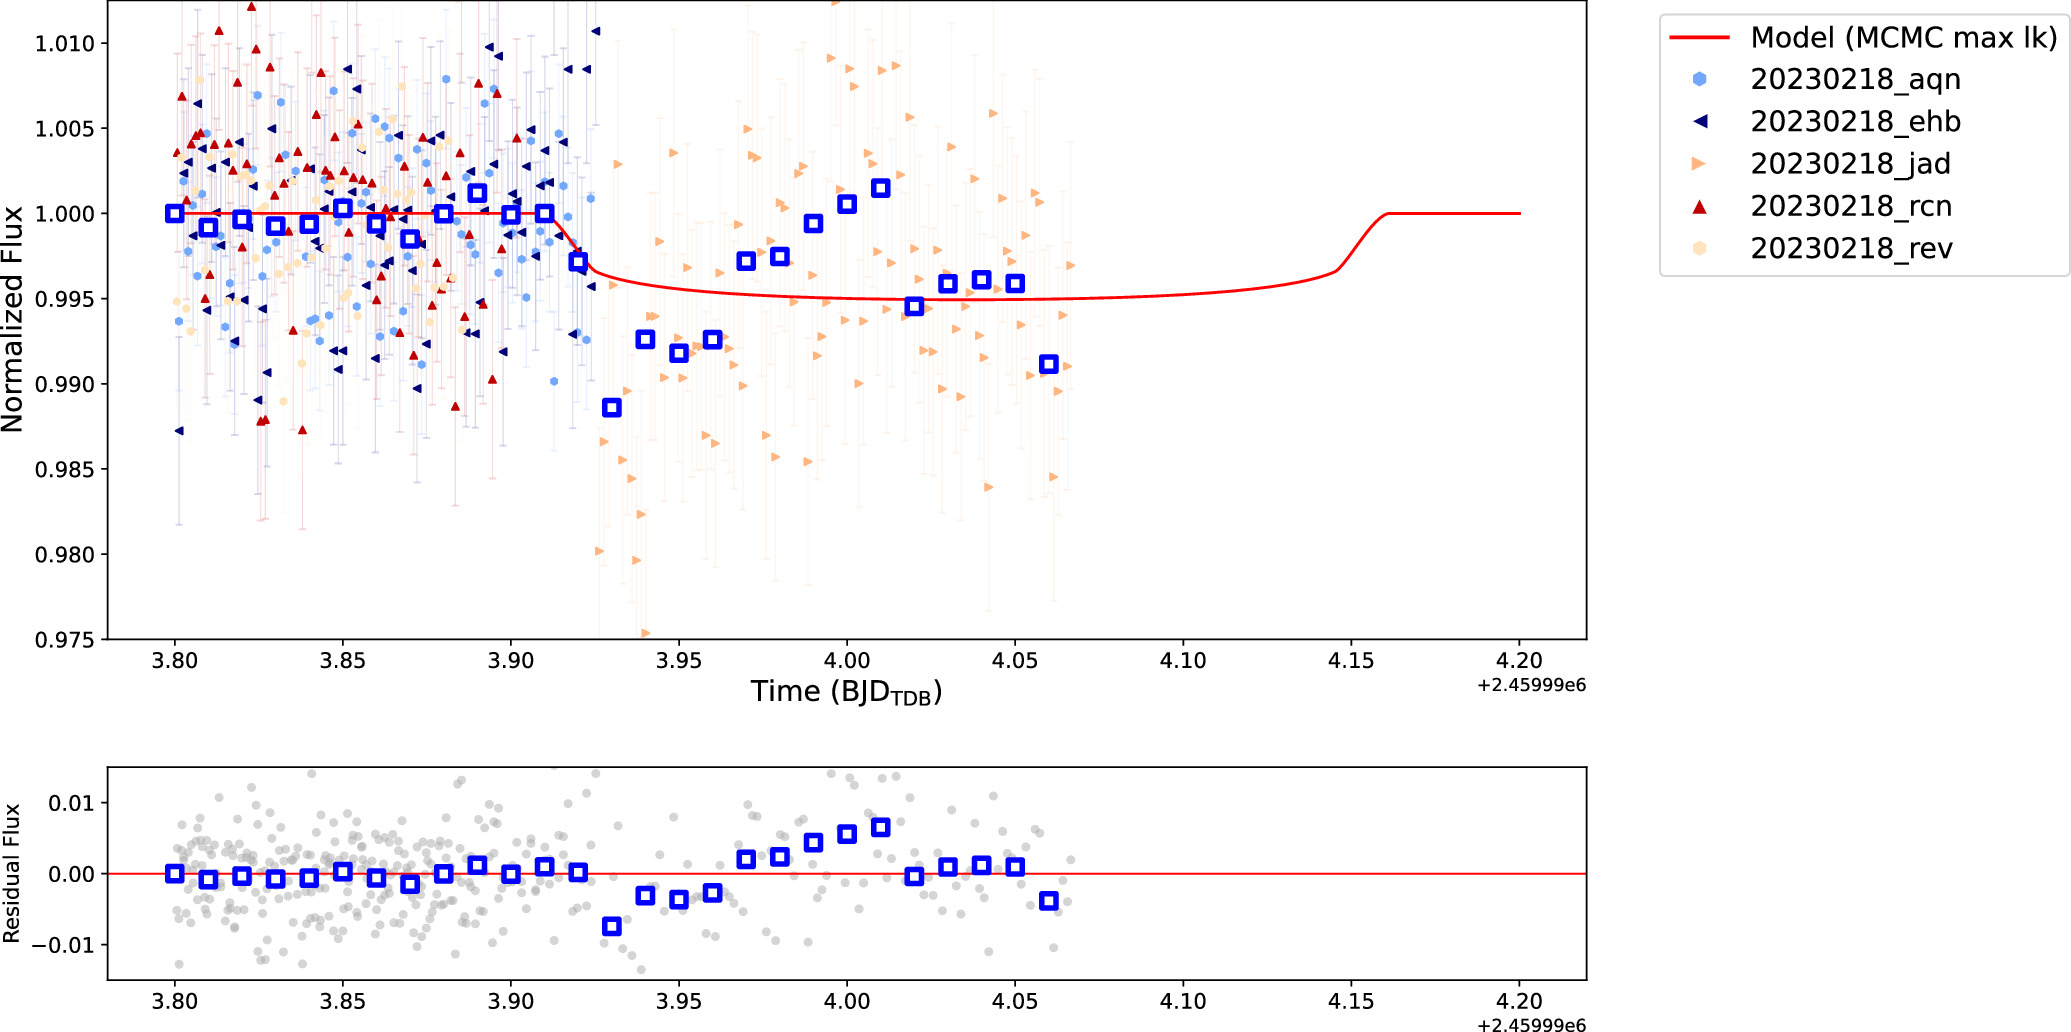
Standard image High-resolution imageThe 2023 February campaign gave us data across three nights of the predicted transit window (Figure 7). Most of the data remained flat, presenting no ingress or egress. However, a potential egress signal was noted on 2023 February 17 with an end at UTC 22:27:58 (2459993.44173 BJDTDB), but because it occurred at the start of an observation where airmass was greatest and systematic errors are most difficult to rule out, we could not conclude a detection with high confidence.
Figure 7. Transit light curve for the second night of our February campaign on 2023 February 17 shared with UCSN. The red line is the fitted transit model to the data. A model was fitted to this data because the moving average dropped below the expected transit depth threshold. This represents close to 19 hr of continuous data. The 1 hr integrations show an achieved precision better than 0.1%, and the standard deviation of the fluxes from 2 minutes integrations is only 0.67%. Our light-curve model-fitting routine identified an egress at the beginning of the sequence, which we subsequently rejected as unreliable. The original prediction times are based on our best estimate of the orbital period at the time of observation.
Download figure:
Standard image High-resolution imageThe 2023 March campaign mainly targeted North American citizen astronomers, but poor weather across the region limited data collection. Some data were captured slightly before our predicted transit, but it was statistically flat. Non-North American observers who attempted to observe for this campaign had statistically flat data as well.
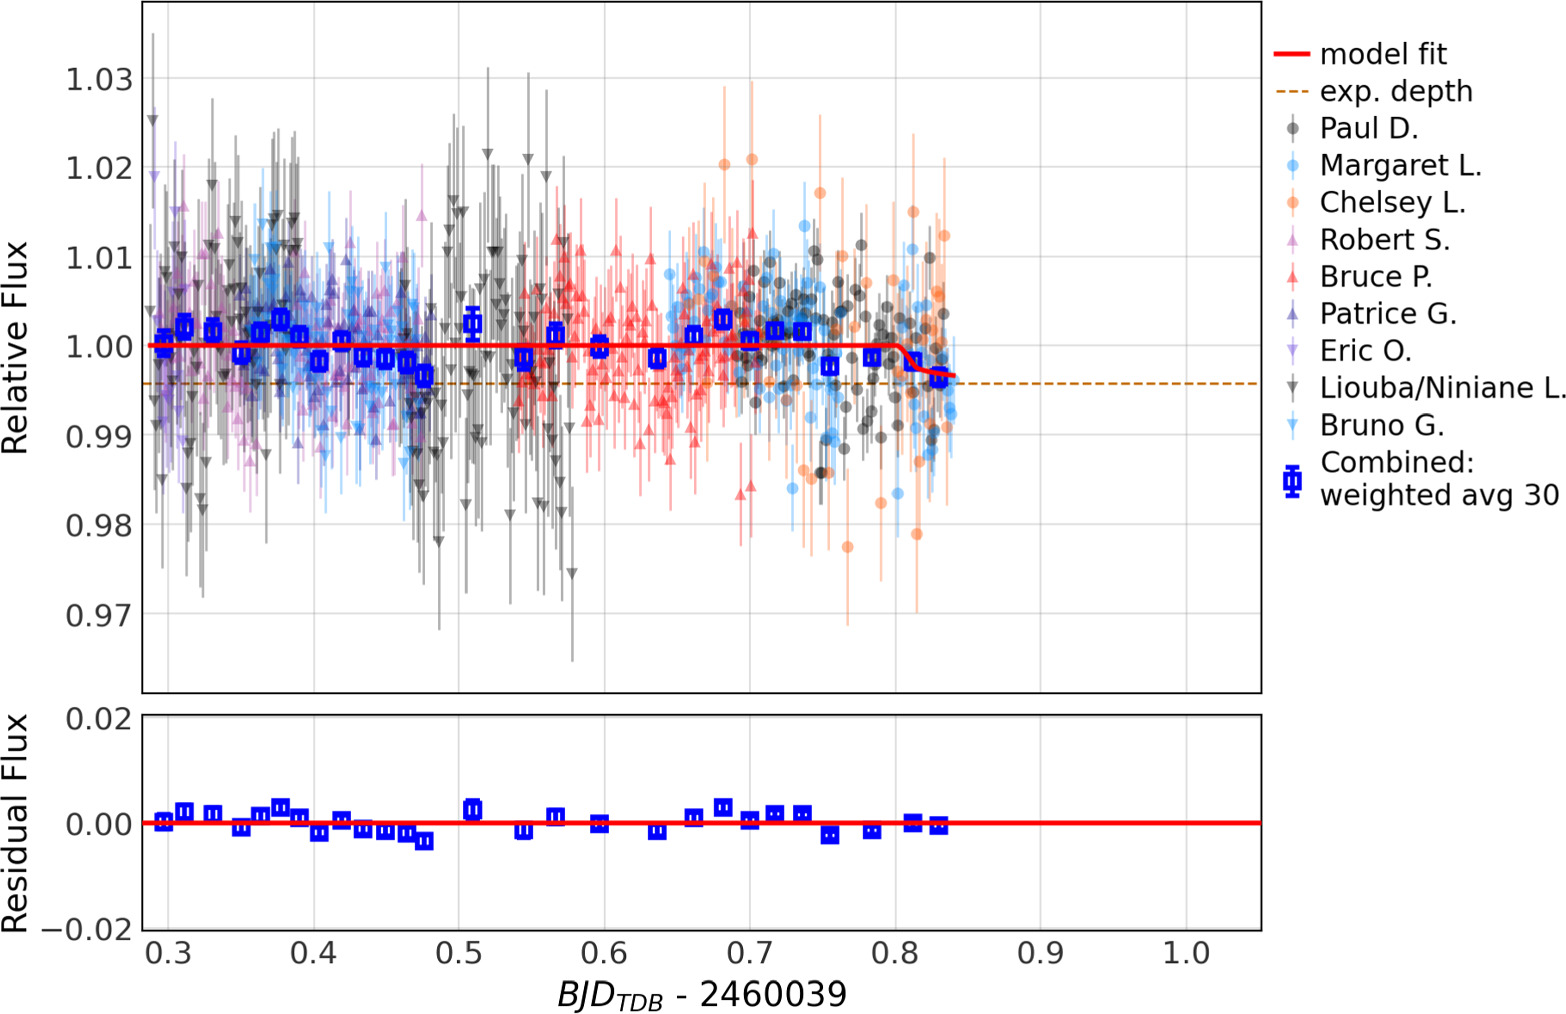
In 2023 April, we had two predicted transit windows for our Unistellar citizen astronomers to observe. Data from 2023 April 5 hinted at a potential ingress with a transit centered at 10:08:10 UTC (2460039.92449 BJDTDB) (see Figure 8). Our subsequent end-of-April campaign aimed at confirming this tentative signal was hindered by limited data collection due to poor weather and the star being only 15° away from a Moon that was over 50% illuminated.
Figure 8. Transit light curve for 2023 April 5 from our April campaign, shared with UCSN. The red line the fitted transit model to the data. A model was fitted to this data because the moving average dropped below the expected transit depth threshold. Although an ingress-like feature is seen here, we do not declare transit detection as we were unable to confirm this with a follow-up detection later in the month.
Download figure:
Standard image High-resolution imageThe maximum-likelihood period of 26.627 days identified by our MCMC analysis meant that TIC 139270665 b transits should have intersected our UCSN observing windows in 2022 December and 2023 February. Our observations in the other windows would not have intersected transits. The (retroactively) predicted transit models centered on UTC 2022 December 9 and 2023 February 18 are shown compared to the UCSN data in Figures 9 and 10. As before, the data are generally insufficiently dense and precise to confidently confirm or definitely reject the presence of a transit. That said, the first 0.13 days of the February light curve are high S/N, flat during the expected pre-transit phase, and show a ∼0.4% drop in flux during the predicted ingress based on 15 overlapping measurements from two telescopes. The significance of this drop is limited, however, because those high-S/N data stop at the end of ingress, so we cannot tell if the flux remained low during the expected in-transit time. The measurements after that point come from a single data set that shows stronger than normal systematic errors, making interpretation difficult.
Figure 9. Maximum-likelihood model from the MCMC plotted over the UCSN light curve on UTC 2022 December 9. The UCSN data in the light exhibit relatively large scatter compared to the expected transit depth, likely due to a combination of variable atmospheric conditions, systematic instrumental noise, and the inherent complexities of ground-based observations. Thus, drawing definitive conclusions from these data is challenging. The blue squares in the plot represent the weighted averages of fluxes and residuals, respectively, within each time bin of 0.01 days. On average, each blue square is derived from approximately six individual data points.
Download figure:
Standard image High-resolution imageFigure 10. Maximum-likelihood model from the MCMC plotted over the UCSN light curve on UTC 2023 February 18. Due to data gaps at critical transit stages, transit detection remains uncertain, though there is a possible ingress signal. The blue squares in the plot represent the weighted averages of fluxes and residuals, respectively, within each time bin of 0.01 days. On average, each blue square is derived from approximately 14.6 individual data points.
Download figure:
Standard image High-resolution imageA.2. MCMC Posterior Analysis and Multimodality
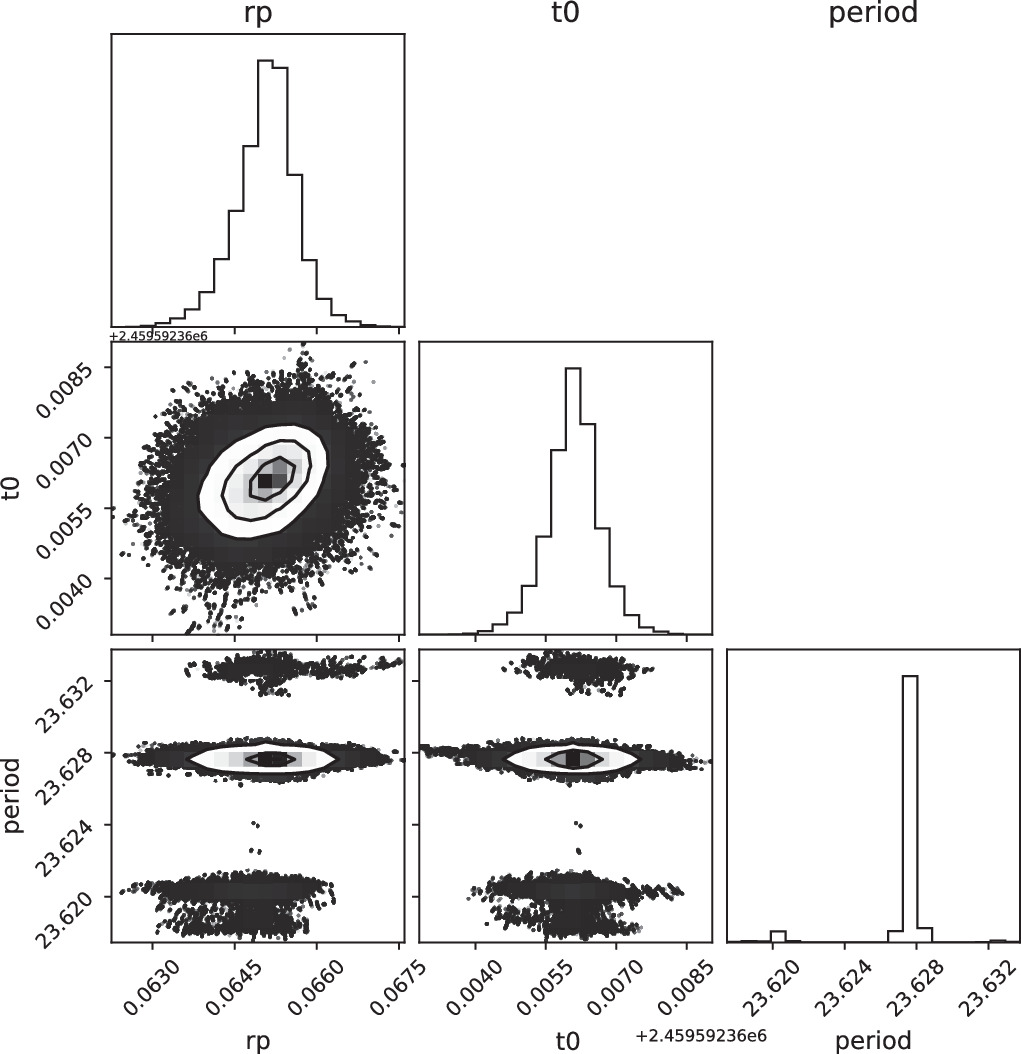
Our marginalized posterior distrubtions from the MCMC are provided here in Figure 13. For our MCMC used to identify transit signals in our UCSN light curve, we initialized it with 1040 walkers, a "burn-in" phase of 3250 iterations per walker that was then discarded, and finally 10,000 iterations per walker from which we drew the posterior distribution. Different exploration strategies were incorporated using various walker "moves" from the emcee package, settling on a fraction per move type of emcee.moves.DEMove(0.05), emcee.moves.DESnookerMove(0.2), and emcee.moves.KDEMove(0.75). The complex parameter space meant that walkers were often getting stuck in islands of local high probability but not reaching the global probability maximum, and we found that different move types were better at avoiding those local islands. Experimenting with the move sets, we found that including a fraction of the snooker and the majority of KDEMove was most successful.
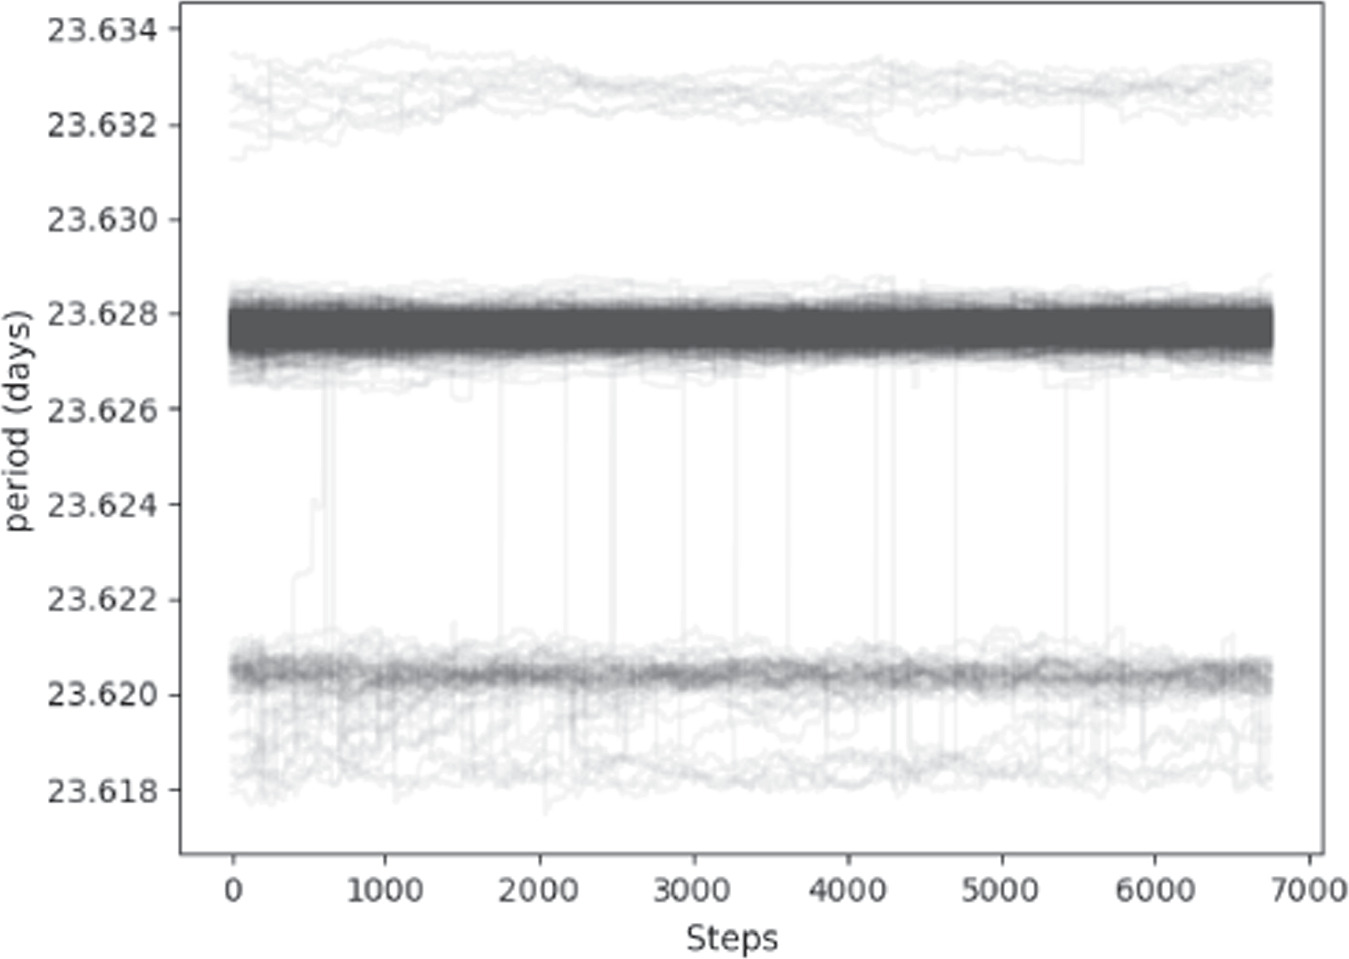
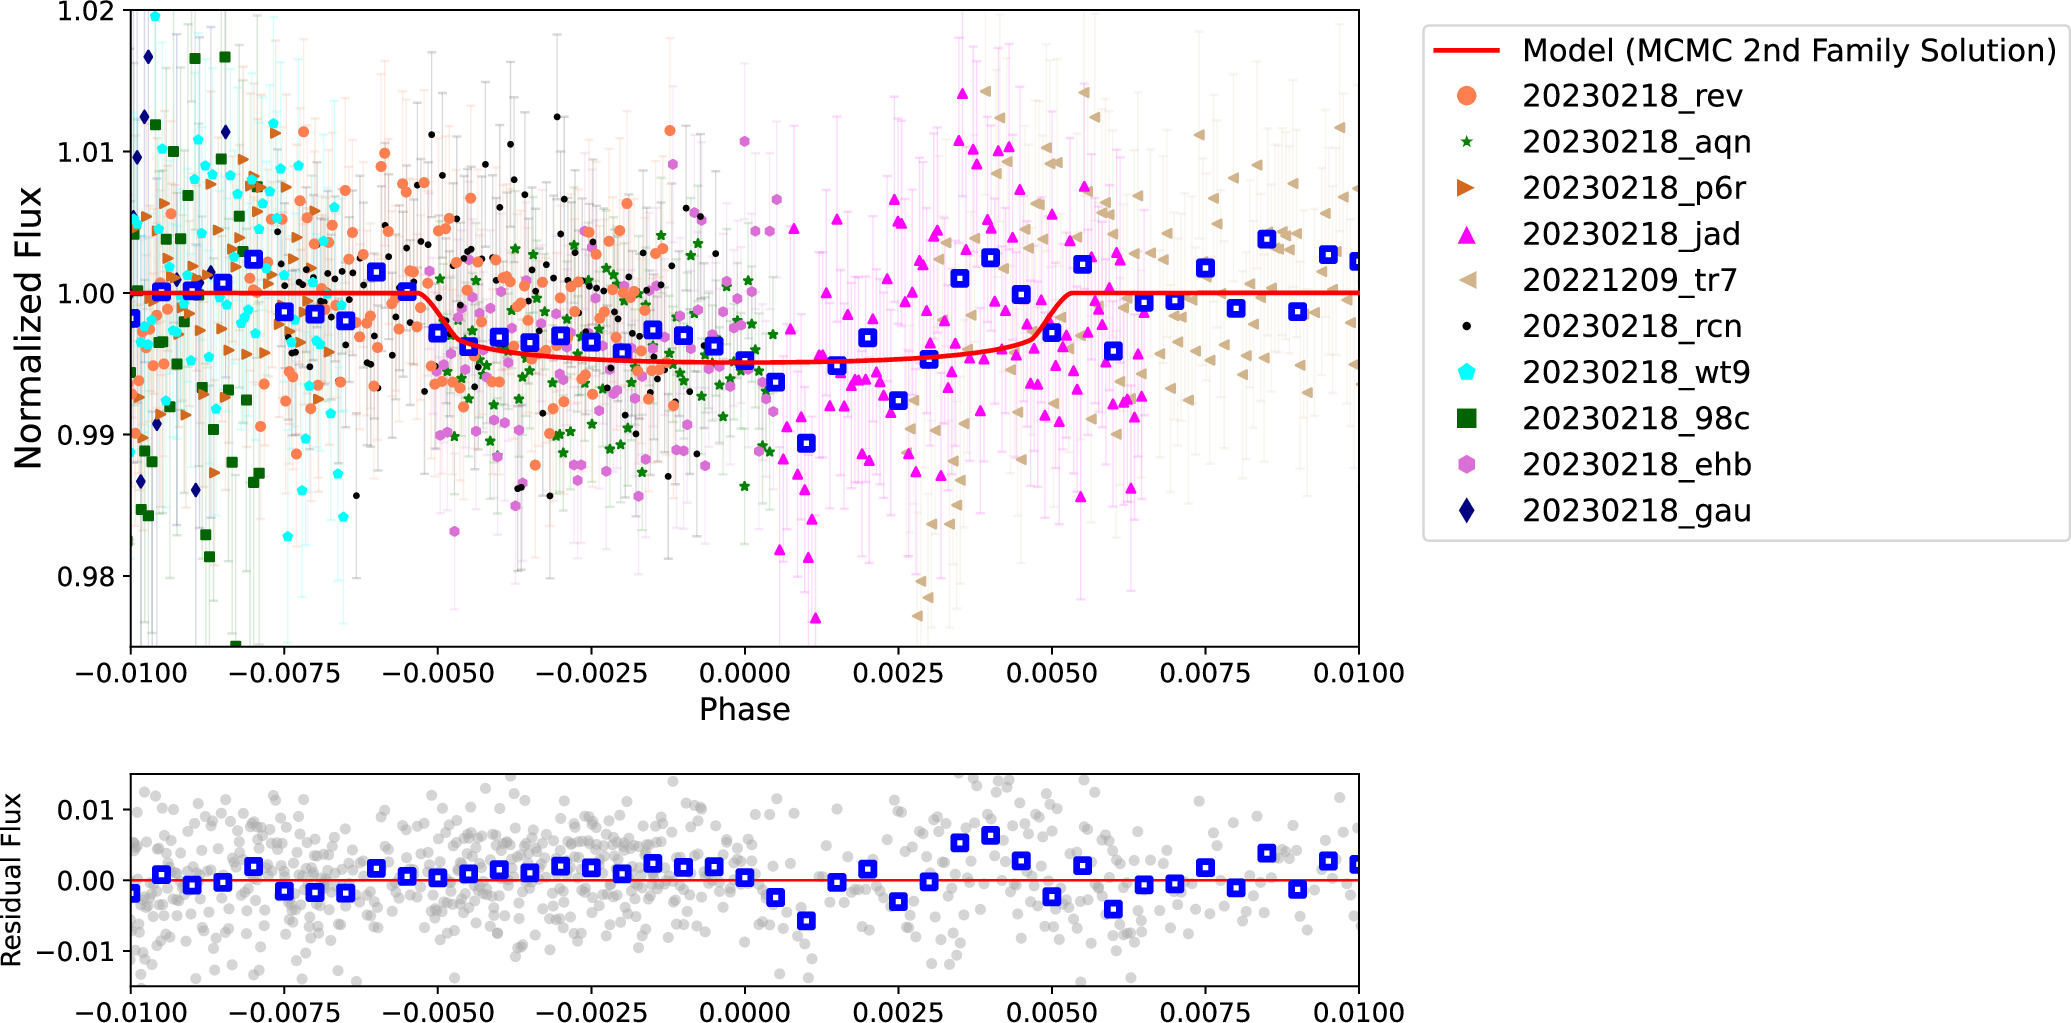
During our MCMC analysis, we observed a walker divergence in the period parameter trace plot (Figure 11). This led us to investigate a second set of solutions with a period of P = 23.620 days, which was where the second largest cluster of walkers was centered. This model is statistically less preferred when compared to the maximum-likelihood period of P = 23.627 days (i.e., it produced a larger χ2); however, it is still possible given our data, so we provide the phase-folded light curve corresponding to this second family of solutions in Figure 12.
Figure 11. MCMC walker trace plot for the period (in days) after trimming the initial 3250 steps (iterations) as burn-in. The bottom group of walkers, clustered between P = 23.620 days and P = 23.621 days, was investigated as a possible second set of solutions.
Download figure:
Standard image High-resolution imageFigure 12. Top: normalized and phase-folded light curve using 10 data sets from our Unistellar citizen scientists that encompassed the transit window defined by the MCMC's secondary (i.e., less preferred) set of solutions from Figure 11. This secondary solution corresponds to a period of P = 23.620 days. Bottom: residuals from this secondary model. Unistellar data are labeled by observation date followed by an abbreviated serial number in the format "YYYYMMDD_abc," where "abc" denotes the serial number. The blue squares represent the weighted means of the individual relative fluxes within each phase bin. On average, each blue square represents about 20.5 data points.
Download figure:
Standard image High-resolution imageFigure 13. Marginalized posterior distributions from the MCMC that searched for a transit signal in the Unistellar eVscope light-curve data. Only the planet's period, radius (rp), and date of mid-transit (t0) are shown (offsets are excluded). The period distribution is multimodal, with one period range strongly preferred. Despite the seemingly well-constrained parameters, a Bayesian information criterion test showed that these transit models did not provide significantly better fits to the data than a flat model.
Download figure:
Standard image High-resolution imageAfter our initial MCMC, we recognized that, while the offset parameter converged on a single value for most data sets, it ended up bimodal for four data sets. This suggested a possible additional, lower-probability solution dependent on how these data sets were normalized compared to the others. There was an observed divergence in the trace plots from the chain for the offsets. After investigating the divergence through specified offset ranges for different data sets, we were unable to discover any convincing transit detections.
Appendix B: Additional Tables and Data
Figure 14 highlights flat segments of data taken from our high school student citizen scientists that may allow us to rule out an ingress or egress at certain times. Additionally, here we provide the 59 measured RVs from APF in Table 3, and the observation details from our Unistellar citizen scientist observers in Table 4.
Figure 14. Maximum-likelihood model from the MCMC plotted over only the Chabot Space & Science Center's Galaxy Explorer High School students' Unistellar data sets, on UTC 2023 February 19. Initial variability likely stems from partly cloudy weather, which transitioned to clearer skies after a data gap of ∼1.2 hr. The subsequent flat light curve, a result of combined observations from nine eVscopes, has a high S/N and indicates the absence of any ingress or egress by TIC 139270665 b. The increased variability at the very end of the light curve can be attributed to the target's high airmass at the end of the observation. The blue squares in the plot represent the weighted averages of fluxes and residuals, respectively, within each time bin of 0.01 days. On average, each blue square is derived from approximately 43.6 individual data points.
Download figure:
Standard image High-resolution imageTable 3. RV Measurements of TIC 139270665 from APF-Levy
| BJDTDB | RV (m s−1) |
|---|---|
| 2459638.798167 | −138.7 ± 7.8 |
| 2459640.803143 | −133.0 ± 8.5 |
| 2459647.901770 | −169.2 ± 7.7 |
| 2459650.882322 | −156.7 ± 7.8 |
| 2459656.756404 | −100.9 ± 7.7 |
| 2459662.739474 | −109.9 ± 7.6 |
| 2459698.689303 | −118.7 ± 9.7 |
| 2459703.685927 | −100.9 ± 9.1 |
| 2459716.681231 | −139.8 ± 10.3 |
| 2459720.678592 | −159.7 ± 10.8 |
| 2459723.683151 | −149.6 ± 11.8 |
| 2459729.685929 | −113.9 ± 11.2 |
| 2459822.019650 | 73.8 ± 7.9 |
| 2459825.000669 | 61.4 ± 9.2 |
| 2459827.004468 | 47.7 ± 8.4 |
| 2459831.998564 | 15.2 ± 10.2 |
| 2459850.945055 | 96.3 ± 7.7 |
| 2459852.962331 | 72.1 ± 7.8 |
| 2459858.918770 | 44.2 ± 7.9 |
| 2459863.925319 | 84.0 ± 8.3 |
| 2459868.940071 | 123.2 ± 7.7 |
| 2459873.947061 | 119.0 ± 6.9 |
| 2459900.805350 | 69.0 ± 9.2 |
| 2459903.880661 | 31.6 ± 7.0 |
| 2459906.895891 | 58.6 ± 8.3 |
| 2459910.791877 | 66.8 ± 10.1 |
| 2459913.843048 | 109.3 ± 6.9 |
| 2459929.872693 | 13.0 ± 5.6 |
| 2459931.883288 | 35.8 ± 5.9 |
| 2459964.900397 | 55.4 ± 10.7 |
| 2459965.730187 | 36.9 ± 6.8 |
| 2459966.706965 | 10.8 ± 12.2 |
| 2459968.810077 | 39.3 ± 8.3 |
| 2459969.715243 | 21.6 ± 7.8 |
| 2459970.795047 | 14.1 ± 8.0 |
| 2459971.713010 | 3.9 ± 7.9 |
| 2459972.711943 | −18.7 ± 7.9 |
| 2459976.013552 | −8.7 ± 9.4 |
| 2459976.742448 | −21.7 ± 6.1 |
| 2459983.870853 | 18.7 ± 7.3 |
| 2459993.816766 | −9.9 ± 6.5 |
| 2460059.665795 | 0.1 ± 8.0 |
| 2460063.666801 | −4.6 ± 7.6 |
| 2460064.668268 | −30.8 ± 5.8 |
| 2460075.673304 | −48.4 ± 6.4 |
| 2460076.676316 | −55.3 ± 7.1 |
| 2460077.679583 | −42.4 ± 7.7 |
| 2460078.676741 | −27.0 ± 7.1 |
| 2460079.676306 | −16.1 ± 7.1 |
| 2460080.674796 | −22.4 ± 9.5 |
| 2460081.719219 | −19.7 ± 8.3 |
| 2460082.683708 | 22.1 ± 7.9 |
| 2460083.679226 | −12.3 ± 6.5 |
| 2460084.680507 | −21.3 ± 9.3 |
| 2460085.725536 | −24.8 ± 9.0 |
| 2460086.726195 | −2.9 ± 10.7 |
| 2460087.726738 | −34.5 ± 8.2 |
| 2460091.729524 | −61.5 ± 9.0 |
| 2460096.702127 | −73.3 ± 8.6 |
Table 4. Unistellar Observations Summary
| eVscope ID | UTC Start Date | Start Time | End Time | Observer | Location |
|---|---|---|---|---|---|
| (hh:mm:ss) | (hh:mm:ss) | ||||
| tr7 | 2022-12-09 | 14:44:01.730 | 19:55:14.411 | Wai-Chun Yue | Hong Kong |
| 7h9 | 2022-12-09 | 20:00:54.902 | 05:14:28.856 | Stephen Price | UK |
| wfb | 2022-12-09 | 23:43:50.126 | 02:24:24.992 | Bruno Guillet | France |
| 9vr | 2022-12-10 | 01:37:40.515 | 07:38:01.165 | Bruce Parker | United States |
| tr7 | 2022-12-10 | 14:20:12.158 | 20:03:47.817 | Wai-Chun Yue | Hong Kong |
| 26e | 2022-12-10 | 15:36:04.481 | 20:27:52.326 | Keiichi Fukui | Japan |
| v8v | 2022-12-10 | 16:16:36.247 | 20:18:27.103 | Keiichi Fukui | Japan |
| vfq | 2022-12-11 | 02:00:56.288 | 02:33:16.447 | Liouba and Niniane Leroux | France |
| 8 cm | 2022-12-11 | 15:07:25.376 | 15:56:18.982 | Masao Shimizu | Japan |
| za9 | 2022-12-11 | 15:52:22.620 | 16:51:05.748 | Ryuichi Kukita | Japan |
| qer | 2022-12-12 | 05:30:37.785 | 08:28:54.148 | Stefan Will | United States |
| 98 c | 2023-02-17 | 02:39:01.835 | 04:15:11.047 | Rachel Knight | United States |
| rev | 2023-02-17 | 04:06:03.171 | 10:01:04.595 | Michael Primm | United States |
| 26e | 2023-02-17 | 10:13:19.827 | 15:37:21.822 | Keiichi Fukui | Japan |
| knr | 2023-02-17 | 18:46:25.599 | 01:56:53.791 | Patrice Girard | France |
| 8zz | 2023-02-17 | 19:29:48.030 | 22:05:17.829 | Robert Savonnet | France |
| 3mh | 2023-02-17 | 19:46:21.475 | 00:33:55.606 | Nicola Meneghelli | Italy |
| rcn | 2023-02-18 | 00:45:09.996 | 09:38:29.238 | Justus Randolph | United States |
| rev | 2023-02-18 | 00:57:32.154 | 09:15:08.067 | Michael Primm | United States |
| gau | 2023-02-18 | 02:20:52.438 | 05:07:04.920 | Margaret A. Loose | United States |
| wt9 | 2023-02-18 | 02:24:58.621 | 06:12:17.053 | Paul A. Dalba | United States |
| p6r | 2023-02-18 | 02:28:08.211 | 06:04:25.788 | Paul A. Dalba | United States |
| 98 c | 2023-02-18 | 02:50:55.578 | 05:25:37.018 | Rachel Knight | United States |
| ehb | 2023-02-18 | 06:59:58.033 | 10:12:20.105 | Daniel O. Peluso | United States |
| aqn | 2023-02-18 | 07:05:50.118 | 10:10:12.866 | Daniel O. Peluso | United States |
| jad | 2023-02-18 | 10:13:56.165 | 13:35:48.356 | Des Janke | Australia |
| wfb | 2023-02-18 | 21:46:50.433 | 23:44:19.937 | Bruno Guillet | France |
| aqn | 2023-02-19 | 04:09:39.246 | 13:02:51.181 | Daniel O. Peluso | United States |
| epz | 2023-02-19 | 04:14:43.344 | 13:04:29.038 | Aditya Kapur & Nathan Jay | United States |
| 9bn | 2023-02-19 | 04:26:27.565 | 13:04:25.036 | Josephine Oesterer & Astha Verma | United States |
| ehb | 2023-02-19 | 04:28:30.613 | 13:09:45.740 | Ananya Balakrishnan & Christopher Seo | United States |
| wt9 | 2023-02-19 | 04:31:20.968 | 07:59:41.797 | Marco Hovland & Jonah Morgan | United States |
| p6r | 2023-02-19 | 04:31:58.118 | 13:08:22.219 | Serina Jain & Divya Bhamidipati | United States |
| qm6 | 2023-02-19 | 04:32:40.684 | 12:32:43.246 | Olivia Woo & Naina Srivastava | United States |
| mgc | 2023-02-19 | 04:42:01.448 | 13:04:37.092 | Dean Ramos & Richard Purev | United States |
| b64 | 2023-02-19 | 05:44:30.266 | 12:37:58.673 | Hanna Johnson & Vibha Sriramkumar | United States |
| 26e | 2023-03-11 | 11:59:02.839 | 17:00:16.386 | Keiichi Fukui | Japan |
| e7m | 2023-03-11 | 13:22:35.620 | 16:20:54.828 | Tateki Goto | Japan |
| 5wz | 2023-03-11 | 18:28:17.501 | 20:11:16.812 | Andre Katterfeld | Germany |
| vfq | 2023-03-11 | 19:15:18.673 | 01:40:41.001 | Liouba and Niniane Leroux | France |
| j9z | 2023-03-12 | 00:44:30.867 | 01:33:18.721 | Neil Yoblonsky | United States |
| t8m | 2023-03-12 | 01:39:06.100 | 02:00:44.262 | Eric Lawson | United States |
| 23d | 2023-03-12 | 19:21:20.172 | 23:19:22.225 | Petri Tikkanen | Finland |
| vfq | 2023-04-04 | 18:51:59.468 | 01:49:28.117 | Liouba and Niniane Leroux | France |
| p4e | 2023-04-04 | 18:56:15.401 | 19:26:03.944 | Eric Oulevey | France |
| 8zz | 2023-04-04 | 19:01:10.585 | 23:20:49.732 | Robert Savonnet | France |
| g3e | 2023-04-04 | 20:20:29.767 | 23:30:15.731 | Patrice Girard | France |
| 2rz | 2023-04-04 | 20:31:01.852 | 23:17:41.093 | Bruno Guillet | France |
| wfb | 2023-04-04 | 20:32:52.335 | 23:15:05.130 | Bruno Guillet | France |
| 9vr | 2023-04-05 | 00:56:22.558 | 04:54:24.960 | Bruce Parker | United States |
| gau | 2023-04-05 | 03:25:55.589 | 08:07:13.575 | Margaret A. Loose | United States |
| qrb | 2023-04-05 | 03:45:11.828 | 08:00:12.271 | Chelsey Logan | United States |
| p6r | 2023-04-05 | 04:33:17.876 | 07:57:20.504 | Paul A. Dalba | United States |
| 8zz | 2023-04-05 | 18:52:57.274 | 22:51:00.049 | Robert Savonnet | France |
| aij | 2023-04-05 | 20:25:10.527 | 00:23:12.806 | Steven Adkinson | Portugal |
| vfq | 2023-04-05 | 20:47:48.397 | 23:03:13.420 | Liouba and Niniane Leroux | France |
| gau | 2023-04-06 | 02:43:18.258 | 08:37:57.255 | Margaret A. Loose | United States |
| wt9 | 2023-04-06 | 04:02:15.493 | 07:55:39.704 | Paul A. Dalba | United States |
| p6r | 2023-04-06 | 04:26:52.729 | 07:48:43.814 | Paul A. Dalba | United States |
| jad | 2023-04-28 | 08:35:54.386 | 11:07:32.178 | Des Janke | Australia |
| 934 | 2023-04-29 | 01:38:30.415 | 02:08:17.048 | Lauren A. Sgro | United States |
| ya3 | 2023-04-29 | 02:30:43.198 | 06:42:46.062 | David Koster | United States |
Note. Bold rows represent the high school student observers in the Chabot Space & Science Center's Galaxy Explorers program.
Download table as: ASCIITypeset image
Footnotes
- 36
From the NASA Exoplanet Archive (Akeson et al. 2013) website (Accessed: 2023 August 6).
- 37
Camera specifications vary by eVscope model. eVscope/eQuinox 1: SONY IMX224 sensor, field of view (FOV) 37' × 28', pixel scale 1
 72 pixel−1. eVscope/eQuinox 2: SONY IMX347 sensor, FOV 45' × 34', pixel scale 1
 33 pixel−1.
 - 38
Example blog post from campaign start: https://www.unistellar.com/blog/is-a-distant-solarsystem-hiding-another-planet/ (Accessed: 2023 August 19.
- 39
For more information on the high school outreach observation campaign event: https://www.seti.org/high-school-galaxy-explorers-team-search-exoplanet-transit (Accessed: 2023 August 19).
- 40
E.g., TIC 139270665 b is ≈1.3 times denser than Neptune and ≈1.7 times denser than Jupiter.


