


Abstract
We report on the discovery and validation of a transiting long-period mini-Neptune orbiting a bright (V = 9.0 mag) G dwarf (TOI 4633; R = 1.05 R⊙, M = 1.10 M⊙). The planet was identified in data from the Transiting Exoplanet Survey Satellite by citizen scientists taking part in the Planet Hunters TESS project. Modelling of the transit events yields an orbital period of 271.9445 ± 0.0040 days and radius of 3.2 ± 0.20 R⊕. The Earth-like orbital period and an incident flux of  F⊕ places it in the optimistic habitable zone around the star. Doppler spectroscopy of the system allowed us to place an upper mass limit on the transiting planet and revealed a non-transiting planet candidate in the system with a period of 34.15 ± 0.15 days. Furthermore, the combination of archival data dating back to 1905 with new high angular resolution imaging revealed a stellar companion orbiting the primary star with an orbital period of around 230 yr and an eccentricity of about 0.9. The long period of the transiting planet, combined with the high eccentricity and close approach of the companion star makes this a valuable system for testing the formation and stability of planets in binary systems.
Export citation and abstract BibTeX RIS

Original content from this work may be used under the terms of the Creative Commons Attribution 4.0 licence. Any further distribution of this work must maintain attribution to the author(s) and the title of the work, journal citation and DOI.
1. Introduction
The advancement of space based photometric exoplanet missions, such as CoRoT (Auvergne et al. 2009), Kepler (Borucki et al. 2010) and the Transiting Exoplanet Survey Satellite (TESS; Ricker et al. 2015) has significantly improved our understanding of extrasolar planetary systems, including our understanding of planet occurrence rates and system architectures. However, the detection of planets using the transit method is inherently biased toward short-period planets. This is in part due to the fact that the transit probability of a planet decreases with increased orbital distance from the host star, and in part due to the fact that automated transit detection pipelines typically require two or more transit events in order to reach the signal-to-noise level required for detection and to achieve confidence that the signal is periodic.
As a result, only 9.7% of all confirmed transiting planets have orbital periods longer than 50 days, and 1.6% have orbital periods longer than 200 days. Similarly, only around 2.5% of known planets with a semimajor axis greater than 1 au were detected using the transit method, with over 70% of them having been detected using Radial Velocity (RV) observations (NASA Exoplanet Archive). 39 While the RV method can yield planet properties such as the orbital period and minimum mass measurements, without the detection of a transit event the planet radius, and therefore the bulk density, cannot be constrained. Furthermore, the detection of a transit event helps constrain the system inclination, thus enabling an absolute (instead of minimum) mass measurement. Similarly, atmospheric characterization via transmission spectroscopy is only possible for transiting planets.
Transiting planets on long orbital periods, in particular, allow for new investigations into the formation, migration, and long-term stability of planetary systems. The comparison between planets with short and long orbital periods, for example, allows us to probe how equilibrium temperatures affect planet formation (e.g., Lopez & Rice 2018; Fernandes et al. 2019).
The long-term stability and evolution of planetary systems can also be affected by stellar binarity (Veras 2016; Hamer & Schlaufman 2019). As shown by Raghavan et al. (2010), 54% ± 2% of solar-type stars are single, with the rest existing in pairs or higher order multiple systems. These companion stars can perturb planet orbits resulting in high eccentricity tidal migration which can produce hot Jupiters (Naoz et al. 2012; Vick et al. 2023), truncate protoplanetary disks and shorten disk lifespans (Kraus et al. 2012; Manara et al. 2019; Winter et al. 2020; Zagaria et al. 2022), and limit the formation of terrestrial planets (when the binary separation is less than around 10 au; Quintana et al. 2007). Due to the high fraction of stars that are part of binaries, a thorough understanding of how binary interactions affect planet formation, migration and long-term stability is important to constrain the underlying planet population in our Galaxy (Moe & Kratter 2021a).
In this paper we present the detection and validation of a transiting mini-Neptune (hereafter TOI 4633 c) orbiting a bright (Vmag = 9.0), nearby (d = 95 pc) G Dwarf, that was detected by citizen scientists. The period of 272 days makes this planet the second longest-period confirmed planet identified in the TESS data to date (with the longest being TOI 4600c, Mireles et al. 2023), and only one of five confirmed TESS planets with orbital periods longer than 100 days (Dalba et al. 2022; Heitzmann et al. 2023). Furthermore, the long orbital period and incident flux of ∼1.6 F⊕ places it in the habitable zone of its host star, making it only the fourth habitable zone planet identified in the TESS data to date, following TOI 700 d (Gilbert et al. 2020; Rodriguez et al. 2020), TOI 700 e (Gilbert et al. 2023), and TOI 715 b (Dransfield et al. 2024).
RV monitoring revealed an additional, non-transiting, planet candidate with a 34 days period (hereafter TOI 4633 b). Furthermore, the combination of newly obtained speckle imaging and archival high-contrast imaging data dating back to 1905 revealed a bound stellar companion with a period of ∼230 yr. As such, we present a bright multi-planet, multi-star system.
The paper is structured as follows. In Section 2 we describe the discovery of TOI 4633 c in the TESS data. In Section 3 we present the spectroscopic and imaging observations and in Section 4 we discuss activity indicators and statistically validate the transit signal. In Section 5 we present the derivation of the parameters of both stars and the orbital properties of the binary system. In Section 6 we discuss the planet parameters of TOI 4633 c and planet candidate TOI 4633 b and their long-term stability within the binary system. Finally, in Section 7, we place TOI 4633 into the context of other long-period multi-planet systems as well as into the context of the population of confirmed planets in binaries.
2. Photometry and Discovery of TOI 4633 c
TOI 4633 (TIC 307958020; Stassun et al. 2019) is located at high ecliptic latitude (near the ecliptic pole) and was observed by TESS nearly continually during years 2, 4 and 5 of the mission (Sectors 14–26, 40, 41, 47–53, 55, 56, 58, 59). Following the identification of the first two transit events, we proposed for the target to be observed at the shortest TESS cadence. Therefore, from Sector 49 and onward, the data have been obtained at a 20 s cadence (proposal ID: DDT054; PI: Eisner). Prior to this sector all observations were obtained at a 2 minutes cadence.
The light curve of TOI 4633 exhibits three transit events located in Sectors 20, 40 and 50. The former two transit events were identified by citizen scientists taking part in the Planet Hunters TESS citizen science project (Eisner et al. 2021). The project, which is hosted by the Zooniverse platform (Lintott et al. 2008, 2011), engages over 40,000 citizen scientists in the task of visually inspecting TESS data in the search for transit events. At any given time, Planet Hunters TESS only ever displays the data from a single TESS sector. As such, the former two transit events were independently identified by 15 citizen scientists who were randomly presented the light curve of TOI 4633. The data consist of the Presearch Data Conditioning (PDC) 2 minutes cadence observations, which are produced by the Science Processing Operations Center (SPOC; Smith et al. 2012; Stumpe et al. 2012, 2012, 2014; Jenkins et al. 2016) pipeline. Individual measurements that are flagged by the SPOC pipeline as being affected by various instrumental anomalies are not shown on Planet Hunters TESS. Unfortunately, the data around the time of the third transit event (in Sector 50) was identified as being affected by scattered light and as such this transit was not seen or identified by citizen scientists. For more details regarding the PHT pipeline and the identification of transit-like signals we refer the reader to Eisner et al. (2021).
Once the transit events were identified, we analyzed both the 2 minutes cadence and 20 s cadence PDC SPOC light curves. As mentioned above, the 2 minutes and 20 s cadence data around the time of the third transit event (BTJD∼2680.6 days) were affected by scattered light. In order to recover the third transit, we performed a tailored correction of the Sector 50 light curve using cotrending basis vectors (CBVs). We followed a similar approach as the one presented by Barragán et al. (2022b), which makes use of the lightkurve package (Lightkurve Collaboration et al. 2018). In brief, we first created a light curve from the target pixel file (TPF) using the nominal TESS aperture and did not remove data that had been flagged as "bad" by the SPOC pipeline (flag: bit 13, value 4096). The CBVs provided with the TPF were then used to correct the light curve using the built-in correction function (CBVCorrector 40 ) in lightkurve and allowing for interpolation. This generates a light curve where the large scale trends are removed, including the trends around the times of the transit events. Finally, we performed a crowding correction to account for extra flux from nearby stars that may be present in the Simple Aperture Photometry (SAP) mask. To do this we used the nominal crowding values given in the TPF to account and correct for the light curve contamination. 41 We note that this method did not correct for the light contribution from the close, bound companion star (see Section 5). As a test, we also used this method to extract and detrend the light curves around the time of the other two transit events. We found there to be no significant difference between these and the SPOC light curves. As such, for these two former transits we use the SPOC data.
The absence of further transit events in the TESS data allows us to confirm that the transiting object (TOI 4633 c) has an orbital period of ∼271.94 days. We confirm that all shorter aliases of this orbital period would result in at least one observable transit in the available TESS data. A subset of the 2 minutes cadence light curve is shown in Figure 1 and the three individual transits are shown in Figure 2.

Figure 1. Normalized photometric data from TESS sectors 20–22 to illustrate the stellar variability of the light curve. The first of the three transit events observed by TESS to date is highlighted by the vertical gray column. The normalized 2 minutes cadence flux binned to 10 minutes and unbinned are shown in maroon and gray, respectively.
Download figure:
Standard image High-resolution image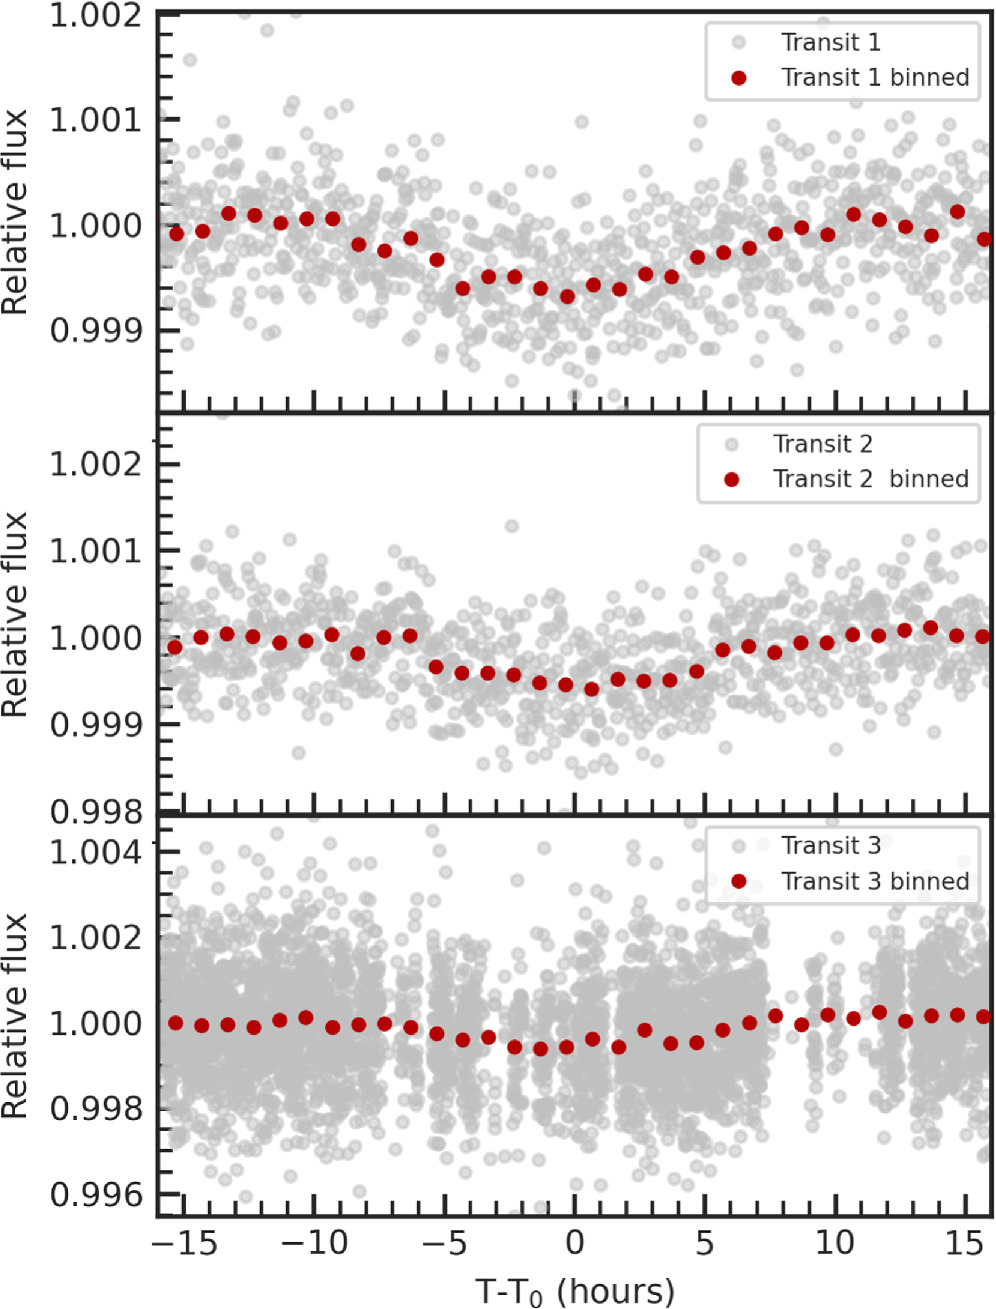
Figure 2. The three transits of TOI 4633 c. Nominal TESS observations are shown in light gray while solid circles represent 60 minutes binned data.
Download figure:
Standard image High-resolution imageIn addition to the TESS data, there is archival data from the All Sky Automated Survey for SuperNovae (ASAS-SN), consisting of 3482 observations obtained between 2012 March 28 and 2023 November 10, with 2481 observations in the g filter, and 1001 in the V filter (Shappee et al. 2014; Kochanek et al. 2017). However, we note that the g filter data show a large change in the root mean square scatter before and after 2459330 HJD of around 105 and 170 mJy, respectively. We, therefore, do not use the g filter data for any further analysis. We find no evidence of any further transit signals in the ASAS-SN data
2.1. Excluding False Positive Scenarios
In order to help rule out instrumental and astrophysical false positive scenarios including background eclipsing binaries, systematic effects, and background events such as asteroids passing through the field of view we performed a number of standard diagnostic tests using the TESS data. We used the publicly available Lightcurve Analysis Tool for Transiting Exoplanets (latte; Eisner et al. 2020a) for this analysis. 42 For a full description of the diagnostic tests we refer the reader to Eisner et al. (2020a); however, in brief, the tests allowed us to ensure that:
- 1.the transit events do not coincide with the times of the periodic momentum dumps that introduce spurious signals into the data.
- 2.the x and y centroid positions are smoothly varying with time in the vicinity of the transit events and thus the transit events are unlikely to be caused by systematic effects or by background eclipsing binaries.
- 3.the light curves of the five nearest two-minute cadence TESS stars do not show similar signals at the same time (projected distances between these stars and TOI 4633 range from 2
 7 to 287).
 - 4.the signal is on target by investigating the light curve extracted for each pixel surrounding the target in order to ensure that the transit events are not caused by spurious background signals on other pixels.
- 5.there are no spurious signals, such as sudden jumps or strong variations, in the background flux at the same time as the event.
- 6.the transit shapes and depths when extracted with different aperture sizes are consistent.
- 7.the signal is on target by comparing the average in-transit and average out-of-transit flux, as well as the difference between them, which indicates the location of the change in flux (i.e., the location of the transit event).
We used these tests to show that the transit signals are unlikely to be systematic or astrophysical false positives. We uploaded TOI 4633 c to the Exoplanet Follow-up Observing Program for TESS (ExoFOP-TESS) site on 2020 May 27 as a community TESS Object of Interest (cTOI). The planet was later promoted to a priority 1 (1 = highest priority, 5 = lowest priority) TOI candidate (TOI 4633.01) on 2022 December 14.
While the SPOC did not recover the true period of TOI 4633 c, the first two transits were detected as a duo-transit in the two multi-sector searches conducted over sectors 14–23 and 14–26. Transit searches conducted with a noise-compensating matched filter over sectors 14–41, 14–50, 14–55, and 14–59 (Jenkins 2002; Jenkins et al. 2010, 2020) identified the first two transits at twice the actual orbital period. A limb-darkened transit model was fit to the transit signal in each case (Li et al. 2019) and a suite of diagnostic tests were performed to assess the nature of the signal (Twicken et al. 2018). The signal passed all the diagnostic tests, including the difference image centroiding test, which localized the source of the transit signal to within 2 3 ± 41 of the presumed host star. The TESS Science Office reviewed the Data Validation reports and issued an alert for TOI 4633c on 2021 November 19 (Guerrero et al. 2021).
3. Follow-up Observations
In this section we outline the spectroscopic data, as well as the imaging data that revealed a close, bound stellar companion. The analysis of these data is discussed in Sections 5 and 6.
3.1. Spectroscopic RV Monitoring
We acquired high-resolution (R ∼ 120,000) spectra with the HIgh Resolution Echelle Spectrometer (HIRES) mounted on the 10 m Keck telescope on Maunakea, Hawaii (Vogt & Donald Penrod 1988, Program numbers: 2022A_N93, 2022B_N025, and 2023A_N085). The instrument has a wavelength coverage between ∼350 and ∼620 nm. The instrument passes the star's light through a heated iodine cell, allowing for precise wavelength calibration when determining relative RVs (Howard et al. 2010).
We obtained 54 spectra using the iodine cell between 2022 February 21 and 2023 July 22 (mean per pixel S/N ∼167 at 550 nm). Radial velocity measurements were determined following the approach of Vogt et al. (1994) and then fit using the publicly available software package RadVel via comparison to a S/N = 260 template spectrum of G5 standard star HD 162232 taken on 2008 June 20 (Fulton et al. 2018). The RV analysis was also carried out using a template spectrum of TOI 4633 taken on 2021 November 24 (per pixel S/N = 46), which yielded equivalent results within the uncertainties. The analysis of the HIRES spectra showed no evidence of a companion star, allowing us to place an upper limit of ΔRV ≤ 10 km s−1 on the relative motion of the two stars known to be in this system (Kolbl et al. 2015). Furthermore, we note that we do not see any evidence for multiple stars in our radial velocity template or in the analysis of the measured radial velocity values alone. Due to the lack of the obvious signature of both stars in the spectra, we are unable to use a two-star template spectrum to extract the RVs.
Additional data were obtained with the SOPHIE high-resolution fiber-fed echelle spectrograph mounted on the 1.93 m Observatoire de Haute-Provence (OHP) telescope (Perruchot et al. 2008). We used the high-resolution mode, which delivers a spectral resolution of R ∼75,000 across the wavelength range of 387–694 nm. We obtained 20 observations between 2021 November 15 and 2023 March 5 (mean per pixel S/N ∼33 at 555 nm). Standard stars that were observed at the same epochs using the same SOPHIE mode did not show significant instrumental drifts. The spectra were reduced using the standard SOPHIE RV reduction pipeline (Bouchy et al. 2009), including CCD charge transfer inefficiency correction (Bouchy et al. 2013). Following the method described, e.g., in Pollacco et al. (2008) and Hébrard et al. (2008), we estimated and corrected for the sky background contamination (mainly due to the Moon) using the second SOPHIE fiber aperture, which is targeted 2' away from the first one pointing toward the star. We estimated that only one of the 20 exposures was significantly polluted by sky background. We note that the analysis of the SOPHIE spectra showed no evidence of a companion star. The extracted HIRES and SOPHIE RV observations are listed in Table 1 and their implications for the system's architecture discussed in Section 6.
Table 1. Spectroscopic Data Obtained with the OHP/SOPHIE (Mean per Pixel S/N ∼33 at 555 nm) and Keck/HIRES (mean per Pixel S/N ∼167 at at 550 nm)
| Time | RV | RV error | SNR | Instrument | Time | RV | RV error | SNR | Instrument |
|---|---|---|---|---|---|---|---|---|---|
| (BJD–2457000) | (m s−1) | (m s−1) | (BJD—2457000) | (m s−1) | (m s−1) | ||||
| 2534.3461 | −47.40 | 7 | 34 | OHP | 2780.9910 | 14.50 | 1.60 | 216 | HIRES |
| 2601.7097 | −6.40 | 5.00 | 32 | OHP | 2782.4014 | 9.60 | 5.00 | 31 | OHP |
| 2606.7163 | 9.60 | 5.00 | 31 | OHP | 2785.9500 | 29.50 | 1.81 | 215 | HIRES |
| 2622.7200 | 33.60 | 5.00 | 31 | OHP | 2786.9510 | 28.40 | 1.76 | 215 | HIRES |
| 2623.6940 | 10.60 | 5.00 | 31 | OHP | 2789.8280 | 26.75 | 1.68 | 216 | HIRES |
| 2631.6864 | −9.40 | 5.00 | 31 | OHP | 2792.8320 | 13.20 | 1.50 | 214 | HIRES |
| 2632.0840 | −18.11 | 2.67 | 215 | HIRES | 2799.9740 | −0.47 | 3.26 | 75 | HIRES |
| 2648.6661 | 21.60 | 5.00 | 31 | OHP | 2806.8260 | −15.09 | 3.04 | 75 | HIRES |
| 2657.1140 | 22.26 | 2.23 | 214 | HIRES | 2809.8690 | −12.29 | 2.97 | 75 | HIRES |
| 2661.0570 | 1.01 | 2.49 | 214 | HIRES | 2812.7900 | −13.26 | 2.76 | 76 | HIRES |
| 2662.6285 | −8.40 | 3.00 | 55 | OHP | 2822.8680 | 38.68 | 2.66 | 75 | HIRES |
| 2672.0130 | −16.19 | 2.20 | 216 | HIRES | 2824.4013 | 12.60 | 5.00 | 31 | OHP |
| 2681.0310 | 48.24 | 2.47 | 174 | HIRES | 2826.7810 | 14.72 | 2.53 | 76 | HIRES |
| 2683.6198 | 14.60 | 5.00 | 30 | OHP | 2828.7990 | 16.66 | 3.02 | 76 | HIRES |
| 2687.6359 | 8.60 | 5.00 | 31 | OHP | 2829.7400 | 4.81 | 3.26 | 76 | HIRES |
| 2690.0110 | 9.61 | 2.11 | 216 | HIRES | 2831.8460 | 5.52 | 2.79 | 73 | HIRES |
| 2695.0180 | −11.66 | 2.05 | 214 | HIRES | 2833.7860 | −4.98 | 2.74 | 75 | HIRES |
| 2700.9730 | −44.11 | 2.09 | 213 | HIRES | 2834.7620 | −10.65 | 2.87 | 76 | HIRES |
| 2710.0270 | −11.04 | 1.76 | 215 | HIRES | 2835.7440 | −8.97 | 2.69 | 77 | HIRES |
| 2712.0200 | 3.27 | 2.27 | 163 | HIRES | 2838.8030 | −8.72 | 2.87 | 75 | HIRES |
| 2712.9410 | 18.14 | 1.87 | 215 | HIRES | 2840.7390 | −10.70 | 3.22 | 76 | HIRES |
| 2713.5387 | 6.60 | 5.00 | 31 | OHP | 2858.7850 | 37.97 | 3.17 | 74 | HIRES |
| 2715.9930 | −2.48 | 1.79 | 214 | HIRES | 2879.2694 | −27.40 | 5.00 | 31 | OHP |
| 2725.5476 | 17.60 | 5.00 | 31 | OHP | 2892.3184 | −9.40 | 5.00 | 33 | OHP |
| 2730.0720 | 5.38 | 1.82 | 214 | HIRES | 3009.6665 | −5.40 | 6.00 | 31 | OHP |
| 2736.5730 | −32.40 | 5.00 | 31 | OHP | 3043.0680 | −20.97 | 2.65 | 143 | HIRES |
| 2738.9790 | −17.85 | 1.54 | 215 | HIRES | 3045.0940 | −38.01 | 2.18 | 216 | HIRES |
| 2741.9610 | −19.38 | 1.51 | 215 | HIRES | 3047.1150 | −36.49 | 2.07 | 202 | HIRES |
| 2748.8440 | −2.73 | 1.63 | 204 | HIRES | 3068.0640 | −7.83 | 2.08 | 153 | HIRES |
| 2749.8980 | −0.83 | 1.48 | 216 | HIRES | 3070.9230 | −31.26 | 2.01 | 214 | HIRES |
| 2750.4574 | 12.60 | 4.00 | 42 | OHP | 3089.8800 | −9.88 | 1.75 | 216 | HIRES |
| 2768.9970 | 1.38 | 1.57 | 215 | HIRES | 3101.0680 | 15.11 | 1.51 | 210 | HIRES |
| 2769.9960 | −2.72 | 1.89 | 214 | HIRES | 3108.0060 | −9.65 | 1.53 | 214 | HIRES |
| 2773.4748 | −11.40 | 6.00 | 31 | OHP | 3122.0480 | 5.74 | 1.63 | 171 | HIRES |
| 2775.9770 | −6.20 | 1.58 | 216 | HIRES | 3132.8510 | 6.65 | 1.51 | 216 | HIRES |
| 2776.8030 | −11.86 | 1.58 | 210 | HIRES | 3138.9630 | 5.20 | 1.86 | 196 | HIRES |
| 2779.9810 | 3.22 | 1.69 | 214 | HIRES | 3148.0280 | 1.62 | 1.68 | 206 | HIRES |
Note. The reported RV values were systematically shifted to be centered around 0, as determined using a Keplerian fit. The low resolution, iodine-free reconnaissance spectra obtained with Keck/HIRES are not included.
Download table as: ASCIITypeset image
The RV data allowed us to place an upper mass limit on planet c and revealed an additional non-transiting planet candidate (with a period of ∼34 days; planet b) in the system, as discussed in Section 6.
3.2. Imaging Observations and Companion Star.
Archival data listed in the Washington Double Star Catalog (WDS) show that TOI 4633 has a bound companion star. Hereafter, the stars will be referred to as star A and star B for the more and less massive star, respectively. The 10 archival observations were obtained between 1905 February and 2011 June and their position angles (PA) and angular separations (ρ) are listed in Table 2.
Table 2. Archival and new Imaging of TOI 4633
| Date | PA | ρ | Δ mag | Aperture | λ | Methoda | Reference | Notes |
|---|---|---|---|---|---|---|---|---|
| (deg) | (arcsec) | (m) | (nm) | |||||
| 1905.170 | 124.7 | 0.42 | 0.5 | 0.9 | ⋯ | M | Hussey (1905) | WDS |
| 1922.876 | 124.1 | 0.38 | 0.4 | 1.0 | ⋯ | M | van Biesbroeck (1927) | WDS |
| 1959.440 | 124.9 | 0.4 | 0.3 | 0.4 | ⋯ | M | Couteau (1960) | WDS |
| 1963.790 | 124.8 | 0.47 | 0.2 | 0.4 | ⋯ | M | Baize (1967) | WDS |
| 1966.672 | 122.8 | 0.42 | 0.2 | 0.7 | ⋯ | M | Worley (1972) | WDS |
| 1976.460 | 122.7 | 0.42 | ⋯ | 0.5 | ⋯ | M | Muller (1978) | WDS |
| 1982.078 | 124 | 0.3 | 0.3 | 0.7 | ⋯ | M | Worley (1989) | WDS |
| 1984.520 | 127.8 | 0.28 | ⋯ | 0.6 | ⋯ | M | Heintz (1985) | WDS |
| 1993.100 | 119 | 0.26 | ⋯ | 0.5 | ⋯ | M | Muller (1997) | WDS |
| 2021.8616 | ⋯ | <0.1 | ⋯ | 5.1 | 1000–2500 | AO | ⋯ | Palomar/PHARO |
| 2022.303 | ⋯ | <0.06 | ⋯ | 3.5 | 812–852 | S | ⋯ | WIYN/NESSI |
| 2022.352 | 300.5 ± 0.5 b | 0.05 ±0.01 | 0.4 | 8.1 | 535–589 | S | ⋯ | Gemini/'Alopeke |
| 2023.316 | 303.18 ± 1.29 | 0.062 ±0.01 | 0.23 | 10 | 2256–2285 | AO | ⋯ | Keck II/NIRC2 |
Notes.
a M indicates that the observation were obtained using a micrometer on a refractor telescope; S indicates that the observations were obtained with the Speckle technique; and AO indicated the use of adaptive optics. b 180° ambiguity in the PA.Download table as: ASCIITypeset image
In addition to archival data, we obtained high-contrast imaging observations of TOI 4633 to further constrain the orbit of the two stars. High-contrast imaging was performed using the NESSI high-resolution speckle imaging instrument mounted on the 3.5 m WIYN telescope located at Kitt Peak National Observatory (Scott et al. 2018) on 2022 April 21; the PHARO adaptive optics instrument mounted on 5.1 m Hale telescope at Palomar Observatory (Hayward et al. 2001) on 2021 November 11; the 'Alopeke speckle instrument mounted on the 8.1 m Gemini North telescope on Maunakea (Howell et al. 2011; Matson et al. 2019) on 2022 May 9; and the NIRC2 adaptive optics instrument mounted on the 10 m Keck II (Wizinowich et al. 2000) located on Maunakea, Hawaii, on 2023 April 26. While the former two observations were unable to resolve the two stars, the 'Alopeke and NIRC2 observations revealed the close companion at angular separations of 51 and 62 mas, respectively. The observations showed that the two stars have a brightness ratio FB
/FA
= 0.7, as shown in Figure 3. The former two instruments were unable to resolve the two stars due to a lack of angular resolution to resolve a separation of <100 mas. Similarly, neither Gaia DR2 nor Gaia DR3, which obtained observations of the target in 2015 and 2016, respectively, were able to resolve the two stars due to the small angular separation of the stars at the time of the observations. Furthermore, due to the proximity of the two stars, the Gaia DR3 noise metric RUWE∼1.15 is consistent with a single-star solution, which highlights the need for high-resolution imaging. Finally, we note that in addition to the archival data listed in Table 2, WDS records one additional observation obtained by Gili et al. (2021) in 2011. Their recorded values of position angle (37.6 deg) and angular separation (0233) are inconsistent with both the remainder of the archival and our newly obtained data. More specifically, there is no stable binary orbit that would be able to explain this measurement in combination with the archival and newly obtained measurements. Furthermore, the analysis method that was used to reduce these observations follows a unique procedure that is ambiguously defined and distinct from the processes used for any of the other imaging data, and thus we do not include it in any further analysis.

Figure 3. Contrast curves showing the 5σ detection sensitivity and speckle auto-correlation functions obtained using Gemini North/'Alopeke (left) and Keck II/NIRC2 (right).
Download figure:
Standard image High-resolution imageGiven the available Gaia data, the proper motions of the two stars cannot be disentangled. However, given the proper motion of the system (R.A.: −23.056, decl.: −67.0188 mas yr−1) and the range of angular separations of the two stars reported between 1905 and 2023 (470–50 mas), we confirm that these two stars are bound and not a chance alignment along our line of sight.
4. Activity Indicators and Statistical Validation of the Transit Signals
In this section we discuss how the stellar activity affects our confidence in the planetary nature of planet candidate b. Furthermore, we present statistical validation of planet c.
4.1. Stellar Activity Indicators and Planet Candidate TOI 4633 b
The RV data exhibit a periodic signal with a period of ∼34 days. This can be seen in Figure 4, which shows periodograms of the RV observations obtained with HIRES (navy) and SOPHIE (maroon), calculated using the PyAstronomy Generalized Lomb-Scargle Periodogram (Czesla et al. 2019). We carried out a number of tests in order to determine whether this periodic signal seen in the RV data is caused by a planetary body or by stellar activity. This is important as magnetic stellar activity manifests itself by producing brighter or darker regions on the surface of the star, such as faculae, starspots, and plages. This, in turn, affects the observed stellar spectra and can induce RV signals that mimic those from planets (e.g., Queloz et al. 2001; Figueira et al. 2010; Boisse et al. 2011; Díaz et al. 2016).

Figure 4. Generalized Lomb-Scargle Periodogram of the HIRES and SOPHIE RV data (navy and maroon bold panels, respectively). The non-bold panels show periodograms of various activity indicators for each instrument, while the vertical gray line indicates a period of 34 days. The horizontal dotted orange and dashed gray lines represent the 10% and 30% FAPs, respectively.
Download figure:
Standard image High-resolution imageFor the HIRES data we investigate the chromospheric stellar activity using the S-index and its corresponding derivative  value, a parameter that provides a proxy for the level of magnetic activity on the surface of a star (e.g., Vaughan et al. 1978; Noyes et al. 1984; Saar et al. 1998; Santos et al. 2000, 2010; Cincunegui et al. 2007). In brief,
  is the ratio of the emission in the cores of the Ca ii H and K lines (at 3933 Å and 3968 Å) to the total bolometric flux of the star, where the Ca ii H and K lines probe the temperature of the chromosphere of the star. As magnetic activity primarily heats up the chromosphere (resulting in stronger emission features), the ratio of the intensity of the emission feature in these lines to the bolometric flux probes the magnetic activity of the star.
We used the Hα Balmer line of hydrogen at 6563 Å as an additional indicator of the chromospheric activity of the star. Using the HIRES data and following the methodology described by Gomes da Silva et al. (2011) we measured the ratio of the flux within ± 0.8 Å of the Hα line at 6562.808 Å to the flux of the two wavelength regions of 6550.87 ± 5.375 Å and 6580.31 ± 4.375 Å. Prior to measuring the flux ratios, we derived a wavelength solution for the Hα order of the spectrum and shifted each spectrum to the star's rest frame by cross correlating each spectra with the spectrum from the NSO solar atlas. Both the NSO solar atlas spectrum and the HIRES spectra were re-sampled to have wavelength steps of 0.003 Å. The spectra were normalized with a third order polynomial (where the Hα line ± 5 Å was masked out).
Similarly, we computed activity indicators using the SOPHIE data by measuring the ratio of the fluxes in the cores of the Hα (6562.808 Å), Hβ (4861.363 Å) and Na i D1 & D2 (5895.92 & 5889.95 Å, respectively) lines to the flux in continuum regions around each of the lines. The same wavelength regions as described above were used for the Hα index. For the Hβ index we measured the flux within a 1.2 Å window centered on the absorption line and divided by the two reference regions defined as 4855.0 ± 2.5 Å and 4870.0 ± 2.5 Å (Klein et al. 2022). The Na i index was defined as the flux within a 0.5 Å window centered on each line divided by the two reference regions of 5805.0 ± 5 Å and 6090.0 ± 10 Å (Gomes da Silva et al. 2011). In addition to these stellar activity indicators, we made use of the fact that periodic changes in the shapes of absorption lines (e.g., FWHM, BIS) can be indicative of whether RV signals are caused by companions or by stellar activity. We note that different activity indicators are used for the HIRES and SOPHIE data due to the different spectral ranges that both of these instruments cover.
We used the PyAstronomy Generalized Lomb-Scargle Periodogram (Czesla et al. 2019) to search for periodicities in the chromospheric activity indicators, FWHM and BIS. As shown in Figure 4, where the dotted orange and dashed gray lines show the 10% and 30% False Alarm Probability (FAP), respectively,there are no significant trends that coincide with the periodic signals seen in the RV data (indicated by the gray vertical line). We do note that the S-index shows a local power maximum at 37 days, which is near the radial velocity power maximum at 34 days. This power maximum is, however, not the largest peak in the S-index power spectrum and has an FAP of 99.96%.
We also determine the degree of correlation between the RV time series and each of the activity indicators (independent for the HIRES and SOPHIE data) by computing Pearson's correlation coefficients r and their p-values. The test showed that there are no correlations between the RVs and any of the activity indicators with r ranging from −0.28 to 0.14 and p-values ranging from 0.23 to 0.29. As all of the p-values are significantly greater than 0.05, we conclude that there is no significant evidence for a correlation between the RV time series and the activity indicators for both the HIRES and SOPHIE data.
Finally, we ensured that the PyAstronomy Generalized Lomb-Scargle periodograms of the TESS light curve and the ASAS-SN light curve (where the transit events in the TESS data are removed) show no significant periodic signals. The Lomb-Scargle periodograms of the TESS and ASAS-SN data are shown in Figure 5, alongside the light curves phase folded at the period of TOI 4633 b (P = 34.15 ± 0.15 days). This shows that there are no significant trends at this period with an FAP better than 30% that could result from additional transit events, stellar rotation, or asteroseismic pulsations in either the TESS or the ASAS-SN data. This is further supported by the lack of a coherent signal in the phase folded data at the period of planet candidate b in the rightmost column of Figure 5.
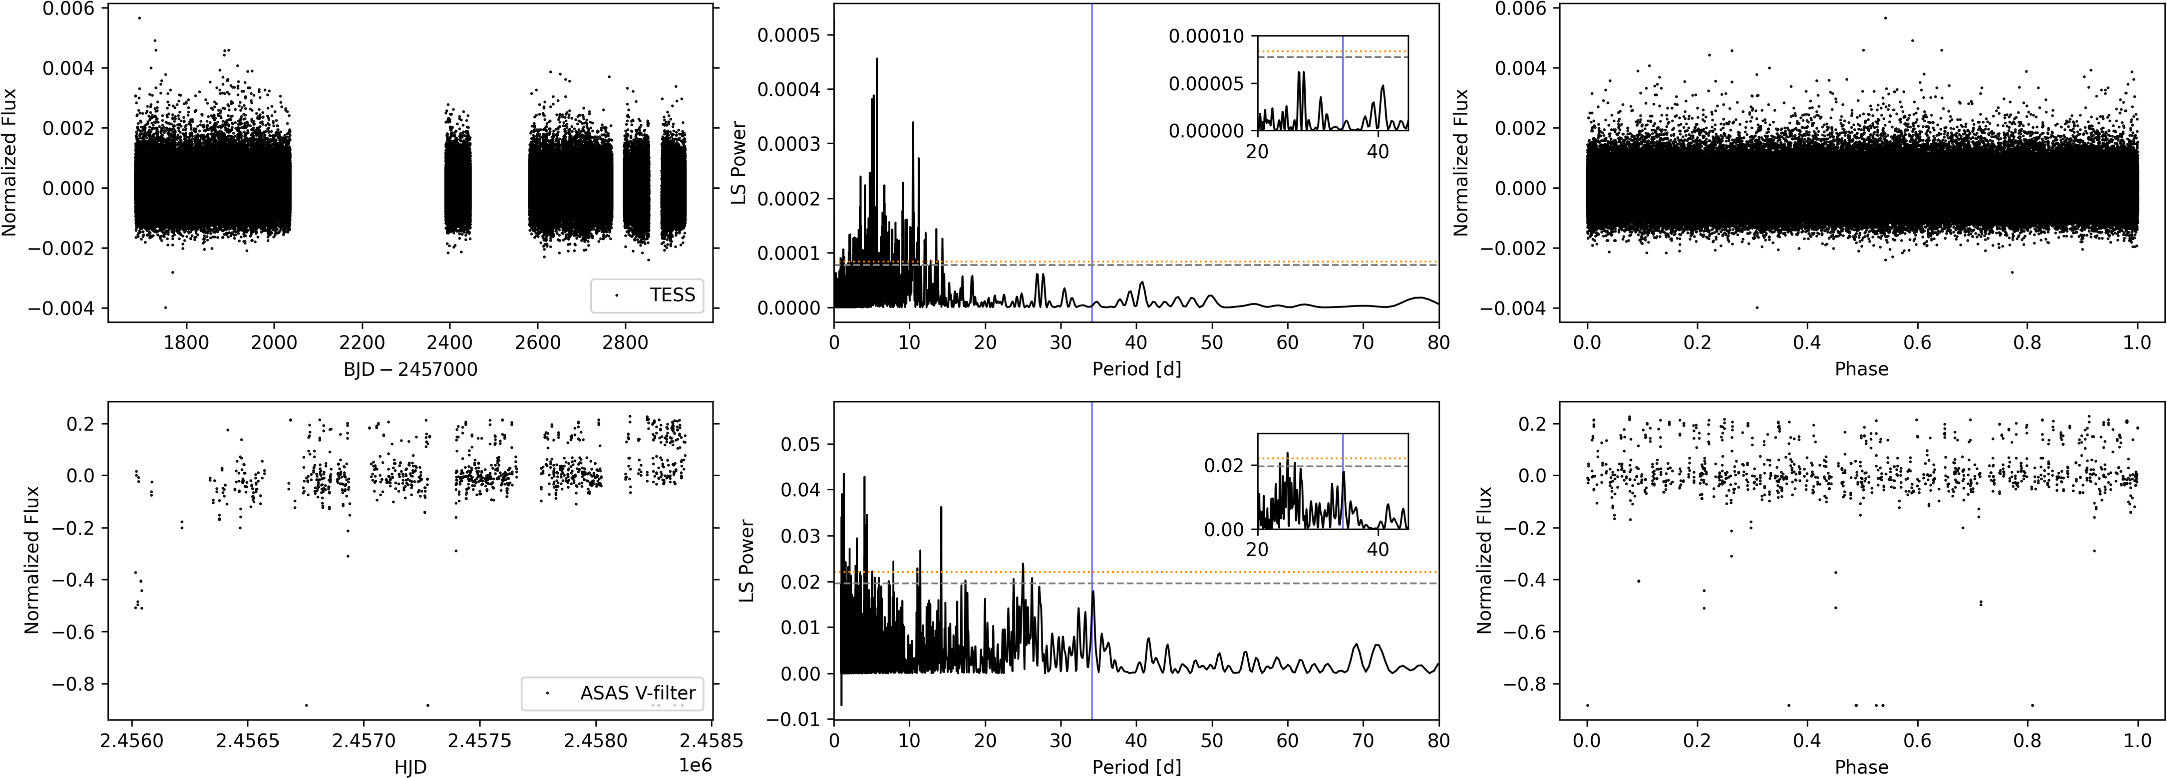
Figure 5. Normalized light curve (left), Generalized Lomb-Scargle periodogram (middle), and light curve phase folded at the period of planet candidate b (Pb = 34.15 ± 0.15 days) for the 2 minutes cadence TESS data (top) and the V-band ASAS-SN data. The vertical blue line in the middle panel indicates the period of planet candidate b, while the horizontal dotted orange and dashed gray lines represent the 10% and 30% FAPs, respectively.
Download figure:
Standard image High-resolution imageIn summary, based on our analysis of the stellar activity indicators we have been able to extract from the HIRES and SOPHIE spectra, there is no indication that the 34 days signal is caused by stellar activity, and we therefore consider the hypothesis that this signal is of planetary origin to be more likely. However, the limited precision of the HIRES activity indicators, and the limited number of SOPHIE observations, preclude a joint analysis of the RVs and activity indicators to disentangle the contributions of activity and planet(s) to the RVs. Consequently, we report the 34 days signal as a planet candidate, rather than a confirmed planet detection.
4.2. Statistical Validation of Planet c
The standard diagnostic tests presented in Section 2.1 allowed us to rule out a number of instrumental and astrophysical false positive scenarios that could mimic the transit-like signals seen in the TESS data. Furthermore, the spectroscopic follow-up observations presented in Sections 3.1 allowed us to place an upper mass limit of 123 M⊕ (99 percentile of the credible interval) on TOI 4633 c, as discussed in Section 6.1. As we do not have a 3σ mass measurement of planet c, we carry out a statistical analysis of the likelihood that the transit signals are caused by a planet as opposed to the range of alternative, astrophysical false positive scenarios.
We used the open-source package TRICERATOPS (Giacalone et al. 2021), which was specifically developed to aid in the vetting and validation of transit-like signals identified in the TESS data, to calculate the false positive probability (FPP) of the observed transit signals of TOI 4633 c. In brief, TRICERATOPS uses a Bayesian framework that incorporates prior knowledge of the target star, planet occurrence rates, and stellar multiplicity to calculate the probability that the transit signal is due to a transiting planet. It also makes use of the TRILEGAL (Girardi et al. 2005) galactic model to simulate a population of stars around the line of sight of the target.
The resulting FPP quantifies the probability that the observed transit signal can be attributed to something other than a transiting planet. As inputs to the code we used the 2 minutes cadence and 20 s cadence (where available) data (Section 2), combined with the contrast curves obtained using 'Alopeke and NIRC2 (Section 3.2). We found the FPP to be 0.0003 ± 0.0005 and the nearby FPP (NFFP) to be 6.6 × 10⁻²¹ ± 4.6 × 10⁻²¹. Both of these are better than the commonly accepted validation threshold of FPP < 0.015 and NFPP <10−3, as defined by Giacalone et al. (2021), allowing us to conclude that TOI 4633 c is a non-self-luminous object transiting one of the two stars in the binary. Furthermore, combined with the upper mass limit provided by the RV monitoring, we consider TOI 4633 c to be a confirmed planet.
For the remainder of this paper, we consider the 34 days RV-detected signal to be a likely planet candidate (TOI 4633 b), and the 272 days transit and RV-detected signal to be a confirmed planet (TOI 4633 c).
5. Analysis of Stellar System
The combination of archival and new high-resolution spectral imaging data revealed a bound companion star. Given the brightness ratio of the two stars of FB /FA = 0.7, we expect both stars to contribute to the spectra. However, there are no observable RV shifts from the companion star, detectable changes in the shape of the absorption lines, nor evidence for double lined spectra. As discussed in Section 3.1, HIRES is able to detect companion stars where Δ RV ≥ 10 km s−1. We assume for the remainder of this paper that the obtained HIRES and SOPHIE spectra are a composite of the light from both stars, where the relative RV shift between the two stars is less than 10 km s−1. Similarly, we assume that the TESS light curve is a composite of the light from both stars. In this section we discuss the properties of the two stars and the stellar configuration.
5.1. Stellar Parameter Determination
In order to determine stellar parameters for this system, we use precise multi-wavelength photometric measurements as well as high-resolution spectra. We note that while the multi-wavelength photometric fits account for the multiple stars in the system, the spectroscopic solutions only consider one star and are subject to error.
5.1.1. Spectroscopic Parameter Determination
To extract stellar parameter values from the spectra, we used a moderate signal-to-noise (per pixel S/N = 46) iodine-free observation obtained as a reconnaissance observation using the HIRES spectrograph on the Keck I telescope (Vogt et al. 1994). We measured the effective temperature (Teff), surface gravity (log g), iron abundance ([Fe/H]), and projected rotational velocity of the star using the tools available in the SpecMatch software package (Petigura 2015). We first corrected the observed wavelengths to be in the observer's rest frame by cross correlating a solar model with the observed spectrum. Then, we fit for Teff, log g, [Fe/H], vsini, and the instrumental point-spread function (PSF) using the underlying Bayesian differential-evolution Markov Chain Monte Carlo (MCMC) machinery of ExoPy (Fulton et al. 2013). At each step in the MCMC chains, a synthetic spectrum is created by interpolating the Coelho (2014) grid of stellar models for a set of Teff, log g, and [Fe/H] values and solar alpha abundance. We convolved this synthetic spectrum with a rotational plus macroturbulence broadening kernel using the prescriptions of Valenti & Fischer (2005) and Hirano et al. (2011). Finally, we performed another convolution with a Gaussian kernel to account for the instrumental PSF, and compared the synthetic spectrum with the observed spectrum to assess the goodness of fit. The priors are uniform in Teff, log g, and [Fe/H], but we assign a Gaussian prior to the instrumental PSF that encompasses the typical variability in the PSF width caused by seeing changes and guiding errors. Five echelle orders of the spectrum were fit separately and the resulting posterior distributions were combined before taking the median values for each parameter. Parameter uncertainties were estimated as the scatter in spectroscopic parameters given by SpecMatch relative to the values for 352 stars in the Valenti & Fischer (2005) sample and 76 stars in the Huber et al. (2013) asteroseismic sample. Systematic trends in SpecMatch values as a function of Teff, log g, and [Fe/H] relative to these benchmark samples were fit for and removed in the final quoted parameter values.
Although the approach described above performs well for main sequence, single-star parameter estimation, calibrations using an empirical spectral library can often result in more robust parameters. As such, we independently determined the stellar parameters of TOI 4633 using SpecMatch-Emp, which follows a similar procedure as that described above but using an empirical library of stellar spectra taken with Keck/HIRES (Yee et al. 2017). While we find that our determinations of Teff, log g, and [Fe/H] are in excellent agreement between the two methods within their respective uncertainties, the determined values of the stellar radius are discrepant (RSpecMatch−Syn = 1.50 ± 0.04 R⊙ and RSpecMatch−Emp = 1.11 ± 0.18 R⊙). In addition to the discrepancy between these two methods, both are affected by the assumption that the light originates from a single star. We, therefore, independently derived the stellar parameters using the spectral energy distribution (SED), as this is able to account for the light contributions of both stars in the system.
5.1.2. SED Fitting
As an independent determination of the stellar parameters, we performed an analysis of the broadband SED of the star together with the Gaia DR3 parallax (with no systematic offset applied; see, e.g., Stassun & Torres 2021), in order to determine an empirical measurement of the stellar radius, following the procedures described in Stassun & Torres (2016); Stassun et al. (2017, 2018). We pulled the BT VT magnitudes from Tycho-2, the JHKS magnitudes from 2MASS, the W1–W4 magnitudes from WISE, the G, GBP, and GRP magnitudes from Gaia, and the FUV and NUV magnitudes from GALEX. Together, the available photometry spans the full stellar SED over the wavelength range 0.2–22 μm (see Figure 6).

Figure 6. Spectral energy distribution of TIC 307958020. Red symbols represent the observed photometric measurements, where the horizontal bars represent the effective width of the passband. Blue symbols are the model fluxes from the best-fit Kurucz atmosphere model (gray) for the combined light of the binary star system. Cyan and red curves represent the Kurucz atmosphere models corresponding to the warmer (larger) and cooler (smaller) stellar components of the system, respectively.
Download figure:
Standard image High-resolution imageFor an initial fit, we treated the SED as arising from a single star, with the fitted parameters being the effective temperature (Teff), surface gravity (log g), and metallicity ([Fe/H]), as well as the extinction AV
, which we limited to the maximum line-of-sight value from the Galactic dust maps of Schlegel et al. (1998). For the initial single-star model fit, we adopted the Teff, log g, and [Fe/H] from the spectroscopically determined values. The goodness of fit was, not surprisingly, only marginally good ( ) and, given the stringent Gaia distance, implied an oversized star with R⋆ ≈ 1.5 R⊙.
Next, we performed a two-component fit using the methodology of Stassun & Torres (2016), solving for the component Teff and R⋆ by requiring the flux-weighted average Teff to agree with the spectroscopic value used above while also requiring the flux ratio FB/FA in the visible to match that determined from the high-contrast imaging, and of course requiring agreement with the strict Gaia distance.
The result, shown in Figure 6, has  and best-fit parameters of AV
= 0.07 ± 0.02, Teff,A = 5800 ± 50 K, RA =1.05 ± 0.05 R⊙, Teff,B = 5600 ± 50 K, and RB = 0.98 ± 0.05 R⊙. Based on the empirical relations of Torres et al. (2010), the hotter/larger star appears to have a mass MA = 1.10 ± 0.06 M⊙, and the cooler/smaller star has MB = 1.05 ± 0.06 M⊙, consistent with an interpretation of main-sequence stars.
and best-fit parameters of AV
= 0.07 ± 0.02, Teff,A = 5800 ± 50 K, RA =1.05 ± 0.05 R⊙, Teff,B = 5600 ± 50 K, and RB = 0.98 ± 0.05 R⊙. Based on the empirical relations of Torres et al. (2010), the hotter/larger star appears to have a mass MA = 1.10 ± 0.06 M⊙, and the cooler/smaller star has MB = 1.05 ± 0.06 M⊙, consistent with an interpretation of main-sequence stars.
Finally, the vsini measurement reported by APOGEE DR16 (vsini = 4.39 km s−1) together with the brighter star's radius implies a maximum rotation period of 12.1 ± 1.3 days. With the gyrochronology relations of Mamajek & Hillenbrand (2008), this implies a minimum age of 1.3 ± 0.3 Gyr, again consistent with unevolved main-sequence stars. As a comparison, the vsini derived using the SpecMatch software package from the HIRES data is 4.25 km s−1, which is also consistent with the system containing main-sequence stars. We note that the vsini estimates are likely strongly affected by the contamination of the companion star. Finally, as mentioned in Section 4.1, the TESS and ASAS-SN data show no signs of measurable rotation and thus a more precise age of this system cannot be determined using gyrochronology.
As the two-component SED analysis is able to account for the light contribution of both stars, we adopt these stellar parameters for the remainder of the paper. All parameters are listed in Table 3.
Table 3. Stellar System Parameters
| Identifiers | Value | Source |
|---|---|---|
| HU | 918 | Hussey (1905) |
| TOI | 4633 | ⋯ |
| TIC | 307958020 | Stassun et al. (2019) |
| Gaia DR3 | 1630906044157332224 | Gaia DR3 a |
| 2MASS | J17072238 + 6228330 | 2MASS b |
| Astrometry | Value | Source |
| αJ2000 | 17:07:22.396 | Gaia eDR3 a |
| δJ2000 | 62:28:33.011 | Gaia eDR3 a |
| Distance (pc) | 95.20 ± 0.24 | Bailer-Jones et al. (2018) |
| π (mas) | 10.552 ± 0.014 | Gaia eDR3 a |
| Spectral Type | early G Dwarf | ⋯ |
| Photometry | Magnitude | Source |
| B | 9.767 ± 0.033 | Tycho-2 c |
| V | 9.017 ± 0.002 | Tycho-2 c |
| J | 7.723 ± 0.030 | 2MASS c |
| H | 7.448 ± 0.044 | 2MASS c |
| K | 7.349 ± 0.024 | 2MASS c |
| W1 | 7.230 ± 0.039 | WISE c |
| W2 | 7.326 ± 0.020 | WISE c |
| W3 | 7.305 ± 0.016 | WISE d |
| SED derived properties | Star A | Star B |
| Effective temperature Teff (K) | 5800 ± 50 | 5600 ± 50 |
| Stellar mass M⋆ (M⊙) | 1.10 ± 0.06 | 1.05 ± 0.06 |
| Stellar radius R⋆ (R⊙) | 1.05 ± 0.05 | 0.98 ± 0.05 |
| orbitize! binary parameters | Prior e | Derived value |
| Semimajor axis abin (au) |
![${ \mathcal U }[0,1000]$](https://content.cld.iop.org/journals/1538-3881/167/5/241/revision1/ajad1d5cieqn6.gif)
|

|
| Eccentricity ebin |
![${ \mathcal U }[0,1]$](https://content.cld.iop.org/journals/1538-3881/167/5/241/revision1/ajad1d5cieqn8.gif)
| 0.91 
|
| Inclination ibin (deg) |
![${ \mathcal U }[0,180]$](https://content.cld.iop.org/journals/1538-3881/167/5/241/revision1/ajad1d5cieqn10.gif)
| 90.1 
|
| ω (deg) |
![${ \mathcal U }[0,180]$](https://content.cld.iop.org/journals/1538-3881/167/5/241/revision1/ajad1d5cieqn12.gif)
|

|
| Ω (deg) |
![${ \mathcal U }[0,180]$](https://content.cld.iop.org/journals/1538-3881/167/5/241/revision1/ajad1d5cieqn14.gif)
|

|
| Phase |
![${ \mathcal U }[0,1]$](https://content.cld.iop.org/journals/1538-3881/167/5/241/revision1/ajad1d5cieqn16.gif)
| 0.42 
|
| Period (years) | derived | 231 
|
| Periastron (au) | derived | 4.5 
|
Notes.
a Gaia early Data Release 3 (eDR3; Gaia Collaboration et al. 2021). b Two-micron All Sky Survey (2MASS; Cutri et al. 2003). c Tycho-2 catalog (Høg et al. 2000). d Wide-field Infrared Survey Explorer catalog (WISE; Cutri et al. 2013). e![${ \mathcal U }[a,b]$](https://content.cld.iop.org/journals/1538-3881/167/5/241/revision1/ajad1d5cieqn20.gif) refers to uniform priors between a and b. The uncertainties in the derived values represent the 68% confidence interval.
refers to uniform priors between a and b. The uncertainties in the derived values represent the 68% confidence interval.Download table as: ASCIITypeset image
5.2. Binary Orbit Modeling
The orbital parameters of the binary system (TOI 4633 AB) were determined by Bayesian parameter estimation using the open-source software "orbitize!" (Blunt et al. 2020). The position angles and angular separations extracted from all of the available imaging data (listed in Table 2) were used as input data. Observations obtained prior to 2011 did not report uncertainties on their measurements. We, therefore, adopted large uncertainties for these archival position angles and angular separations of ± 10 deg and ± 50 mas, respectively. As discussed in Section 3.1, the HIRES data allows us to place an upper limit on the relative motion of the two stars of 10 km s−1. As such, RV values of 0 ± 5 km s−1 at the times of the HIRES observations are used as input RV measurements for the orbitize! model.
We used the parallel-tempered Affine-invariant sampler ptemcee (Foreman-Mackey et al. 2013; Vousden et al. 2016) and adopted priors of 10.55 ± 0.013 mas (Gaia Collaboration et al. 2021) for the parallax and 1.10 ± 0.2 M⊙ and 1.05 ± 0.2 M⊙ for the masses of the primary and secondary stars, respectively (see Section 5.1.2). Due to the lack of more constraining RV measurements, values of ω and Ω that are separated by 180 deg are degenerate, as discussed in Blunt et al. (2020). In order to account for this, we used uniform priors between 0 and 180 deg for both of these parameters. All priors are listed in Table 3.
The sampler was run using 40 temperatures (using an exponential ladder, with each temperature increasing by a factor of  , so the highest temperature is
  ), 1000 walkers per temperature and 50 million steps per walker. Convergence was assessed by visual inspection of the chains. Due to the ambiguity in the two position angles ( ± 180 deg ambiguity) derived from the speckle observations obtained in 2011 and 2022, we ran the orbitize! model four times to account for each possible combination of position angles. Convergence was not reached after 50 million runs when either of the two position angles obtained from speckle observations were rotated by 180 deg from the values listed in Table 2. As such, we will assume for the remainder of this paper that the position angles listed in this table are the most likely to be correct.
We found the binary semimajor axis, eccentricity and inclination to be constrained to abin =  au, ebin = 0.91
 , and ibin = 90.1
 (see Figure 7 for the posterior distributions of these three parameters). This corresponds to a stellar orbital period of 231
 yr. Figure 8 shows 100 model fits to the position angles and angular separation that were randomly sampled from the posteriors. The derived RV model indicates a semi-amplitude of 7.2 km s−1, with a predicted RV shift of less than 0.2 km s−1 during the ground-based RV observational time base.
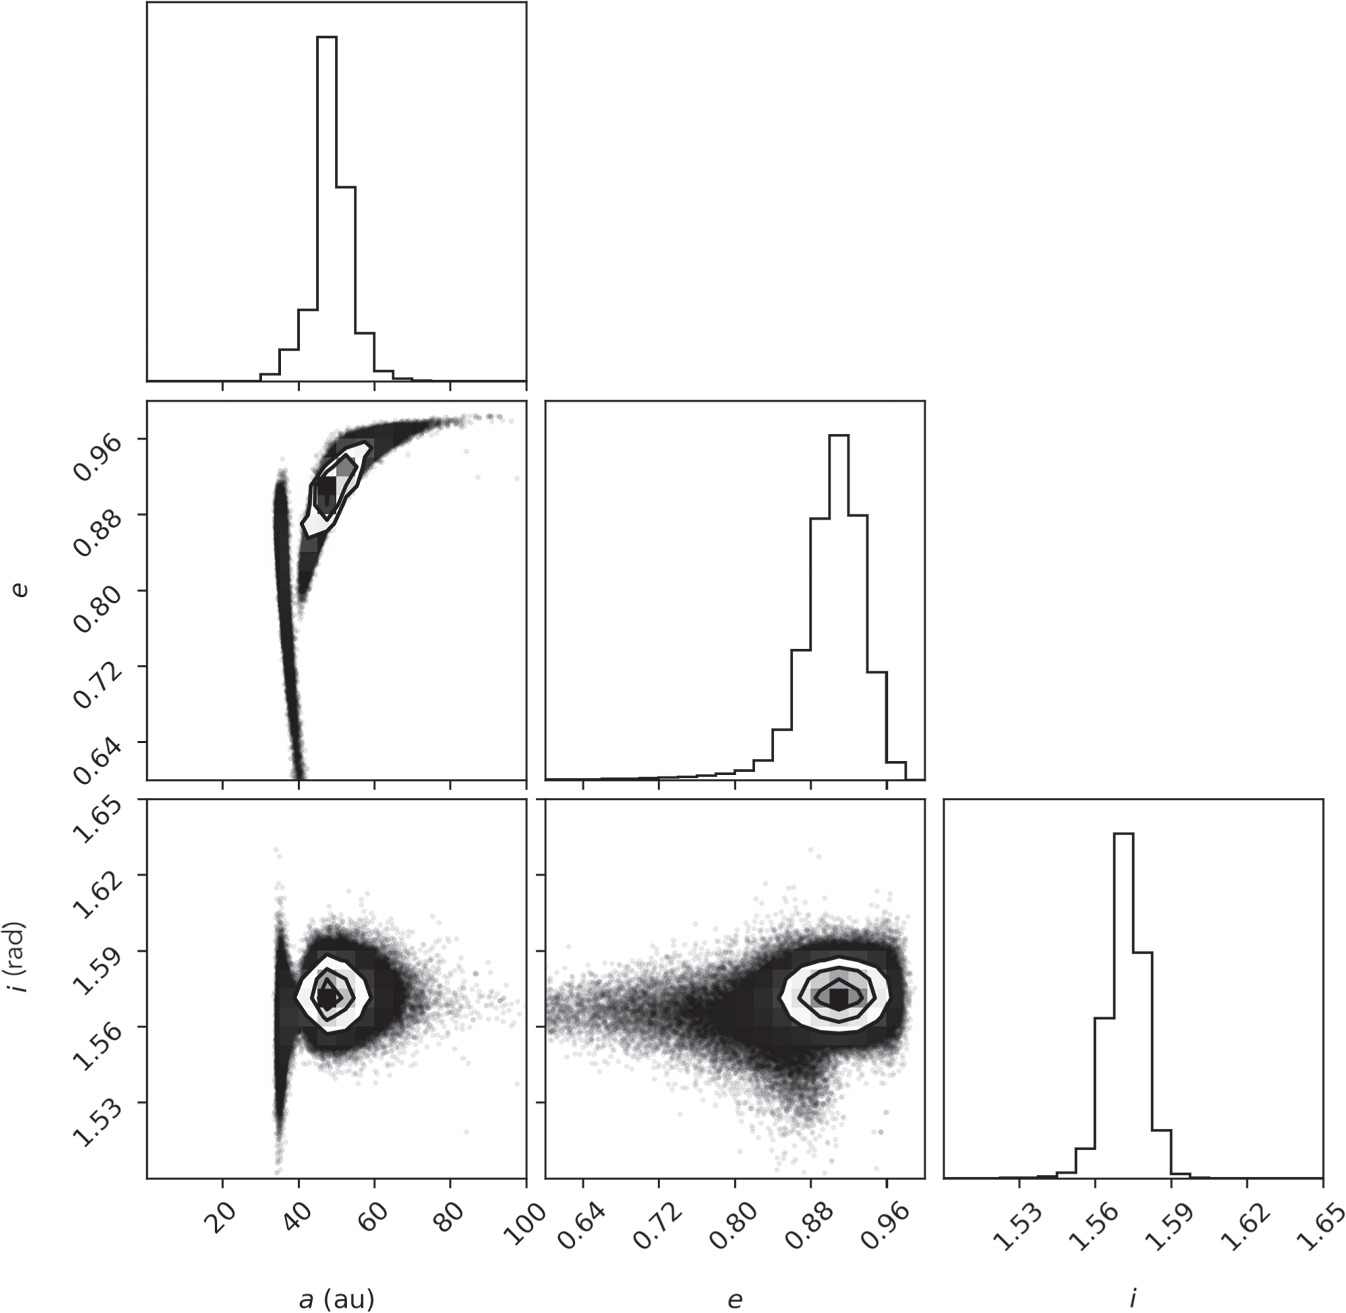
Figure 7. Corner plot of the posteriors of the orbitize! results.
Download figure:
Standard image High-resolution image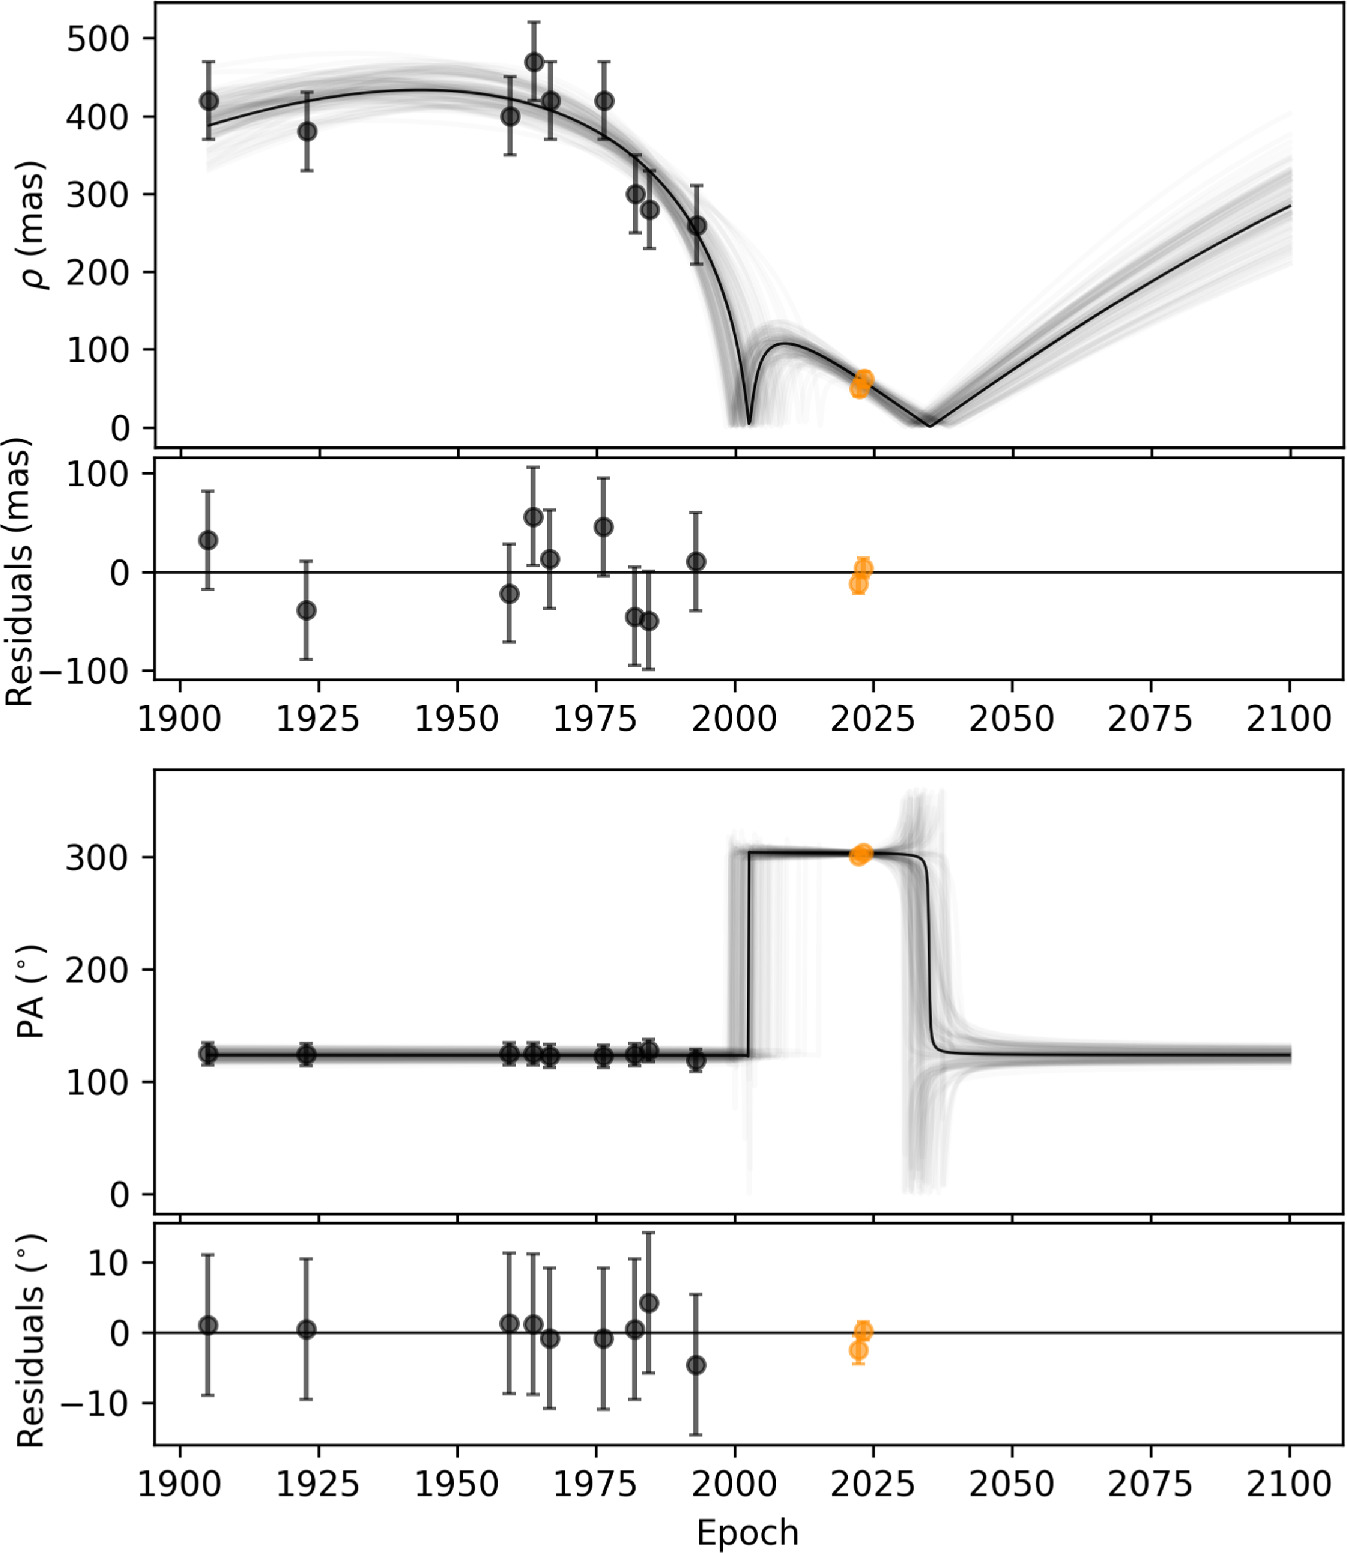
Figure 8. 100 orbits randomly drawn from the posterior distribution of the orbitize! model (gray lines) for the angular separations (top panel) and position angle (bottom panel) of TOI 4633 AB. The best-fit models constructed from the median of the posteriors of each parameter are shown in black, and the residuals to these models are shown below each panel. Archival astrometric data, which have no uncertainties reported in the literature, are shown by the black points. We adopted large uncertainties for these archival position angles and angular separations of ± 10 deg and ± 50 mas, respectively. All newly obtained data with reported uncertainties are shown in orange.
Download figure:
Standard image High-resolution image6. Analysis of Planets
In this Section we discuss the properties of the two observed planetary signals, where we make the assumption that both signals originate from planets that are orbiting the same star. Given the current small angular separation of the two stars, we are unable to determine around which of the two stars either of the planets are orbiting. For the remainder of the paper we report all planet properties under the assumption that star A is the host star for both planets. We note that due to the similarities and large uncertainties in the derived properties of the two stars (MA = 1.10 ± 0.06 M⊙, RA = 1.05 ± 0.05 R⊙; MB = 1.05 ± 0.06 M⊙, RB = 0.98 ± 0.05 R⊙), the derived planet properties agree to within their uncertainties when derived with either of the two stars as the host.
6.1. Joint Transit and RV Modeling
The transit and RV data were jointly modeled using pyaneti (Barragán et al. 2019, 2022a). This open-source software creates marginalized posterior distributions for different orbital parameters by sampling the parameter space using an MCMC approach. The transits are modeled using the limb-darkened quadratic models by Mandel & Agol (2002) while the RV data are fit with two Keplerian RV models. In order to account for an RV offset between the HIRES and SOPHIE data, we allow for a systematic velocity for each instrument and include a jitter term per instrument to account for imperfections in our transit and RV model. For each sector, we used either the 2 minutes cadence or, where available, the 20 s cadence data for the transit model (see Section 2) and both the HIRES and SOPHIE data for the RV fit. All fitted parameters and priors used for the joint modeling are presented in Table 4.
Table 4. System Parameters
| Parameter | Prior a | Value b | Comments |
|---|---|---|---|
| Model Parameters for TOI 4633 b | |||
| Orbital period Porb (days) |
![${ \mathcal U }[33,36]$](https://content.cld.iop.org/journals/1538-3881/167/5/241/revision1/ajad1d5cieqn27.gif)
| 34.15 ± 0.15 | |
| Time of min. conjunction T0 (BJD—2457000) |
![${ \mathcal U }[2787.32,2807.32]$](https://content.cld.iop.org/journals/1538-3881/167/5/241/revision1/ajad1d5cieqn28.gif)
|

| |
Parameterization 
|
![${ \mathcal U }[-1,1]$](https://content.cld.iop.org/journals/1538-3881/167/5/241/revision1/ajad1d5cieqn31.gif)
|

| The code ensures e < 1 |
Parameterization 
|
![${ \mathcal U }[-1,1]$](https://content.cld.iop.org/journals/1538-3881/167/5/241/revision1/ajad1d5cieqn34.gif)
|

| The code ensures e < 1 |
| Doppler semi-amplitude K ( m s−1) c |
![${ \mathcal U }[0,30]$](https://content.cld.iop.org/journals/1538-3881/167/5/241/revision1/ajad1d5cieqn36.gif)
|

| |
| Model Parameters for TOI 4633 c | |||
| Orbital period Porb (days) |
![${ \mathcal U }[271.9,272.1]$](https://content.cld.iop.org/journals/1538-3881/167/5/241/revision1/ajad1d5cieqn38.gif)
|

| |
| Transit epoch T0 (BJD—2457000) |
![${ \mathcal U }[1863.81,1865.81]$](https://content.cld.iop.org/journals/1538-3881/167/5/241/revision1/ajad1d5cieqn40.gif)
|

| |
Parameterization 
|
![${ \mathcal U }[-1,1]$](https://content.cld.iop.org/journals/1538-3881/167/5/241/revision1/ajad1d5cieqn43.gif)
|

| The code ensures e < 1 |
Parameterization 
|
![${ \mathcal U }[-1,1]$](https://content.cld.iop.org/journals/1538-3881/167/5/241/revision1/ajad1d5cieqn46.gif)
|

| The code ensures e < 1 |
| Observed scaled planet radius Rp/R⋆ |
![${ \mathcal U }[0,0.1]$](https://content.cld.iop.org/journals/1538-3881/167/5/241/revision1/ajad1d5cieqn48.gif)
|

| |
| Impact parameter b |
![${ \mathcal U }[0,1.1]$](https://content.cld.iop.org/journals/1538-3881/167/5/241/revision1/ajad1d5cieqn50.gif)
|

| |
| Doppler semi-amplitude K ( m s−1) c |
![${ \mathcal U }[0,30]$](https://content.cld.iop.org/journals/1538-3881/167/5/241/revision1/ajad1d5cieqn52.gif)
|

| 11.5 ms−1, 99% percent upper limit |
| Other Parameters | |||
| Stellar density ρ⋆ (g cm−3) |
![${ \mathcal N }[1.34,0.23]$](https://content.cld.iop.org/journals/1538-3881/167/5/241/revision1/ajad1d5cieqn54.gif)
| 1.35 ± 0.21 | |
| Parameterized limb-darkening coefficient q1 |
![${ \mathcal U }[0,1]$](https://content.cld.iop.org/journals/1538-3881/167/5/241/revision1/ajad1d5cieqn55.gif)
|

| q1 parameter as in Kipping (2013) |
| Parameterized limb-darkening coefficient q2 |
![${ \mathcal U }[0,1]$](https://content.cld.iop.org/journals/1538-3881/167/5/241/revision1/ajad1d5cieqn57.gif)
|

| q2 parameter as in Kipping (2013) |
| Offset velocity HIRES (km s−1) |
![${ \mathcal U }[-0.50,0.50]$](https://content.cld.iop.org/journals/1538-3881/167/5/241/revision1/ajad1d5cieqn59.gif)
|

| |
| Offset velocity SOPHIE (km s−1) |
![${ \mathcal U }[-0.50,0.50]$](https://content.cld.iop.org/journals/1538-3881/167/5/241/revision1/ajad1d5cieqn61.gif)
| −0.0007 ± 0.0034 | |
| Jitter HIRES ( m s−1) |
![${ \mathcal J }[1,100]$](https://content.cld.iop.org/journals/1538-3881/167/5/241/revision1/ajad1d5cieqn62.gif)
|

| |
| Jitter SOPHIE ( m s−1) |
![${ \mathcal J }[1,100]$](https://content.cld.iop.org/journals/1538-3881/167/5/241/revision1/ajad1d5cieqn64.gif)
|

| |
| Jitter TESS (ppm) |
![${ \mathcal J }[1,100]$](https://content.cld.iop.org/journals/1538-3881/167/5/241/revision1/ajad1d5cieqn66.gif)
|

| |
| Derived Parameters TOI 4633 b | |||
Planet minimum mass  (M⊕)
c (M⊕)
c
| ⋯ |

| |
| Eccentricity e | ⋯ |

| |
| Argument of periastron w (deg) | ⋯ |

| |
| Derived Parameters TOI 4633 c | |||
| Planet mass (M⊕) c | ⋯ |

| 123 M⊕, 99% percent upper limit |
| Observed planet radius (R⊕) | ⋯ |

| |
| Corrected planet radius (R⊕) | ⋯ |

| Light contribution corrected |
| Semimajor axis a (au) | ⋯ | 0.847 ± 0.061 | |
| Eccentricity e | ⋯ |

| |
| Argument of periastron w (deg) | ⋯ |

| |
| Transit duration τ (hours) | ⋯ |

| |
| Orbit inclination i (deg) | ⋯ |

| |
| Insolation Fp (F⊕) | ⋯ |

| |
Notes. All parameters are calculated based on the assumption that both planets orbit star A.
a![${ \mathcal U }[a,b]$](https://content.cld.iop.org/journals/1538-3881/167/5/241/revision1/ajad1d5cieqn80.gif) refers to an uniform prior between a and b,
refers to an uniform prior between a and b, ![${ \mathcal N }[a,b]$](https://content.cld.iop.org/journals/1538-3881/167/5/241/revision1/ajad1d5cieqn81.gif) to a Gaussian prior with mean a and standard deviation b, and
to a Gaussian prior with mean a and standard deviation b, and ![${ \mathcal J }[a,b]$](https://content.cld.iop.org/journals/1538-3881/167/5/241/revision1/ajad1d5cieqn82.gif) to the modified Jeffrey's prior as defined by (Gregory 2005 Equation (16)).
b
Inferred parameters and errors are defined as the median and 68.3 % credible interval of the posterior distribution.
c
Due to the unknown effect of the second star on the observed semi-amplitude, these are lower limits.
to the modified Jeffrey's prior as defined by (Gregory 2005 Equation (16)).
b
Inferred parameters and errors are defined as the median and 68.3 % credible interval of the posterior distribution.
c
Due to the unknown effect of the second star on the observed semi-amplitude, these are lower limits.Download table as: ASCIITypeset image
The parameter space was sampled using an MCMC approach with 250 individual chains and posterior distributions were generated using 5000 iterations of converged chains with a thin factor of 10. The inferred parameters extracted from the posteriors are shown in Table 4 while the inferred models are shown in Figures 9 and 10. We note that we recover relatively large jitter terms in the RV modeling of  m s−1 and
  m s−1 for HIRES and SOPHIE, respectively. This can be caused by a sub-optimal RV model or unknown systematics affecting the RV data. We suspect that the contamination from the second star also contributes to the observed scatter. We see no evidence of a long-term RV trend.
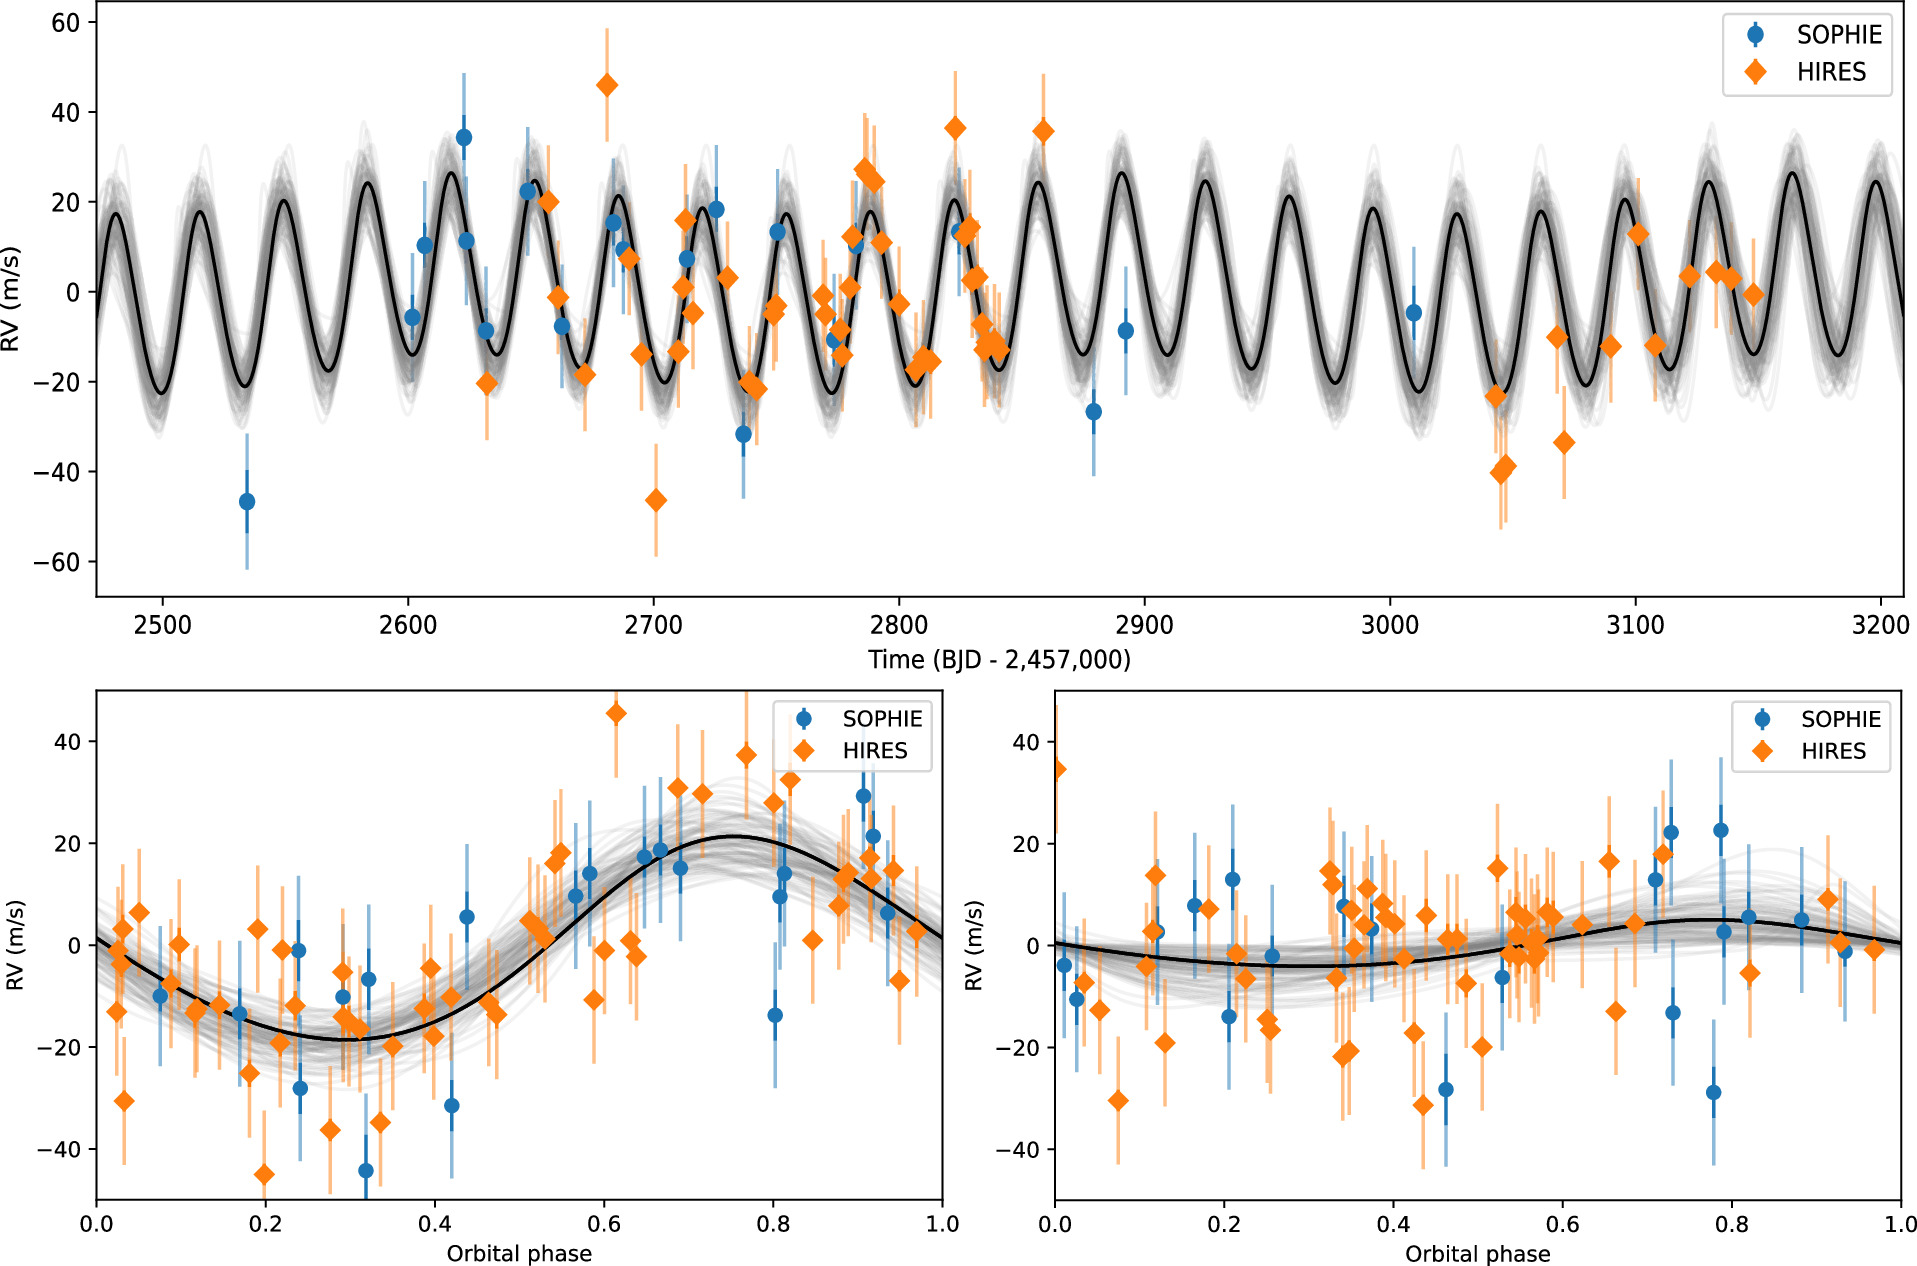
Figure 9. RV time-series (top) and phase-folded plots for TOI 4633 b (lower left) and TOI 4633 c (lower right). SOPHIE (blue circles) and HIRES (orange diamonds) RV measurements are shown following the subtraction of the systemic velocities for each instrument. The light colored error bars show the uncertainties accounting for the jitter. Solid black lines show the inferred median model. Gray lines show models made with 100 random samples from the posterior distributions.
Download figure:
Standard image High-resolution image
Figure 10. Phase-folded light curve for TOI 4633 c. 2 minutes and 20 s cadence TESS observations are shown in light gray. Solid color circles represent 60 minutes binned data. The inferred transit model is shown with a solid black line.
Download figure:
Standard image High-resolution imageWe checked for additional periodic signals in the data using the PyAstronomy Generalized Lomb-Scargle Periodogram on the residual RV data. We find a significant peak at a period of 182.8 days with a false alarm probability of ∼1.5%. However, as this is half of the orbital period of the Earth, we consider this to most likely be a systematic effect and do not discuss this signal any further.
6.1.1. Effects of Companion Star on Planet Radius and Mass
Planet radii are calculated based on the observed transit depth and the measured radius of the host star. However, for multi-stellar systems, the relationship of the observed transit depth and the true planet radius depends on the brightness ratio of the brightness of the star which is being transited to the total brightness of all the stars in the system (Furlan et al. 2017). Assuming that the planet transits star A and given FB/FA = 0.7, we correct the observed planet radius of TOI 4633 c (Rc,obs =  R⊕) by a factor of
  , resulting in a true planet radius of
  R⊕.
R⊕.
Similarly, the presence of the second star acts to reduce the observed amplitude of the RV shifts. The amount by which the observed signal is reduced depends on the relative strengths of the absorption lines (line depths) of both stars, as well as on their rotational velocities (line widths). As we are not able to disentangle the two spectra we cannot quantify the effect of the second star on the RV amplitude. As such, the observed RV amplitudes, and therefore the derived planet masses, are lower limits. However, given the radius of planet c and the known distribution of planet masses for a given planetary radius (as shown in Figure 11), we consider it unlikely for planet c to have a mass significantly greater than 47 M⊕.
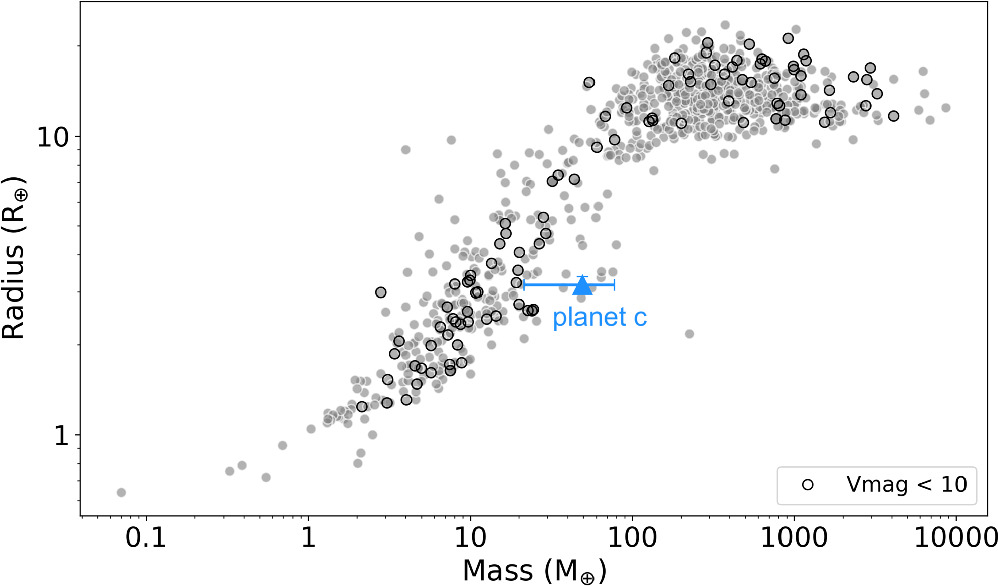
Figure 11. Planet radius vs. planet mass for all confirmed planets listed in the NASA exoplanet archive with a mass measurement with 30% uncertainty or better. Bright systems (mV < 10) are highlighted with a black outline. TOI 4633 c is shown by the blue triangle, where uncertainties correspond to our radial velocity fit. Although the existence of a second star in this system means that the radial velocity amplitude is diluted and thus the true planet mass may be larger, the lack of planets with the radius of TOI 4633 c at masses larger than 47 M⊕ suggests that the planet is unlikely to be significantly more massive than what is reported here.
Download figure:
Standard image High-resolution image6.2. Search and Recovery of Transit Signals
In order to search for transits of planet candidate b using the TESS data, and to search for additional transit signals, we searched the full TESS light curve using the Box Least Squares (BLS; Kovács et al. 2002) algorithm. Before running the BLS search, we masked the transit signals of TOI 4633 c and used an iterative nonlinear filter to subtract residual systematics on timescales >1.7 days (Aigrain & Irwin 2004). We carried out the BLS search on an evenly sampled frequency grid ranging from 0.00125 to 1 d−1 (1–800 days). The signal detection efficiency (SDE), defined as the ratio of the highest peak in the SNR periodogram relative to its standard deviation, was used to determine the significance of the recovery of the signal. The algorithms found no additional signals above an SDE of 7.6.
Furthermore, we used an injection and recovery test to quantify the detectability of additional planets in the TESS data, following the methodology outlined in Eisner et al. (2020b). In brief we injected transit signals generated using the batman package (Kreidberg 2015) into the PDC TESS light curve. The injected transit signals corresponded to planets with radii ranging from 1 to 12.5 R⊕ and periods ranging from 1 to 300 days, both sampled randomly from a log-uniform distribution. The impact parameter and eccentricity were assumed to be zero for simplicity. We used the stellar parameters given in Table 3 and adopted a quadratic limb-darkening law with q1 and q2 of 0.16 and 0.59, respectively, as taken from Table 15 in Claret (2017).
We simulated and injected transits for 500,000 planets and used the BLS methodology described above to try to recover each injected signal. For each simulation we identified the highest peak in the BLS periodogram. The signal was considered to be correctly identified when the corresponding period and orbital phase were within 1% of the injected values. The fraction of recovered signals over a grid of period and radius bins was used to evaluate the completeness of the injection and recovery search. The radius and period bins have widths of 0.2 R⊕ and 10 days respectively, as shown in Figure 12. Using the planet mass–radius scaling relations for volatile-rich planets by Otegi et al. (2020) and the measured minimum planet mass of 109 M⊕, planet candidate b has an estimated radius of ∼13.7 R⊕ corresponding to a minimum density of 0.11 g cm−3 (assuming b = 0). Given the light contribution of the companion star which would act to dilute the transit, this would result in an observed radius of ∼10.7 R⊕ (indicated by the black cross). Figure 12 shows that the properties of planet candidate b are such that if the planet were transiting we would be able to identify the transit events in the TESS data. This, in turn, allows us to constrain the inclination of planet candidate b to i < 88.5 deg.

Figure 12. The recovery completeness of injected transit signals into the light curve of TOI 4633 as a function of the radius and orbital period. The radius of planet candidate b was estimated using the planet mass–radius scaling relations for volatile-rich planets by Otegi et al. (2020). The signals were recovered using a BLS search. The figure clearly highlights that if planet candidate b were aligned such that it would transit star A, the transit events would have been detected by the BLS search algorithm.
Download figure:
Standard image High-resolution image6.3. Dynamical Stability
The orbital periods of planet candidate b and planet c are much shorter than the period of the binary orbit, indicating that this is a circumstellar, or "s-type" system. Furthermore, the large period ratio between the planets' orbits and the binary orbits indicate that this system is in a hierarchical configuration. Additionally, the significant eccentricity of the binary orbit and that the mutual inclination between the planets and the binary orbit is not known indicates that the stability of this system can be analyzed in light of the Eccentric Kozai–Lidov mechanism (see e.g., Kozai 1962; Lidov 1962; Naoz 2016), where the system is unstable if the mutual inclination between the binary and the planets lies between the "Kozai Angles," that is 39 2 ≤ imut ≤ 14077. Within these angles, the planets will undergo large oscillations in their eccentricities and inclinations. We explore the stability of orbital configurations with low mutual inclinations using the framework of Quarles et al. (2020), who numerically constrain the stability regime of Earth-mass planets in circumstellar orbits in binary systems with approximately 700 million N-body simulations. The grid map of Quarles et al. (2020) indicates that, in the prograde orbit case, without TOI 4633 b, the transiting planet TOI 4633 c remains stable against perturbation by the binary orbit if its mutual inclination with the binary orbit (im,bin−c) is between 0° and 45°.
However, as this is likely a two-planet system, planet–planet interactions should be considered. It has been shown that planet–planet interactions (and general-relativistic precession of the periapsis) can suppress eccentricity oscillations and destabilization from the influence of an outer perturber (see e.g., Naoz 2016; Denham et al. 2019; Wei et al. 2021; Faridani et al. 2022). In this system, however, the period ratio between the two planets is too large for planet–planet interactions to meaningfully stabilize TOI 4633 c against the perturbations from the binary if the binary and the planets have meaningful mutual inclination (as calculated using Equation (10) from Denham et al. 2019). Therefore, destabilizing planet–planet interactions, such as scattering, are considered.
Figure 13 shows the results of 600 N-body simulations of the TOI 4633 system (with TOI 4633 A hosting the planets) under three scenarios. The scenarios are (from left-to-right) (1) where TOI 4633 b is not included, (2) where TOI 4633 b has an initial inclination that narrowly avoids transit (i ∼ 88°) but initially has a mutual inclination of 2° or less with TOI 4633 c, and (3) where TOI 4633 b is initially coplanar with the binary orbit. For each scenario, the average eccentricity of TOI 4633 c during the last 10% of each simulation is plotted against TOI 4633 c's initial mutual inclination with the binary orbit. In each run, the longitude of ascending node and argument of periapsis of TOI 4633 c are randomized, its eccentricity is initialized to 0.118, and TOI 4633 b (if present) has the same longitude of ascending node and argument of periapsis as TOI 4633 c in the second scenario or the binary orbit in the third scenario. The runs were performed using the N-body code MERCURY (Chambers 1999). This version of MERCURY includes the first post-Newtonian term accounting for general-relativistic precession, (M. Payne, private communication).

Figure 13. Outcome of simulations organized by mass and initial mutual inclination between TOI 4633c and the binary orbit. We show 600 MERCURY integrations run for 106 yr each across three scenarios indicated by the labels on the figures: (1) without the 34 days planet, (2) where TOI 4633b has initial inclination of ∼88° narrowly avoiding transit and is coplanar with TOI 4633c, and (3) where TOI 4633b is coplanar with the binary orbit. The x-axis is the initial mutual inclination set between TOI 4633c and the binary orbit, and the y-axis is the average eccentricity of TOI 4633c during the final 10% of the integration time. Each simulation is represented by a point–blue for runs that remain stable and red for unstable.
Download figure:
Standard image High-resolution imageThe possible orbits of the planets in the system can be constrained by eliminating orbits that rapidly become unstable. The runs presented in Figure 13 only ran for 106 yr, a short time compared to the likely age of the system (estimated to be around 1.3 Gyr), meaning that unstable initial conditions can be excluded from consideration, and the orbits of the planets can be constrained to only orbits that remain stable. We find that without TOI 4633 b, TOI 4633 c is stable for a wide range of mutual inclinations with the binary–including many retrograde orbits, where mutual inclinations with the binary below 45° or above 125° (retrograde) remain stable. If TOI 4633 b is included coplanar with TOI 4633 c, TOI 4633 c again remains stable if its mutual inclination with the binary is below 45°, but its range of stable retrograde orbits is lessened to above 145°. When TOI 4633 b is initially coplanar with the binary, the stable regime of TOI 4633 c expands slightly for both prograde orbits–stable up to ∼55°, but not for retrograde orbits where it is still only stable if its mutual inclination with the binary is above 145°.
Between the three scenarios, we find that the presence of TOI 4633 b is a lightly destabilizing presence in the system, reducing the number of stable retrograde orbital configurations. Planet–planet interactions are not sufficient to suppress eccentricity excitation of TOI 4633 c against perturbations from the binary if there is significant mutual inclination between the planets and the binary. Moreover, because planet–planet interactions are not stabilizing TOI 4633 c against perturbation, the influence of the masses of TOI 4633 b and TOI 4633 c within their allowed ranges are minor. This is because scattering is caused by perturbations by the binary rather than arising from the planet–planet interactions, so whether scattering occurs is not affected by varying the planet masses within their allowed uncertainties.
We note that the choice of host star (whether the planets orbit TOI 4633 A or TOI 4633 B) is not expected to significantly affect these results. Using the grids by Quarles et al. (2020), we show that for mutual inclination (im,bin−c) between 0° and 45°, planet c would be stable orbiting around either of the two stars in the binary. As such, with the current available data, we cannot use stability arguments to determine around which of the two stars the planets are orbiting. Furthermore, as previously discussed, due to the similar masses and radii of the two stars in the binary, the derived planet properties are the same to within their uncertainties with either of the two stars as the planet host.
7. Discussion and Conclusion
The TOI 4633 system consists of two G-type stars, a 272 days period transiting planet and a 34 days period non-transiting planet candidate. The system stands out from other transiting planet systems due to (i) the long orbital period of planet c which places it in the habitable zone; (ii) the brightness of the system; and (iii) the similar-mass, bound stellar companion.
7.1. Long-period Planet around a Bright Star
To date, there is a distinct lack of confirmed transiting planets with long orbital periods, with only 175 planets with periods longer than 100 days, and 40 with periods longer than 250 days (only 5 of which are brighter than Vmag = 12). 43 As such, with a period of ∼272 days and a host star brightness of Vmag = 9.0, planet c lies in an under-explored region of parameter space, as shown in Figure 14. The figure shows the planet mass versus orbital period for all confirmed planets listed in the NASA exoplanet archive with a mass measurement with 30% uncertainty or better as gray points, and highlights bright systems (mV < 10) in color. Bright systems with only one planet detected are shown as orange circles, while bright systems with more than one planet are shown as purple squares. Planet candidate b and c are shown by the black cross and triangle, respectively. The figure highlights a lack of confirmed planets with mass measurements to better that 30% residing in bright (V<10) multi-planet systems. Furthermore, it shows that planet c is the second longest-period planet known around a bright star; and that if both planets are orbiting around the same star, TOI 4633 would be one of only a few bright, multi-planet systems. The difficulty of detecting long-period planets is illustrated by the fact that the transit probability of a planet at the semimajor axis of TOI 4633 c is 0.6%. Overall, this highlights the importance of further characterization of TOI 4633 in order to help further our understanding of planetary system demographics. Particularly, the brightness of the host star makes TOI 4633 c a prime candidate for further ground- and space-based characterization.
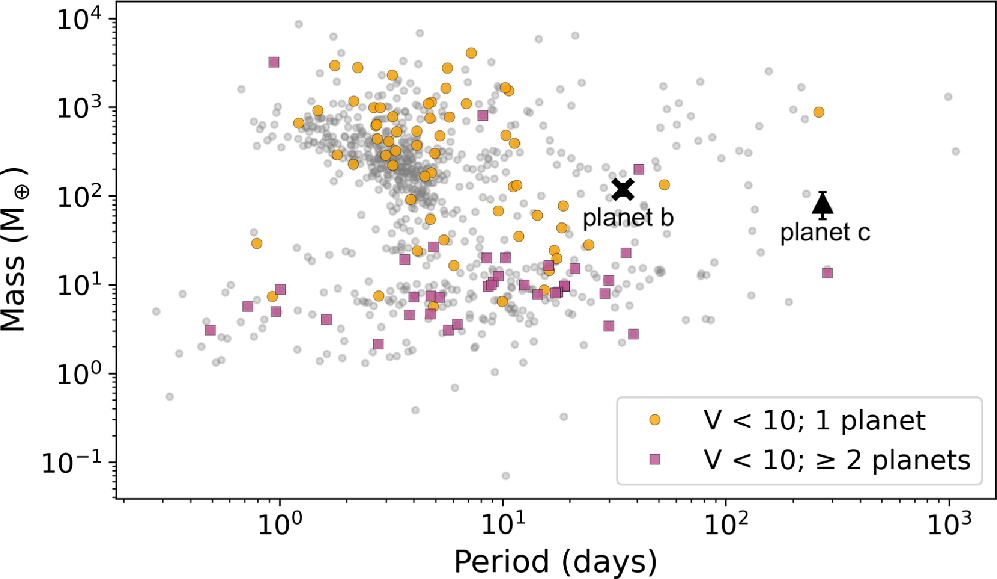
Figure 14. Planet mass vs. planet orbital period for all systems with masses measured to 30% or better uncertainty. We have highlighted planets around bright stars in color. Within the bright star sample, we distinguish between single-planet systems (orange circles) and systems with more than one planet (purple squares). TOI 4633 c is the second longest-period planet in a bright host star system (however, we do note that planet c does not have a mass measured to 30% or better uncertainty). Furthermore, both planets in the system are fairly high mass and likely not rocky, which is unusual compared to the confirmed population of multi-planet systems.
Download figure:
Standard image High-resolution image7.2. Two Planets, Two Stars
The combination of new and archival high-contrast imaging data dating back to 1905 showed that the system is comprised of two stars (abin =  au, ebin =
  , Pbin =
  yr). Due to the proximity of the two stars, we are unable to determine around which star the planets orbit, or whether the two planets orbit the same star.
Despite the large fraction of stars that reside in binaries, the known sample of confirmed planets in binaries remains limited. The catalog of exoplanets in binary star systems (Schwarz et al. 2016) lists 154 systems containing a total of 217 planets. Out of these, 27 are P-type ("circumbinary planets") and 190 are S-type ("circumstellar planets"). The properties of the S-type planets are shown in Figure 15 on the binary semimajor axis versus planet orbital period plane. Planets listed as having been detected using the transit method (74 planets) and the radial velocity method (107 planets) are depicted by black triangles and blue crosses, respectively. The properties of TOI 4633 b and c are shown in red. As highlighted by this figure, the stellar semimajor axis of TOI 4633 AB, of ∼48.6 au, places TOI 4633 in an under-sampled region of parameter space, with only 18 confirmed planets around a star with a binary semimajor axis less than that of TOI 4633 AB, only two of which are transiting. Furthermore, it highlights that planet c has the longest orbital period of any confirmed transiting planet in an S-type binary. In addition, there are currently only a handful of circumstellar systems where both stars are known to host a planet (e.g., Teske et al. 2016a, 2016b). Thus, distinguishing around which star these planets orbit will, in the future, allow for a study of how differences in the host star properties (e.g., chemical abundances) can result in different planet properties.
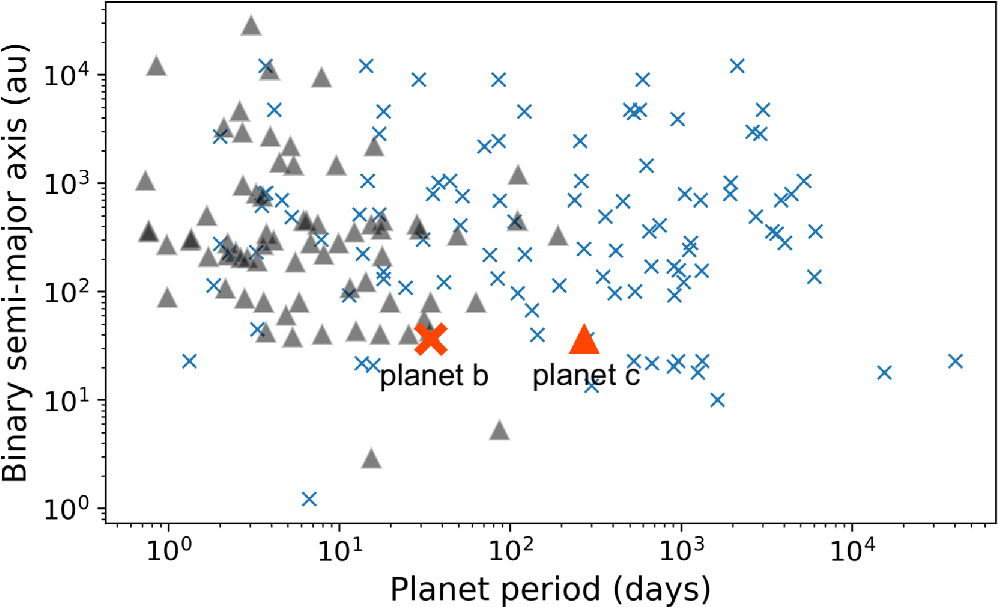
Figure 15. Binary semimajor axis vs. planet period for planetary systems with more than one star. Transiting planets are shown as triangles, while radial velocity-detected planets are shown as crosses. TOI 4633 planets are shown in red. TOI 4633 has a smaller binary separation than most planet-hosting binary systems, and TOI 4633 c is the longest-period transiting planet currently known in a binary system.
Download figure:
Standard image High-resolution imageStellar multiplicity is widely believed to affect planet formation and evolution. However, the extent and details of the effect of a companion star remain topics of debate. For example, studies have suggested that giant planets on short orbital periods are preferentially found in systems with wide stellar companions (e.g., Wang et al. 2015a; Ngo et al. 2016; Ziegler et al. 2018; Moe & Kratter 2021a; Ziegler et al. 2021) due to the effect of the companion star triggering planet inward migration. Similarly, Moe & Kratter (2021a) combined a variety of RV and high-resolution imaging surveys to show that planet occurrence rates are suppressed as a function of binary separation (i.e., smaller binary semimajor axes result in a lower occurrence of giant planets). Moe & Kratter (2021a) also show that at a binary separation of TOI 4633 AB ∼ 48.6 au, the observed occurrence rate of planets is around 50% less compared to field stars. Other studies suggest that there is a suppression of transiting planets in S-type systems, due to the stellar companion disrupting the orbital coplanarity (e.g., Wang et al. 2015a).
Recent studies have also been investigating whether binary orbital parameters (e.g., binary inclination and eccentricity) affect planet formation and observed planet properties. For example, Behmard et al. (2022), Christian et al. (2022), Lester et al. (2023), and Dupuy et al. (2022) provide observational evidence that suggests that the orbital planes of the binary stars are preferentially aligned with the orbital planes of the planet(s).
In addition to allowing for population studies that can inform theories of planet formation and migration, planets in binary systems are interesting due to the fact that the two stars formed simultaneously and thus are expected to have the same chemical abundance at the time of formation. As such, any observed differences in the chemical composition of the stars could be related to differences in the outcomes of planet formation and therefore may help provide constraints on how planet formation affects stellar properties (e.g., Teske et al. 2016a). In turn, the identification of a correlation between certain chemical abundances and planet formation could help improve target selection of future space missions searching for planets, based on a single spectrum of the star. Alternatively, observed differences in chemical compositions between the two stars could indicate recent planet engulfment (Oh et al. 2018; Behmard et al. 2023). Even though the two stars in this binary are currently too close to one another to be able to separate their spectra and therefore to measure their individual chemical abundances, our model of the orbit indicates that in ∼30 yr time the two stars will be separated by ∼150 mas, which will allow us to observe the individual stars using instruments such as the Keck Planet Imager and Characterizer (Delorme et al. 2020).
7.3. TOI 4633 c: A Mini-Neptune in the Habitable Zone
The search for exoplanets in the habitable zones of their host stars has been a focal point in the field of exoplanet research, where the habitable zone is defined as the region around a star where the surface temperature is favorable for liquid water to exist. We estimate the location of the habitable zone around TOI 4633 following the prescriptions defined by Kopparapu et al. (2014). The habitable zone boundaries of "Recent Venus," "Maximum Greenhouse," and "Runaway Greenhouse" conditions are shown in Figure 16 (for more details on how these boundaries are defined see Kopparapu et al. 2014). Using this definition of the habitable zone we find that TOI 4633 c, with an insolation of  F⊕, lies inside the inner edge of the potentially habitable region of the star between the Recent Venus and Maximum Greenhouse boundaries. Using the Stefan–Boltzman law and assuming an albedo equivalent to that of Neptune (0.29), we show that the effective surface temperature of planet c is ∼290 K when only the energy contribution of star A is considered. When accounting for the energy contribution of stars A and B at the time of periastron (stellar separation ∼4.5 au), the effective surface temperature increases to ∼420 K.

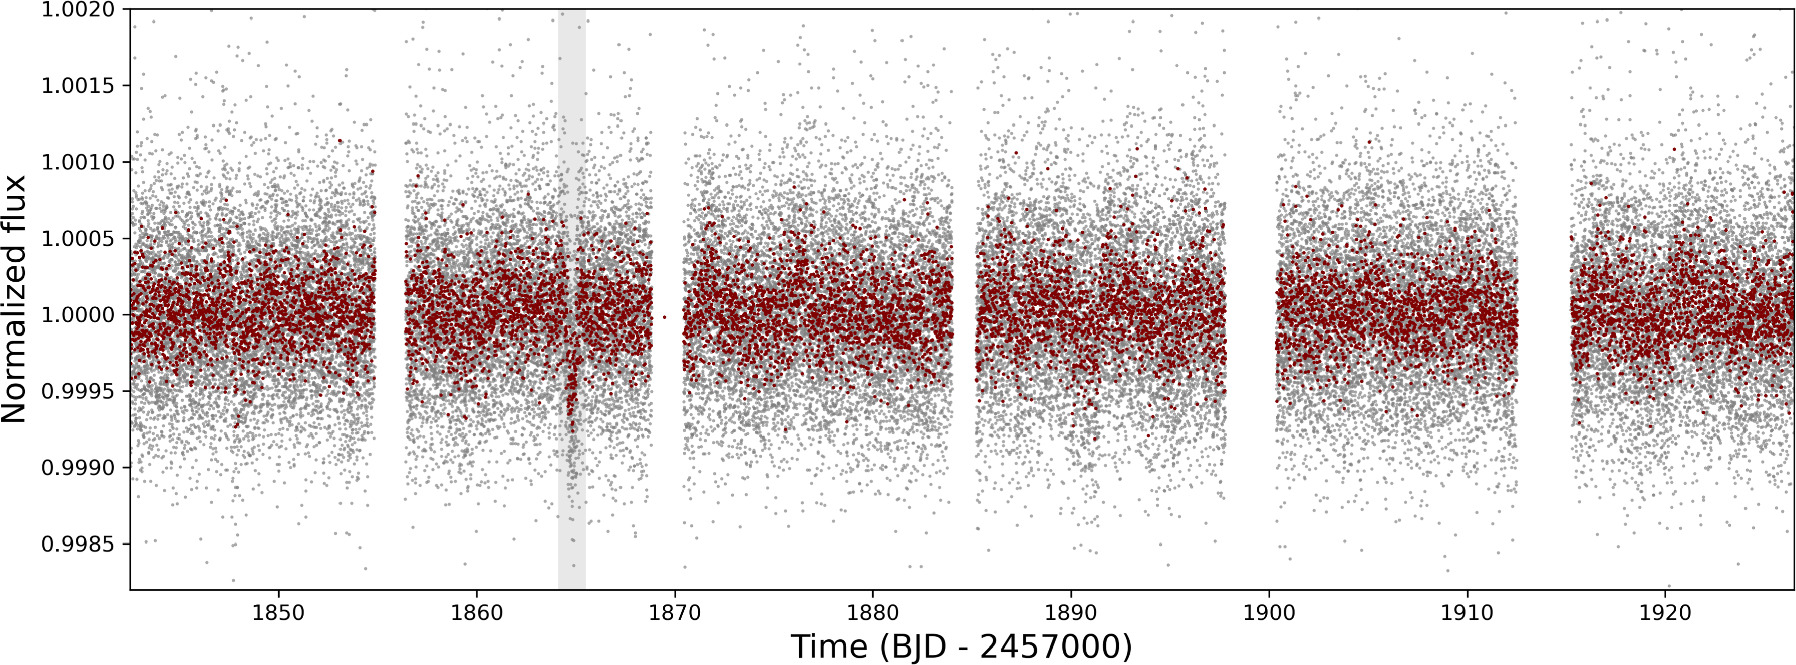
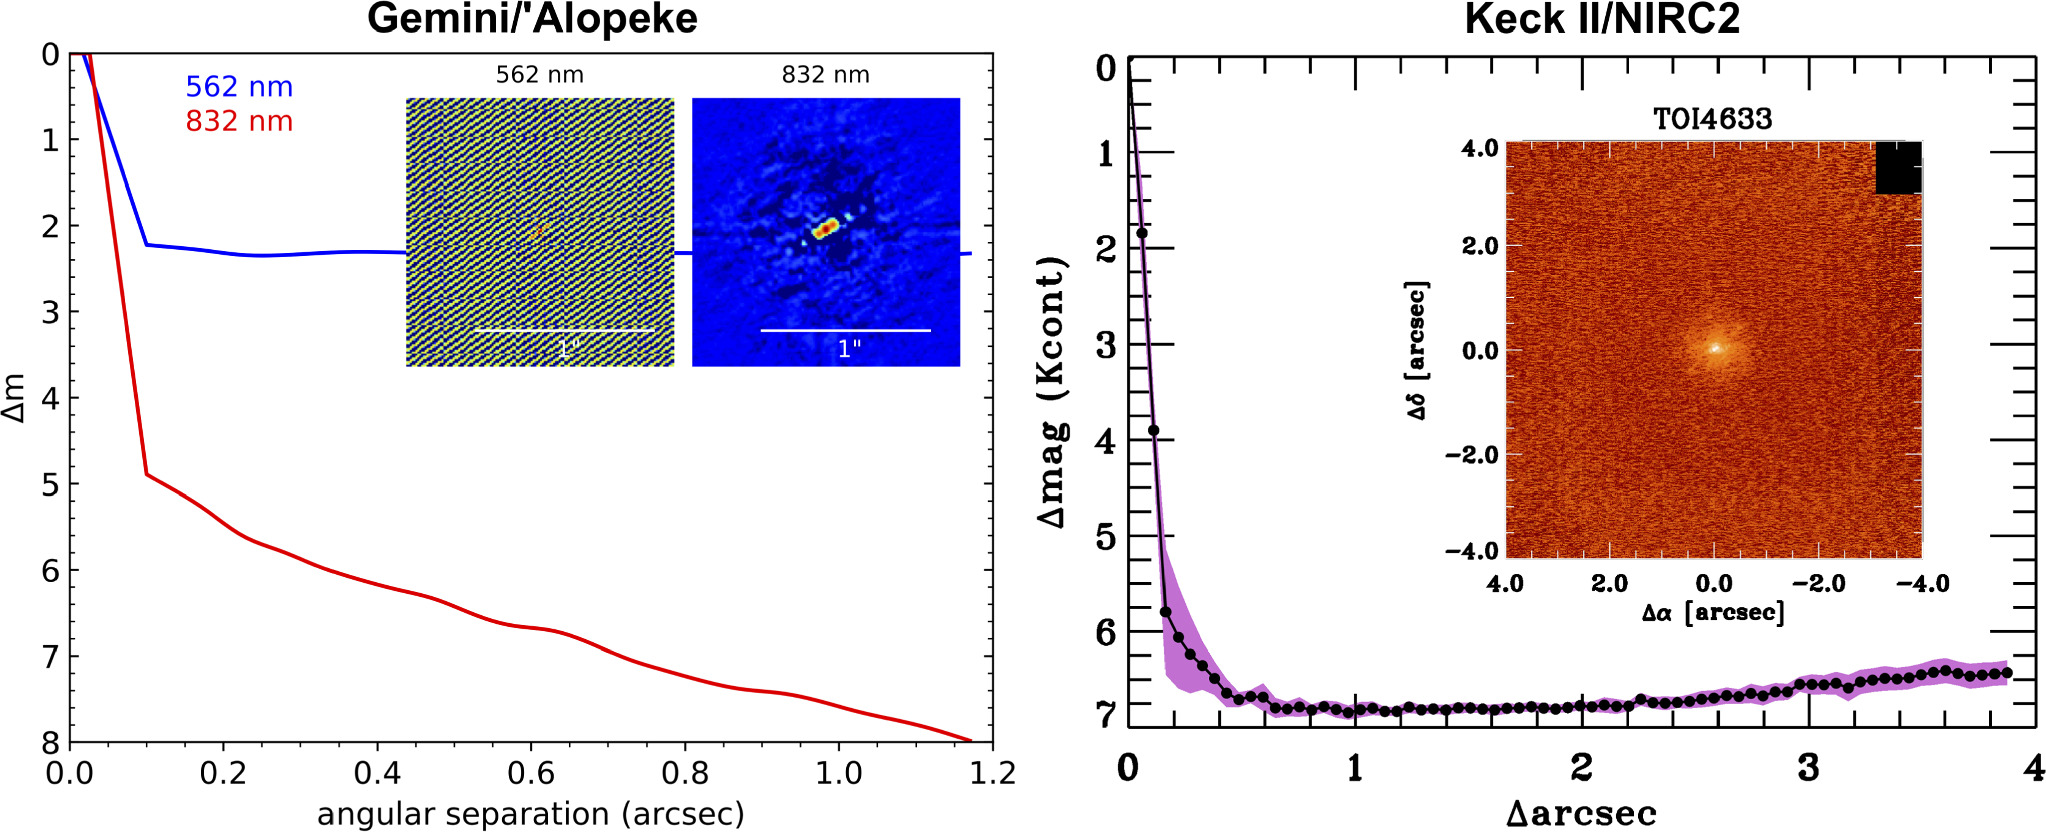
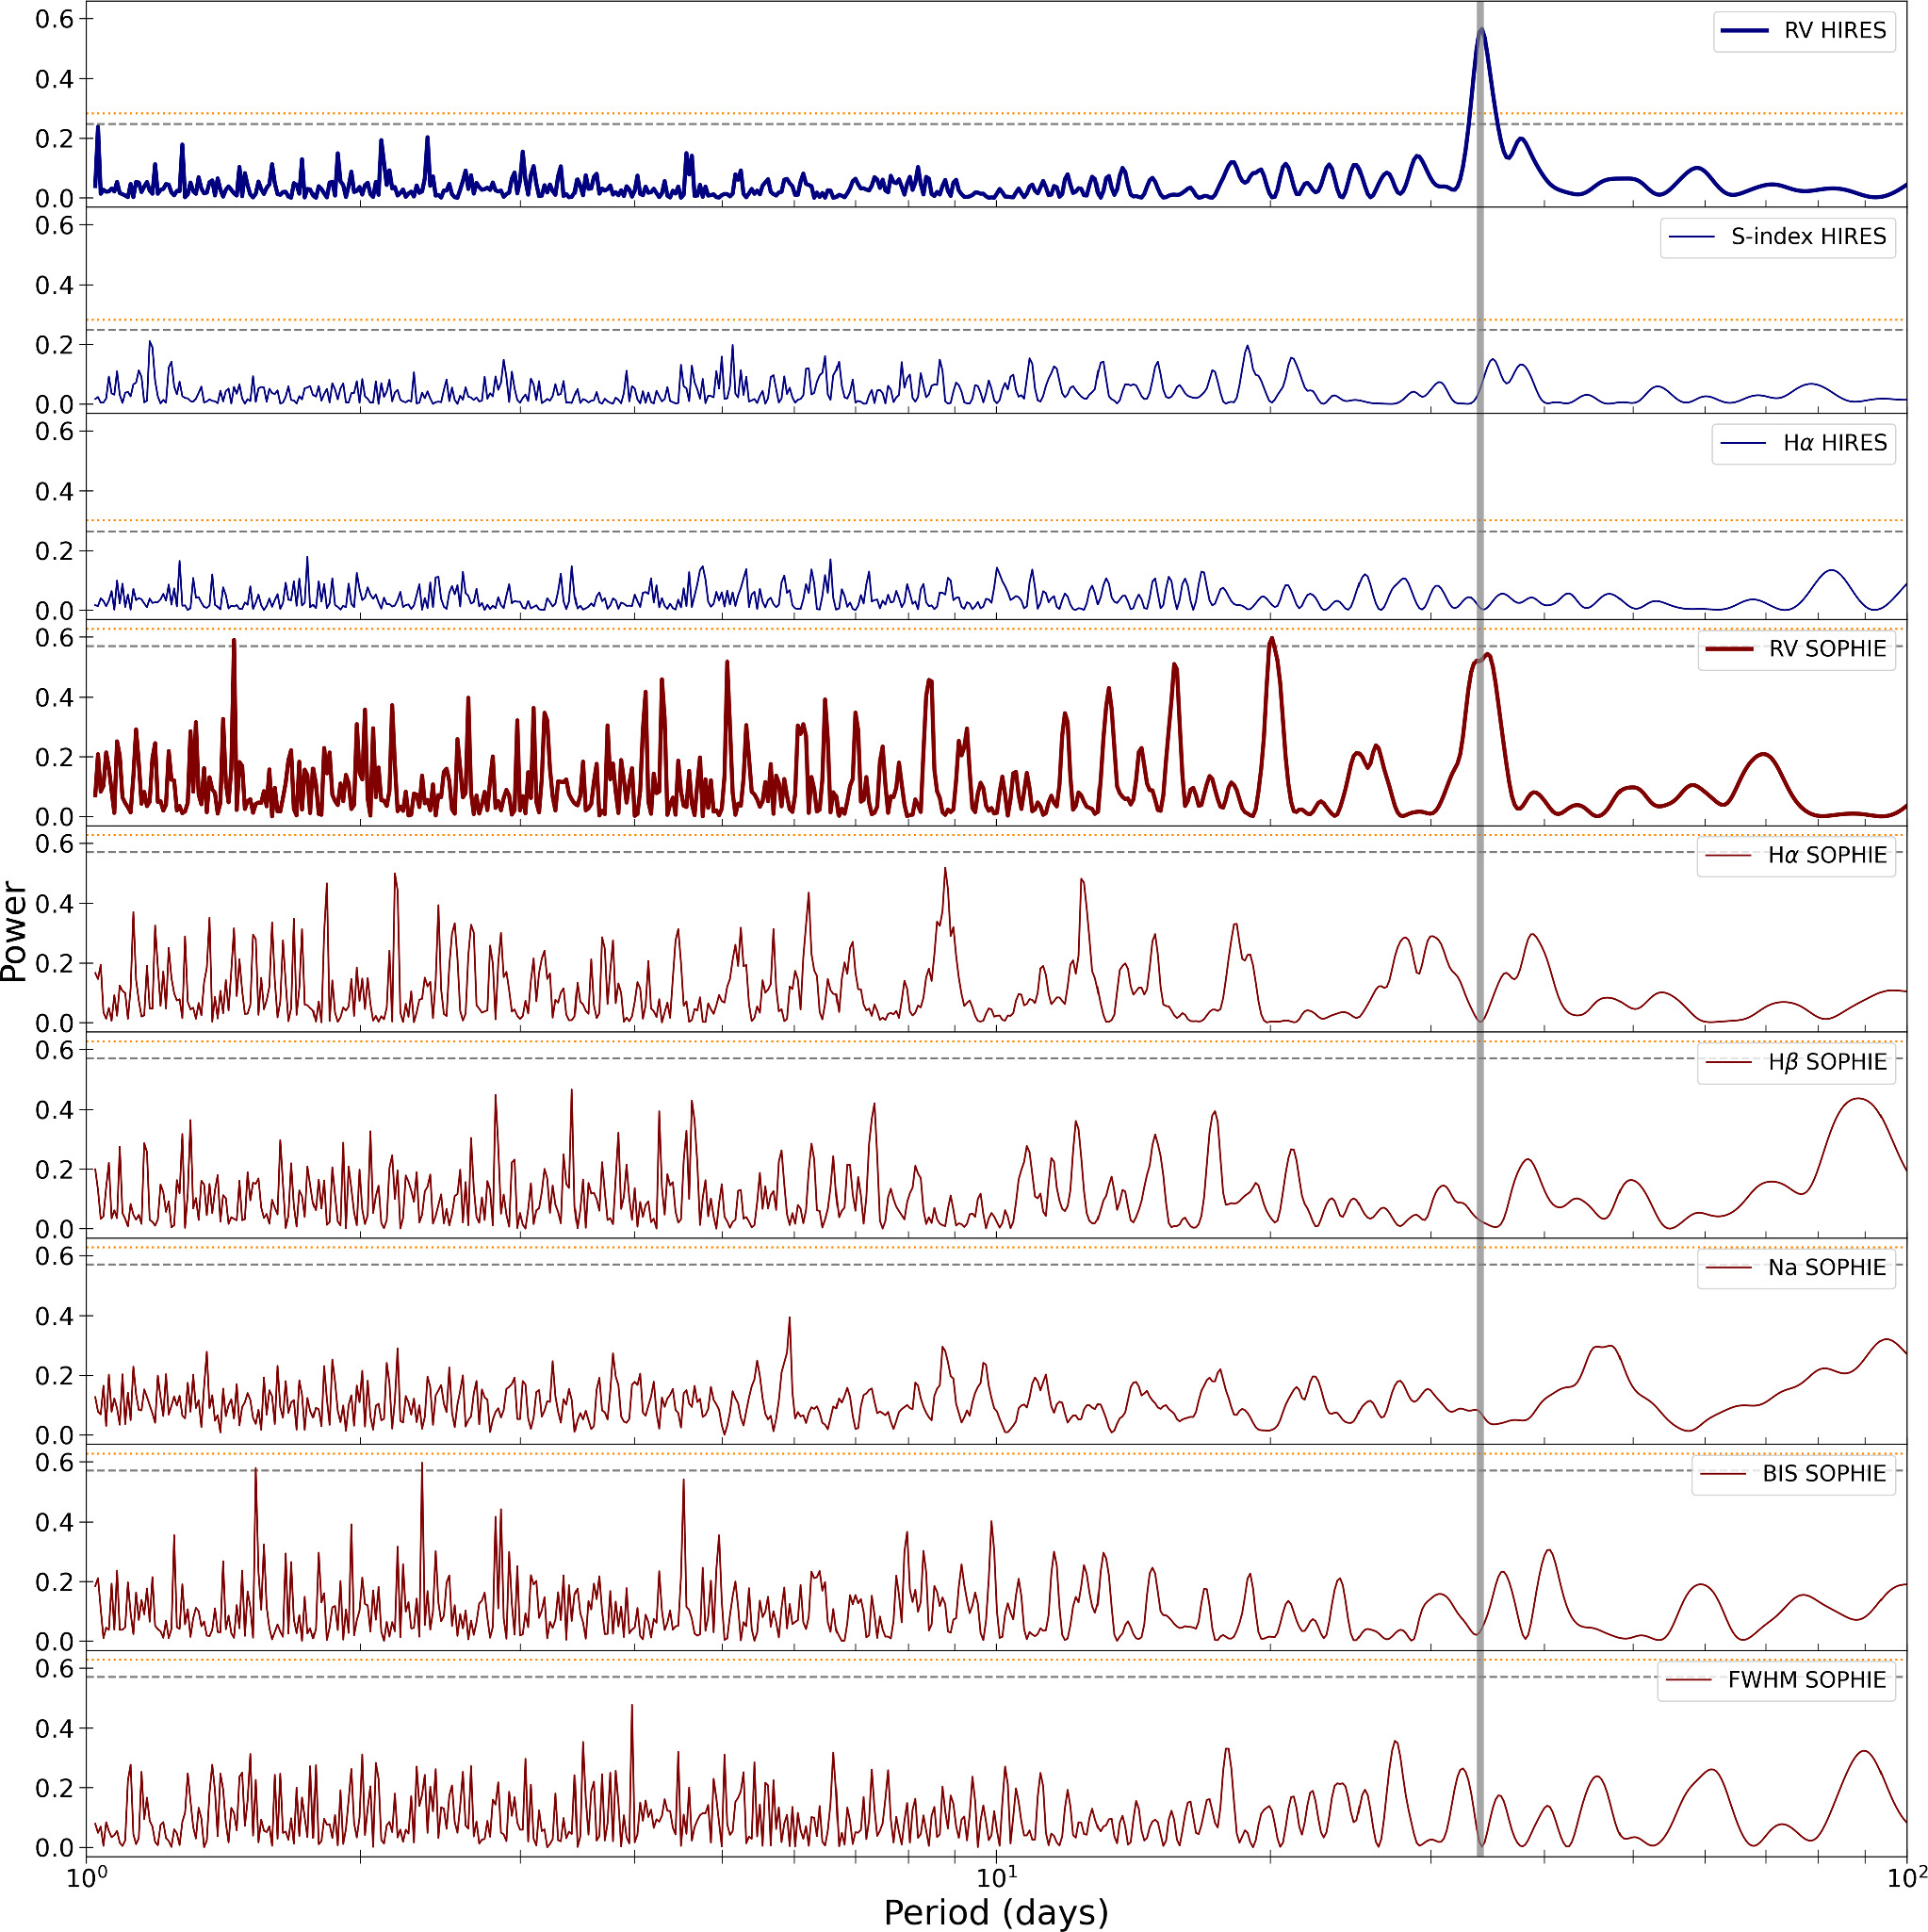
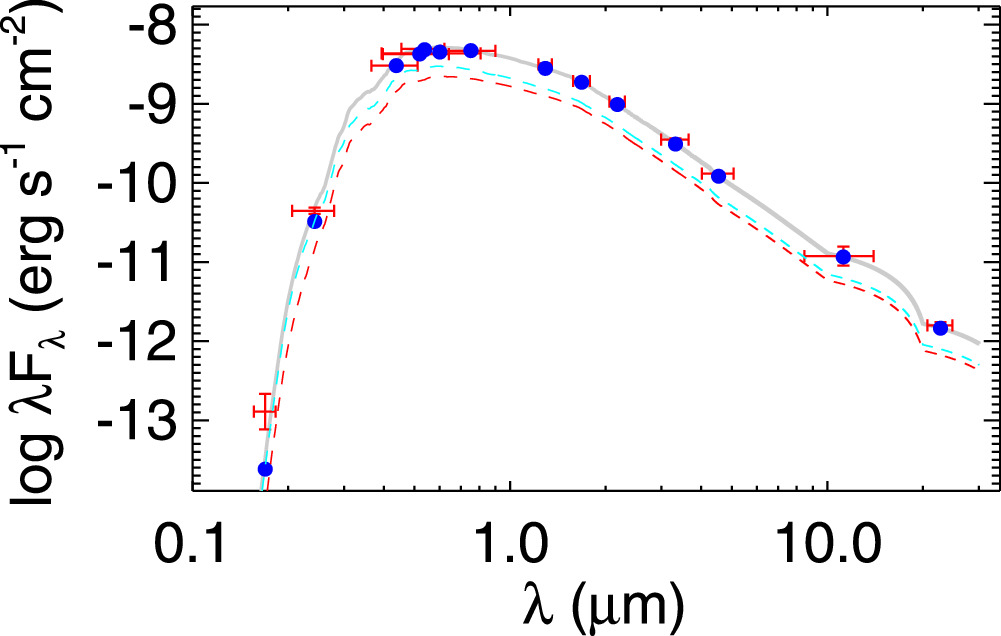
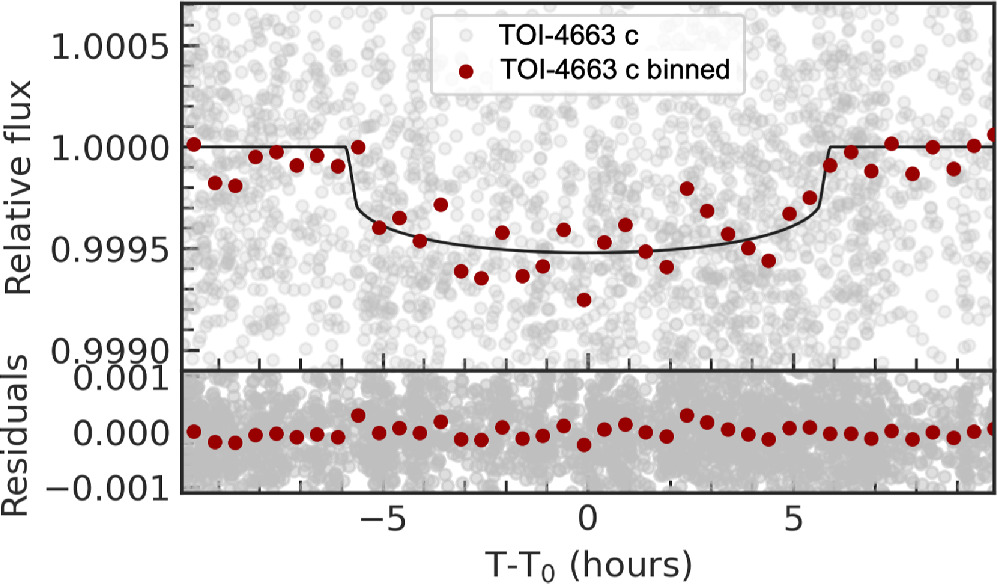
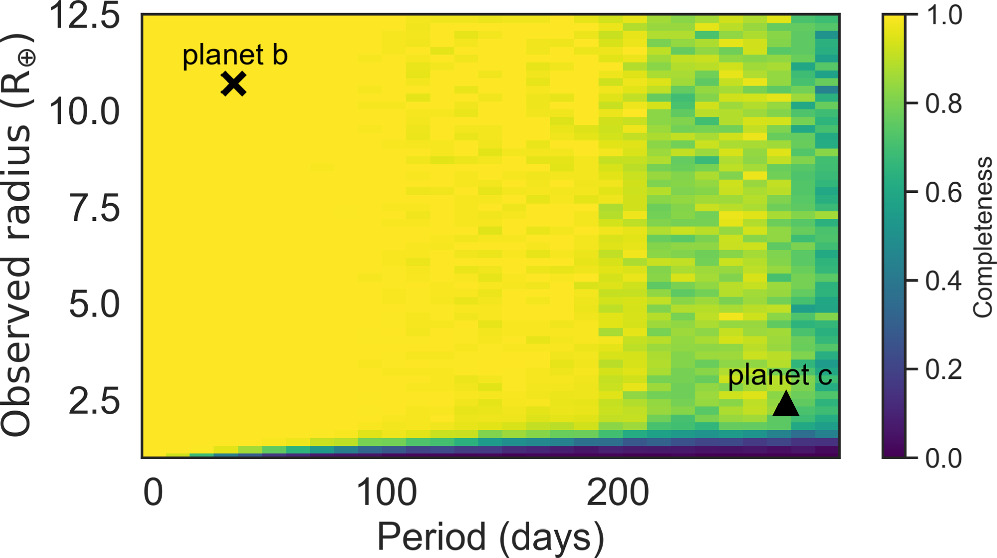
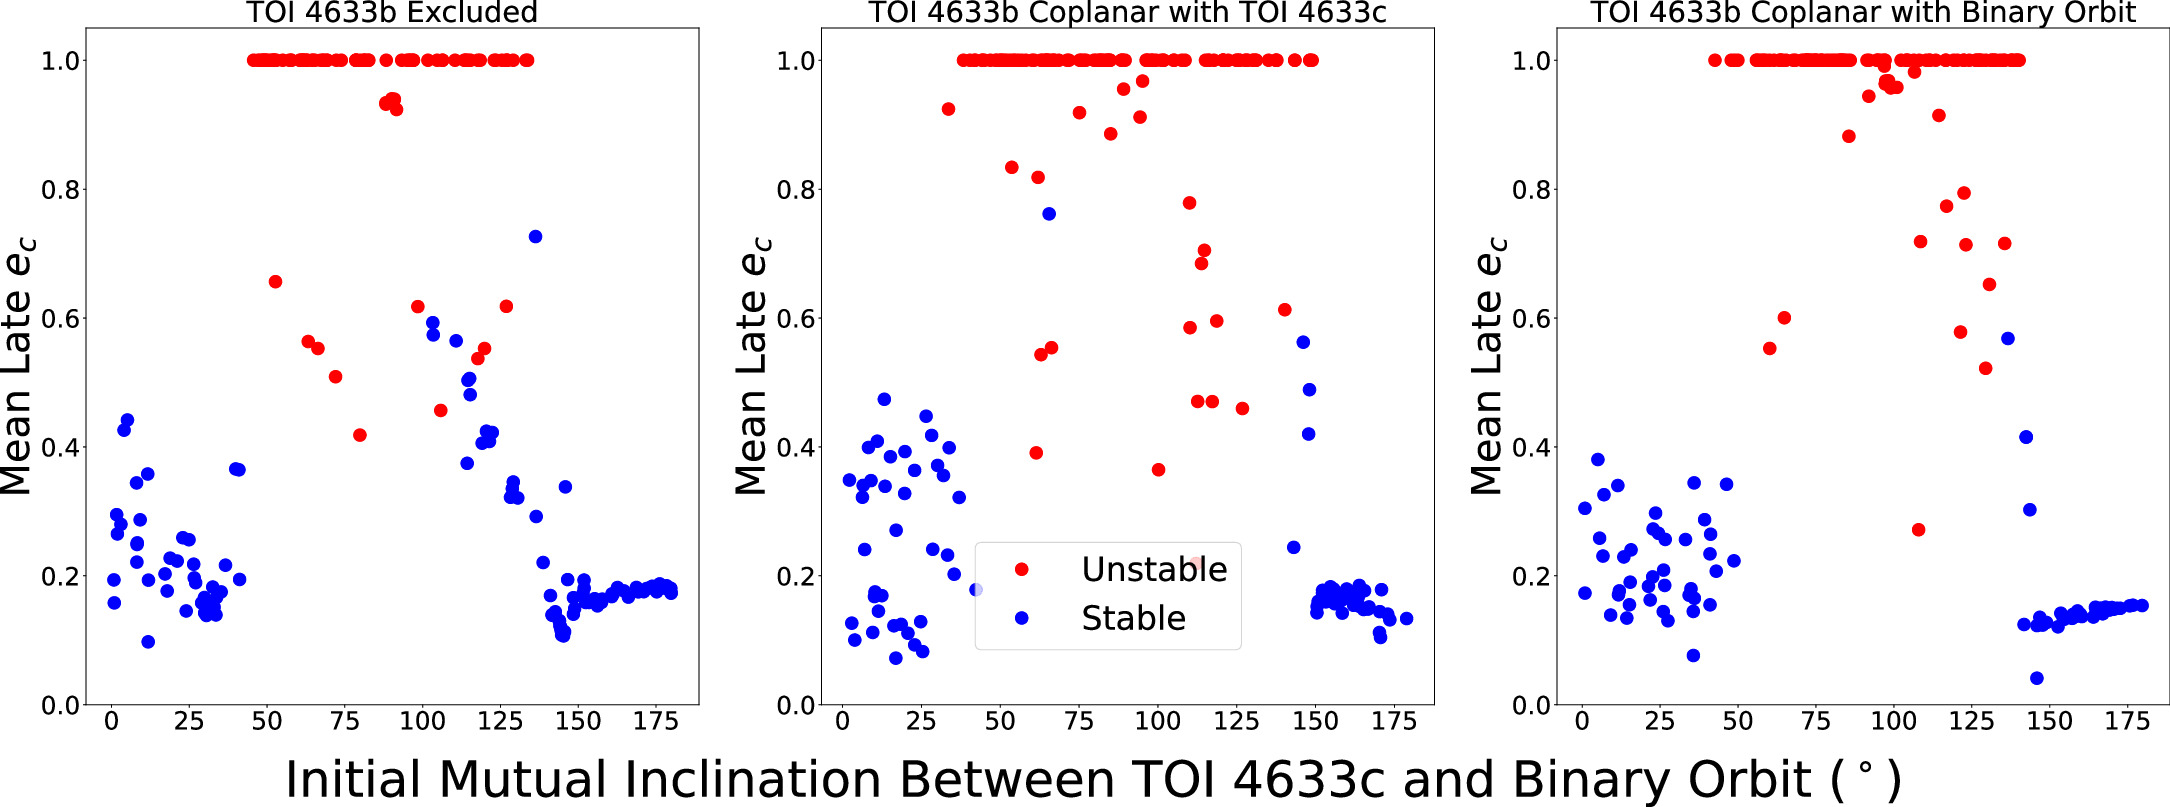
Figure 16. Stellar effective temperature vs. effective incident flux on a planet. The boundaries of the habitable zone defined by Kopparapu et al. (2014) are illustrated as shaded regions. The black circles show all transiting exoplanets listed in the NASA exoplanet archive, where the filled circles show only planets that have a mass measurement to better than 30% accuracy. The orange triangle shows the properties of TOI 4633 c. There are no other transiting planets within the habitable zone that are brighter than 11th magnitude, and only four that are brighter than 13th magnitude.
Download figure:
Standard image High-resolution image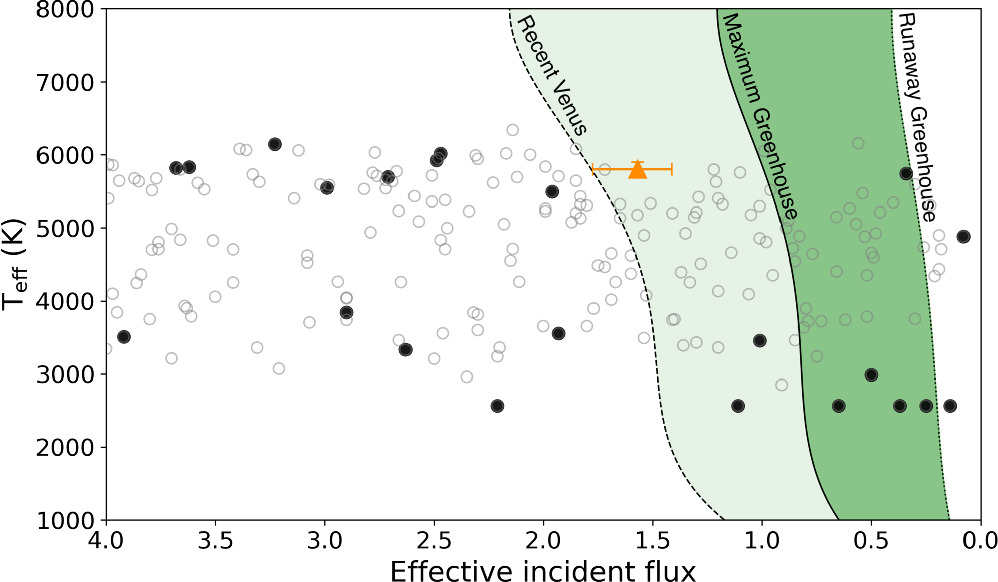
According to the Catalog of Habitable Zone Exoplanets by Hill et al. (2023), TOI 4633 is the brightest star known to host a transiting planet in the habitable zone, with no other transiting planets within the habitable zone that are brighter than 11th magnitude, five that are brighter than 13th magnitude, and 29 that are brighter than 15th magnitude. Even though planet c is at a distance from its host star where liquid water could potentially reside, the density of the planet (>0.11 g cm−3) suggests that it has a large and dense atmosphere that likely makes surface level liquid water impossible. However, as shown independently by Sucerquia et al. (2019) and Dobos et al. (2021), the probability of a planet hosting a satellite increases with increased orbital period. As such, the brightness of the system and the long orbital period of planet c makes TOI 4633 c a valuable target for further characterization in the future and, in particular, for the search of planet satellites.
7.4. Conclusion
We present the discovery and validation of a transiting mini-Neptune (Pc
=  days, Rc
=
days, Rc
=  R⊕, Mc
=
R⊕, Mc
=  M⊕) that was discovered by citizen scientists taking part in the Planet Hunters TESS citizen science project. The planet's long orbital period places it in the optimistic habitable zone of its host star, with an insolation of
  F⊕. RV monitoring of the system with Keck/HIRES and OHP/SOPHIE revealed an additional 34 days periodic signal that is not seen in the photometric data. Due to a lack of strong evidence that this periodic signal is caused by stellar activity, we tentatively consider this signal to be a planet candidate (Mb
sini < 109 M ⊕ ). Furthermore, we used high-contrast imaging observations spanning over 117 yr (1905–2023) to constrain the orbit of the bound stellar companion star (abin =
F⊕. RV monitoring of the system with Keck/HIRES and OHP/SOPHIE revealed an additional 34 days periodic signal that is not seen in the photometric data. Due to a lack of strong evidence that this periodic signal is caused by stellar activity, we tentatively consider this signal to be a planet candidate (Mb
sini < 109 M ⊕ ). Furthermore, we used high-contrast imaging observations spanning over 117 yr (1905–2023) to constrain the orbit of the bound stellar companion star (abin =  au, ebin =
  ).
).
Dynamical simulations were used to constrain the mutual inclination between the binary orbit and that of TOI 4633 c. The N-body simulations showed that if the 34 days planet candidate is inclined such that it only narrowly avoids transiting, then the mutual inclination between planet c and the binary orbit has to be less than ∼45° to ensure that the system is stable for longer than 106 yr.
Overall, TOI 4633 stands out due to its brightness, the long orbital period of the transiting planet TOI 4633 c that places it in the optimistic habitable zone, and the presence of the bound, near equal mass, stellar companion. TOI 4633 c is currently only the fourth habitable zone planet identified in the TESS data, and the only one transiting a G dwarf star. The system is valuable for studying planet formation and evolution in binaries, as well as for being an excellent target for detailed investigation of planets in habitable zones, particularly in multiple star systems. While the two stars in the system cannot currently be resolved from the ground (due to their proximity), the binary orbit modeling showed that in around 30 yr time the stars will be separated by more than 150 mas on the sky, a distance large enough to be able to resolve with modern spectrographs such as the Keck Planet Imager and Characterizer. This will enable further characterization of the two stars and the planets in the system.
8. Software and Data Availability
The TESS data used within this article are hosted and made publicly available by the Mikulski Archive for Space Telescopes (MAST, http://archive.stsci.edu/tess/). All the TESS data used in this paper can be found in MAST:10.17909/pepe-f853. This work also used data from the NASA Exoplanet Archive (NASA Exoplanet Archive 2019), and ExoFOP (ExoFOP 2019).
This work made use of Astropy, a community-developed core Python package for Astronomy (Astropy Collaboration et al. 2013), matplotlib (Hunter 2007), pandas (McKinney et al. 2010), NumPy (Walt 2011), astroquery (Ginsburg et al. 2019), sklearn (Pedregosa et al. 2011), emcee (Foreman-Mackey et al. 2013), ptemcee (Vousden et al. 2016), triceratops (Giacalone et al. 2021), latte (Eisner et al. 2020a), lightkurve (Lightkurve Collaboration et al. 2018), pyaneti (Barragán et al. 2022a), orbitize! (Blunt et al. 2020), Mercury (Chambers 1999), corner (Foreman-Mackey 2016).
Acknowledgments
We would like to thank all of the planet hunters who have taken part in the Planet Hunters TESS citizen science project over the past six years. Without all of their dedicated work, many of whom have been part of the project ab initio, this exciting system would not have been found.
We acknowledge the use of public TESS data from pipelines at the TESS Science Office and at the TESS Science Processing Operations Center. Resources supporting this work were provided by the NASA High-End Computing (HEC) Program through the NASA Advanced Supercomputing (NAS) Division at Ames Research Center for the production of the SPOC data products.
We thank the Observatoire de Haute-Provence (CNRS) staff for its support. This work was supported by the "Programme National de Planétologie" (PNP) of CNRS/INSU." Some of the observations in this paper made use of the high-resolution imaging instrument 'Alopeke and were obtained under Gemini LLP Proposal Number: GN/S-2021A-LP-105. Alopeke was funded by the NASA Exoplanet Exploration Program and built at the NASA Ames Research Center by Steve B. Howell, Nic Scott, Elliott P. Horch, and Emmett Quigley. 'Alopeke was mounted on the Gemini North telescope of the international Gemini Observatory, a program of NSF's OIR Lab, which is managed by the Association of Universities for Research in Astronomy (AURA) under a cooperative agreement with the National Science Foundation. on behalf of the Gemini partnership: the National Science Foundation (United States), National Research Council (Canada), Agencia Nacional de Investigación y Desarrollo (Chile), Ministerio de Ciencia, Tecnología e Innovación (Argentina), Ministério da Ciência, Tecnologia, Inovações e Comunicações (Brazil), and Korea Astronomy and Space Science Institute (Republic of Korea).
N.E. thanks the LSSTC Data Science Fellowship Program, which is funded by LSSTC, NSF Cybertraining grant number 1829740, the Brinson Foundation, and the Moore Foundation. C.A.C. acknowledges that this research was carried out at the Jet Propulsion Laboratory, California Institute of Technology, under a contract with the National Aeronautics and Space Administration (80NM0018D0004). N.S. acknowledges support from the National Science Foundation through the Graduate Research Fellowship Program under grant 1842402. J.V.Z. acknowledges support from the Future Investigators in NASA Earth and Space Science and Technology (FINESST) grant 80NSSC22K1606. J.M.A.M. acknowledges support from the National Science Foundation Graduate Research Fellowship Program under grant number DGE-1842400 and from NASA's Interdisciplinary Consortia for Astrobiology Research (NNH19ZDA001N-ICAR) under award number 19-ICAR19_2-0041. Xavier Delfosse acknowledges support by the French National Research Agency in the framework of the Investissements d'Avenir program (ANR-15-IDEX-02), through the funding of the "Origin of Life" project of the Grenoble-Alpes University. F.K. acknowledges funding from the European Research Council (ERC) under the European Union's Horizon 2020 research and innovation program (COBREX; grant agreement number 885593), and from the Initiative de Recherches Interdisciplinaires et Stratégiques (IRIS) of Université PSL "Origines et Conditions d'Apparition de la Vie (OCAV)". E.M. acknowledges funding from FAPEMIG under project number APQ-02493-22 and a research productivity grant number 309829/2022-4 awarded by the CNPq, Brazil. CJ gratefully acknowledges support from the Netherlands Research School of Astronomy (NOVA) and from the Research Foundation Flanders (FWO) under grant agreement G0A2917N (BlackGEM).
Some of the data presented in this paper were obtained from the Mikulski Archive for Space Telescopes (MAST). The Space Telescope Science Institute (STScI) is operated by the Association of Universities for Research in Astronomy, Inc., under NASA contract NAS5-26555. Support for MAST for non-HST data is provided by the NASA Office of Space Science via grant NNX13AC07G and by other grants and contracts. This paper includes data collected with the TESS mission, obtained from the MAST data archive at STScI. Funding for the TESS mission is provided by the NASA Explorer Program. STScI is operated by the Association of Universities for Research in Astronomy, Inc., under NASA contract NAS 5-26555.
Finally, N.E. and S.G. wish to thank the Harry Potter franchise for providing us with the in-house nickname for this system of Percival, inspired by Albus Percival Wulfric Brian Dumbledore's wisdom.
Facilities: TESS - , OHP/SOPHIE - , Gemini North/'Alopeke - , Keck/HIRES - , Palomar/PHARO - , WIYN/NESSI - , Keck II/NIRC2 - .
Footnotes
- 39
- 40
See lightkurve documentation https://docs.lightkurve.org/tutorials/2-creating-light-curves/2-3-how-to-use-cbvcorrector.html
- 41
See https://heasarc.gsfc.nasa.gov/docs/tess/UnderstandingCrowding.html for more details on TESS crowding correction.
- 42
- 43
NASA Exoplanet Archive.