


Abstract
The Transiting Exoplanet Survey Satellite (TESS) is finding transiting planet candidates around bright, nearby stars across the entire sky. The large field of view, however, results in low spatial resolution; therefore, multiple stars contribute to almost every TESS light curve. High angular resolution imaging can detect the previously unknown companions to planetary candidate hosts that dilute the transit depths, lead to host star ambiguity, and, in some cases, are the source of false-positive transit signals. We use speckle imaging on the Southern Astrophysical Research (SOAR) telescope to search for companions to 542 TESS planet candidate hosts in the southern sky. We provide correction factors for the 117 systems with resolved companions due to photometric contamination. The contamination in TESS due to close binaries is similar to that found in surveys of Kepler planet candidates. For the solar-type population, we find a deep deficit of close binary systems with projected stellar separations less than 100 au among planet candidate hosts (44 observed binaries compared to 124 expected based on field binary statistics). The close binary suppression among TESS planet candidate hosts is similar to that seen for the more distant Kepler population. We also find a large surplus of TESS planet candidates in wide binary systems detected in both SOAR and Gaia DR2 (119 observed binaries compared to 77 expected). These wide binaries almost exclusively host giant planets, however, suggesting that orbital migration caused by perturbations from the stellar companion may lead to planet–planet scattering and suppress the population of small planets in wide binaries. Both trends are also apparent in the M dwarf planet candidate hosts.
Export citation and abstract BibTeX RIS
1. Introduction
Over decade-long primary and extended missions, the Kepler telescope (Borucki et al. 2010) detected the majority of known exoplanets. Kepler probed the large (Howard et al. 2012) and diverse (Lissauer et al. 2011; Welsh et al. 2012) Galactic population of planetary systems but only looked at relatively small regions of the sky at a time. Also, the observed stars in the prime mission were generally too distant for precision follow-up observations.
Beginning in 2018 July, the Transiting Exoplanet Survey Satellite (TESS; Ricker et al. 2014) searched the southern sky for exoplanets around nearby stars. These typically bright targets are accessible to measurements of planet masses with precision radial velocity and atmospheric characterization of planets with transmission spectroscopy. Several planets around bright stars have been confirmed (Huang et al. 2018; Dragomir et al. 2019; Vanderburg et al. 2019), with hundreds of additional candidates awaiting follow-up observations.5
The simultaneous field of view required for TESS is large, approximately 6% of the entire sky, which it covers with a relatively coarse pixel scale of 21'' pixel−1. For reference, each TESS pixel subtends a region of the sky approximately 25× that of each Kepler pixel. Each TESS pixel observes the flux made up of the blended contributions of multiple sources. The TESS Input Catalog (TIC; Stassun et al. 2018; Stassun et al. 2019) determined the contamination from known point sources in two catalogs (APASS and 2MASS) likely to be in the TESS aperture for 3.8 million stars. While these catalogs' limiting magnitudes are relatively faint compared to the typically bright TESS targets (Tmag,limiting ∼ 17–19), they are based on seeing-limited observations and not sensitive to binaries with separations less than 1''–2''. Likewise, Gaia DR2 generally does not recover binaries with separations of less than ∼0 7, in particular nearby bright stars (Ziegler et al. 2018a).
High-resolution imaging has proven to be critical to confirm and characterize transiting planet candidates. Half of the solar-type stars (Raghavan et al. 2010) and a quarter of the M dwarfs (Winters et al. 2019) are found in multiple systems. The maximum of the distribution of orbital separations (∼50 au for a solar-type binary and 20 au for M dwarfs) at a typical distance to a TESS host star of approximately 100 pc peaks at angular separations of 02–05, accessible only by high angular resolution imaging. Therefore, most contamination from binary systems is not accounted for in the TIC.
For Kepler, the planet radius estimates for stars with detected companions increased by a factor of 1.6, on average (Ciardi et al. 2015; Ziegler et al. 2018b). In many cases, the identity of the planetary host star may be ambiguous, leading to two different possible radius estimates based on either scenario. In addition, the absence of companions can be used to rule out many common false-positive scenarios, allowing planets to be statistically validated (Morton & Johnson 2011; Torres et al. 2011).
The number of planet candidates detected by Kepler and currently by TESS outstrips the resources available on conventional high-resolution instruments, such as laser guide star adaptive optics (AO).6 A useful strategy with Kepler was to perform a broad survey with a visible-light high-resolution instrument on a moderately sized telescope. These observations are able to find the majority of both physically bound companions and low-contrast asterisms that significantly alter the radius estimate of the planet candidate. The Robo-AO Kepler survey (Law et al. 2014; Baranec et al. 2016; Ziegler et al. 2017) observed 3857 planet candidate host stars with a laser-assisted AO robotic instrument on a 2 m class telescope (Baranec et al. 2014). The discoveries of companions corrected the radius estimates for 814 planet candidates (Ziegler et al. 2018b), contributed to the validation of over 1000 Kepler planets (Morton et al. 2016), and informed future observations with large-aperture telescopes. Six years after the Kepler prime mission ended, over half of the Kepler planet candidates had only been imaged at high resolution by Robo-AO.
The TESS sample can largely be covered by speckle interferometry due to host stars that are, on average, several magnitudes brighter than Kepler. Speckle interferometry on the Southern Astrophysical Research (SOAR) telescope has been developed and optimized over the past decade, and at present, it can image up to 300 targets a night with diffraction-limited resolution (Tokovinin 2018). Mann et al. (2019) found the astrometric precision of SOAR speckle imaging to be among the best compared to similar nonfixed high-resolution instruments. Imaging in Cousins I band, at the center of the TESS bandpass, can accurately determine the transit dilution in the TESS light curves due to detected companions, used to correct the planetary radius estimates.
Theory suggests that the presence of a nearby stellar companion can have a dire impact on the formation of circumstellar planetary systems: stirring planetesimals (Quintana et al. 2007), perturbing orbits resulting in high-eccentricity tidal migration (Naoz et al. 2012), truncating protoplanetary disks and shortening their lifetime (Jang-Condell et al. 2008; Kraus et al. 2012), and increasing photoevaporation (Alexander 2012). Ngo et al. (2016) found that hot Jupiters have significantly fewer companions at close separations compared to field stars but many more at wider separations. This suggests that these hot Jupiters may have been driven inward to their present few-day orbits by perturbations from the companion stars. Bolstering this interpretation, the Robo-AO Kepler survey found that hot Jupiters were significantly more likely to be found in binary systems than other types of planets (Ziegler et al. 2018c). Deacon et al. (2016), however, found no difference in the wide (ρ > 3000 au) binary rate between transiting planet hosts and field stars in the Kepler field.
Kraus et al. (2016), observing 382 Kepler planet candidates with AO on Keck, found a dearth of Kepler planets in close binary systems. This deficit was modeled as a binary suppression factor of 0.34 at separations below approximately 47 au. Extrapolating this out suggests that one-fifth of the solar-type stars in the galaxy cannot host planets due to the influence of a stellar companion. It is unclear, however, if the survival of planets in close binary systems is random or a result of other factors, such as the binary eccentricity or the mutual inclination to the planetary system of the binary system. The detection image provides only an instantaneous projected separation, s. Further monitoring is needed to determine the true orbital parameters that could provide insight into how some planetary systems form and survive in this harsh environment.
The TESS planet candidate hosts are relatively nearby: on average, less than half the distance of the Kepler hosts, based on the TIC distance estimates (Stassun et al. 2019). The 4.1 m SOAR telescope can, therefore, detect companions to the vast majority of TESS targets at solar system separations (s = 10–50 au). Evidence of suppression in the binary rate for TESS planet candidates in this regime would serve as both an independent validation of the ruinous effect binaries have on planetary systems and, since the TESS planets are spread over the entire sky, confirmation of the effect in a more representative sample of the Galactic planetary population. Indeed, Matson et al. (2018) did not detect binary suppression in a sample of K2 stars, which are spread in fields across the ecliptic plane. The authors note that the nondetection is tenuous, however, and more high-resolution observations of exoplanet hosts are needed.
We begin in Section 2 by detailing our observations and data analysis. We present the results of the survey in Section 3 and explore the impact binaries have on the TESS planets in Section 4. We discuss the results further in Section 5. Finally, we conclude in Section 6.
2. Observations and Analysis
2.1. Target Selection
The hosts of TESS planet candidates (TESS objects of interest, or TOIs) were selected from the data releases available online at the TESS data release portal.7 Faint stars (typically, Tmag > 13 mag) that are not well suited for speckle observations were not targeted; this limit reduces the number of late-type stars that are observed in this survey. Previously confirmed planet hosts, primarily from the WASP (Street et al. 2003) and HATS (Bakos 2018) surveys, were excluded from the target selection, as these systems have been heavily studied in the past (e.g., Ngo et al. 2015; Evans et al. 2016, 2018). Seventeen community-detected TESS planet candidates8 were also observed but were not used in the subsequent analysis in this work. To increase observing efficiency, target acquisition was improved using precise target coordinates, determined for each night with proper motions from Gaia DR2 (Gaia Collaboration et al. 2018), when available, and the TIC (Stassun et al. 2019) otherwise. As previously noted in Arenou et al. (2018), we find that many targets with only two-parameter astrometric solutions in Gaia DR2 are actually close binaries.
The properties of the host stars and planet candidates observed are plotted in Figure 1.
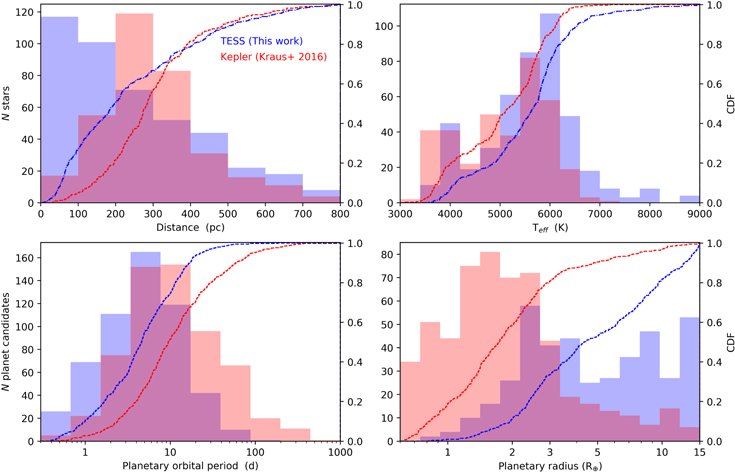
Figure 1. Properties of the 542 TESS planet candidate hosts observed by SOAR in this survey, presented as a binned histogram with an overplotted cumulative density function. For comparison, the properties of the 382 Kepler planet candidate hosts observed in Kraus et al. (2016) are also plotted. In general, the TESS planets are closer to the solar system, have slightly hotter hosts, orbit with shorter periods, and are larger than the Kepler planets targeted by the Kraus et al. (2016) survey.
Download figure:
Standard image High-resolution image2.2. SOAR Observations and Data Reduction
We observed 542 TESS planet candidate hosts with the high-resolution camera (HRCam) imager on the 4.1 m SOAR telescope over 7 nights in 2018–2019. The observation procedure and data reduction are described in Tokovinin (2018). Briefly, each observation consists of 400 frames split into two data cubes, typically consisting of a 200 × 200 binned pixels region of interest centered on the target star (63 on a side at the pixel scale of 001575 and 2 × 2 binning) taken in approximately 11 s with an Andor iXon-888 camera. The resulting data cube is processed by a custom IDL script, which computes the power spectrum, in which a resolved multiple stellar system will appear as characteristic fringes. Binary parameters (separation, position angle, and magnitude difference) are determined from modeling the power spectrum. Secondary stars will appear as mirrored peaks in the speckle autocorrelation function (ACF), the Fourier transform of the power spectrum, at the separation and position angle of the companion. To remove the 180° ambiguity inherent to the classical speckle interferometry, our pipeline also computes the shift-and-add (SAA) images, centered on the brightest pixel in each frame (this is sometimes called "lucky imaging"). Relatively bright binaries with Δm > 0.5 mag often have their companions visible in the SAA images, allowing us to select the correct quadrant (these measurements are marked by the flag "q" in Table 6 in the
The detection limits are estimated from the rms fluctuations σ of the ACF computed in annular zones of increasing radii; peaks exceeding the 5σ level are assumed to be detectable. This has been verified by injecting simulated binary companions into the real ACFs (see, e.g., Figure 9 in Tokovinin et al. 2010). Moreover, for each target, we require detection of the companion in both data cubes. Our procedure practically excludes false detections at separations larger than ∼01. At closer separations, however, the faint and persistent ACF details of instrumental origin, such as vibration or the optical ghosts described in Tokovinin (2018), can mimic real close binaries with a large Δm. We intercompare the ACFs and power spectra of sequentially observed targets to identify such artifacts. Finally, the estimated detection limits are verified by comparing with the (ρ, Δm) of actually measured companions, and a good agreement is always found.
The pixel scale and orientation are calibrated by observing several wide binaries with a well-modeled motion, as explained in Section 4.2 of Tokovinin (2018). The rms agreement between the measured calibrator positions and their models is typically from 1 to 3 mas in separation and better than 0 2 in angle. The pixel scale is therefore established with an accuracy of better than 0.5%. The calibration of HRCam was checked by comparing the positions of wider calibrators predicted by their models for 2015.5 with their relative positions in Gaia DR2.
We detail the observations in Table 6 in the
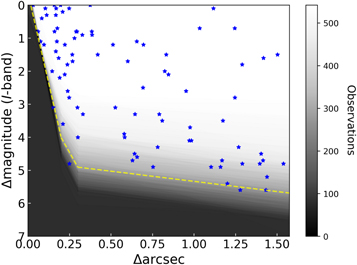
Figure 2. Close companions (ρ < 155) to the TESS planet candidate hosts detected by SOAR speckle imaging, in terms of their I-band magnitude difference and separation from the primary star. The average 5σ detection limits of the observations are plotted, trending from black (no observations are sensitive to binaries with that combination of separation and contrast) to white (all 542 observations are sensitive to that combination). The yellow dashed line shows the median sensitivity for the survey.
Download figure:
Standard image High-resolution image2.3. Planet Radius Corrections
The additional flux from a nearby star will dilute the transit depth in the TESS light curves, resulting in an underestimated radius for the planet candidate. We compute correction factors to the radius estimates derived from the TESS light curves for two scenarios: (1) the planet orbits the target star and (2) the planet orbits the secondary star, which is bound to the primary star.9
For the first scenario, we use the relation from Law et al. (2014) to derive a radius correction factor,
where  is the corrected radius of the planet orbiting the primary star,
  is the original planetary radius estimate based on the diluted transit signal, and FA is the fraction of flux within the aperture from the primary star.
For the case where the planet candidate is bound to the secondary star, we use the relation for the radius correction factor,

where  is the corrected radius of the planet orbiting the secondary star bound to the primary star; RB and RA are the stellar radii of the secondary and primary star, respectively; and FB is the fraction of flux within the aperture from the secondary star.
We use the stellar radius estimates from the TIC (Stassun et al. 2019) when available for the primary stars. The radii of secondary companions in the scenario where they are bound to the target star were estimated using the observed contrast ratio in the TESS band (approximated using the I bandpass of SOAR) and finding the radius of an appropriately fainter star within the Dartmouth stellar models (Dotter et al. 2008).
The TIC includes a contamination ratio that takes into account stars within 10 TESS pixels of the target. This includes stars typically down to the limiting magnitude of the 2MASS (Skrutskie et al. 2006) and APASS (Henden et al. 2009) catalogs (T ∼ 17–19). Using the list of detected close binaries to TESS planet candidate hosts and their binary parameters, a custom Python script crossmatched each of their coordinates to stars in the TIC catalog. We find that 31 stars in the TIC had similar positions relative to the primary as was found in SOAR imaging (Δρ < 05 and Δθ < 20°, or [Δθ ± 180°] < 20°). The properties of these systems are available in Table 2 in the
We provide a correction factor for hosts, as in some cases the crossmatch between the TIC and the SOAR binary is ambiguous; however, we caution that the correction should be used judiciously. For all other systems, the contamination ratios reported should be used in addition to the TIC contamination ratio. In practice, the reported radius estimates of TESS planet candidates on the TESS data release portal and Exoplanet Follow-up Observing Program (ExoFOP) typically take into account flux contamination. The additional correction due to binaries detected by SOAR is the product of the original radius estimate and the radius correction factor reported in this work.
2.4. Physical Association of Companions
A relatively large number of companions detected near Kepler planet candidates were unassociated, especially at separations greater than 1'' (Horch et al. 2014; Ziegler et al. 2018c). The TESS targets are spread across the sky, in regions of low and high stellar density, but generally at higher Galactic latitudes than the Kepler field. In addition, the targets are typically bright (Tmag < 12 mag), and subsequently, the detectable stars near them are several magnitudes brighter than the Kepler stars, given approximately equal contrast sensitivity. It is likely, then, that the number of detected field stars will be reduced in the TESS sample.
We use the stellar densities in the region of sky around each target in Gaia DR2 (Gaia Collaboration et al. 2018) to estimate the likelihood of a field star being detected near a TESS star. Gaia DR2 is essentially complete for sources down to G = 17 mag, or G = 19 mag in noncrowded fields (Gaia Collaboration et al. 2018). For our typical target with I = 12 mag and a contrast sensitivity of 5 mag, the faintest detectable companions will have I ≈ 17 mag, comparable to the Gaia completeness limit.
For each target, we begin by performing a cone search in DR2 to search for all stars within 05. The cone search was done using the Astropy affiliated package astroquery (Price-Whelan et al. 2018) to search the Gaia DR2 catalog hosted by the Barbara A. Mikulski Archive for Space Telescopes (MAST). We use the number of sources in DR2 within the 05 circular field to determine the source density (i.e., number of sources per arcsec2) as a function of G magnitude, ρsource[G]. For each target, we determine the limiting magnitude of detectable secondary stars (Glimit) within separation increments of 05. We then use these limiting magnitudes and the DR2 source density ( ) to determine the probability of detecting an unassociated field star within that separation range (e.g., 1''–15). The cumulative probability for all separations out to 315 provides the number of field stars we can expect to find near that target (see Figure 3). Typically, targets near the galactic plane and the Small and Large Magellanic Clouds are far more likely to have a field companion due to the high local source density.
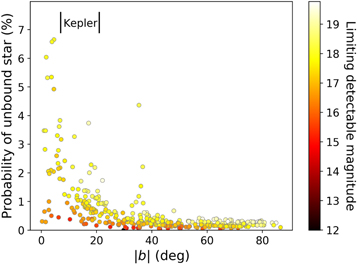
Figure 3. Probability of an unbound star being detected within the search radius of 315 for each observed TESS planet candidate as a function of Galactic latitude, based on Gaia DR2 stellar counts. Each target is colored by the limiting magnitude of detectable nearby stars in the SOAR speckle observations. The latitude range of the primary Kepler mission is indicated for reference. We expect approximately three unbound stars in total to be detected near the TESS planet candidates.
Download figure:
Standard image High-resolution imageWe perform a Monte Carlo analysis using these probabilities and the distribution of contrast sensitivity to simulate 104 surveys and find that, on average, we should detect 3.2 ± 0.5 field stars within 315 of the observed TESS targets. The field companions are nearly always high contrast (with a large ΔI). Therefore, we expect the impact on the subsequent analysis due to unassociated asterisms of field stars to be negligible.
3. Results
We detected 88 and 126 companions within 15 and 3'' of 84 and 117 TESS planet candidate hosts, respectively, out of 542 observed with speckle imaging on SOAR. This implies a companion rate within 15 and 3'' for TESS planet candidates of 16.2% ± 1.7% and 23.2% ± 2.0%, respectively. The properties of the detected companions are plotted in Figure 2, along with the average detection sensitivities from all observations, which are detailed in Table 6 in the
The results of each night's observations were processed within a week and posted on the TESS ExoFOP website10 to aid in confirmation of the planet candidates. Several studies (Espinoza et al. 2019; Jones et al. 2019; Quinn et al. 2019; Rodriguez et al. 2019; Vanderburg et al. 2019) have used the SOAR speckle results to confirm early TESS planets.
3.1. High-order Multiples
Nine targets are resolved triples with two companions in the SOAR images. For TOIs 378, 183, 487, 952, and 909, both companions are paired to the main star. In contrast, close pairs in TOI 455, 697, and 612 belong to the secondary components. Finally, in TOI 141, both separations are comparable, 12 and 044. For the resolved triples, the positions and magnitude differences refer to pairs of stars (e.g., Aa,B and Aa,Ab), as indicated in Column 3 of Table 6 in the
3.2. Implications for TESS Planet Radii
As discussed in Section 2.3, the additional flux from a stellar companion will dilute the transit signal in the TESS light curves, resulting in an underestimated planetary radius. We report the radius correction factors for planet candidates hosted in resolved binaries in our survey in Table 1.
Table 1. Nearby Stars Detected by SOAR to TESS Planet Candidate Hosts
| TOI | Separation | P.A. | Contrast | Teff | Distance | Proj. Sep. | Radius Correction Factor | Prev. | WDS DD | |
|---|---|---|---|---|---|---|---|---|---|---|
| (arcsec) | (deg) | (I band) | (K) | (pc) | (au) | (Primary Host) | (Secondary Host) | Det.? | ||
| 1 | 2 | 3 | 4 | 5 | 6 | 7 | 8 | 9 | 10 | 11 |
| 123 | 1.2894 | 294.6 | 1.8 | 6188 | 72 | 92 | 1.091 | 2.404 | 3 | SEE443 |
| 128 | 2.2195 | 153.8 | 2.4 | 6086 | 67 | 148 | 1.053 | 3.13 | 2 | FIN92 |
| 131 | 0.0755 | 207.1 | 1.1 | 4174 | 55 | 4 | 1.168 | 1.932 | 1 | |
| 138 | 0.0964 | 257.0 | 1.2 | 5722 | 128 | 12 | 1.154 | 2.005 | 1 | |
| 141 | 1.1999 | 305.2 | 5.4 | 5795 | 48 | 57 | 1.003 | 10.881 | 1 | |
| 141 | 0.4429 | 239.5 | 4.9 | 5795 | 48 | 21 | 1.005 | 8.66 | 1 | |
| 146 | 0.2896 | 76.1 | 0.8 | 6905 | 1.216 | 1 | ||||
| 147 | 2.6583 | 217.6 | 4.6 | 5620 | 820 | 2179 | 1.007 | 3 | ||
| 149 | 1.117 | 132.6 | 0.1 | 5914 | 376 | 419 | 1.383 | 3 | TDS161 | |
| 153 | 0.1691 | 173.6 | 0.1 | 6142 | 436 | 73 | 1.383 | 1.425 | 1 | |
| 159 | 0.6444 | 17.5 | 3.3 | 6979 | 333 | 214 | 1.024 | 4.594 | 1 | |
| 161 | 0.1961 | 101.2 | 0.0 | 5388 | 333 | 65 | 1.414 | 1.414 | 1 | |
| 165 | 2.4855 | 254.5 | 0.8 | 6038 | 193 | 479 | 1.216 | 1.686 | 2 | RST164 |
| 167 | 0.1593 | 306.6 | 0.8 | 5551 | 293 | 46 | 1.216 | 1.776 | 3 | |
| 172 | 1.1021 | 319.1 | 4.9 | 5911 | 225 | 247 | 1.005 | 9.603 | 1 | |
| 180 | 1.2682 | 63.7 | 4.3 | 6082 | 270 | 342 | 1.009 | 7.197 | 3 | |
| 183 | 0.083 | 98.5 | 0.4 | 6270 | 200 | 16 | 1.301 | 1.495 | 1 | |
| 183 | 3.1806 | 302.0 | 5.1 | 6270 | 200 | 636 | 1.005 | 10.056 | 1 | |
| 187 | 0.8456 | 104.5 | 2.1 | 6725 | 177 | 149 | 1.07 | 2.797 | 1 | |
| 188 | 1.2904 | 5.8 | 4.8 | 6340 | 203 | 261 | 1.006 | 8.547 | 1 | |
| 189 | 0.9716 | 341.7 | 4.1 | 6054 | 177 | 171 | 1.011 | 6.411 | 1 | |
| 211 | 0.2083 | 258.3 | 0.2 | 5873 | 121 | 25 | 1.353 | 1.338 | 1 | |
| 224 | 0.0607 | 31.1 | 0.8 | 3689 | 64 | 3 | 1.216 | 1.63 | 1 | |
| 235 | 0.8326 | 291.6 | 1.5 | 5454 | 104 | 86 | 1.119 | 2.151 | 2 | B2080 |
| 240 | 2.3656 | 197.6 | 3.1 | 4333 | 74 | 175 | 1.028 | 4.128 | 3 | |
| 242 | 0.8233 | 164.3 | 2.0 | 6083 | 589 | 484 | 1.076 | 2.66 | 1 | |
| 245 | 1.6268 | 258.2 | 1.7 | 6208 | 126 | 204 | 1.1 | 2.313 | 2 | B584 |
| 252 | 0.4192 | 311.5 | 1.5 | 5071 | 190 | 79 | 1.119 | 2.105 | 1 | |
| 253 | 2.6623 | 351.2 | 4.0 | 4020 | 30 | 79 | 1.012 | 5.734 | 3 | |
| 258 | 2.0749 | 343.2 | 2.9 | 6474 | 561 | 1164 | 1.034 | 3.662 | 3 | |
| 264 | 0.6413 | 331.5 | 4.5 | 5773 | 422 | 270 | 1.008 | 7.22 | 1 | |
| 268 | 2.3025 | 51.2 | 0.3 | 5868 | 305 | 702 | 1.326 | 1.373 | 2 | HU1368 |
| 293 | 0.7905 | 0.3 | 3.3 | 5817 | 313 | 247 | 1.024 | 4.22 | 1 | |
| 295 | 0.9838 | 151.8 | 4.1 | 5663 | 389 | 382 | 1.011 | 6.656 | 1 | |
| 308 | 0.1576 | 45.2 | 0.0 | 4416 | 201 | 31 | 1.414 | 1 | ||
| 309 | 0.3266 | 77.9 | 0.9 | 5312 | 345 | 112 | 1.199 | 1.692 | 1 | |
| 322 | 0.1761 | 126.5 | 0.7 | 5868 | 277 | 48 | 1.235 | 1.537 | 1 | |
| 325 | 0.5815 | 222.2 | 4.0 | 4275 | 180 | 104 | 1.012 | 1 | ||
| 337 | 0.1451 | 60.8 | 2.0 | 5369 | 292 | 42 | 1.076 | 2.606 | 1 | |
| 340 | 0.237 | 338.0 | 1.8 | 5655 | 497 | 117 | 1.091 | 2.39 | 1 | |
| 343 | 2.8471 | 321.0 | 4.5 | 5695 | 438 | 1247 | 1.008 | 7.817 | 3 | |
| 346 | 1.4329 | 285.3 | 5.6 | 5835 | 745 | 1067 | 1.003 | 1 | ||
| 348 | 1.3959 | 40.8 | 4.8 | 5714 | 420 | 586 | 1.006 | 8.958 | 1 | |
| 364 | 0.3739 | 96.1 | 0.0 | 6219 | 265 | 99 | 1.414 | 1.414 | 1 | |
| 369 | 0.6949 | 139.4 | 1.2 | 6228 | 126 | 87 | 1.154 | 2 | B600 | |
| 372 | 0.2386 | 260.6 | 2.6 | 5400 | 340 | 81 | 1.045 | 3.334 | 1 | |
| 378 | 0.1839 | 330.0 | 1.6 | 5894 | 629 | 115 | 1.109 | 2.316 | 1 | |
| 378 | 3.3108 | 312.3 | 1.5 | 5894 | 629 | 2082 | 1.119 | 2.232 | 1 | |
| 379 | 0.031 | 28.8 | 0.0 | 5895 | 227 | 7 | 1.414 | 1.414 | 1 | |
| 383 | 0.2665 | 333.6 | 1.5 | 5951 | 204 | 54 | 1.119 | 2.118 | 1 | |
| 386 | 1.1739 | 274.4 | 3.5 | 8100 | 452 | 530 | 1.02 | 5.111 | 3 | |
| 387 | 2.2878 | 342.9 | 3.2 | 6191 | 193 | 441 | 1.026 | 4.306 | 3 | |
| 394 | 3.2284 | 220.2 | 3.8 | 6329 | 149 | 481 | 1.015 | 5.583 | 2 | BU529 |
| 402 | 1.4388 | 233.4 | 5.2 | 5175 | 44 | 63 | 1.004 | 10.825 | 1 | |
| 405 | 0.3856 | 321.5 | 0.9 | 6138 | 266 | 102 | 1.199 | 1.785 | 1 | |
| 409 | 3.2443 | 20.4 | 5.2 | 4986 | 53 | 171 | 1.004 | 10.819 | 1 | |
| 415 | 2.2303 | 89.6 | 4.8 | 6471 | 381 | 849 | 1.006 | 8.547 | 1 | |
| 422 | 1.4038 | 118.8 | 4.5 | 5823 | 98 | 137 | 1.008 | 7.22 | 1 | |
| 427 | 2.6122 | 152.9 | 4.8 | 5409 | 145 | 378 | 1.006 | 8.843 | 1 | |
| 433 | 4.0098 | 324.5 | 2.9 | 8543 | 498 | 1996 | 1.034 | 3.795 | 3 | A3013 |
| 454 | 3.8682 | 256.7 | 2.2 | 6849 | 78 | 301 | 1.064 | 2.877 | 2 | I56 |
| 455 | 1.0333 | 317.5 | 0.7 | 3562 | 20 | 20 | 1.235 | 1.608 | 2 | RST2292BC |
| 462 | 0.167 | 196.1 | 0.3 | 5205 | 205 | 34 | 1.326 | 1.497 | 1 | |
| 463 | 0.8084 | 215.0 | 3.5 | 6497 | 177 | 143 | 1.02 | 4.761 | 1 | |
| 476 | 0.6568 | 145.4 | 4.6 | 7691 | 226 | 148 | 1.007 | 8.153 | 1 | |
| 487 | 0.5111 | 201.0 | 1.2 | 5450 | 125 | 63 | 1.154 | 1.932 | 2 | B2084AB |
| 487 | 2.993 | 130.2 | 5.1 | 5450 | 125 | 374 | 1.005 | 10.138 | 1 | |
| 494 | 2.2257 | 153.7 | 5.7 | 4985 | 100 | 222 | 1.003 | 13.599 | 1 | |
| 498 | 2.1845 | 251.5 | 3.5 | 6218 | 176 | 384 | 1.02 | 4.914 | 3 | RST4412AB |
| 522 | 0.753 | 241.1 | 4.9 | 7381 | 109 | 82 | 1.005 | 9.342 | 1 | |
| 527 | 0.2211 | 255.9 | 2.1 | 7403 | 163 | 36 | 1.07 | 2.738 | 1 | |
| 550 | 0.6009 | 116.1 | 1.7 | 5076 | 62 | 37 | 1.1 | 2.269 | 1 | |
| 563 | 0.3841 | 33.4 | 0.8 | 5383 | 157 | 60 | 1.216 | 1.694 | 1 | |
| 568 | 0.2946 | 190.7 | 0.8 | 305 | 89 | 1.216 | 2 | HDS1310 | ||
| 570 | 2.1638 | 110.6 | 6.6 | 5973 | 176 | 380 | 1.001 | 19.856 | 1 | |
| 575 | 0.6293 | 13.9 | 4.7 | 6529 | 173 | 108 | 1.007 | 8.367 | 1 | |
| 579 | 0.3303 | 202.6 | 3.3 | 4867 | 456 | 150 | 1.024 | 1 | ||
| 593 | 0.5794 | 169.7 | 3.9 | 7034 | 411 | 238 | 1.014 | 5.597 | 1 | |
| 594 | 2.8688 | 45.3 | 0.4 | 308 | 883 | 1.301 | 3 | B1595 | ||
| 598 | 1.7109 | 290.5 | 6.2 | 8324 | 581 | 994 | 1.002 | 16.803 | 1 | |
| 601 | 0.1512 | 352.5 | 3.1 | 6106 | 255 | 38 | 1.028 | 4.219 | 1 | |
| 602 | 0.976 | 164.4 | 3.7 | 7649 | 615 | 600 | 1.016 | 5.436 | 1 | |
| 605 | 0.6548 | 315.5 | 1.1 | 8265 | 508 | 332 | 1.168 | 1.938 | 2 | JSP296 |
| 608 | 0.248 | 44.4 | 0.1 | 8323 | 500 | 124 | 1.383 | 1.397 | 2 | RST2587 |
| 609 | 0.3001 | 91.1 | 4.0 | 6272 | 154 | 46 | 1.012 | 6.107 | 1 | |
| 611 | 2.3787 | 93.3 | 5.5 | 5689 | 96 | 228 | 1.003 | 12.33 | 3 | |
| 612 | 2.0252 | 98.7 | 3.9 | 6422 | 284 | 575 | 1.014 | 5.69 | 1 | |
| 612 | 0.1728 | 145.2 | 1.5 | 6422 | 284 | 49 | 1.119 | 2.079 | 1 | |
| 619 | 0.2797 | 234.6 | 1.0 | 5096 | 806 | 225 | 1.182 | 1 | ||
| 621 | 2.0655 | 19.2 | 6.5 | 7850 | 186 | 384 | 1.001 | 19.256 | 1 | |
| 630 | 0.2099 | 315.8 | 3.6 | 6849 | 295 | 61 | 1.018 | 5.245 | 1 | |
| 635 | 1.7656 | 260.4 | 4.8 | 5914 | 58 | 102 | 1.006 | 9.176 | 1 | |
| 637 | 2.3926 | 332.9 | 5.1 | 5637 | 63 | 150 | 1.005 | 10.059 | 3 | |
| 640 | 0.2498 | 85.2 | 4.8 | 6587 | 341 | 85 | 1.006 | 8.756 | 1 | |
| 642 | 0.9513 | 238.0 | 2.6 | 422 | 401 | 1.045 | 1 | |||
| 644 | 1.758 | 132.4 | 0.4 | 6112 | 1330 | 2338 | 1.301 | 2 | RST2447 | |
| 645 | 4.0745 | 109.0 | 1.9 | 5415 | 391 | 1593 | 1.083 | 2.505 | 3 | |
| 649 | 2.6777 | 130.3 | 3.2 | 430 | 1151 | 1.026 | 1 | |||
| 651 | 3.608 | 191.7 | 2.2 | 86 | 310 | 1.064 | 3 | BU17AB | ||
| 658 | 3.88 | 67.2 | 0.7 | 6521 | 245 | 950 | 1.235 | 1.627 | 3 | HJ4275 |
| 659 | 3.8774 | 67.2 | 1.0 | 5990 | 201 | 779 | 1.182 | 1.779 | 3 | |
| 666 | 0.248 | 257.4 | 2.8 | 6680 | 149 | 36 | 1.037 | 3.601 | 1 | |
| 676 | 1.5023 | 260.6 | 1.5 | 5430 | 545 | 818 | 1.119 | 2.151 | 3 | |
| 680 | 0.7809 | 331.0 | 4.3 | 5967 | 158 | 123 | 1.009 | 6.942 | 1 | |
| 684 | 0.2974 | 303.3 | 3.1 | 9488 | 580 | 172 | 1.028 | 4.103 | 1 | |
| 690 | 0.2221 | 292.4 | 1.2 | 5538 | 144 | 31 | 1.154 | 2.026 | 1 | |
| 697 | 1.1597 | 138.2 | 4.9 | 5447 | 92 | 106 | 1.005 | 9.255 | 1 | |
| 697 | 0.0709 | 165.9 | 0.2 | 5447 | 92 | 6 | 1.353 | 1.43 | 1 | |
| 703 | 1.4153 | 221.8 | 4.7 | 5384 | 111 | 157 | 1.007 | 8.449 | 1 | |
| 758 | 0.1738 | 349.0 | 1.1 | 6072 | 154 | 26 | 1.168 | 1.907 | 1 | |
| 759 | 2.694 | 234.6 | 3.6 | 6107 | 660 | 1778 | 1.018 | 5.257 | 3 | |
| 772 | 2.3419 | 165.3 | 5.8 | 5184 | 130 | 304 | 1.002 | 14.246 | 3 | |
| 779 | 1.5378 | 165.3 | 4.8 | 273 | 419 | 1.006 | 1 | |||
| 831 | 0.167 | 327.9 | 1.4 | 5808 | 86 | 14 | 1.129 | 1.941 | 2 | RST1830 |
| 832 | 3.2133 | 63.9 | 4.7 | 5623 | 278 | 893 | 1.007 | 8.384 | 1 | |
| 837 | 2.3128 | 281.7 | 4.6 | 6513 | 136 | 314 | 1.007 | 7.995 | 3 | |
| 847 | 1.2446 | 317.1 | 0.7 | 6055 | 659 | 820 | 1.235 | 3 | ||
| 851 | 1.8583 | 253.8 | 5.2 | 5782 | 155 | 288 | 1.004 | 3 | ||
| 905 | 2.2757 | 100.8 | 5.9 | 5565 | 153 | 348 | 1.002 | 15.332 | 3 | |
| 906 | 1.246 | 50.8 | 2.8 | 5954 | 138 | 171 | 1.037 | 3.575 | 2 | RST805 |
| 907 | 3.6665 | 52.0 | 1.1 | 6272 | 307 | 1125 | 1.168 | 1.852 | 3 | |
| 914 | 0.104 | 171.3 | 0.1 | 5321 | 233 | 24 | 1.383 | 1.35 | 1 | |
| 926 | 0.1903 | 159.6 | 2.2 | 5621 | 216 | 41 | 1.064 | 2.802 | 1 | |
| 930 | 0.692 | 32.6 | 2.5 | 6380 | 99 | 68 | 1.049 | 2 | B1455 | |
| 931 | 0.1118 | 56.8 | 0.3 | 6434 | 691 | 77 | 1.326 | 1 | ||
| 952 | 1.1682 | 135.0 | 4.7 | 7025 | 461 | 538 | 1.007 | 8.607 | 1 | |
| 952 | 0.1176 | 59.4 | 3.6 | 7025 | 461 | 54 | 1.018 | 5.245 | 1 | |
| 954 | 2.3471 | 50.2 | 6.2 | 5820 | 232 | 544 | 1.002 | 15.699 | 1 | |
| 1033 | 0.2684 | 220.4 | 1.7 | 6113 | 219 | 58 | 1.1 | 2.367 | 1 | |
| 1049 | 1.2782 | 154.2 | 5.6 | 6599 | 389 | 497 | 1.003 | 12.617 | 1 | |
Note. Columns (1)–(4) give the properties of companions to TOIs detected by SOAR. Uncertainties for these measurements and the observation epoch are provided in Table 6 in the
In general, the identity of the host star for an S-type planet in a close binary is ambiguous (Horch et al. 2014), although there is evidence that typically, the primary is more likely to be the planet host (Gaidos et al. 2016). Therefore, we report correction factors for each host scenario. Overall, we find a mean correction factor of 1.11 in the cases where all of the planets orbit the primary stars. This is similar to the factor of 1.08 found for Kepler planets (Ziegler et al. 2018b) under the same assumption. Likewise, if all planets orbit the secondary stars that are bound to the primary,11 the radii of the planets will increase by a factor of 2.55, on average. This is slightly less than the 3.29 found for Kepler planets by Ziegler et al. (2018b), which is likely due to the lower number of field stars detected in the TESS sample (see Section 2.4). Indeed, if a faint field companion is considered as bound, its estimated radius is small, and the resulting correction factor for the radius of a planet orbiting this companion becomes large.
In perhaps a more realistic scenario, where planets are equally likely to orbit the primary or secondary star, we find an average correction factor of 1.82. This again is slightly lower than the correction factor of 2.18 found with similar assumptions in the Kepler survey.
We can restrict our separation range to reduce the fraction of unassociated stars in our sample. Within 1'', we find mean correction factors of 1.14, 1.90, and 1.55 under the assumptions that all primary stars host the planets, all secondary stars host the planets, and either star is equally likely to host the planet, respectively. The latter figure, more probable than either of the other cases, is in agreement with the radius corrections of 1.6, 1.64, and 1.54 found for the Kepler planets by Ciardi et al. (2015), Hirsch et al. (2017), and Ziegler et al. (2018b), respectively.
3.3. Close Binary Inference with Gaia DR2
While Gaia DR2 typically cannot resolve binaries with separations less than approximately 07 (Ziegler et al. 2018a), the additional source does often result in spurious astrometric solutions. The reliability of the Gaia astrometry is quantified by the renormalized unit weight error (RUWE),12
which is near 1.0 for single sources, with a greater value (for instance, >1.4) indicating a nonsingle or otherwise extended source. Sources with only a two-parameter astrometric solution have null RUWE values.
We find that for the 135 observed TESS planet candidate hosts observed with SOAR with RUWE values >1.4, 114 had resolved companions. Twelve of the observed targets had null RUWE values, and all 12 had bright, close companions (Δmag < 2 and 01 < ρ < 05). For the observed targets with either high or null RUWE values, approximately 86% had companions, typically within the Gaia DR2 binary resolution limit of 07. The median RUWE value for resolved close binaries (ρ < 075) is 5.56, compared to 1.04 for wider binaries (ρ > 075) and 1.03 for single targets. Only six targets with close binaries have RUWE values less than 1.4, five (TOIs 264, 476, 575, 609, and 640) of which have high contrasts (Δmag > 4) and one (TOI-379) of which has a very low separation (ρ = 003). The RUWE values and properties of resolved systems are plotted in Figure 4.

Figure 4. Properties of companions to TESS planet candidate hosts resolved by SOAR, colored by the logarithm of each system's Gaia DR2 RUWE value, a metric quantifying the quality of the Gaia astrometric solution. Companions in systems with null RUWE values are indicated by blue triangles. While Gaia does not resolve close binaries (ρ < 07), the high or null RUWE value may be used to infer the existence of a companion star. This method is successful with an accuracy of 86% in our survey.
Download figure:
Standard image High-resolution imageIt is unclear why some single stars (21 out of 412 observed) have high RUWE values. One possibility is the number of Gaia observations of each star. Gaia uses a scanning law that passes through the north and south ecliptic poles every 6 hr, resulting in approximately twice as many observations at mid-ecliptic latitudes as near the ecliptic plane or poles (Gaia Collaboration et al. 2016). A Kolmogorov–Smirnov test, however, finds the distribution of ecliptic latitudes for single stars with high and low RUWE values to be similar. The distribution of Gaia magnitudes and nearby stellar densities (determined in Section 2.4) of single stars with high and low RUWE values was also similar.
It is also possible that the anomalously high RUWE values for single stars are a result of binaries not detected by the SOAR speckle observations, such as those with close separations or high magnitude differences outside the sensitivity of SOAR. Further observations with larger-aperture telescopes and laser guide star AO could confirm whether these single stars have companions. Of the 21 single stars with high RUWE values, five have the results of additional high-resolution imaging available on ExoFOP.13 None of the five targets had a detected companion star.
Checking for a high or null RUWE value can serve as an excellent first check for potential companion stars in TESS systems, although further high-resolution observations would still be required to determine the properties of a purported companion. The clustering of binary systems with null RUWE values in a region of similar separation and magnitude difference, however, could even be used to infer the vague properties of a subset of the unresolved stars in Gaia DR2.
4. Impact of Binary Stars on the TESS Planetary Systems
The presence of a binary companion can result in a dynamically harsh environment, reducing the probability that a planetary system can form and survive. Some planets are found in close binary systems, however. In this section, we search for further insight into the impact binary stars have on the TESS planet population.
4.1. Preparation of the Sample
To facilitate an analysis of the multiplicity of our observed targets, some sample preparation was required.
The speckle imaging is a snapshot of the host systems, providing an on-sky angular separation between the primary and secondary star. To determine the projected physical separations, the distance to each system is required. We collect distances to each of these targets from Gaia DR2 (Bailer-Jones et al. 2018), when available. However, Gaia can provide spurious astrometric solutions in the case of close, unresolved binaries (Arenou et al. 2018). So, when the Gaia distance errors are large (greater than 20%), we use the distances reported in the TIC (Stassun et al. 2019), which were derived using inverse Stefan–Boltzmann relations based on V magnitudes. The distances used for each target in this analysis are available in Table 1.
We prepare our sample by removing stars with Teff in the TIC inconsistent with an FGK-type star (i.e., Teff > 7200 and <3900 K) using the relations of Pecaut et al. (2012). We also remove binaries with contrasts indicating mass ratios q < 0.4. These systems, with high magnitude differences, are significantly more likely to be chance alignments based on the analysis in Section 2.4, and their exclusion enables comparisons between the Kepler (Kraus et al. 2016) and TESS sample. We determine q by finding the mass of the primary star based on its likely spectral type estimated using the Teff reported in the TIC and the secondary star based on the magnitude difference with the primary (Kraus & Hillenbrand 2007). We also remove systems with a TESS follow-up disposition of false positive and only a single transit detected by TESS. After these cuts, our sample includes 455 stars observed with SOAR.
To improve our coverage of wide binaries, we include companions to these 455 SOAR targets found in Gaia DR2 (Gaia Collaboration et al. 2018) with proper motions and distance estimates (Bailer-Jones et al. 2018) consistent at 2σ. We search out to an on-sky angular radius equivalent to a 5000 au projected separation based on the Gaia distance estimate. El-Badry & Rix (2018) found that the proper motion of wide binaries can vary significantly because of orbital motion. For each star, we calculate the maximum Keplerian orbital on-sky motion as a function of projected separation. The proper motion of each nearby Gaia star is allowed to vary by this orbital motion in our binary detection. The Gaia DR2 binaries used are listed in Table 5 in the
4.2. Multiplicity of Solar-type TESS Planet Candidate Hosts
Close binaries can provide many potential obstacles to planet formation and evolution. In a large survey of Kepler planets, Kraus et al. (2016) found that far fewer planets were detected around stars with companions at solar system scales within approximately 50 au. The TESS sample is quite disparate in several ways from the Kepler sample, as shown in Figure 1. In general, the TESS planets are somewhat larger and at shorter periods than the Kepler planets, a consequence of the TESS photometric precision and survey strategy. Unlike Kepler, the TESS planets are spread across the sky and sample a more diverse set of the Galactic stellar population, providing an opportunity to confirm and characterize the effect of binaries
To understand how binaries impact planetary systems, we compare our sample to a simulated survey of field solar-type stars. We use the field binary statistics of Raghavan et al. (2010), who found a flat eccentricity distribution, a lognormal period distribution (with a mean of log P = 5.03, corresponding to an orbital semimajor axis of approximately 50 au, and σlog P = 2.28), and a nearly uniform mass ratio distribution (with a sharp increase near-equal-mass ratio) in the population of solar-type field binaries. We follow the procedures of Kraus et al. (2016) to account for projection effects, Malmquist bias, and the detection limits of our survey. We also account for the reduced sensitivity of TESS to planet transits due to dilution by the stellar companion.
For each solar-type star observed in our survey, a Monte Carlo model was constructed to determine the expected number of binary companions at a range of projected separations between 1 and 5000 au. In each of 105 iterations, there was a 33% ± 2%, 8% ± 1%, and 3% ± 1% probability that one, two, or three companion stars would be populated, respectively (the observed multiplicity of solar-type stars). Since binaries are overrepresented in flux-limited surveys (Schmidt 1968), we correct for Malmquist bias by adjusting this probability by an additional factor equal to the fractional volume excess in binaries due to their relative brightness,  . The period, eccentricity, and mass ratio of these binaries were drawn from the distributions reported in Raghavan et al. (2010). The period was converted to a semimajor axis using the TIC estimated stellar masses. We select uniformly distributed values for the cosine of inclination, the position angle of the ascending node, the longitude of periastron, and the time of periastron passage. Finally, the instantaneous separation was projected to the distance to the primary star as reported in Gaia DR2. The mass ratio was converted to an approximate magnitude contrast using the relations in Kraus & Hillenbrand (2007), and possible detection by SOAR speckle imaging and Gaia DR2 was determined using the measured sensitivity limits and the companion's contrast and separation. We use the ratio of nondetected binaries to the total number of binaries at each separation to determine a completeness correction due to limitations in the ability to resolve close or wide companions.
The resulting observed binaries of TESS planet candidate hosts from SOAR and Gaia compared to the expected number derived for field stars are shown in Figure 5. The uncertainty in the expected number of observed binaries at each separation range is derived from the spread of binaries in the simulated surveys, which propagates the field binary rate uncertainties reported by Raghavan et al. (2010). The observed companion rate to the TESS planet candidates as a function of projected separation was determined by dividing the number of observed binaries by the total number of stars observed. The companion rate in each separation bin was then corrected for survey completeness using our measured sensitivity limits. The companion rates for the TESS planet candidate hosts and field solar-type stars are shown in Figure 6. The distributions differ substantially, both at close and wide separations, which we will address in turn.
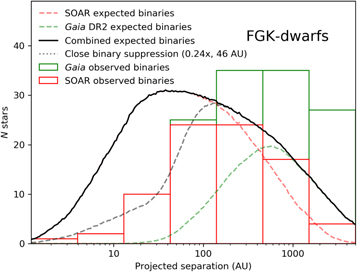
Figure 5. In red and green are the number of observed companions from SOAR and Gaia DR2 for solar-type TESS planet candidate hosts in logarithmic bins of projected separation of 0.5 dex width. Companions found in both SOAR and Gaia are included in the SOAR sample. In black is the expected distribution from a multiplicity study of field stars (Raghavan et al. 2010), combining both field binaries that would be detected by SOAR and Gaia. The expected binaries from SOAR and Gaia are also plotted individually. These distributions take into account the detection sensitivity of both SOAR and Gaia. The observed distribution shows a clear paucity of TESS planet candidate host binaries at small projected separations compared to the field stars and the inverse at wide separations. A best-fit model for the close binary suppression applied to the expected distribution of binaries for field stars is also plotted. The best-fit model has binaries suppressed by a factor of 0.24 at physical separations less than 46 au.
Download figure:
Standard image High-resolution image
Figure 6. The observed companion rates for the solar-type TESS planet candidate hosts, corrected for survey completeness, for logarithmic bins with a width of 0.5 dex are shown by the black bars. The completeness factors are based on the binary statistics of Raghavan et al. (2010) and our detection limits. The estimated companion rates for field stars, plotted by blue points, are included for comparison. The cumulative distributions for the TESS planet candidates and field stars are plotted as dotted and solid lines, respectively.
Download figure:
Standard image High-resolution image4.2.1. Bias against Planet Detection in Binaries
The additional flux from a companion star reduces the depth of the transit, making planet detection more difficult, and the TIC (Stassun et al. 2019) was constructed without consideration for potential stellar multiplicity. Left uncorrected, this observational bias would result in fewer binaries being detected among planet hosts, as transiting planets are easier to detect around single stars with no flux dilution.
We quantify the magnitude of this bias using the methods of Wang et al. (2015), adapted for the TESS sample. The planet search pipeline for TESS, run by the Science Processing Operations Center (SPOC; Jenkins et al. 2016), flags a potential transit candidate if the signal-to-noise ratio (S/N) is greater than 7.1. The S/N can be calculated by the equation

where δ is the transit depth, CDPPeff is the effective combined differential photometric precision per transit, and Ntransits is the number of observed transits. In the presence of a companion star, the transit depth is reduced due to the additional flux by a factor X given in Equations (1) and (2), depending on the identity of the host star, which likewise reduces the S/N of the detection.
We estimate the detection bias using a simulation for each of the TESS systems observed with no binary companion. For every single system, we choose the planet that has the highest S/N and add a companion star, whose mass is drawn randomly from the binary mass distribution described in Raghavan et al. (2010; e.g., uniform with a spike near unity). The transit depth of the planet is calculated for one of two randomly selected scenarios: (1) the planet orbits the primary star with reduced transit depth from the second star, or (2) the planet orbits the secondary with updated transit depth due to the different stellar radius and dilution from the primary star. For the selected scenario, the S/N of the detection is calculated using the new transit depth, and, if greater than 7.1, it was determined that the planet could still be detected by TESS with the companion star. This procedure is repeated 105 times for each observed TESS system to determine α, the probability of a planet detection in that system if a stellar companion is present. The distribution of α for the observed systems is an indication of the magnitude of the binary detection bias (i.e., if most of the observed planets in single systems would still be detectable even with a binary companion, then it is likely that a few additional planet signals were not detected by TESS due to dilution from a second star). Relevant data and α-values for each system are provided in the
We find that most of the TESS systems would still be detectable even with an equal-mass companion, with median and mean α-values of 1.0 and 0.97. Significantly more TESS planets are detectable with companions compared to the Kepler sample of Wang et al. (2015), who found a median value of α = 0.89. This is likely due to the larger radii and lower periods of the TESS planets, which result in higher S/N. We would expect that 9 ± 2 of the 416 observed single systems (2.1% ± 0.4%) would not have planets detected by TESS if each were in stellar binaries. Therefore, the number of potential TESS planets that were not detected due to binary dilution is likely to be small relative to the number of systems observed, and we expect that the detection bias against planets in binary systems does not significantly impact the subsequent analysis.
In the simulations, the stellar radii are from the TIC. The stellar radii of secondary stars were determined using the mass–radius relationship of Feiden & Chaboyer (2012). The CDPPeff was estimated from the TESS-band magnitude of the primary and the photometric precision model of Stassun et al. (2018), interpolated based on the transit duration.
4.2.2. Suppression of Planet-hosting Close Binaries
We find significantly fewer binaries in the TESS sample with projected separations of less than 100 au than would be expected for a similar survey of field stars (44 observed binaries compared to an expectation of 124 ± 8,14
a 9.0σ discrepancy). We find a completeness-corrected companion rate for TESS planet hosts of  at projected separations of less than 100 au and larger than 1 au. For comparison, we estimate for field stars a companion rate at similar projected separations of
  using the binary statistics of Raghavan et al. (2010). TESS planet hosts are therefore approximately 3× less likely to have a close binary companion compared to field stars.
Similar to Kraus et al. (2016), the dearth of close binaries for planet hosts can be modeled by a simple two-parameter model using a suppression factor, Sbin, that cuts on at some semimajor axis value, acut. We performed a Markov Chain Monte Carlo (MCMC) analysis to explore 106 possible values for Sbin and acut, seeking to reduce the χ2 goodness of fit to the observed distribution. The resulting distributions are shown in Figure 7. We find the optimal values for the suppression with 68% credibility ranges to be Sbin = 24 and acut = 46
 au, shown in Figure 5. These values are in agreement with those found by Kraus et al. (2016) for Kepler planet candidates (Sbin = 34
 and acut = 47
 au), and again, the null hypothesis (i.e., the field and planet candidate host distribution are similar with no binary suppression occurring) is strongly disfavored at 9.8σ.
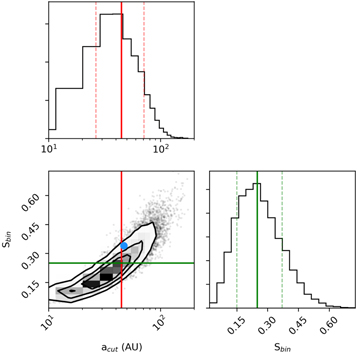
Figure 7. Distributions of suppression factors and semimajor axis cuts from 106 chains of an MCMC analysis to model the observed close binary suppression seen in systems with TESS planet candidates. Solid lines indicate the median value of each distribution (acut = 46 au and Sbin = 0.24), and dashed lines mark the 68% confidence interval. The two parameters are correlated, such that less suppression is required if the semimajor axis cutoff is larger, and vice versa. A blue circle marks the values of the best-fit model from the Kepler sample of Kraus et al. (2016).
Download figure:
Standard image High-resolution image4.2.3. Enhancement of Wide Binaries in Systems with Large Planets
At wide separations, more binaries were detected around the TESS planet candidate hosts compared to the field stars: 119 observed binaries with projected separations greater than 100 au, compared to an expected number of 77 ± 7, a 4.9σ discrepancy.
The wide binaries being detected are almost exclusively those hosting the large planet candidates. This is readily apparent if we split our sample into two bins using a radius cut of 9 R⊕ (approximately the size of Saturn), as shown in Figure 8. We find that both populations of 244 small and 199 large planets exhibit a paucity of systems in close binaries. At wide separations, however, the companion rates for the two populations diverge: at projected separations greater than 200 and 103 au, large planet hosts have completeness-corrected companion rates of 47.8% ± 3.8% and 30.4% ± 3.4%, respectively. For small planet hosts, the companion rates for similar projected separation ranges are  and
and  , respectively. Thus, the two populations have discrepant companion rates for projected separations greater than 200 and 103 au with significances of 9.8σ and 8.1σ, respectively.
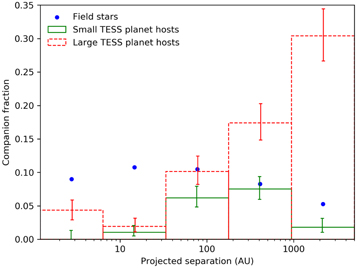
Figure 8. Completeness-corrected companion fraction per 0.5 dex bins in projected separation for small and large TESS planet candidate hosts observed in this survey. For reference, the separation distribution of field binaries from Raghavan et al. (2010) is included. Both populations of TESS planet hosts have suppressed rates of close binaries but diverging binary rates at wide projected separations. Large planets (Rp > 9 R⊕) are approximately 3.5× more likely to be found in a wide binary, compared to field stars. Conversely, small planets are 2× less likely to be found in a wide binary.
Download figure:
Standard image High-resolution imageThe companion rates for the small and large planets at wide separations are also both significantly divergent from that of field stars. We estimate from the distribution of Raghavan et al. (2010) that field stars have a companion rate of 13.7% and 5.3% at projected separations greater than 200 and 103 au, respectively. Therefore, large TESS planets are approximately a factor of 3.5 more likely to be hosted in a wide binary than would be expected. Conversely, small TESS planets are 2× less likely to be found in a wide binary system than would be expected from field star statistics.
4.3. Binary Fraction of M Dwarf Planet Candidate Hosts
We observed 44 planet candidate hosts with Teff estimates in the TIC consistent with an M dwarf (Teff < 3900 K; Pecaut et al. 2012). We detected companions to 16 of these hosts, for a multiplicity fraction of 36% ± 9%. This is consistent with the field star M dwarf multiplicity fraction of 26.8% ± 1.4% found by Winters et al. (2019).
To compare the separation distribution of planet candidate M dwarf hosts to the field star population, we use the companion fraction, the lognormal projected separation distribution (peaking at 20 au with σlog a = 1.16), and the uniform mass ratio distribution (with a slight increase in near-equal-mass binaries) found by Winters et al. (2019). The resulting distribution is shown in Figure 9.
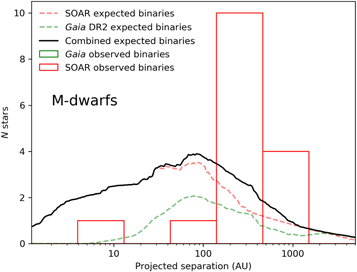
Figure 9. Similar to Figure 5 for TESS M dwarf planet candidate hosts, using the field binary statistics of Winters et al. (2019). As with the solar-type stars, the M dwarf planet candidate hosts have a deficit of close binaries at separations less than 100 au and a surplus of wide binaries separated by more than 100 au.
Download figure:
Standard image High-resolution imageWe find fewer close binaries than would be expected for the M dwarf planet candidate hosts: two observed compared to approximately 11 expected at projected separations of less than 100 au. We also find a large number of companions at wider separations: 14 observed companions at projected separations between 100 and 5000 au, compared to approximately five that would be expected.
Both of these results mirror those found with the solar-type sample. We do not see a large number of companions at very wide projected separations (s > 1000 au). This may, in part, be due to the M dwarf projected separation distribution peaking at lower separations (∼20 au rather than ∼50 au) and with lower variance than the solar-type sample. Also, as shown in Section 4.2.3, the widest binaries typically host Jupiter-sized planets, which are inherently rare around M dwarfs (Dressing & Charbonneau 2013).
4.4. Mass Ratios of Planet Candidate Host Binaries
The mass ratio, or q, distribution of solar-type binary systems was found to be nearly uniform by Raghavan et al. (2010), with an increase for near-equal-mass binaries. Winters et al. (2019) found a similar distribution at high-q for M dwarfs. Ngo et al. (2016) found that the mass ratio distribution for hosts of hot Jupiters was heavily weighted toward low-q companions.
The mass ratio distribution of resolved TESS planet candidate hosts may vary significantly from that of field stars. To compare the two populations, we use the mass ratios derived from the observed magnitude difference, as described in Section 4.1, for the SOAR binaries, while for the field stars, we use the mass ratios from the simulation described in Section 4.2, which takes into account our survey sensitivity.
The observed and expected mass ratio distribution of binaries to TESS planet candidate hosts is shown in Figure 10. The mass ratio distribution of observed binaries is consistent with being uniform for q > 0.4; for lower mass ratios, the SOAR sensitivity is low. There is no significant difference in the distribution for small and large planets (cut at 9 R⊕). Compared to the expected number based on field star statistics, we find slightly fewer high-q binaries, due in part to binary suppression at low separations, and slightly more low-q binaries, which is likely to be, at least in part, a consequence of unassociated field star contamination as the companions with large magnitude differences are at wide separations.
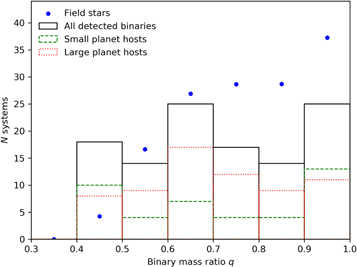
Figure 10. Mass ratio distribution of all observed binaries to TESS planet candidates resolved in SOAR speckle imaging, including the individual distributions for large and small planet candidate hosting stars. The expected distribution of observed binaries based on the near-uniform mass ratio distribution of field stars (Raghavan et al. 2010) and the survey sensitivity is included. The observed mass distribution is consistent with uniform.
Download figure:
Standard image High-resolution image5. Binary Impact on the Galactic Planet Population
Approximately half of the solar-type field stars in our galaxy are found with a stellar companion, and, as discussed in Section 1, the impact binaries have on the planet population is potentially large. The TESS sample is not statistically complete, containing a combination of small planets, similar to the majority of planets detected by Kepler, and many large planets, similar to the extensively studied population of hot Jupiters (e.g., Wu et al. 2007; Knutson et al. 2014; Evans et al. 2016; Ngo et al. 2016). In our data, we see a combination of two separate effects found individually in previous studies: suppression of planets in binaries at low separations and enhancement of binaries at wide separations.
Follow-up observations of the planet candidate hosts found in the Kepler survey gave some insight into how binaries impact planetary systems. Wang et al. (2015) found some evidence in radial velocity trends that binaries at separations <100 au may suppress planet occurrence. Kraus et al. (2016) found that approximately a fifth of the solar-type stars are not able to host planets due to the influence of stellar companions. Significant suppression in the rate of spectroscopic binaries hosting planets was detected by Ngo et al. (2016), which helps rule out an unresolved population of very close stellar companions. We find similar suppression of close binaries among the TESS planet candidates, suggesting that this effect is likely prevalent throughout the Galaxy in regions of varying stellar density and age. The suppression of close binaries is apparent regardless of cuts in the orbital period, planetary radii, or stellar effective temperature.
As noted by Kraus et al. (2016), it is not clear why some close binaries are able to host planets with all of the theoretical obstacles to their formation and survival. Many of the TESS binaries that are close in projection likely have short orbital periods, meaning that their motion may be detected over the coming years. Continued monitoring can provide orbital solutions for these systems to find a true physical separation rather than the projected separation presented here. Studying these orbits may provide insight into the conditions that exist such that planets may form and survive in the chaotic regime around close binaries.
It is possible that the enhanced companion fraction for small planets may be, at least in part, due to observation effects: the false-positive rate of giant planets in transiting planet surveys has been found to be larger than that for smaller planets (Fressin et al. 2013). The radii of Jupiter-mass planets and brown dwarfs are similar, and mass constraints are required to confirm each planet. However, brown dwarfs on close transits seem to be inherently rarer than massive planets (Bowler 2016). In addition, while a planet is more likely to be hosted by the primary star in the majority of systems (Gaidos et al. 2016), multiple star systems will have some enhancement in planet occurrence due to having additional potential hosts.
The exclusion of previously confirmed planets from our target list, as discussed in Section 2, may result in a bias in our sample. Many of these confirmed planets were detected in ground-based surveys, which may avoid resolved binaries (Street et al. 2003; Bakos 2018), or avoid following up systems with binary indicators, such as multiple sets of spectral lines (Triaud et al. 2017). In addition, the contamination from unresolved, near-equal-mass binaries may result in the nondetection of planets by ground-based surveys (Bouma et al. 2018). Some of these planets may subsequently be detected by TESS. These observational biases could result in an inflated companion rate for the newly detected TESS systems in our survey.
Previous binary surveys of large planet hosts that were detected exclusively from ground-based surveys find a similar enhancement in binaries at wide separations. Ngo et al. (2016) found that stars hosting hot Jupiters were approximately three times more likely to have stellar companions than field stars. Fontanive et al. (2019) found a wide binary fraction (20–10,000 au separations) for gas giants approximately twice that of field stars. Similarly, Ziegler et al. (2018c) found that the large, close-in Kepler planets were significantly more likely to have companions than other populations of planets. We find a similar effect for our sample as a whole. However, closer analysis reveals that this enhancement is due only to the systems hosting the largest planets. Indeed, a suppression effect is also seen for small planets in binaries at very wide projected separations (s > 1000 au).
There are two possible physical scenarios that could lead to a high companion fraction for systems hosting hot Jupiters: first, the binary companion may encourage in some manner the formation of large planets; and second, large planets form at similar rates in single and multiple star systems, but in binaries, the companion star drives large planets inward to the low-period regime probed by TESS. For the former, there is evidence that a stellar companion can lead to density waves in the protoplanetary disks (Dong et al. 2015). These high-density regions can subsequently seed the formation of planetesimals (Carrera et al. 2015). In addition, the protoplanetary disks around binary stars may have more mass than around single stars, which simulations suggest leads to larger planets (Mordasini et al. 2012).
The high number of gas giants in binaries coupled with the low number of observed smaller planets may be explained by planet–planet scattering during migration. In other words, the orbits of the inner smaller planets may be altered by the gas giants being driven inward to low-period orbits. In one possible scenario, Kozai–Lidov instabilities induced by the stellar companion may initially drive the gas giant to a highly eccentric orbit (Holman et al. 1997; Naoz et al. 2011). Ngo et al. (2016) and Fontanive et al. (2019) found that the Kozai–Lidov effect alone was insufficient to explain the observed population of hot Jupiters. In scattering events, large planets on wide orbits are preferred, as quantified by the Safronov number (Ford & Rasio 2008). The highly eccentric gas giant in this scenario would dominate the inner planets as it nears perihelion, resulting in planet scattering events (Fabrycky & Tremaine 2007). Eventually, the gas giant orbit will circularize to a low-period orbit due to planet–star tidal friction (Jackson 2009). Observational evidence suggests that planetary interactions during secular migration are not unusual: around a quarter of hot Jupiters are found on retrograde orbits, only possible through close planetary perturbations (Naoz et al. 2011; Ngo et al. 2015).
Dynamical interactions between planets with high mass disparities may dramatically alter the orbital inclination of the smaller planet, in many cases to a nontransiting orientation (Hamers 2017), or drive the smaller planets to highly eccentric orbits (Xie et al. 2016) and possibly even ejection from the system (Davies et al. 2014). Planet–planet scattering has been shown to largely reproduce the observed distribution of eccentricities in transiting planets (e.g., Ford & Rasio 2008; Jurić & Tremaine 2008; Raymond et al. 2011). Numerical investigations suggest that instabilities in giant planet orbits are likely destructive to inner terrestrial planets (Veras & Armitage 2006; Matsumura et al. 2013). Indeed, Kepler found that only a small fraction of small, close-in planets had gas giants in nearby orbits (Lissauer et al. 2011; Ciardi et al. 2013; Huang et al. 2016). Lastly, Wang et al. (2015) found that systems hosting small planets had fewer companions than field stars at separations up to 1500 au, compared to 100 au for systems with hot Jupiters. As they noted, another possible explanation for this disparity is that the relative timescales of pericenter and nodal precession increase as planetary mass decreases (Takeda et al. 2008). Thus, for small planets, the Kozai timescale will be shorter than precession. Consequently, the weaker planet–planet coupling means smaller planets are more prone to the influence of distant stellar companions.
6. Conclusions
We searched 542 TESS planet candidate hosts for companions using SOAR speckle imaging. We found 123 companions within 3'' of 117 targets. Contamination from these companions in the TESS light curves results in the radii of planet candidates in these systems increasing by a factor of 1.11, assuming the primary star is indeed the host. We find that TESS planet candidate hosts are around 3.5× less likely to have stellar companions at projected separations less than approximately 50 au than field stars. The destructive impact of close binaries, previously seen in the Kepler sample, is apparent in the local Galaxy. We also detect far more large planets and far fewer small planets in wide binaries than would be expected for field stars. This may be evidence of chaotic secular migration of gas giants resulting from perturbations from the binary companion inducing planet–planet scattering. The M dwarfs hosting planet candidates have a similar binary pattern as the solar-type sample. The mass ratio distribution of planet candidate hosting stars is consistent with uniform, as is seen in field stars.
Future multiband speckle observations by SOAR of the resolved binary systems hosting TESS planets will be able to determine the probability that the companions are indeed physically associated. In addition, multi-epoch observations over the coming years will be able to check for common proper motion and solve the orbits of bound systems, providing the semimajor axis and eccentricity of the binary systems hosting planets. Analysis of these binaries may provide insight into how some close systems were able to form and maintain their planetary populations. Lastly, the detection of northern planet candidates by TESS, beginning in 2019, will provide many more nearby planet-hosting systems. Their proximity will allow efficient instruments on moderate-sized telescopes in the north, such as Robo-AO on the University of Hawaii 88 inch (Baranec et al. 2017), to detect companions at solar system scales.
We thank the anonymous referee for a careful analysis and useful comments on the manuscript.
C.Z. is supported by a Dunlap Fellowship at the Dunlap Institute for Astronomy & Astrophysics, funded through an endowment established by the Dunlap family and the University of Toronto. A.W.M. was supported by NASA grant 80NSSC19K0097 to the University of North Carolina at Chapel Hill.
Based on observations obtained at the Southern Astrophysical Research (SOAR) telescope, which is a joint project of the Ministério da Ciência, Tecnologia, Inovações e Comunicações (MCTIC) do Brasil, the U.S. National Optical Astronomy Observatory (NOAO), the University of North Carolina at Chapel Hill (UNC), and Michigan State University (MSU).
This paper includes data collected by the TESS mission. Funding for the TESS mission is provided by the NASA Explorer Program. This work has made use of data from the European Space Agency (ESA) mission Gaia (https://www.cosmos.esa.int/gaia), processed by the Gaia Data Processing and Analysis Consortium (DPAC; https://www.cosmos.esa.int/web/gaia/dpac/consortium). Funding for the DPAC has been provided by national institutions, in particular the institutions participating in the Gaia Multilateral Agreement. This research has made use of the Exoplanet Follow-up Observation Program website, which is operated by the California Institute of Technology, under contract with the National Aeronautics and Space Administration under the Exoplanet Exploration Program. This work made use of the Washington Double Star Catalog maintained at USNO.
Facilities: SOAR (HRCam) - , TESS - , Gaia. -
Software: astropy (Astropy Collaboration et al. 2013; Price-Whelan et al. 2018), emcee (Foreman-Mackey et al. 2013), corner (Foreman-Mackey 2016).
Appendix
In Figures 11–14 we show the speckle autocorrelation functions from SOAR speckle observing of TESS planet candidate host stars with resolved nearby stars. In Table 2, we detail the crossmatch between SOAR detected binaries and nearby stars in the TIC. In Table 3, we list the estimated bias against detection of planets within multiple star systems by TESS. In Table 4, we detail the crossmatch between SOAR detected binaries and nearby stars in Gaia DR2. In Table 5, we detail nearby stars in Gaia DR2 that were not detected by SOAR. In Table 6, we provide the full SOAR speckle observation list and binary properties.

Figure 11. Speckle ACFs from SOAR speckle observing of TESS planet candidate host stars with resolved nearby stars. Each nearby star is mirrored in the images, with the true location marked by an arrow. Images are presented with an inverse linear scale for clarity. The orientation is similar in all images, with north pointed up and east to the left. A compass is shown in the top left image for reference.
Download figure:
Standard image High-resolution image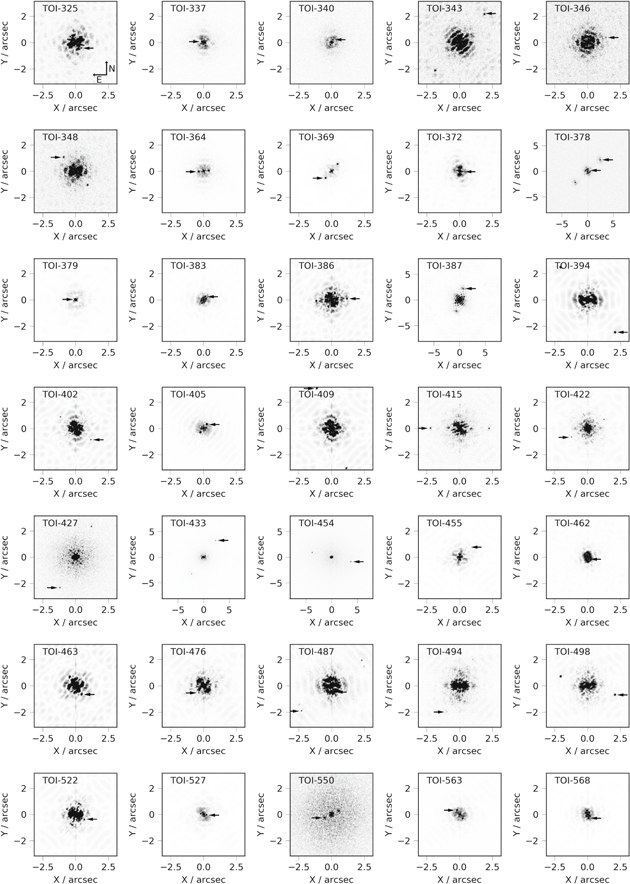
Figure 12. Similar to Figure 11.
Download figure:
Standard image High-resolution image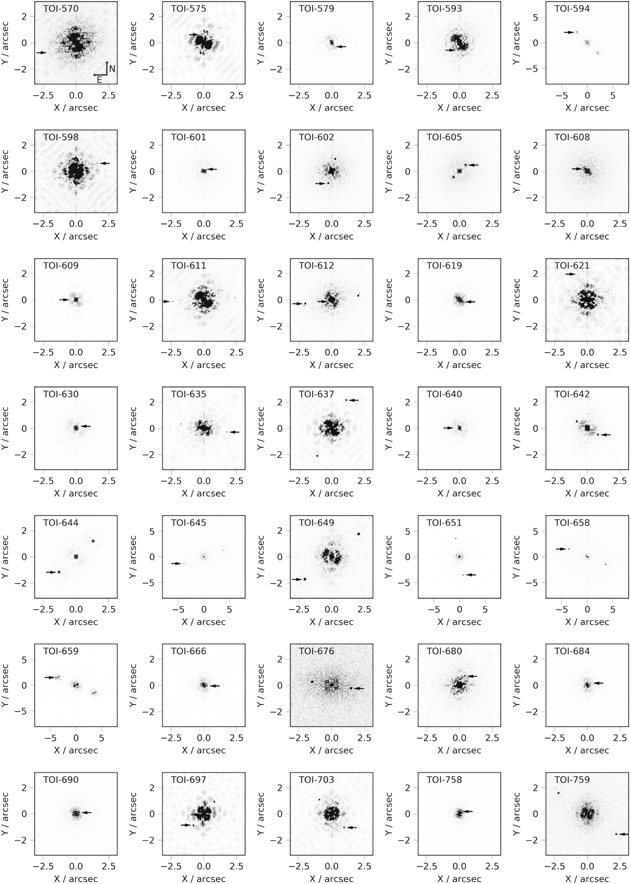
Figure 13. Similar to Figure 11.
Download figure:
Standard image High-resolution image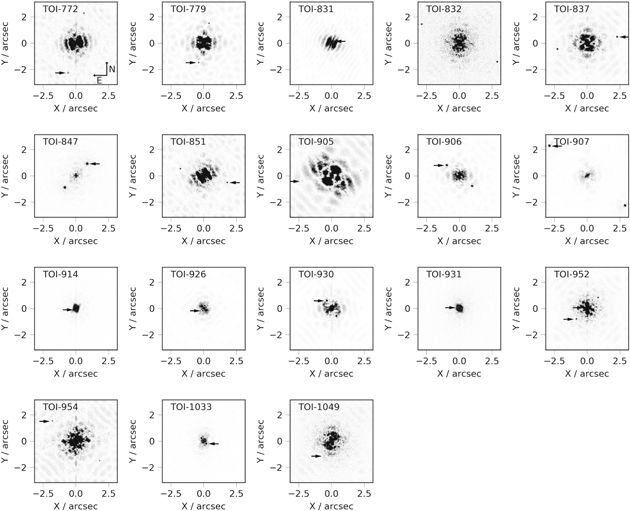
Figure 14. Similar to Figure 11.
Download figure:
Standard image High-resolution image
Table 2. TIC Matches to Resolved Binaries Detected by SOAR
| TOI | TIC | TIC | SOAR | TIC | ||||
|---|---|---|---|---|---|---|---|---|
| Primary | Secondary | Sep. | P.A. | Contrast | Sep. | P.A. | Contrast | |
| (arcsec) | (deg) | (mag) | (arcsec) | (deg) | (mag) | |||
| (1) | (2) | (3) | (4) | (5) | (6) | (7) | (8) | (9) |
| 123 | 290131778 | 1992266045 | 1.2894 | 294.6 | 1.8 | 1.37 | 292.2 | 1.66 |
| 128 | 391949880 | 675054894 | 2.2195 | 153.8 | 2.4 | 2.17 | 153.2 | 2.51 |
| 147 | 220435095 | 685140266 | 2.6583 | 217.6 | 4.6 | 2.65 | 217.8 | 4.81 |
| 149 | 260985861 | 675057530 | 1.117 | 132.6 | 0.1 | 0.73 | 132.0 | 0.82 |
| 167 | 149990841 | 737110430 | 0.1593 | 306.6 | 0.8 | 0.39 | 126.0 | 0.06 |
| 180 | 51912829 | 615712419 | 1.2682 | 63.7 | 4.3 | 1.69 | 60.8 | 4.15 |
| 240 | 101948569 | 616347276 | 2.3656 | 197.6 | 3.1 | 2.3 | 197.7 | 3.19 |
| 253 | 322063810 | 616169972 | 2.6623 | 351.2 | 4.0 | 2.58 | 353.9 | 3.82 |
| 258 | 350445771 | 734530071 | 2.0749 | 343.2 | 2.9 | 2.07 | 343.5 | 2.93 |
| 343 | 66497310 | 2052060639 | 2.8471 | 321.0 | 4.5 | 2.68 | 321.0 | 4.93 |
| 386 | 238059180 | 767048826 | 1.1739 | 274.4 | 3.5 | 1.21 | 276.1 | 3.21 |
| 387 | 92359850 | 651667037 | 2.2878 | 342.9 | 3.2 | 2.28 | 341.9 | 3.45 |
| 427 | 70914192 | 686486697 | 2.6122 | 152.9 | 4.8 | 2.62 | 152.6 | 4.95 |
| 433 | 188989177 | 188989178 | 4.0098 | 324.5 | 2.9 | 3.98 | 324.0 | 2.85 |
| 498 | 121338379 | 803532221 | 2.1845 | 251.5 | 3.5 | 2.62 | 259.0 | 3.42 |
| 594 | 146406806 | 824851862 | 2.8688 | 45.3 | 0.4 | 2.47 | 46.0 | 0.75 |
| 611 | 154459165 | 831946954 | 2.3787 | 93.3 | 5.5 | 1.93 | 105.0 | 5.83 |
| 637 | 133334108 | 821927265 | 2.3926 | 332.9 | 5.1 | 2.41 | 330.4 | 5.02 |
| 645 | 157568289 | 157568287 | 4.0745 | 109.0 | 1.9 | 4.07 | 108.9 | 1.88 |
| 651 | 293689267 | 293689266 | 3.2615 | 219.3 | 1.5 | 3.68 | 39.3 | −0.47 |
| 658 | 48476907 | 48476908 | 3.88 | 67.2 | 0.7 | 3.87 | 68.4 | 0.71 |
| 659 | 48476908 | 48476907 | 3.8774 | 67.2 | 1.0 | 3.87 | 248.4 | −0.71 |
| 676 | 219187649 | 901927162 | 1.5023 | 260.6 | 1.5 | 1.5 | 261.2 | 1.9 |
| 759 | 152147232 | 942050885 | 2.694 | 234.6 | 3.6 | 2.69 | 236.0 | 3.56 |
| 772 | 286864983 | 951863424 | 2.3419 | 165.3 | 5.8 | 2.45 | 176.9 | 5.84 |
| 837 | 460205581 | 847769574 | 2.3128 | 281.7 | 4.6 | 2.31 | 280.9 | 4.7 |
| 851 | 40083958 | 610472559 | 1.8583 | 253.8 | 5.2 | 1.92 | 253.1 | 5.59 |
| 847 | 231289421 | 650780404 | 1.2446 | 317.1 | 0.7 | 0.85 | 320.9 | 1.09 |
| 905 | 261867566 | 1105898342 | 2.2757 | 100.8 | 5.9 | 2.14 | 101.5 | 6.21 |
| 907 | 305424003 | 1510534043 | 3.6665 | 52.0 | 1.1 | 3.64 | 52.1 | 1.0 |
Note. Column (1) is the TOI number. Columns (2) and (3) are the TIC number for the primary and secondary stars. Columns (4)–(6) give the measured separation, position angle, and I-band contrast from the SOAR observations. Columns (7)–(9) give the separation and position angle for the system derived from the TIC coordinates and the TESS band contrast for each pair of stars.
Table 3. Detection Bias of TESS Planets in Multiple Star Systems
| TOI | Period | RP | R* | Duration | Depth | CDPPeff | Sectors | α |
|---|---|---|---|---|---|---|---|---|
| (days) | (R⊕) | (R☉) | (hr) | (ppm) | (ppm) | |||
| (1) | (2) | (3) | (4) | (5) | (6) | (7) | (8) | (9) |
| 101 | 1.43 | 13.15 | 0.89 | 1.64 | 20452 | 597.0 | 1 | 1.0 |
| 109 | 2.77 | 11.66 | 0.98 | 2.57 | 15691 | 822.2 | 1 | 1.0 |
| 112 | 2.5 | 14.84 | 1.14 | 2.88 | 15044 | 277.6 | 4 | 1.0 |
| 114 | 3.29 | 10.84 | 1.24 | 3.41 | 7125 | 148.2 | 6 | 1.0 |
| 118 | 6.04 | 4.93 | 1.05 | 2.12 | 1704 | 97.0 | 1 | 1.0 |
| 119 | 5.54 | 2.47 | 0.82 | 3.03 | 625 | 84.5 | 6 | 1.0 |
| 120 | 11.54 | 12.22 | 2.34 | 8.56 | 2389 | 25.7 | 1 | 1.0 |
| 121 | 14.78 | 14.78 | 1.23 | 5.45 | 14107 | 84.2 | 1 | 1.0 |
| 122 | 5.08 | 2.39 | 0.33 | 1.16 | 6501 | 1104.9 | 1 | 1.0 |
| 124 | 1.84 | 7.1 | 4.09 | 1.72 | 2469 | 275.2 | 2 | 1.0 |
Note. Column (1) is the TOI number. Columns (2) and (3) give the period and radius of the planet with the highest S/N. Column (4) gives the stellar radius from the TIC of the primary star. Columns (5) and (6) give the transit duration and depth from the TESS light curves. Column (7) gives the effective combined differential photometric precision, estimated from the photometric precision model of Stassun et al. (2019) and interpolated to the duration of the transit. Column (8) is the number of TESS sectors in which the target was observed. Column (9) is the correction factor for the bias against planet detection in binary stars. The factor ranges from zero to 1, with 1 indicating a 100% detection rate even with the flux contamination from a companion star.
Only a portion of this table is shown here to demonstrate its form and content. A machine-readable version of the full table is available.
Download table as: DataTypeset image
Table 4. Gaia DR2 Matches to Resolved Binaries Detected by SOAR
| TOI | TIC | Gaia DR2 IDs | SOAR | Gaia DR2 | |||||
|---|---|---|---|---|---|---|---|---|---|
| Primary | Secondary | Sep. | P.A. | Contrast | Sep. | P.A. | Contrast | ||
| (arcsec) | (deg) | (mag) | (arcsec) | (deg) | (mag) | ||||
| (1) | (2) | (3) | (4) | (5) | (6) | (7) | (8) | (9) | (10) |
| 123 | 290131778 | 6790773586275235200 | 6790773586276283648 | 1.2894 | 294.6 | 1.8 | 1.299 | 294.18 | 1.74 |
| 128 | 391949880 | 4621607053580909568 | 4621606297664620544 | 2.2195 | 153.8 | 2.4 | 2.2 | 153.78 | 2.55 |
| 147 | 220435095 | 4762555785607165824 | 4762555785606163712 | 2.6583 | 217.6 | 4.6 | 2.642 | 217.78 | 4.73 |
| 149 | 260985861 | 4621665155898448768 | 4621665155896340480 | 1.117 | 132.6 | 0.1 | 1.112 | 132.92 | 0.1 |
| 165 | 350743714 | 4765618612685018368 | 4765618681404494976 | 2.4855 | 254.5 | 0.8 | 2.476 | 254.49 | 0.81 |
| 180 | 51912829 | 4704412128965720448 | 4704412133261234176 | 1.2682 | 63.7 | 4.3 | 1.259 | 63.1 | 4.21 |
| 240 | 101948569 | 4982951791883929472 | 4982951791883929600 | 2.3656 | 197.6 | 3.1 | 2.347 | 197.72 | 3.44 |
| 245 | 154618248 | 6554931361478622976 | 6554931365773693952 | 1.6268 | 258.2 | 1.7 | 1.623 | 258.11 | 1.93 |
| 253 | 322063810 | 4928367189956040960 | 4928367189957786240 | 2.6623 | 351.2 | 4.0 | 2.639 | 351.78 | 4.13 |
| 258 | 350445771 | 4766550723668101376 | 4766550723668101248 | 2.0749 | 343.2 | 2.9 | 2.069 | 343.33 | 3.03 |
| 268 | 219253008 | 4779340346001388160 | 4779340277281911168 | 2.3025 | 51.2 | 0.3 | 2.29 | 51.36 | 0.2 |
| 343 | 66497310 | 2390762797648110336 | 2390762797648110208 | 2.8471 | 321.0 | 4.5 | 2.831 | 318.96 | 4.92 |
| 386 | 238059180 | 5497685201192526976 | 5497685205489860864 | 1.1739 | 274.4 | 3.5 | 1.151 | 268.65 | 3.54 |
| 387 | 92359850 | 5101513745613343232 | 5101513745612593536 | 2.2878 | 342.9 | 3.2 | 2.285 | 342.79 | 3.53 |
| 394 | 9858404 | 5167486711022397696 | 5167486711021821568 | 3.2284 | 220.2 | 3.8 | 3.221 | 219.92 | 3.59 |
| 427 | 70914192 | 5093541152441483008 | 5093541152441482880 | 2.6122 | 152.9 | 4.8 | 2.61 | 152.86 | 5.27 |
| 433 | 188989177 | 2983552564639203584 | 2983552603294316800 | 4.0098 | 324.5 | 2.9 | 3.984 | 324.61 | 3.13 |
| 494 | 19519368 | 3063507748837064064 | 3063507744545211264 | 2.2257 | 153.7 | 5.7 | 2.137 | 163.16 | 5.32 |
| 498 | 121338379 | 3071584413361857280 | 3071584417656749440 | 2.1845 | 251.5 | 3.5 | 2.251 | 252.84 | 3.52 |
| 594 | 146406806 | 5548005695180852352 | 5548005695180850816 | 2.8688 | 45.3 | 0.4 | 2.868 | 45.24 | 0.39 |
| 611 | 154459165 | 5693753348782558336 | 5693753348782877440 | 2.3787 | 93.3 | 5.5 | 2.378 | 93.73 | 5.67 |
| 635 | 286132427 | 3825847092208384640 | 3825847092207940736 | 1.7656 | 260.4 | 4.8 | 1.721 | 252.13 | 4.93 |
| 637 | 133334108 | 5537925196465380864 | 5537925200762994304 | 2.3926 | 332.9 | 5.1 | 2.393 | 332.43 | 5.02 |
| 644 | 63303499 | 2921445417696098944 | 2921445417696099072 | 1.758 | 132.4 | 0.4 | 1.753 | 132.52 | 0.39 |
| 645 | 157568289 | 5566329915436684672 | 5566329915435059712 | 4.0745 | 109.0 | 1.9 | 4.068 | 108.89 | 1.94 |
| 651 | 72090501 | 3004190986305089536 | 3004190986305090176 | 3.608 | 191.7 | 2.2 | 3.602 | 191.28 | 2.59 |
| 651 | 293689267 | 5568872394338114560 | 5568872398635858816 | 3.2615 | 219.3 | 1.5 | 3.344 | 219.25 | 1.58 |
| 658 | 48476907 | 5434682330226436480 | 5434682330226436736 | 3.88 | 67.2 | 0.7 | 3.877 | 67.14 | 0.75 |
| 659 | 48476908 | 5434682330226436480 | 5434682330226436736 | 3.8774 | 67.2 | 1.0 | 3.877 | 67.14 | 0.75 |
| 703 | 237928815 | 4680955147898508032 | 4680955152194431616 | 1.4153 | 221.8 | 4.7 | 1.415 | 221.71 | 5.0 |
| 759 | 152147232 | 5395959695358663296 | 5395959695358663040 | 2.694 | 234.6 | 3.6 | 2.687 | 234.81 | 3.75 |
| 772 | 286864983 | 3502914269362946688 | 3502914273658344448 | 2.3419 | 165.3 | 5.8 | 2.343 | 165.32 | 5.71 |
| 837 | 460205581 | 5251470948229949568 | 5251470948222139904 | 2.3128 | 281.7 | 4.6 | 2.312 | 281.52 | 4.7 |
| 847 | 231289421 | 4741068682700581376 | 4741068682699441280 | 1.2446 | 317.1 | 0.7 | 1.238 | 317.09 | 0.7 |
| 851 | 40083958 | 2426349694072115968 | 2426349694072132608 | 1.8583 | 253.8 | 5.2 | 1.849 | 253.86 | 5.52 |
| 905 | 261867566 | 5795534040654879744 | 5795534040654879488 | 2.2757 | 100.8 | 5.9 | 2.248 | 100.34 | 6.13 |
| 906 | 298372701 | 5984166216846046208 | 5984166221141887232 | 1.246 | 50.8 | 2.8 | 1.244 | 50.4 | 3.05 |
| 907 | 305424003 | 5910312231273215872 | 5910312231273215616 | 3.6665 | 52.0 | 1.1 | 3.648 | 52.0 | 1.11 |
Note. Column (1) is the TOI number, and column (2) is the TIC number. Columns (3) and (4) are the Gaia DR2 source ID for the primary and secondary stars. Columns (5)–(7) give the measured separation, position angle, and I-band contrast from the SOAR observations. Columns (8)–(10) give the separation and position angle for the system derived from the Gaia DR2 coordinates and the Gaia G-band contrast for each pair of stars.
Download table as: ASCIITypeset image
Table 5. Gaia DR2 Binaries to TESS Targets Not Detected by SOAR
| TOI | TIC | Gaia DR2 ID | Distance | Proper Motion | Sep. | Projected Sep. | Gaia Contrast | |||
|---|---|---|---|---|---|---|---|---|---|---|
| Primary | Secondary | Primary | Secondary | Primary | Secondary | |||||
| (1) | (2) | (3) | (4) | (5) | (6) | (7) | (8) | (9) | (10) | (11) |
| (pc) | (pc) | (mas yr−1) | (mas yr−1) | (arcsec) | (au) | (mag) | ||||
| 129 | 201248411 | 4923860051276772608 | 4923860051276772480 | 61.8 | 61.9 | 215.1 | 219.7 | 3.81 | 235.5 | 4.8 |
| 130 | 263003176 | 4617759514501503616 | 4617759518796452608 | 57.6 | 56.1 | 142.7 | 151.4 | 2.25 | 129.6 | 5.42 |
| 143 | 25375553 | 6813902839862151936 | 6813902839862983296 | 298.1 | 293.1 | 13.6 | 14.3 | 5.03 | 1499.4 | 5.02 |
| 174 | 425997655 | 4674216245427964416 | 4674216245427964672 | 39.0 | 39.2 | 111.6 | 111.5 | 9.57 | 373.2 | 6.45 |
| 183 | 183979262 | 4686544382117423488 | 4686544382117422720 | 213.0 | 215.4 | 79.4 | 80.4 | 3.21 | 683.7 | 2.63 |
| 199 | 309792357 | 4762582895440787712 | 4762582861080613248 | 102.3 | 101.8 | 74.2 | 73.4 | 9.99 | 1022.0 | 7.84 |
| 200 | 410214986 | 6387058411482257536 | 6387058411482257280 | 44.1 | 44.1 | 104.2 | 102.0 | 5.36 | 236.4 | 1.08 |
| 204 | 281781375 | 4903786336207800576 | 4903786336207800704 | 95.3 | 95.1 | 173.5 | 174.0 | 10.25 | 976.8 | 1.16 |
| 222 | 144440290 | 6531037981670835584 | 6531037981670835456 | 84.0 | 81.1 | 178.5 | 177.4 | 3.46 | 290.6 | 8.02 |
| 229 | 120610833 | 2308834780352875904 | 2308834784647991168 | 211.2 | 233.7 | 70.7 | 70.5 | 4.37 | 922.9 | 6.96 |
| 248 | 201793781 | 4743138925656526976 | 4743138925656526848 | 76.0 | 75.7 | 94.4 | 95.6 | 5.02 | 381.5 | 5.45 |
| 268 | 219253008 | 4779340346001388160 | 4779341750455118720 | 320.5 | 325.9 | 21.5 | 21.1 | 9.99 | 3201.8 | 8.13 |
| 277 | 439456714 | 2353440974955205504 | 2353440974955205632 | 64.7 | 64.7 | 273.5 | 274.6 | 17.25 | 1116.1 | 0.3 |
| 300 | 166697854 | 4743406244421179264 | 4743406244421179136 | 397.4 | 377.7 | 15.2 | 16.0 | 4.1 | 1629.3 | 4.66 |
| 354 | 100097716 | 4959658534969336320 | 4959658534969336576 | 366.8 | 404.5 | 28.6 | 28.5 | 4.84 | 1775.3 | 0.65 |
| 354 | 299780329 | 4632142191744789888 | 4632142196040368896 | 305.6 | 306.9 | 17.2 | 17.2 | 7.37 | 2252.3 | 3.25 |
| 368 | 77031413 | 2323985539482908416 | 2323985535188372480 | 233.0 | 233.6 | 88.4 | 87.9 | 6.12 | 1426.0 | 0.59 |
| 377 | 139285736 | 6529468772420035712 | 6529468772420035584 | 244.3 | 259.0 | 12.0 | 10.4 | 9.29 | 2269.5 | 3.14 |
| 381 | 207084429 | 4917040330405933824 | 4917040330405933952 | 75.5 | 82.3 | 152.9 | 156.8 | 4.94 | 373.0 | 7.62 |
| 390 | 250386181 | 2491782421314919040 | 2491782417019596160 | 167.3 | 171.3 | 38.4 | 38.2 | 6.28 | 1050.6 | 6.32 |
| 393 | 29960109 | 5157183324996790272 | 5157183324996789760 | 37.9 | 37.9 | 170.6 | 180.2 | 8.35 | 316.5 | 0.29 |
| 396 | 178155732 | 5064574720469473792 | 5064574724768583168 | 32.0 | 30.9 | 162.4 | 173.2 | 8.36 | 267.5 | 9.8 |
| 397 | 219379012 | 4785828357959075840 | 4785828357959076480 | 167.0 | 168.4 | 31.3 | 29.8 | 4.32 | 721.4 | 4.84 |
| 412 | 7624182 | 4844367147295252864 | 4844365669826503808 | 460.7 | 446.6 | 11.5 | 11.3 | 7.88 | 3630.3 | 6.0 |
| 414 | 325680697 | 5171630735987857152 | 5171630735987104512 | 115.1 | 114.8 | 48.3 | 48.6 | 4.5 | 517.9 | 5.25 |
| 426 | 189013224 | 2983316311375470976 | 2983316311375257472 | 113.6 | 112.6 | 26.2 | 27.8 | 8.88 | 1008.8 | 0.77 |
| 440 | 143350972 | 2971536418673198976 | 2971536418671276544 | 49.3 | 49.1 | 113.0 | 112.1 | 6.45 | 318.0 | 4.87 |
| 441 | 316916655 | 2987545475475708416 | 2987545548491503360 | 184.0 | 177.7 | 10.9 | 12.3 | 15.64 | 2877.8 | 6.0 |
| 470 | 37770169 | 2912264564319611136 | 2912264564316598272 | 130.5 | 130.1 | 85.1 | 84.4 | 13.6 | 1774.8 | 6.25 |
| 470 | 37770169 | 2912264564319611136 | 2912264564316598144 | 130.5 | 130.5 | 85.1 | 86.4 | 13.74 | 1793.1 | 5.89 |
| 498 | 121338379 | 3071584413361857280 | 3071584417656748928 | 188.4 | 176.6 | 23.4 | 21.7 | 5.2 | 979.7 | 7.25 |
| 505 | 268644785 | 5489780919480009472 | 5489780919477609600 | 324.7 | 315.8 | 5.1 | 5.4 | 6.09 | 1977.4 | 6.65 |
| 510 | 238086647 | 5508330367833229824 | 5508330367831469952 | 93.1 | 94.0 | 124.6 | 122.8 | 5.48 | 510.2 | 3.93 |
| 575 | 386435344 | 5709861464697757824 | 5709861468994311424 | 182.0 | 156.4 | 48.6 | 48.5 | 5.36 | 975.5 | 8.28 |
| 580 | 81419525 | 5519619186857962112 | 5519619191155977344 | 346.5 | 475.4 | 11.6 | 9.1 | 14.09 | 4882.2 | 10.99 |
| 581 | 180987952 | 5525188767305211904 | 5525188728649771392 | 434.2 | 428.8 | 13.6 | 20.8 | 7.8 | 3386.8 | 8.56 |
| 592 | 196286587 | 5695996352497664512 | 5695996348197148032 | 358.4 | 385.6 | 8.6 | 33.0 | 11.28 | 4042.8 | 1.49 |
| 638 | 78154865 | 3822912388299321728 | 3822912392594624128 | 96.6 | 97.6 | 14.3 | 16.0 | 10.53 | 1017.2 | 4.32 |
| 648 | 78672342 | 2933433564771909888 | 2933433564771909760 | 637.3 | 814.6 | 11.0 | 11.6 | 2.95 | 1880.0 | 5.9 |
| 650 | 349373192 | 5293295919554813952 | 5293296130007438848 | 402.8 | 348.7 | 12.6 | 12.9 | 8.97 | 3613.1 | 8.93 |
| 670 | 147660201 | 5388433503908280320 | 5388433503908279168 | 191.5 | 183.6 | 57.9 | 56.4 | 13.79 | 2640.8 | 1.91 |
| 708 | 391821647 | 4657888149862830720 | 4657888150116259584 | 214.8 | 347.2 | 24.0 | 21.4 | 13.74 | 2951.4 | 9.36 |
| 756 | 73649615 | 6129327525817451648 | 6129327319659021056 | 86.2 | 86.2 | 218.3 | 217.6 | 11.09 | 956.0 | 1.35 |
| 764 | 181159386 | 5385762893242980992 | 5385762824520652160 | 789.3 | 754.5 | 6.5 | 6.4 | 5.96 | 4704.2 | 6.21 |
| 811 | 100757807 | 2890519660294945920 | 2890519660294833792 | 284.0 | 283.8 | 29.7 | 29.1 | 4.33 | 1229.7 | 1.83 |
| 815 | 102840239 | 5415648821879172096 | 5415648821874435584 | 59.7 | 59.3 | 11.4 | 12.3 | 6.04 | 360.6 | 2.48 |
| 824 | 193641523 | 5880886001621564928 | 5880886001577333888 | 63.9 | 69.2 | 160.9 | 3.3 | 6.7 | 428.1 | 9.16 |
| 829 | 276128561 | 6199033466340798464 | 6199033466344807040 | 142.5 | 138.8 | 71.0 | 71.4 | 5.46 | 778.0 | 5.28 |
| 832 | 350332997 | 4768613025228556416 | 4768613029524059648 | 586.7 | 617.2 | 13.7 | 12.9 | 3.7 | 2170.8 | 4.76 |
| 858 | 198008005 | 4683737294568479104 | 4683737294569921664 | 255.8 | 250.5 | 15.1 | 15.5 | 10.95 | 2801.0 | 0.28 |
| 878 | 219380235 | 4771537902252716416 | 4771537897957355392 | 334.5 | 324.6 | 35.5 | 34.9 | 5.64 | 1886.6 | 6.49 |
| 915 | 259389219 | 4781316164099781760 | 4781316168396825728 | 506.4 | 443.0 | 10.1 | 29.7 | 6.05 | 3063.7 | 4.18 |
| 938 | 332660150 | 3189432444744896512 | 3189432444743495936 | 215.0 | 195.0 | 12.6 | 12.9 | 7.95 | 1709.2 | 7.6 |
Note. Column (1) is the TOI number, and column (2) is the TIC number. Columns (3) and (4) are the TIC number for the primary and secondary stars. Columns (5) and (6) give the distance from the star from Bailer-Jones et al. (2018). Columns (7) and (8) give the proper motion in Gaia DR2 for the primary and secondary stars. Column (9) gives the on-sky separation based on the Gaia DR2 coordinates, and Column (10) gives the projected physical separation using the average of the distances to the two stars. Column (11) gives the Gaia G-band contrast of the stellar pair.
Table 6. Full SOAR Speckle Observation List and Binary Properties
| TOI | TIC | Comp. | R.A., Decl. (J2000) | Filter | Obs. | θ | ρ ∗ σθ | ρ | σρ | Δm | Flag | Min. ρ | Limiting Δm | ||
|---|---|---|---|---|---|---|---|---|---|---|---|---|---|---|---|
| (deg) | (deg) | Year | (deg) | (mas) | (arcsec) | (mas) | (mag) | (arcsec) | 015 |
1'' | |||||
| (1) | (2) | (3) | (4) | (5) | (6) | (7) | (8) | (9) | (10) | (11) | (12) | (13) | (14) | (15) | (16) |
| 101 | 231663901 | ⋯ | 318.73713 | −55.87186 | I | 2018.731 | 0.067 | 2.20 | 2.97 | ||||||
| 109 | 29344935 | ⋯ | 313.21605 | −25.68764 | I | 2019.375 | : | 0.098 | 0.00 | 0.00 | |||||
| 112 | 388104525 | ⋯ | 55.93345 | −65.19383 | I | 2019.534 | 0.064 | 2.33 | 3.88 | ||||||
| 114 | 25155310 | ⋯ | 63.37440 | −69.22675 | I | 2019.534 | 0.064 | 2.51 | 4.37 | ||||||
| 118 | 266980320 | ⋯ | 349.56216 | −56.90408 | I | 2018.731 | 0.048 | 3.00 | 4.05 | ||||||
| 119 | 278683844 | ⋯ | 99.23777 | −58.01477 | I | 2018.732 | 0.048 | 2.36 | 3.72 | ||||||
| 120 | 394137592 | ⋯ | 4.44608 | −66.35889 | I | 2018.731 | 0.043 | 2.57 | 3.82 | ||||||
| 121 | 207081058 | ⋯ | 331.86741 | −41.81472 | I | 2018.731 | 0.052 | 2.33 | 3.67 | ||||||
| 122 | 231702397 | ⋯ | 332.94818 | −58.94689 | I | 2018.975 | 0.041 | 1.68 | 3.86 | ||||||
| 123 | 290131778 | AB | 319.69946 | −26.61611 | I | 2018.731 | 294.6 | 0.2 | 1.289 | 0.2 | 1.8 | ∗ | 0.041 | 2.42 | 4.38 |
Note. Columns (1) and (2) give the TOI and TIC numbers, respectively. Column (3) designates the components of the resolved binaries according to the WDS style (mostly "AB"). This matters for resolved triple systems, indicating their hierarchy. The equatorial coordinates for J2000, in degrees, are given in columns (4) and (5). Column (6) gives the filter (mostly I, with a few targets also observed in V), and Column (7) gives the date of the observation (in Julian years). For resolved binaries, Columns (8) and (10) give the position angle θ and separation ρ, while Columns (9) and (11) contain estimates of the measurement errors in tangential (ρ σθ) and radial (σρ) directions in mas. The measured magnitude difference Δm is given in Column (12). Some targets have multiple measurements. For unresolved sources (single stars), Columns (8)–(12) are empty. Flags for the photometry are provided in column (13). These flags are ":" for a companion with a low S/N, "q" for an identified quadrant from the SAA images, and "*" if the photometry is corrected for anisoplanatism using the average image. The estimated resolution limit is listed in column (14) for all stars; columns (15) and (16) give the estimated maximum detectable Δm at separations of 015 and 1''.
Only a portion of this table is shown here to demonstrate its form and content. A machine-readable version of the full table is available.
Download table as: DataTypeset image
Footnotes
- 5
- 6
For example, the acquisition time of Keck-AO averages 9 minutes (Wizinowich et al. 2006), so over 100 nights would be needed to observe the Kepler planet candidates.
- 7
https://tev.mit.edu/toi/ (account required for access).
- 8
From the CTOI list, available at https://exofop.ipac.caltech.edu/tess/view_ctoi.php.
- 9
A third scenario, in which the secondary star is unbound to the primary star, is unconstrained without color information. In future papers, we will use multiband speckle imaging with SOAR to extend our analysis to the unbound scenario.
- 10
- 11
Not every TESS planet candidate host had stellar radius estimates in the TIC or Gaia DR2. These targets are only included in calculating the mean correction factors in the case in which the primary star is assumed to be the host. In this case, only the flux contribution of the primary star is needed to determine the correction factor, as seen in Equation (1).
- 12
Described in detail in the Gaia DPAC public documentation, available at https://gea.esac.esa.int/archive/documentation/GDR2/Gaia_archive/chap_datamodel/sec_dm_main_tables/ssec_dm_ruwe.html.
- 13
TOI 271 was observed with NaCo on the VLT (posted by Elisabeth Matthews), TOI 502 was observed with NIRI on Gemini-North (Elisabeth Matthews) and NIRC2 on Keck II (David Ciardi), TOI 674 was observed by NIRI on Gemini-North (Ian Crossfield/Elisabeth Matthews), and TOI 254 and 311 were observed by PHARO on the Palomar 5 m (David Ciardi).
- 14
Uncertainties in the expected number of observed binaries are derived from the resulting distribution of simulated surveys, as described in Section 4.2.