


Abstract
We measure the ability of the Leonardo Selex Advanced Photodiode HgCdTe Infrared Array (SAPHIRA) avalanche photodiode array to perform photon counting. The current SAPHIRA arrays achieve >90% single-photon efficiency (independent of quantum efficiency expected to be also >90%) and a time resolution of 125 μs with a dark current of 21e− s−1 pix−1. Our characterization of several iterations of the SAPHIRA detector over the past 3 years of its development have also revealed a broader pulse height distribution than was originally expected.
Export citation and abstract BibTeX RIS
1. Introduction
Originally developed for fringe-tracking at the European Southern Observatory, the Selex Advanced Photodiode HgCdTe Infrared Array (SAPHIRA) is now the premier detector for near-infrared (NIR) wavefront sensing in adaptive optics (Finger et al. 2010; Atkinson et al. 2014, 2016; Hall et al. 2016). The ongoing collaboration between the SAPHIRA's manufacturer Leonardo (previously Selex) and the University of Hawai'i Institute for Astronomy (UH-IfA) has evaluated the detector's ability to count NIR photons. Prior photon counting in the NIR was limited to frame and dark count rates of >10 MHz and >100,000e− s−1 pix−1, respectively, prohibitively high for astronomy (Beck et al. 2014). The new capabilities of the SAPHIRA will also enable observations in the largely unexplored area of NIR high time resolution astronomy.
We have previously shown the SAPHIRA to have a baseline dark current of <=0.001e− s−1 pix−1 up to a bias voltage Vbias of 8.5 V (Atkinson et al. 2016; Finger et al. 2016; Atkinson et al. 2017; Hall 2017, private communication). This work presents the current results from the ongoing photon-counting development effort and thoroughly details the SAPHIRA's ability to discriminate individual photon events with sub-millisecond time resolution. We present that this ability has a more complex limitation; individual photons can be detected, but small numbers of photons simultaneously arriving are difficult to detect.
Section 2 lays out our laboratory setup for investigations of SAPHIRA photon counting. Section 3 describes characterization of the detector's electron avalanche and presents measurements of the pulse height distribution and other properties relevant to photon counting. Section 4 discusses the nature of the ballistic avalanche and the relationship between the avalanche pulse height distribution and the excess noise. In Section 5, we discuss the pulse height distribution further and the aims of future SAPHIRA development. Section 6 provides a summary of our results.
2. Setup
We characterized the SAPHIRA arrays in the KSPEC cryostat (see Figure 1). KSPEC was originally an IJHK-band spectrometer but has since been converted into a detector testbed for the NGST/JWST detector program (Hodapp et al. 1994, 1996).
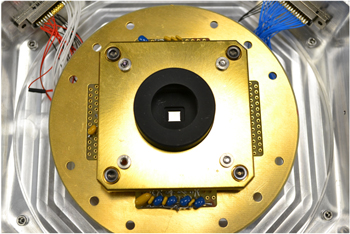
Figure 1. The socket holding SAPHIRA uses springs to maintain constant pressure with the electrical contacts and the clamp assembly in place over the array.
Download figure:
Standard image High-resolution imageThe detector itself is operated by a third-generation Astronomical Research Cameras (ARC) detector controller. The controller uses mostly standard ARC boards (ARC-22, ARC-32) including four 8-channel IR readout boards (ARC-46; Leach & Low 2000). The bias/utility board has been replaced with an extremely low noise version designed at Australian National University and reproduced at UH-IfA. These are installed in a twelve-slot ARC chassis with a single backplane. Fiber optic lines connect to the ARC-66 PCIe board in a Linux desktop computer. The instrument is operated via a set of command-line scripts making use of the v3.5 ARC API.
The controller uses Motorola DSP56000 assembly language code to operate, which we derived from code for HAWAII-2RG operation provided by both Bob Leach of ARC and Marco Bonati of CTIO. To propagate changes in the code, it is written to the controller immediately before every detector power-up.
Detector temperature is measured on a cold finger in thermal contact with the detector itself and is accurate to ∼3 K of the detector's actual temperature. A temperature diode mounted on the leadless chip carrier was used to calibrate the temperature measurements from the cold finger. The operating temperature is 2.3 K higher than the measured detector-stage temperature at 40 K and 2.9 K higher at 100 K. The diode sensor glows brightly in the NIR when powered and was typically not operated when measurements were being taken.
Calibration LEDs at 1.05, 1.30, 1.75, and 3.1 μm are mounted to an integrating sphere in the cryostat, to provide uniform illumination across the detector when active. Typically, the H-band LED λ = 1.75 μm was used for photon-counting measurements. When in use, the LED power level is manually set by the operator.
Our ability to count photons is most directly characterized by observing the detector's high-gain response to individual events. At the minimum readout subarray size, 32 × 1 pixels read out through 32 output channels, and the frame rate is almost identical to the pixel rate of 250 kHz save for some minor overhead. Absorbed light from the integrating sphere LED (λ = 1.75 μm) at the lowest setting is estimated at ∼6000 photons s−1 pix−1, estimated from operating the detector at the lowest gain.
A SAPHIRA detector is a 320 × 256 array, with larger arrays planned for the future. The metal organic vapor phase epitaxy device structure employed in the APD is shown in Figure 2. Photon absorption occurs in the P-type absorber, creating electron-hole pairs. The electrons thermally diffuse to the junction. The high field is dropped across a weakly doped N-type region, the multiplication layer. Here, electrons are accelerated and generate other electron-hole pairs by impact ionization. The low mobility hole acquires energy from the applied electric field very inefficiently and readily loses it to optical phonons (Rogalski 2005). The process is essentially a pure electron cascade with an exponential gain versus bias voltage profile. The potential energy with depth is shown in Figure 3, which illustrates that the history-dependent nature of the avalanche gain underpins the low noise figure of HgCdTe.
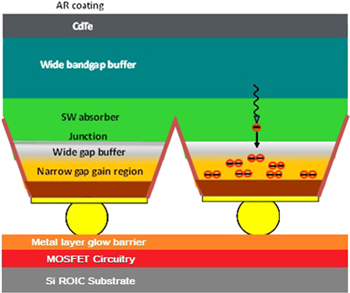
Figure 2. The broad physical structure of SAPHIRA pixels, manufactured by MOVPE. The depth of individual layers is varied experimentally to improve performance. (Original figure courtesy Leonardo.)
Download figure:
Standard image High-resolution image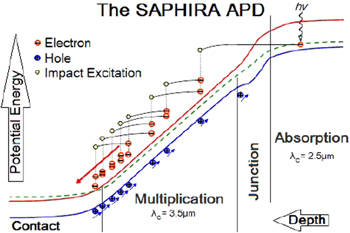
Figure 3. The single-carrier electron avalanche is a major noise advantage HgCdTe has over other NIR detection materials. The bias voltage Vbias is applied across the multiplication and junction regions. Though photons are depicted here being captured in the absorption region, it is possible for 2.5 μm ≤ λ ≤ 3.5 μm photons to penetrate to and be absorbed in the multiplication layer. (Original figure courtesy Leonardo.)
Download figure:
Standard image High-resolution imageMultiple iterations of the SAPHIRA detector were investigated. This work presents marks 13, 14, and 19. Marks 13 and 14 are the same APD design but were subjected to different high-temperature anneals. Mark 19 was an experimental design aimed at reducing tunnel current at low temperature.
3. Measurements
The photon-counting performance of the detector is analyzed by pulse height distributions. These are direct measures of the difference between successive reads of the same pixel, i.e., frames 2 − 1, 3 − 2, 4 − 3, and so on. The data set for an individual pixel is then a list of all subtracted read pairs, and the full data set cube is those individual sets for all pixels. Data was generally taken with 100,000 frames consecutively, with a reset separating ramps applied every 10000 or 2000 frames depending on the incident light level, so there are either 10 or 50 ramps and resets in a data set. To reach the maximum readout rate, the window observed is the minimum 32 × 1, a single read per frame.
With the LED operated at minimum voltage, a number of frames show no incident photons from the pixels, while some see a single photon (see Figure 4). A pulse height distribution is shown in Figures 5 and 6 as overlapping histograms with and without incident light. The on–off curve shows the avalanches that individual photons produce as a pulse height distribution. The shape is verified in other work (G. Finger 2017, private communication). Similar behavior is observed in multiple SAPHIRA detectors (see Figure 7). (Note that the presented work makes use of different incident light levels for different detectors.)
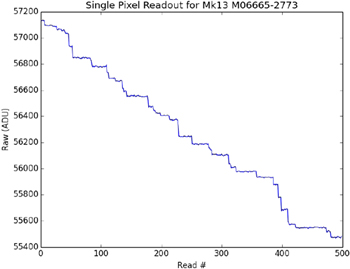
Figure 4. Single pixel read out 500 times with an LED on. The incident photons can be seen as large jumps in the ADU value, but note that the size of the jump varies.
Download figure:
Standard image High-resolution image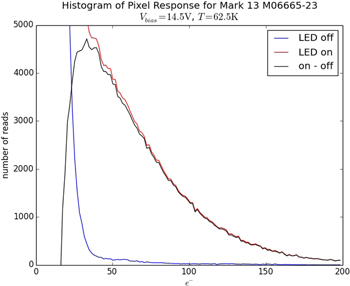
Figure 5. A linear pulse height distribution for a mark 13 SAPHIRA array at Vbias = 14.5 V, mean avalanche gain = 66, with LED source off (blue), on (red), and on–off (black). No averaging or filtering has been applied. The subtraction gives us the pulse height distribution, which has a peak around 0.5 and a sharp lower bound at 0.25.
Download figure:
Standard image High-resolution image
Figure 6. The full logarithmic distribution of the off and on curves from Figure 5. The non-normally distributed section of the LED off distribution at >50e− is symmetric about zero and is a result of rare electrical glitches in the readout.
Download figure:
Standard image High-resolution image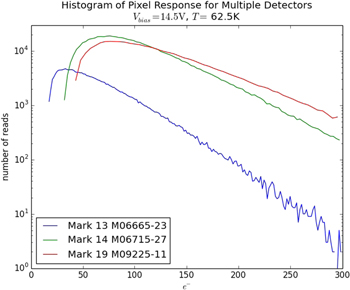
Figure 7. Logarithmic distribution of LED on–off curves from multiple SAPHIRA detectors. The different amplitudes (heights) of Mark 13 vs. Marks 14/19 is due to a different incident light level during the observation. The upward tails of the distributions are universal. Note also the increased curve at the low end of the Mark 14/19 devices, this is due to increased read noise in those detectors.
Download figure:
Standard image High-resolution imageDark events initiate throughout the detector's depth and thus do not experience a full avalanche, but we measure them as full avalanche equivalents. With this technique, the mean dark current at Vbias = 14.5 V and T = 62.5 K is measured as ∼20e− s−1 pix−1 and is thus insubstantial to photon-counting measurements, which take approximately 0.4 s and thus have only eight equivalent dark current events. Measurements of the gain are normalized to the Vbias = 2.5 V, which is assumed to be a gain of 1.
Given a measured avalanche gain of 66 at Vbias = 14.5 V for a mark 13 SAPHIRA, the mean single-photon avalanche is 66e−. We can determine from the incident light that approximately 2.5% of these events are coincident multi-photon avalanches. Given that the ratio between 1 and 2e− results is a factor of <10, the single-photon avalanche must still be the dominant part of the distribution at 2e−. Therefore, we attribute the shape of the curve entirely to single-photon avalanches. Other SAPHIRA devices show similar avalanche gain versus Vbias curves (see Figure 8).

Figure 8. Measured avalanche gain of multiple SAPHIRA devices plotted against bias voltage Vbias. At very low bias voltages, there is a capacitance effect that makes avalanche gain appear lower.
Download figure:
Standard image High-resolution imageWe also measure a delay in response time, the detector's lag in detecting a change in the incident light. Our observations use a calibration LED in the integrating sphere driven by a square wave to generate light with a sharp cut-on and -off. We see this effect appearing at Tdet ∼ 80 K and growing with decreasing temperature (see Figure 9). Measured delays are specific to individual devices, with some devices having a time constant τ > 100 ms though 50–100 ms is typical at 60 K. For photon-counting applications, this delay easily dominates the detector's bandwidth when operated at low temperatures. Only a fixed number of electrons in a given time interval experience the delay. This does not ameliorate the effect for astronomical applications given typically low light levels but does point toward an explanation, as avalanche electrons are absorbed and released on non-trivial timescales by traps in the HgCdTe.

Figure 9. Response time presented as a function of temperature. Incident light is an LED source driven by a square wave at 1 Hz with 50% duty cycle.
Download figure:
Standard image High-resolution image4. Analysis
We present the pulse height distribution having a distinct shape, with a sharp lower bound and a broad tail upwards. Although this allows for the easy detection of individual photons, multiple photons being absorbed into the same read cannot be differentiated due to the tail, as would be capable with a fully deterministic gain.
Photon counting with any detector requires setting a detection threshold, a value above which a result is assumed to represent a photon event (or events). We statistically evaluate the efficacy of threshold via two categories of error: false negatives, avalanches lower than the threshold and undetected; and false positives (FPs), null results higher than the threshold value and erroneously interpreted as photons. We characterize the probability of false negatives as a threshold efficiency (TE) analogous to a device's quantum efficiency (QE). The FP rate is given in units of e− read−1 pix−1 as it occurs as a function of read noise. The FP rate becomes e− s−1 pix−1 when the readout rate is applied, which is functionally equivalent to dark current.
Results for the Mark 13 M06665-23 are presented in Figures 10 and 11. A selected sample of thresholds with their TE and FP rate are also shown in Table 1. With threshold such that TE > 90%, the FP rate is 21e− s−1 pix−1, very near to the 20e− s−1 pix−1 median dark current of a SAPHIRA device at Vbias = 14.5 V. The other two detectors discussed in this paper show worse read noise behavior. At TE > 90% the Mark 19 has an FP rate of 178e− s−1 pix−1, and the Mark 14 shows 492e− s−1 pix−1.

Figure 10. Evaluation of threshold values for threshold efficiency and FP rate. Selected values are shown in Table 1.
Download figure:
Standard image High-resolution image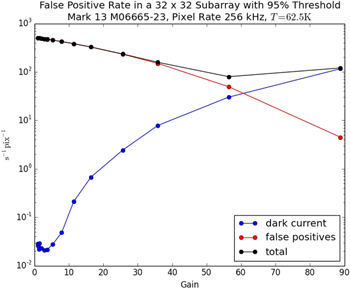
Figure 11. False positive rate and dark current as a function of detector gain for a 32 × 32 subarray of M06665-23. This is an extrapolation from 32 × 32 data, for which both measurements should be identical when adjusted for time.
Download figure:
Standard image High-resolution image
Table 1. Values of Threshold Efficiency and False Positive Rate
| Threshold | TE | False Positive Rate | |
|---|---|---|---|
| e− read−1 pix−1 | e− s−1 pix−1 | ||
| 58 | 51% | 6.3 ∗ 10−4 | 5.21 |
| 36 | 82% | 1.3 ∗ 10−3 | 10.9 |
| 28 | 91% | 2.5 ∗ 10−3 | 20.9 |
| 26 | 95% | 4.2 ∗ 10−3 | 34.8 |
| 20 | 99% | 0.011 | 93.8 |
Note. Selected thresholds and matching values for the threshold efficiency (TE) and false positive (FP) rates. The e− read−1 pix−1 and e− s−1 pix−1 rates reported depend on the maximum read rate of 250 kHz applied to a 32 × 32 window as well as averaging.
Download table as: ASCIITypeset image
5. Discussion
Given the measured pulse height distribution of the SAPHIRA APD and similarity with other investigations of devices, we expect the shape to represent a fundamental property of HgCdTe APDs (Finger et al. 2014, 2016). The linear operation of SAPHIRA APDs is an advantage over developing Geiger-mode NIR APD arrays, which require millisecond resets after each detection. Our high TEs (combined with the high QEs of HgCdTe detectors), the linear operation, and the low dark current also compare favorably with Geiger-mode APDs. The SAPHIRA is also not subject to crosstalk, a limiting issue on Geigers.
Additionally, an ongoing redesign to the bandgap structure of the device seeks to push back the onset of dark (tunneling) current to higher bias voltages. This would greatly reduce the dark current penalty for operating an array at the high bias voltages necessary for photon counting and would improve SAPHIRA performance in applications of NIR high time resolution astronomy.
6. Conclusions
We measure the overall performance of the SAPHIRA APD and demonstrate its capability to count photons and limitations thereof. The pulse height distribution shows that individual IR photons can be easily detected, but two or more photons being absorbed in a single read are indistinguishable. Although the ballistic avalanche does greatly reduce amplification noise relative to other APDs, its stochastic nature makes the avalanche pulse height distribution still relatively broad. We have shown that despite this, the SAPHIRA is capable of counting >90% of photon events with a time resolution of 125 μs, incurring a mild increase in dark current relative to the dominant tunneling current. Also shown is that the tail of the pulse height distribution prevents the accurate detection of multiple photons in a single read. Maintaining a high time resolution helps identify incident photons for relatively rapid arrivals.
Though still in development, we find present iterations of SAPHIRA to be capable of efficient NIR photon counting, a unique capability among astronomical detector arrays. Future versions of the SAPHIRA are expected to resolve issues such as temperature-dependent time delay. The SAPHIRA is then the first NIR APD capable of both high efficiency and low dark current in an array format.
D.A. is supported by a NASA Space Technology Research Fellowship, grant NNX13AL75H. The authors thank the NSTRF staff and the Office of the Chief Technologist for their assistance. D.A. would also like to thank the medical staff at Queen's Medical Center in Honolulu, HI and Hilo Medical Center in Hilo, HI for their effective intervention. Development of the SAPHIRA detectors and their characterization at UH is sponsored by NSF ATI award AST 1106391 and NASA ROSES APRA award #NNX 13AC13G.