


ABSTRACT
We used ultra-deep J and Ks images secured with the near-infrared (NIR) GSAOI camera assisted by the multi-conjugate adaptive optics system GeMS at the GEMINI South Telescope in Chile, to obtain a (Ks, J − Ks) color–magnitude diagram (CMD) for the bulge globular cluster NGC 6624. We obtained the deepest and most accurate NIR CMD from the ground for this cluster, by reaching Ks ∼ 21.5, approximately 8 mag below the horizontal branch level. The entire extension of the Main Sequence (MS) is nicely sampled and at Ks ∼ 20 we detected the so-called MS "knee" in a purely NIR CMD. By taking advantage of the exquisite quality of the data, we estimated the absolute age of NGC 6624 (tage = 12.0 ± 0.5 Gyr), which turns out to be in good agreement with previous studies in the literature. We also analyzed the luminosity and mass functions of MS stars down to M ∼ 0.45 M⊙, finding evidence of a significant increase of low-mass stars at increasing distances from the cluster center. This is a clear signature of mass segregation, confirming that NGC 6624 is in an advanced stage of dynamical evolution.
1. INTRODUCTION
Globular Clusters (GCs) are complex systems hosting gravitationally bound stars, distributed with an approximately spherical geometry. In the central regions of these stellar systems, where stars are forced to live in an extremely dense environment, the probability of stellar encounters is highly enhanced. Such collisions lead to the formation of peculiar objects like Cataclysmic Variables, Low-Mass X-ray Binaries (LMXBs), Millisecond Pulsars and Blue Straggler Stars (e.g., Bailyn 1992; Paresce et al. 1992; Ferraro et al. 2001, 2009a, 2012; Ransom et al. 2005; Pooley & Hut 2006), and they influence the timescales on which mass segregation, core collapse and other dynamical processes occur (Meylan & Heggie 1997).

The large stellar concentration in the central regions of high density GCs prohibited resolving individual stars for many years, until the launch of the Hubble Space Telescope (HST), which allowed exquisite resolution over a relatively large (a few square arcminutes) field of view (FOV), mainly in the optical bands. The investigation of the stellar content of GCs in the bulge of the Galaxy has the additional complication of the presence of thick clouds of dust along the line of sight, which almost totally absorb the optical light, and/or the presence of a heavy field star contamination. The exploration of such clusters requires near-infrared (NIR) observations (e.g., Origlia et al. 1997, 2011; Ferraro et al. 2000, 2009b; Valenti et al. 2004a, 2007), a wavelength range where the foreground extinction significantly drops. The observations of such stellar systems in the NIR have tremendously improved with the advent of instrumentation assisted by the new adaptive optics (AO) facilities. These systems, in fact, mainly work in the NIR, where the spatial and temporal coherence of the corrugated wavefront is larger (Davies & Kasper 2012), and they are able to compensate the blurriness of the astronomical images due to the Earth's atmosphere, by using one or more deformable mirrors and, as reference, natural and/or laser guide stars.
The Gemini South Telescope, on Cerro Pachón in Chile, currently is the only facility equipped with a Multi-conjugate Adaptive Optics System (named GeMS), which uses three natural guide stars, a constellation of five laser guide stars and two deformable mirrors conjugated at the ground and at an altitude of 9 km (see Neichel et al. 2014; Rigaut et al. 2014). This allows GeMS to (almost) reach the diffraction limit of the telescope. By exploiting the unprecedented capabilities of this system, which work in combination with the NIR high-resolution camera Gemini South Adaptive Optics Imager (GSAOI), we started an observing campaign of a set of GCs located in the Galactic bulge. After the encouraging results obtained for Liller 1 (Saracino et al. 2015), a heavily obscured cluster located very close to the Galactic plane and center, here we present the results for NGC 6624. This GC is located just at the edge of the inner bulge, at a distance of 7.9 Kpc from Earth (Harris 1996, 2010 edition), and it is characterized by only a moderate foreground extinction for a bulge GC, E(B − V) = 0.28 (Harris 1996, 2010 edition; Valenti et al. 2004a). These features also make NGC 6624 an ideal target to investigate the sky performance of the GeMS+GSAOI system.
NGC 6624 is a well studied cluster, but mainly in the optical bands (see Sarajedini et al. 2007; Dalessandro et al. 2014). In the NIR, it was observed with the following instruments:
- (i)IRCAM, mounted at the 2.5 m Du Pont telescope. These observations provided the first (Ks, J − Ks) CMD of the cluster sampling the brightest portion of the red giant branch (RGB; see Kuchinski & Frogel 1995) down to the Horizontal Branch (HB) level.
- (ii)IRAC-2 mounted at the ESO 2.2 m telescope MPI. The NIR CMD derived from these observations was deeper than the previous one, reaching the cluster sub-giant branch (Ks ∼ 17), and thus allowing us to study the RGB features (RGB bump and tip; see Valenti et al. 2004a, 2004b, 2007; Ferraro et al. 2006b).
- (iii)
NGC 6624 is quite compact and it has been cataloged as a dynamically evolved cluster, which has already experienced core collapse (Trager et al. 1995). It has been found to harbor six millisecond pulsars (Freire et al. 2011; Tam et al. 2011; Lynch et al. 2012) and at least an ultra-compact LMXB (Dib et al. 2005), thus confirming that its dense environment efficiently boosts the formation of exotic objects.
In this paper, we present ultra-deep NIR observations of NGC 6624 obtained by using the powerful combination of the GeMS+GSAOI devices mounted at the Gemini South Telescope. The paper is organized as follows: in Section 2 we discuss the observations and the data analysis. In Section 3 we present the CMD of the cluster. Section 4 is focused on the determination of the age of the cluster and in Section 5 we discuss the Luminosity (LF) and Mass Functions (MF) of the cluster MS. In Section 6 we present our conclusions.
2. OBSERVATIONS AND DATA ANALYSIS
The data set analyzed in this work consists of a sample of high-quality J and Ks images obtained with GeMS and the NIR camera GSAOI. GSAOI has a resolution of about 0 02 pixels−1 and consists of four 2048 × 2048 pixels chips, divided by gaps of about 2'', providing a total FOV of almost 85'' × 85''. NGC 6624 was observed on 2013 May 24 as part of the proposal GS-2013-Q-23 (PI: D. Geisler). A total of 28 images (14 in the J and 14 in the Ks bands), with an exposure time texp = 30 s each, was acquired during the run. To fully cover the gaps between the GSAOI chips, we adopted a dither pattern with a maximum offset of about 5'' between two consecutive images. During the observing night, the DIMM monitor on Cerro Pachón recorded excellent seeing conditions, with a FWHM of ∼07. An average stellar FWHM smaller than 4 pixels (008, close to the diffraction limit of the telescope) has been measured in all J and Ks images. Unfortunately, one J-band exposure was characterized by a significantly worse FWHM, so that it was excluded from the subsequent analysis. In Figure 1 we present a two-color mosaic of Ks and J images of NGC 6624. Figure 2 shows the comparison between a central region (10'' × 10'') of NGC 6624 obtained with the HST in the F435W filter (left panel) and with the GeMS/GSAOI system in the Ks band (right panel): the spatial resolution of the AO corrected image is indeed impressive.

Figure 1. Two-color image of NGC 6624 obtained by combining GEMINI observations in the NIR J and Ks bands. North is up, east is on the left. The field of view is 93'' × 93''.
Download figure:
Standard image High-resolution image
Figure 2. A zoom-in of a central region (10'' × 10'') of the cluster as seen by ACS/HRC (F435W filter) on board HST (Dalessandro et al. 2014, left) and by GSAOI+GeMS in the Ks band (this work, right). The spatial resolution of GEMINI in the NIR turns out to be comparable to that of the HST in the optical.
Download figure:
Standard image High-resolution imageThe data analysis was performed following the same procedure described in Saracino et al. (2015). Briefly, each individual chip6 was analyzed independently, by using standard pre-reduction procedure, within the IRAF 7 environment, in order to correct for flat-field and bias and subtract the background. For this purpose, a Master Sky was obtained by combining five sky images per filter of a relatively empty field. In order to get accurate photometry, even in the innermost region of the cluster, we performed point-spread function (PSF) fitting by using DAOPHOT (Stetson 1987) of all the detected stellar sources. For each chip, we selected ∼100 bright, isolated and unsaturated stars (using FIND and PHOTO), which were used to derive the best-fit PSF model. Based on an χ2 test, the best-fit PSF analytic models were found to be a Moffat function (with β = 1.5; Moffat 1969) for the Ks images and a Penny function (Penny 1976) for the J ones. We also noted that the photometry significantly improves by adopting PSF models, varying within the FOV. In particular, we adopted a linear dependence on the position within the frame in chip 1, and a cubic one for chips 2, 3, and 4. The selected models were then applied, using the ALLSTAR and ALLFRAME tasks (Stetson 1994), to all the sources having peak counts larger than 3σ above the local background level, thus determining the instrumental magnitudes for each star candidate in each chip. In the catalog, we included only stars present in at least two images for each filter. This criterion removed most of the cosmic rays and other spurious detections and allowed us to fill the gaps between the different chips of GSAOI. For each star, we homogenized the magnitudes estimated in different images, and their weighted mean and standard deviation have been finally adopted as the star mean magnitude and its related photometric error (see Ferraro et al. 1991, 1992). The instrumental positions have been reported onto the absolute coordinate system by adopting the star catalog by Dalessandro et al. (2014) as an astrometric reference and by using the cross-correlation software CataXcorr (Montegriffo et al. 1995). The instrumental magnitudes of the final catalog have been finally calibrated by using a sample of stars in common with the VVV catalog. The latter has been realized by using the DAOPHOT based VVV-SkZ pipeline (Mauro et al. 2013), which reported into the 2MASS photometric and astrometric system (see details in Moni Bidin et al. 2011; Chené et al. 2012; Mauro et al. 2013). We adopted an iterative 2σ-clipping procedure to estimate the calibration equations, which transformed the instrumental GeMS Ks and J magnitudes into the VVV photometric system. In order to avoid bias, only the brightest stars (with and ) were used (see Figure 3), yielding a total of about 300 calibration stars in each filter. The rms of the calibration is ∼0.02 mag, both in J and in Ks.


Figure 3. Photometric calibration plots for the GEMINI catalog of NGC 6624 in the Ks and J bands. Only bright stars (black points) have been used to determine the calibration zero points. The median values, estimated by using a 2σ-rejection, are shown in the figure.
Download figure:
Standard image High-resolution image3. NIR COLOR–MAGNITUDE DIAGRAMS OF NGC 6624
In order to obtain a clear definition of the evolutionary sequences in the CMD, we selected only very well measured stars by imposing a selection in the sharpness parameter. In particular, we divided our sample into 0.5 mag wide bins and for each bin we derived the median value of the sharpness by applying an iterative 2σ-rejection (an example is shown in Figure 4). All the stars satisfying this selection criterion and lying within 6σ from the median are shown in the (Ks, J − Ks) and (J, J − Ks) CMDs plotted in Figure 5. These are the deepest and highest-quality CMDs in the NIR ever obtained from the ground for this cluster, but quite comparable with those obtained for NGC 6121 with HAWK-I@VLT (Very Large Telescope; Libralato et al. 2014) and for M15 with PISCES@LBT (Large Binocular Telescope; Monelli et al. 2015).

Figure 4. Plot of the sharpness as a function of the Ks magnitude. The black points are the stars lying within 6σ from the red line, which represents the 2σ-clipped median value in sharpness. This selection criterion is applied to all the detected stars in order to remove spurious objects and stars with large photometric errors.
Download figure:
Standard image High-resolution image
Figure 5. () and (J, J − Ks) CMDs of NGC 6624 obtained from the GEMINI observations discussed in the paper. All the main evolutionary sequences of the cluster are well visible, from the RGB, HB, MS-TO down to the MS-K. These NIR diagrams turn out to be comparable to the HST optical ones, both in depth and in photometric accuracy. The photometric errors for each bin of Ks and J magnitudes are shown on the right side of the panels.

Download figure:
Standard image High-resolution imageThe NIR GEMINI CMDs presented in this study are fully comparable, both in depth and resolution, to the optical ones obtained by using different instruments on board the HST, such as the WFPC2 (Heasley et al. 2000; Dalessandro et al. 2014) and the ACS/HRC (Siegel et al. 2011; Dalessandro et al. 2014). In Figure 5 the red HB at Ks ∼ 13.3 and a well defined RGB bump at about are clearly distinguishable. Unfortunately, the stars lying along the brightest portion of the RGB () are saturated in all the available images. The MS-TO region is well defined at Ks ∼ 17.5 and the MS nicely extends for more than four magnitudes down to Ks ∼ 21.5. At odds with Siegel et al. (2011), we find no evidence of a broad sequence located below the cluster MS at bluer colors, which has been interpreted as a background feature, due to a tidal stream of the Sagittarius dwarf galaxy, located behind the cluster along its line of sight. The reason for such a discrepancy is likely ascribable to the relatively small FOV of GSAOI compared to that of the ACS. At Ks ∼ 20, we clearly identify the so-called MS "knee" (MS-K), a particular feature commonly defined as the reddest MS point in NIR CMDs. This feature is due to the absorption of molecular hydrogen induced by collisions (Bono et al. 2010), and flags the portion of the MS populated by very low-mass stars (with ). Until now, the MS-K has been observed only by using HST optical+NIR images (Milone et al. 2012b, 2014) and a proper combination of HST and MCAO data (MAD@VLT—Moretti et al. 2009; PISCES@LBT—Monelli et al. 2015 and GeMS—Massari et al. 2016; Turri et al. 2015). The detection shown in Figure 5 is the first determination of the MS-K feature in a purely NIR CMD obtained from the ground. The detailed study of this feature and its use as a possible age indicator (Bono et al. 2010; Di Cecco et al. 2015; Massari et al. 2016) will be discussed in a forthcoming paper (S. Saracino et al. 2016, in preparation).


4. ABSOLUTE AGE DETERMINATION
In this Section, we take advantage of the exquisite quality of the CMDs shown in Figure 5 to estimate the age of NGC 6624 by using the luminosity of the MS-TO as an age indicator.
4.1. Isochrone Fitting Method
In order to derive the age of the cluster via the isochrone fitting method, three main cluster parameters are needed, namely the metallicity, the distance and the reddening.
Metallicity—The most recent metallicity estimate of NGC 6624 is [Fe/H] = −0.42 ± 0.07. This value has been derived indirectly from the new metallicity scale of Carretta et al. (2009, 2010), based on optical high-resolution spectra of about 20 GCs. Other estimates in the literature provide slightly lower metallicities: [Fe/H] = −0.63 (Carretta & Gratton 1997; hereafter CG97; Heasley et al. 2000). Recent high-resolution NIR spectroscopy by Valenti et al. (2011) provides [Fe/H] = −0.69 ± 0.02 and [α/Fe] ∼ +0.39.
Reddening—E(B − V) color excess estimates in the cluster direction range from 0.25–0.33 (Armandroff 1989; Heasley et al. 2000) with a fair agreement on E(B − V) = 0.28 (Harris 1996, 2010 edition; Valenti et al. 2004a).
Distance modulus—Different estimates of the distance modulus of NGC 6624 have been obtained: (m − M)0 = 14.49 (Harris 1996, 2010 edition), (m − M)0 = 14.40 (Heasley et al. 2000), and (m − M)0 = 14.63 (Valenti et al. 2004a).
Both the reddening and the distance modulus were mainly derived in a differential way, by comparing the CMD of NGC 6624 with those of other clusters having the same metallicity and known values of E(B − V) and (m − M)0.
In order to compare theoretical models with the NIR photometry of the cluster, we selected three different sets of α-enhanced isochrones:
- 1.
- 2.Dartmouth Stellar Evolutionary Database (DSED; Dotter et al. 2007) isochrones with [α/Fe] = +0.4 and Y = 0.2583.
- 3.Victoria-Regina (VR; VandenBerg et al. 2014) isochrones with [α/Fe] = +0.4 and Y = 0.2583.
For each model, we adopted [Fe/H] = −0.60, a distance modulus of (m − M)0 = 14.49 (d = 7.9 Kpc) and a color excess E(B − V) = 0.28.8 These parameters well reproduce the main evolutionary features in the high-quality optical HST CMD by Dalessandro et al. (2014). However, the impact of adopting different values for these parameters will be discussed at the end of this section.
BaSTI isochrones—Figure 6 shows a set of seven isochrones with appropriate different ages ranging from 10.5–13.5 Gyr, stepped by 0.5 Gyr, overplotted to the data of NGC 6624 in the () and (J, J − Ks) CMDs, by assuming the quoted distance and reddening. The BaSTI NIR colors and magnitudes are on the Johnson–Cousins–Glass photometric system, and so they were converted first on the Bessell & Brett (1988) system and then, by using the transformations of Carpenter (2001), into the 2MASS photometric system (Cutri et al. 2003).


Figure 6. () and (J, J − Ks) CMDs of NGC 6624 CMDs with overplotted a set of BaSTI (Pietrinferni et al. 2004) isochrones with ages ranging from 10.5–13.5 Gyr, in steps of 0.5 Gyr (see labels).

Download figure:
Standard image High-resolution imageAs can be seen, the agreement between the BaSTI models and our data is quite good in the extended MS and in the TO region, while it is not completely satisfactory in terms of color at the level of the MS-K (at )9 and in the lower part of the RGB. A mismatch between models and data appears also at the brightest portion of the RGB, at but in this case it is likely due to nonlinearity and saturation problems that mainly affect the Ks band photometry. In spite of this, both the luminosity of the RGB bump and the ZAHB level are well reproduced (see Figure 6).


Focusing on the TO region, in order to identify the isochrone that best reproduces the observations, we performed an χ2 analysis. The χ2 parameter has been computed by selecting a subsample of stars in the MS-TO region, in the magnitude range , where the isochrone shape is particularly sensitive to age variations. It has been defined as: . We computed, iteratively, the minimum distance both in magnitude (OK) and in color (OcolJK) between each star in our sample and the corresponding values EK and EcolJK read along the isochrone. The result is shown in the right panel of Figure 7. As can be seen, a well defined minimum is visible, indicating a best-fit isochrone with an absolute age of .

![${\chi }^{2}=\sum [{({O}_{K}-{E}_{K})}^{2}+{({O}_{\mathrm{col}{JK}}-{E}_{\mathrm{col}{JK}})}^{2}]$](https://content.cld.iop.org/journals/0004-637X/832/1/48/revision1/apjaa3ec5ieqn14.gif)


Figure 7. Left panel: zoomed MS-TO region of the (Ks, J − Ks) CMD, with the selected set of BaSTI isochrones (with different ages) overplotted. Right panel: χ2 parameter as a function of isochrone ages considered in the left panel. A well defined minimum identifies the best-fit isochrone (with tage = 12.0 Gyr).
Download figure:
Standard image High-resolution imageDSED isochrones—Following the same approach adopted for the BaSTI isochrones, Figure 8 shows the comparison between the observed cluster photometry and the DSED isochrones (Dotter et al. 2007). A color offset (corresponding to δKs = −0.003) was needed to reconcile these evolutionary models to the data, in agreement with what was found by Cohen et al. (2015). DSED isochrones do a good job of reproducing the observed CMD morphology of NGC 6624, from the SGB level down to the MS-K. The RGB instead shows the same discrepancies already seen for the BaSTI isochrones, with the only difference being that in this case, even the magnitude of the RGB bump is not well reproduced. This is likely due to the fact that different models treat overshooting from convective cores in different ways. An χ2 test has also been performed for DSED models and the minimum value has been obtained for an absolute age of tage = 12.0 ± 0.5 Gyr. This result is shown in Figure 9, together with a zoom into the MS-TO/SGB regions of NGC 6624.


Download figure:
Standard image High-resolution image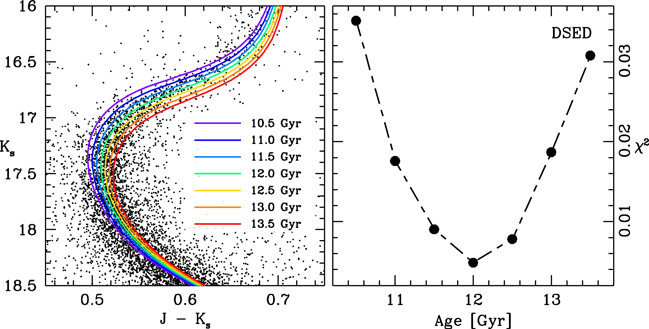
Figure 9. Same as in Figure 7, but for DSED isochrones.
Download figure:
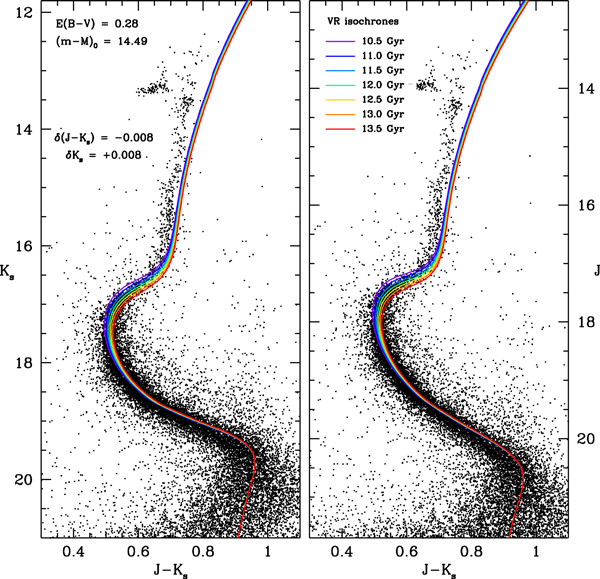
Standard image High-resolution imageVR isochrones—Finally, the () and (J, J − Ks) CMDs of NGC 6624 have been compared to the new VR isochrones (VandenBerg et al. 2014) (see Figure 10). According to the results of VandenBerg et al. (2013) and Cohen et al. (2015), we needed to apply a color shift of −0.008 in order to have a good match between the models and data. The MS-TO and the SGB level are well reproduced, as well as the shape of the MS-K. At the base of the RGB instead, VR models are systematically too red compared with the observed photometry. By performing an χ2 test on the VR isochrones (Figure 11), we obtained a slightly older absolute age of . However, it is in agreement, within the uncertainties of the method, with the ages derived from the BaSTI and DSED models.


Download figure:
Standard image High-resolution image
Figure 11. Same as in Figure 7, but for VR isochrones.
Download figure:
Standard image High-resolution imageFigures 6, 8 and 10 show that there is a mismatch between all models and observation starting from the RGB base. As discussed in detail by Salaris et al. (2007), Brasseur et al. (2010) and Cohen et al. (2015), this is a well known and long-standing problem. It may be related to some issues depending on the Teff-color transformations in the IR, and possibly caused by uncertainties in the model atmospheres, like the treatment of absorption lines as a function of gravity and to the abundance of some specific elements.
The impact of the adopted chemical composition on the overall quality of the fit has been tested. In particular, we compared isochrones with [Fe/H] = −0.42 and [α/Fe] = +0.2 adopted by VandenBerg et al. (2013) for their age derivation of NGC 6624 and [Fe/H] = −0.60 and [α/Fe] = +0.4, which we have used for our age derivation. For a fixed age, the two isochrones ([Fe/H] = −0.60 and [α/Fe] = +0.4 and [Fe/H] = −0.42 and [α/Fe] = +0.2) exactly match, showing only a slight difference at the MS-K level. We have also considered the effect of the abundance variations. Cohen et al. (2015) showed that a modest helium enhancement of Y = 0.04 is not able to solve the observed disagreement between the models and data at the SGB/RGB level. We verified that the overall match still remains unsatisfactory, even adopting isochrones with a helium content as large as Y = 0.35. In particular, while the increase of helium results in a better fit at the RGB base, it does not allow us to properly reproduce the MS. Finally, we tried to test the impact of adopting different values of reddening and distance on the determination of the age of the cluster. With this aim, we performed the same χ2 analysis as before by assuming the values of Heasley et al. (2000) and Valenti et al. (2004a). This analysis gives age values of 11.0 ± 0.5 Gyr and 10.5 ± 0.5 Gyr, respectively. However, a visual check reveals that isochrones having such extreme values of E(B − V) and/or (m − M)0 do not reproduce properly the main evolutionary sequences (MS-TO/SGB level, HB level and RGB bump) of the cluster. Hereafter, for our analysis, we will adopt the absolute age of 12 Gyr derived from BaSTI, which is the model that better reproduces the overall shape of the CMD of NGC 6624.
4.2. Comparison with Previous Results
The age of NGC 6624 has been widely debated in recent years. As shown in Figure 12, the value determined in this work is in good agreement, within the errors, with most of the previous estimates quoted in the literature.

Figure 12. Age estimates of NGC 6624 determined in previous studies, compared to that obtained in this work (red point). The acronyms shown in the figure are so-defined: MW061 & MW062 (Meissner & Weiss 2006), SW02 (Salaris & Weiss 2002), Van13 (VandenBerg et al. 2013), Roe14 (Roediger et al. 2014), Dot10 (Dotter et al. 2010) and Hea00 (Heasley et al. 2000).
Download figure:
Standard image High-resolution imageThe largest discrepancy is found with respect to the value determined by Heasley et al. (2000). By comparing the CMD of NGC 6624 with those of NGC 6637 and 47 Tucanae (having a similar metallicity), the authors established that these clusters have the same age (14 ± 1 Gyr) by using the Yale isochrones. A relatively old age (13.00 ± 0.75 Gyr) was also found by Dotter et al. (2010), analyzing DSED models with the following chemical composition: [Fe/H] = −0.50 (by assuming the scale by Zinn & West 1984, hereafter ZW84) and [α/Fe] = 0. An absolute age of 10.6 ± 1.4 Gyr, in quite good agreement with the one estimated in this work (within their large error bars), was instead obtained by Salaris & Weiss (2002), both for a metallicity of [Fe/H] = −0.50 (ZW84 scale) and for [Fe/H] = −0.70 (CG97 scale). Meissner & Weiss (2006) derived for NGC 6624 two different ages: 12 Gyr from the model best reproducing the MS-TO region (as in our case), and a lower limit of 10.5 Gyr, from the isochrone providing an acceptable fit to all the investigated age indicators. From the isochrone fitting and the ZAHB loci, VandenBerg et al. (2013) derived the ages of 55 GCs for which the optical HST/ACS photometry was publicly available. In the case of NGC 6624, the absolute age was established as 11.25 ± 0.5 Gyr, in good agreement with our value. Finally, the most recent study of the cluster was performed by Roediger et al. (2014), within a detailed review on the state of the art about age and metallicity determinations for a sample of 41 Galactic GCs. The authors quote an age of 12.5 ± 0.9 Gyr, which is again consistent with the value obtained in this work.
5. THE LUMINOSITY AND MASS FUNCTION OF NGC 6624
We have studied the LF and the MF of MS stars in NGC 6624 and their radial variations within the FOV of GSAOI. This kind of study has proved to be an efficient tool to study the effect of cluster internal dynamics on stars in a wide range of masses, including the faint-end of the MS where most of the cluster mass lies. In relaxed systems, the slopes of the MF and LF are expected to vary as a function of the distance from the cluster center, with indexes decreasing as distance increases, because of the different effect of mass segregation. Moreover, the radial variation in the stellar MF of star clusters allows us to derive crucial information about the dynamical history of the system (including the amount of mass loss suffered by the clusters, e.g., Vesperini & Heggie 1997; De Marchi et al. 2007) and the variation in the stellar initial mass function as recently shown by Webb & Vesperini (2016). In this context, NGC 6624 is quite an interesting case, because it has been classified as a post-core collapse cluster (Trager et al. 1995). Hence, it has already experienced some of the most energetic and advanced phenomena known to occur during the dynamical evolution of dense stellar systems (Meylan & Heggie 1997).
5.1. Artificial Star Experiment
In order to derive a meaningful MS-LF, it is important to take into account a number of effects (such as blends, photometric errors and stellar crowding) that can limit the photometric accuracy, especially when deriving complete samples of faint stars. In order to assess the impact of these effects, we performed a set of artificial star experiments following the prescriptions reported in Bellazzini et al. (2002) and Dalessandro et al. (2011, 2015). The main steps of this procedure are briefly summarized below. We initially defined a mean ridge-line (MRL) in the () plane by considering 0.5 mag wide bins in Ks and by selecting the corresponding median value in color after a 2σ-clipping rejection (see Table 1 and the red line in Figure 13, left panel). Then, we generated a catalog of simulated stars with a Ks-input magnitude (Ks,in) extracted from an LF modeled to reproduce the observed LF. To each star extracted from the LF, we finally assigned a Jin magnitude by means of an interpolation along the MRL of the cluster. In order to avoid artificially increasing the crowding conditions, only one artificial star was simulated in each run within a 20 × 20 pixels cell (more than five times the typical FWHM of stars on the images). In addition, we imposed on each simulated star a minimum distance of about 50 pixels from the edges of each chip. By imposing these criteria and adopting the coordinate transformations discussed in Section 2, artificial stars were added to the 13 J and 14 Ks images by using the DAOPHOT II/ADDSTAR software. This procedure was performed individually on each chip and the artificial stars thus obtained were analyzed by using the same PSF models and the same reduction process (including the same selection criteria) adopted for the real images, as fully described in Section 2. A total of ∼48,000 artificial stars per chip have been simulated. Figure 13 shows a comparison between the simulated (left panel) and the observed CMD (right panel). It is quite evident that the two CMDs are fully compatible over the entire magnitude range covered by the observations. In particular, the simulated MS (for ) shows the same spread in color as the observed one, thus confirming that the procedure is fully appropriate.


Figure 13. Simulated (left panel) and observed (right panel) (Ks, J − Ks) CMD of NGC 6624, for all the stars that survived the selection: −0.2 ≤ sharpness ≤ 0.2. As is clearly visible, the two CMDs turn out to be fully comparable, especially in the MS region (at Ks > 16). The red line in the left panel represents the MRL of NGC 6624 in the () CMD.

Download figure:
Standard image High-resolution imageTable 1. Mean Ridge-line of NGC 6624 in the ( CMD

| Ks | J − Ks |
|---|---|
| (mag) | (mag) |
| 12.413 | 0.742 |
| 12.913 | 0.737 |
| 13.413 | 0.727 |
| 13.913 | 0.723 |
| 14.413 | 0.714 |
| 14.913 | 0.706 |
| 15.413 | 0.696 |
| 15.913 | 0.680 |
| 16.413 | 0.644 |
| 16.913 | 0.547 |
| 17.413 | 0.519 |
| 17.913 | 0.528 |
| 18.413 | 0.588 |
| 18.913 | 0.709 |
| 19.413 | 0.897 |
| 19.913 | 0.947 |
| 20.413 | 0.937 |
| 20.913 | 0.877 |
| 21.413 | 0.817 |
Download table as: ASCIITypeset image
The artificial star catalog thus obtained was used to derive the completeness curves as the ratio () between the number of stars recovered after the photometric reduction (Nout) and the number of simulated stars (Nin) in each magnitude bin. The completeness curves as a function of the Ks magnitudes for three different radial bins (, and , where r is the distance from the cluster center10 ) are shown in Figure 14. This clearly testifies to a high (90%–100%) photometric completeness of the GEMINI catalog down to , depending on the distance from the center.


Figure 14. Photometric completeness (Γ) as a function of the Ks magnitude for the GEMINI catalog of NGC 6624 in three different radial bins (see labels).
Download figure:
Standard image High-resolution image5.2. Luminosity and Mass Functions
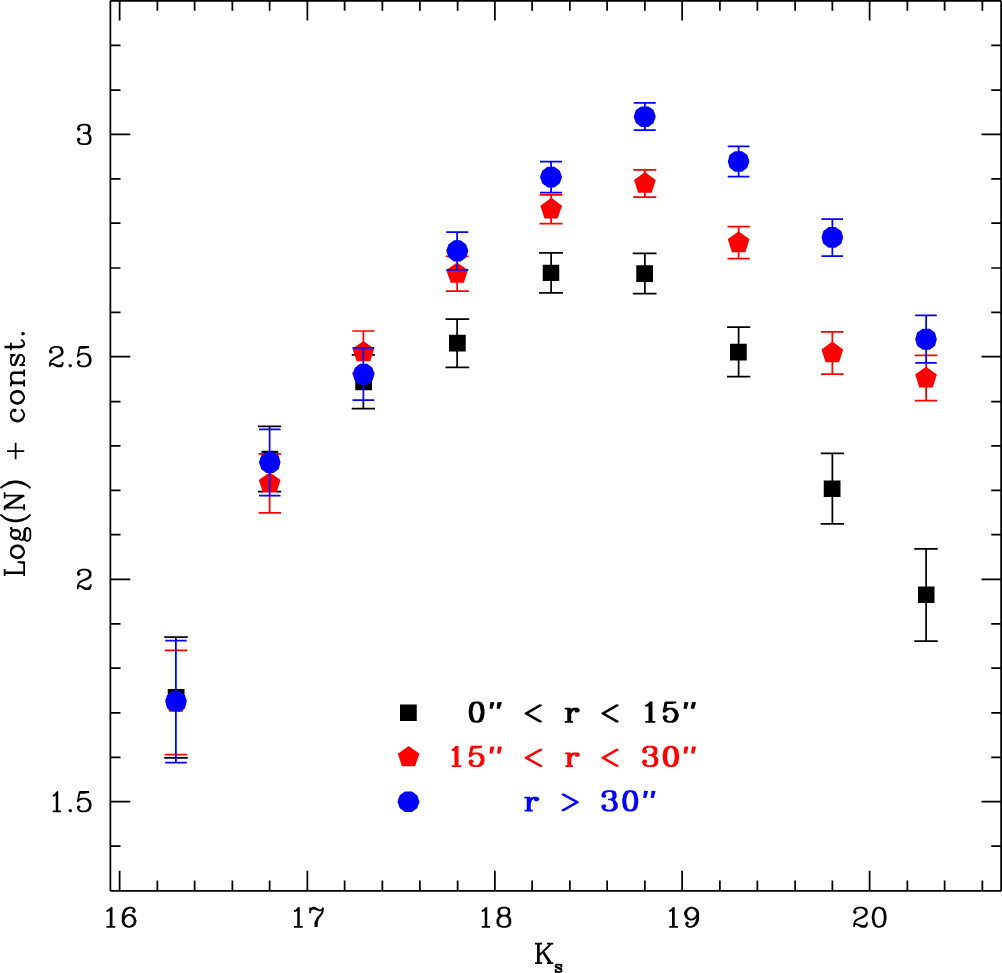
In order to derive the MS-LF of NGC 6624, we adopted the radial bins defined for the determination of the completeness curves (see Section 5.1). Starting from the () CMD, we selected a sample of bona fide MS stars defined as those stars located within 2.5σ from the MRL, where σ is the combined photometric uncertainty in the Ks and J bands. For each radial interval, we considered only the stars with Ks magnitude ranging between 16 and the value corresponding to a completeness factor Γ ∼ 0.5, namely Ks = 20.35 for , Ks = 20.45 for and Ks = 20.55 for . The observed LF obtained in each radial interval was thus corrected for incompleteness by adopting the appropriate value of Γ in each bin of magnitude. The completeness-corrected LF was then decontaminated from the effect of field stars by using the Besançon simulation of our Galaxy (Robin et al. 2003) for a region of about 2 5 squared centered on NGC 6624, rescaled on the GSAOI FOV. For each magnitude bin, the density of field stars has been estimated and then subtracted (see for example Bellazzini et al. 1999). In Figure 15 the completeness-corrected and background-subtracted LFs of NGC 6624 in different radial bins are shown. In order to compare the LFs obtained at different distances from the cluster center, the LFs have been normalized to the one obtained for the innermost region in the magnitude range . The comparison shows that the LFs are clearly different, with the LF in the outer regions of the cluster showing an overabundance of low-luminosity stars with respect to those in the innermost radial bin, consistent with the effect of mass segregation. This is in agreement with results by Goldsbury et al. (2013).


Figure 15. NGC 6624 completeness-corrected and field-decontaminated MS-LFs in the Ks band obtained from the GEMINI catalog in three different radial bins. The LF corresponding to the innermost radial bin is used as reference to normalize those at larger radii at the brightest bin.
Download figure:
Standard image High-resolution imageFollowing a similar approach, we have also derived the MF of NGC 6624. Masses have been estimated from the BaSTI isochrone that best fits the CMD, as discussed in Section 4.1. This provides a MS-TO mass of 0.88 M⊙. The MF covers a range in mass from 0.9 M⊙ down to lower limits corresponding to Γ ≈ 0.5: M = 0.49 M⊙ for , for and 0.45 M⊙ for . The MFs are shown in Figure 16, with the same color code as in Figure 15 to indicate different distances from the cluster center. We used the MF of the innermost radial bin as a reference and we normalized the more external ones by using the number counts in the mass range . In Figure 16, in agreement with what we obtained from the analysis of the LFs, the MFs show a clear variation of their slopes, flattening and moving outwards. Such a trend clearly demonstrates that this cluster has already experienced a significant degree of mass segregation. In general, all GCs are expected to show evidence of mass segregation, because of their short relaxation timescales (e.g., Paust et al. 2010). However, recent results have shown that there are some exceptions: see the case of ω-Centauri (Ferraro et al. 2006a), NGC 2419 (Dalessandro et al. 2008; Bellazzini et al. 2012), Terzan 8 and Arp 2 (Salinas et al. 2012), Palomar 14 (Beccari et al. 2011), and NGC 6101 (Dalessandro et al. 2015). These examples suggest that either some mechanisms able to suppress mass segregation may occur in some GCs or that theoretical relaxation times may suffer significant uncertainties. In this context, the study of the dynamical state of a cluster becomes quite interesting.


Figure 16. MFs derived by using a BaSTI isochrone with [Fe/H] = −0.60 and tage = 12.0 Gyr (see Section 4.1). Radial bins, symbols and colors are the same as in Figure 15.
Download figure:
Standard image High-resolution image6. SUMMARY AND CONCLUSIONS
This work is focused on NGC 6624, a metal-rich GC located in the Galactic bulge. By combining the exceptional capabilities of the adaptive optics system GeMS with the high-resolution camera GSAOI on the GEMINI South telescope, we obtained the deepest and most accurate NIR () and (J, J − Ks) CMDs ever obtained from the ground for NGC 6624. The quality of the photometry turns out to be fully competitive with the optical photometry from the HST. The derived CMDs span a range of more than 8 mag, allowing us to identify all the well known evolutionary sequences, from the HB level to the MS-TO point down to below the MS-K (detected at Ks ∼ 20), a feature observed so far only rarely in the optical band and identified for the first time here in a purely infrared CMD. We took advantage of our high-resolution photometry to get an accurate estimate of the absolute age of NGC 6624, which is still quite debated in the literature. By adopting the MS-TO fitting method, we determined an absolute age of about 12.0 ± 0.5 Gyr for the cluster.

Taking advantage of this high-quality sample, we studied the MS-LF and MF at different distances from the cluster center. The level of completeness of the MS sample has been evaluated from artificial star experiments and turns out to be larger than 50% down to Ks ∼ 20.3 at any distance from the cluster center. The completeness-corrected and field-decontaminated LFs and MFs show significant signatures of mass segregation. In fact, moving from the innermost region of the cluster to the outskirts, the number of low-mass stars gradually increases compared to high-mass stars. This result confirms that NGC 6624 is a dynamically old cluster, already relaxed.
The data obtained for NGC 6624 clearly show that, under favorable conditions (for example the seeing of the observing night or the NGSs magnitude), the GeMS/GSAOI system is able to provide images with similar spatial resolution and photometric quality as the HST in the optical bands.
We thank the anonymous referee for the careful reading of the paper, and for the useful comments/suggestions. This research is part of the project Cosmic-Lab (http://www.cosmic-lab.eu) funded by the European Research Council under contract ERC-2010-AdG-267675. S.S. acknowledges the "Marco Polo Project" of the Bologna University for grant support and the University of Concepción for the warm hospitality during her stay, when part of this work was carried out. D.G. and S.V. gratefully acknowledge support from the Chilean BASAL Centro de Excelencia en Astrofísica y Tecnologías Afines (CATA) grant PFB-06/2007. F.M. gratefully acknowledges the support provided by Fondecyt for project 3140177. L.O. acknowledges the PRIN-INAF 2014 CRA 1.05.01.94.11: "Probing the internal dynamics of globular clusters. The first comprehensive radial mapping of individual star kinematics with the new generation of multi-object spectrographs" (PI: L. Origlia). R.E.C. acknowledges funding from Gemini-CONICYT Project 32140007. C.M.B. acknowledges support from project Fondecyt Regular 1150060. S.S. and E.D. thank Maurizio Salaris for useful discussions and input about the stellar evolutionary models.
APPENDIX: TESTING STELLAR VARIABILITY WITH THE GeMS/GSAOI SYSTEM
We could also test the stability and accuracy of the GeMS + GSAOI system in performing stellar variability studies. To do this, we focused on the core of NGC 6624. In this region, Deutsch et al. (1999) discovered an exotic object (Star1), which has been classified as a quiescent cataclysmic variable or an LMXB. The optical counterpart to this object, named COM_Star1, has been identified by Dalessandro et al. (2014) to be a star showing a clear sinusoidal light modulation and an orbital period of Porb ≈ 98 minutes. We identified COM_Star1 in our GEMINI J and Ks images (see Figure 17) by using the coordinates reported by Dalessandro et al. (2014). It appears as a relatively bright star at Ks ∼ 17.76 and outside the MS on the red side (it is marked with a red circle in the top panel of Figure 19). Since the object is visible in all GEMINI images (13 in J and 14 in Ks), we could investigate its variability in the infrared bands. Its light curve (red dots in the bottom panel of Figure 19) shows a luminosity variation with an amplitude of ∼0.2 mag and is well folded with the same period (Porb = 98 minute) found by Dalessandro et al. (2014). For sake of comparison, the light curve of a genuine MS star (StarB) with comparable luminosity (blue circle in Figure 18) is shown in Figure 19, bottom panel. As expected, this star is a "normal" non-variable MS. In fact, its light curve does not show any evidence of flux modulation (σK = 0.017 mag).

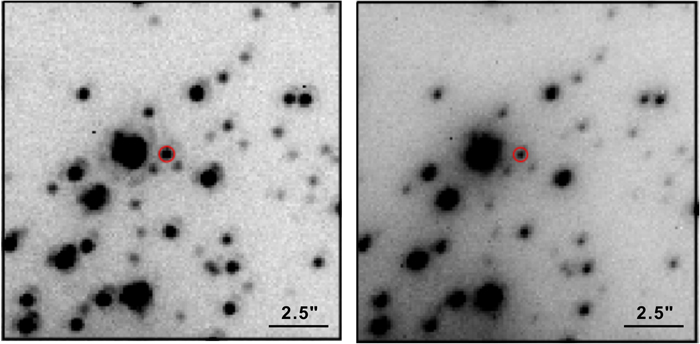
Figure 17. Left panel: Ks image of a region of (25 × 25) of NGC 6624, centered on the position of ComStar1, marked with a red circle, as observed by the GeMS/GSAOI system. Right panel: the same, but for the J band.
Download figure:
Standard image High-resolution image
Figure 18. Left panel: Ks image of a region of (25 × 25) of NGC 6624, centered on the position of StarB, marked with a blue circle, as observed by the GeMS/GSAOI system. This star has the same magnitude as ComStar1 and is adopted for comparison. Right panel: the same, but in the J band.
Download figure:
Standard image High-resolution image
Figure 19. Top panels: positions in the () and (J, J − Ks) CMDs of ComStar1 and StarB are highlighted with a red circle and a blue triangle, respectively. Bottom panels: the red circles represent the light curve of ComStar1 folded with the estimated orbital period Porb ≈ 98 minute (Dalessandro et al. 2014). The black line is a sinusoidal function of amplitude ≈0.2. For comparison, the blue triangles show the light curve of StarB, which has the same average Ks magnitude of ComStar1, but does not show any evidence of flux modulation (dashed black line).

Download figure:
Standard image High-resolution imageThe constancy of the StarB magnitude despite variation of seeing, airmass and PSF shape in the images, implies that the system is largely stable and it can also be used to successfully reveal very small flux variations (in the order of a few 0.01 mag). This test allows us to conclude that the GeMS/GSAOI system is indeed capable of very high performance and can also be successfully used for stellar variability studies.
Footnotes
- ∗
Based on observations obtained at the Gemini Observatory, which is operated by the Association of Universities for Research in Astronomy, Inc., under a cooperative agreement with the NSF on behalf of the Gemini partnership: the National Science Foundation (United States), the National Research Council (Canada), CONICYT (Chile), the Australian Research Council (Australia), Ministério da Ciência, Tecnologia e Inovação (Brazil) and Ministerio de Ciencia, Tecnología e Innovación Productiva (Argentina). Based on observations gathered with ESO-VISTA telescope (program ID 179.B-2002).
- 6
To distinguish between chips, we assigned an identification (ID) number from 1–4, starting from the bottom-right corner (chip 1) and proceeding clockwise.
- 7
IRAF is distributed by the National Optical Astronomy Observatory, which is operated by the Association of Universities for Research in Astronomy, Inc., under cooperative agreement with the National Science Foundation.
- 8
The color excess in the NIR filters E(J − Ks) has been derived by adopting the extinction coefficients AJ/E(B − V) = 0.899 and from Casagrande & VandenBerg (2014).
- 9
However, it should be noted that the BaSTI models do not sample the entire extension of the MS, since they are truncated at M = 0.5 M⊙.
- 10
We recomputed the cluster center Cgrav of NGC 6624 by applying the algorithm of Casertano & Hut (1985) to evaluate, through an iterative procedure, the "density center" of the stellar positions, i.e., their average position weighted by the local number density (for more details, see Lanzoni et al. 2007, 2010). Using various initial searching radii, ranging from 5–20'', and applying a cut in magnitude Ks = 18 to avoid incompleteness, we finally found , δJ2000 = −30°21'40
25 with an uncertainty of about 02.

