


Abstract
The only known phosphorus-containing organic compounds of extraterrestrial origin, alkylphosphonic acids, were discovered in the Murchison meteorite and have accelerated the hypothesis that reduced oxidation states of phosphorus were delivered to early Earth and served as a prebiotic source of phosphorus. While previous studies looking into the formation of these alkylphosphonic acids have focused on the iron–nickel phosphide mineral schreibersite and phosphorous acid as a source of phosphorus, this work utilizes phosphine (PH3), which has been discovered in the circumstellar envelope of IRC +10216, in the atmosphere of Jupiter and Saturn, and believed to be the phosphorus carrier in comet 67P/Churyumov–Gerasimenko. Phosphine ices prepared with interstellar molecules such as carbon dioxide, water, and methane were subjected to electron irradiation, which simulates the secondary electrons produced from galactic cosmic rays penetrating the ice, and probed using infrared spectroscopy to understand the possible formation of alkylphosphonic acids and their precursors on interstellar icy grains that could become incorporated into meteorites such as Murchison. We present the first study and results on the possible synthesis of alkylphosphonic acids produced from phosphine-mixed ices under interstellar conditions. All functional groups of alkylphosphonic acids were detected through infrared spectroscopically, suggesting that this class of molecules can be formed in interstellar ices.
Export citation and abstract BibTeX RIS
1. Introduction
Alkylphosphonic acids—organic compounds containing the RPO(OH)2 functionality with R being an alkyl group—have been identified in the Murchison meteorite (Figure 1; Cooper et al. 1992). An understanding of the extraterrestrial origin and abiotic formation pathways of these alkylphosphonic acids is of crucial importance to the astrobiology community on multiple levels. First, the Murchison meteorite can be seen as a benchmark for studies of carbonaceous chondrites. Carbonaceous chondrites are considered to be the most primitive remnants from the formation of the solar system and provide a singular record of the organic chemical evolution in the early solar system (Cronin & Chang 1993). Therefore, a better knowledge of the origin of astrobiologically relevant molecules in carbonaceous chondrites is vital because they resemble natural time capsules before life developed on Earth (Botton et al. 2002). Hence, carbonaceous chondrites are important in their role as a repository of primitive organic material and are dubbed primordial fossils helping to understand the chemical makeup of the early solar system. This is, in particular, true for key classes of astrobiologically important molecules detected in Murchison such as amino acids (Kvenvolden et al. 1970) and alkylphosphonic acids (Cooper et al. 1992). Laboratory experiments provide compelling evidence that amino acids can be formed abiotically via the Strecker synthesis and also by photolysis and charged particle processing of low temperature interstellar ice analogs (Bernstein et al. 2002; Munoz Caro et al. 2002; Holtom et al. 2005; Lafosse et al. 2006; Meinert et al. 2012). However, abiotic formation pathways leading to alkylphosphonic acids in extraterrestrial low temperature environments have been elusive to date. Detailed knowledge of the formation routes of alkylphosphonic acids in extraterrestrial ices can therefore help to shed light on the prebiotic phosphorus chemistry.

Figure 1. Five alkylphosphonic acids (top) with methyl (CH3), ethyl (C2H5), n-propyl (C3H7), isopropyl (CH(CH3)2), and n-butyl (C4H9) groups detected in the Murchison meteorite. Each gram of meteorite contained 9 nmole methylphosphonic acid and 6 nmole ethylphosphonic acid, although quantities of the remaining alkylphosphonic acids were not determined. Possible products of oxidized phosphine are shown below as phosphorus oxoacids: H3PO2 (left, phosphinic acid and hypophosphorous acid), H3PO3 (center, phosphonic acid and phosphorous acid), and H3PO4 (right, phosphoric acid).
Download figure:
Standard image High-resolution image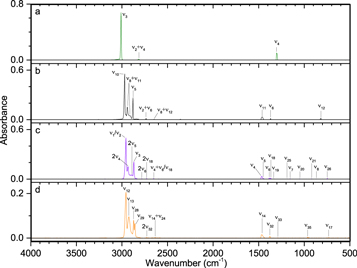
Figure 2. Infrared spectra (a) methane, (b) ethane, (c) propane, and (d) butane taken at 10 K. The data used to create this figure are available.
Download figure:
Standard image High-resolution imageSecond, although most phosphorus in meteorites is contained in phosphate minerals and schreibersite (Fuchs 1969), Murchison's homologous series of alkylphosphonic acids (Figure 1), which comprises only 0.1% of Murchison's phosphorus inventory (Pasek 2008), represents a prototype class of astrobiologically important molecules and the only class of organic molecules containing phosphorus of extraterrestrial origin. Sophisticated 13C/12C and D/H isotope analyses of Murchison's organic matter strongly propose an interstellar origin (Elsila et al. 2005; Spencer et al. 2008; Remusat et al. 2010), which also implies that the organic chemistry characteristic of carbonaceous chondrites was of significance for the origin of terrestrial life. The interstellar origin of complex organic molecules has been linked to the processing of low temperature (10 K) ice-coated, carbonaceous- and/or silicate-based nanoparticles (interstellar grains) by ionizing radiation such as energetic galactic cosmic rays and the internal ultraviolet photon field (Charnley et al. 2001) in cold molecular clouds—the nurseries of stars and planetary systems (Gibb et al. 2004)—as well as by processes such as hydrogen-atom addition (Chuang et al. 2015; Fedoseev et al. 2015). Laboratory studies provide compelling evidence that the interaction of ionizing radiation with interstellar analog ices can lead to a broad spectrum of astrobiologically important molecules including the sugar glycolaldehyde (Bennett & Kaiser 2007; Bennett et al. 2007), glycerol (Kaiser et al. 2015), amino acids (Bernstein et al. 2002; Munoz Caro et al. 2002; Holtom et al. 2005; Lafosse et al. 2006; Meinert et al. 2012), and even dipeptides (Kaiser et al. 2013). The densest parts of these clouds eventually undergo gravitational collapse to form primitive material, which supplies the basic ingredients for planets, moons, asteroids, and cometary bodies. Therefore, at least part of the organic material such as alkylphosphonic acids that initially formed in the molecular cloud could have been eventually incorporated into parent bodies of, for instance, the Murchison meteorite (Shimoyama & Ogasawara 2002; Halfen et al. 2014). Consequently, the elucidation of synthetic routes leading to a key class of astrobiologically important molecules—alkylphosphonic acids—will help to constrain fundamental processes that drive the hitherto poorly characterized interstellar phosphorus chemistry starting from the simplest closed-shell phosphorus-bearing molecule, phosphine (PH3; Agundez et al. 2014, 2008), and leading to the abiotic synthesis of alkylphosphonic acids in interstellar ices. Therefore, laboratory investigations are important to understand to what extent alkylphosphonic acids might have been synthesized exogenously at a frozen stage prior to their delivery to early Earth.
Third, phosphorus in its highest oxidation state P(V) as found in the phosphate moiety ( ) plays a central role in contemporary terrestrial biochemistry and presents one of the six elements that are biological building blocks along with carbon, hydrogen, oxygen, nitrogen, and sulfur. However, the low solubility of phosphates like calcium phosphate (Ca3(PO4)2) in water presents a significant stumbling block in the chemistry for the origin of life (Gulick 1955). The discovery of a reduced form of phosphorus(III) as present in highly water-soluble alkylphosphonic acids in Murchison presents a compelling alternative starting point in the prebiotic phosphorus chemistry. It further suggests the possibility that these molecules were delivered by meteorites or even comets to early Earth (Shimoyama & Ogasawara 2002). This could have provided a supply of organic phosphorus molecules for the earliest stages of chemical evolution. Although probably not components of the first genetic systems, alkylphosphonic acids might have been precursors to the first nucleic acids (Schwartz 1997). An understanding of the formation pathways of alkylphosphonic acids in extraterrestrial environments provides a rigorous scientific background about how a class of water-soluble phosphorus-bearing molecules might have been synthesized abiotically.
Finally, our study might also assist in the understanding of the molecular composition and in particular the inventory of alkylphosphonic acids on comet 67P/Churyumov–Gerasimenko, visited by the Rosetta spacecraft, which detected phosphorus that is believed to have originated from phosphine (Altwegg et al. 2016). Comets are also regarded as leftover debris from gas, ice, rocks, and dust that formed the solar system from interstellar matter about 4.6 × 10⁹ years ago. Also, a recent analysis of samples of material from comet Wild2 collected by the Stardust mission implied that comets might be considered as one possible class of parent bodies of meteorites (Walsh et al. 2011; Alexander et al. 2012). The Rosetta mission has provided the very first in situ exploration of a comet with its objective of characterizing the molecules in the coma of the comet and also on the comet's surface (Capaccioni et al. 2015; Hassig et al. 2015; Nilsson et al. 2015; Rubin et al. 2015; Schulz et al. 2015). The Philae Lander landed and performed a detailed analysis of the comet's surface with the data analysis still ongoing. The COSAC (COmetary SAmpling and Composition) unit, a combined gas chromatograph and time-of-flight mass spectrometer, performed an analysis of soil samples and determined the content of volatile components. Hence, a comparison of the inventory of phosphorus-bearing molecules determined by Rosetta and Philae with predictions from our studies will be crucial in constraining the basic processes that might have led to the formation of compounds such as alkylphosphonic acids on comets. Once formed abiotically, these alkylphosphonic acids might have been delivered to early Earth, thus providing the feedstock of highly water-soluble organophosphorus molecules for the earliest stages of biochemical evolution.
Here, we explore experimentally in an ultra-high vacuum surface scattering machine the mechanisms involved in the formation of key functional groups related to the formation of alkylphosphonic acids upon interaction of ionizing radiation with interstellar analog ices from the "bottom up" starting with simple precursor molecules. Our objectives are achieved by systematically replicating the conditions of phosphorus-bearing ice-coated interstellar grains as present in cold molecular clouds at 10 K in an ultra-high vacuum surface scattering machine through the exposure of interstellar analog ices at relevant temperatures (10 K) to ionizing radiation in the form of energetic electrons, which mimics secondary electrons generated in the track of galactic cosmic-ray particles penetrating interstellar ices. This is accomplished while probing reaction intermediates and products online and in situ via detection in the condensed phase by infrared spectroscopy. Infrared spectroscopy facilitates the identification of key functional groups of alkylphosphonic acids such as C–P, P=O, and O=P–OH and their precursors in the ices as well as in the residues that remain after the ices have sublimed at room temperature.
2. Experimental
2.1. Experimental Protocol
The experiments were conducted in a contamination-free ultra-high vacuum (UHV) chamber at pressures of typically 1 × 10⁻¹⁰ Torr achieved by magnetically suspended turbomolecular pumps (Osaka) backed by oil-free scroll pumps (Anest Iwata; Bennett et al. 2004, 2005; Zheng et al. 2006b; Jamieson & Kaiser 2007; Mottl et al. 2007; Jones et al. 2011). Briefly, a highly polished silver wafer is attached to an oxygen-free high conductivity (OFHC) copper target, which in turn is connected to a two-stage closed-cycle helium refrigerator and programmable temperature controller capable of regulating temperatures between 10 and 330 K. High purity phosphine (PH3), carbon dioxide (CO2), methane (CH4), ethane (C2H6), propane (C3H8), and butane (C4H10) premixed gas mixtures were prepared by mixing the individual components in a gas mixing chamber, while oxygen (O2) and the vapors of ultra-high purity water were introduced to the UHV chamber separately due to their reactivity with phosphine (2.2. ICE COMPOSITION). The preparation of the ices was controlled by a leak valve and introducing the gas mixture via a glass capillary array at 10 K at pressures of about 5 × 10⁻⁸ Torr in the main chamber. The ice thickness ranges from 910 ± 330 nm to 1500 ± 370 nm (Table 1) as determined by the integrated infrared absorption coefficients (Table 2), which we found to be constant among the deposited ice thicknesses. Pure alkane samples were deposited to a thickness of 500 ± 20 nm using laser interferometry (Heavens 1965; Zhou et al. 2014; Turner et al. 2015) with a helium–neon (HeNe) laser operating at 632.8 nm in order to calculate their absorption coefficients (Turner et al. 2015) and precisely locate their absorption bands, which often lie near or overlap bands from other alkanes (Figure 2, Table 3).
Table 1. Composition of the Eight Ice Mixtures Utilized in this Study, the Average Dose per Molecule at 100 nA, 1000 nA, and 5000 nA Irradiation Current, the Average Thickness of the Ice, and the Calculated Average Electron Penetration Depth
| Ice Number | Ice Composition | Ratio of Components | Dose | Thickness | Average Penetration |
|---|---|---|---|---|---|
| (eV molecule−1) | (nm) | depth (nm) | |||
| 2.8 ± 0.6 | |||||
| Ice I | PH3 | 28 ± 6 | 1470 ± 280 | 480 ± 70 | |
| 140 ± 30 | |||||
| 2.4 ± 0.5 | |||||
| Ice II | PH3–CH4 | 1.8 ± 0.4 : 1.0 ± 0.1 | 24 ± 5 | 1260 ± 300 | 640 ± 100 |
| 12 ± 25 | |||||
| 2.1 ± 0.3 | |||||
| Ice III | PH3–O2 | 2.5 ± 1.1 : 1.0 ± 0.6 | 21 ± 3 | 1050 ± 340 | 560 ± 80 |
| 100 ± 20 | |||||
| 3.1 ± 0.7 | |||||
| Ice IV | PH3–CO2 | 1.7 ± 0.1 : 1.0 ± 0.1 | 31 ± 7 | 1350 ± 200 | 460 ± 70 |
| 150 ± 30 | |||||
| 2.7 ± 0.6 | |||||
| Ice V | PH3–H2O | 10 ± 0.4 : 1.0 ± 0.5 | 27 ± 6 | 1030 ± 160 | 480 ± 70 |
| 140 ± 30 | |||||
| 2.4 ± 0.5 | |||||
| Ice VI | PH3–CO2–CH4 | 3.1 ± 0.2 : 1.0 ± 0.8 : 2.4 ± 0.7 | 24 ± 5 | 910 ± 330 | 570 ± 90 |
| 120 ± 30 | |||||
| Ice VII | PH3–CO2–CH4– | 3.8 ± 0.2 : 1.0 ± 0.5 : 2.0 ± 0.7 : | 3.4 ± 0.7 | ||
| C2H6–C3H8–C4H10 | 1.8 ± 0.2 : 1.7 ± 0.3 : 2.0 ± 0.2 | 34 ± 7 | 1500 ± 370 | 520 ± 80 | |
| 170 ± 40 | |||||
| Ice VIII | PH3–H2O–CH4– | 11 ± 5 : 1.0 ± 0.4 : 3.4 ± 0.5 : | 3.5 ± 0.7 | ||
| C2H6–C3H8–C4H10 | 5.5 ± 1.9 : 5.8 ± 0.7 : 5.9 ± 1.5 | 35 ± 7 | 1320 ± 400 | 510 ± 80 | |
| 180 ± 40 | |||||
Download table as: ASCIITypeset image
Table 2. Integrated Absorption Coefficients (A), Refractive Indices (n), and Ice Densities (ρ) Utilized to Determine the Thickness and Mole Ratio of Each Deposited Ice Sample
| Phosphine (PH3) | ||||
|---|---|---|---|---|
| Assignment | Position (cm−1) | A(1) (cm molec−1) | n(1) | ρ(2) (g cm−3) |
| v2 | 982 | 5.1 × 10⁻¹⁷ | 1.51 ± 0.02 | 0.90 |
| v4 | 1096 | 7.1 × 10⁻¹⁷ | ||
| Water (H2O) | ||||
| Assignment | Position (cm−1) | A(3) (cm molec−1) | n(4) | ρ(5) (g cm−3) |
| vL | 750 | 2.7 × 10⁻¹⁷ | 1.29 ± 0.01 | 0.94 |
| v2 | 1660 | 9.8 × 10⁻¹⁷ | ||
| v1 + v3 | 3300 | 3.8 × 10⁻¹⁶ | ||
| Carbon Dioxide (CO2) | ||||
| Assignment | Position (cm−1) | A(3) (cm molec−1) | n(3) | ρ(3) (g cm−3) |
| v2 | 660 | 1.4 × 10⁻¹⁷ | 1.27 ± 0.02 | 1.11 ± 0.03 |
| v4 (13CO2) | 2283 | 7.3 × 10⁻¹⁷ | ||
| 2v2 + v3 | 3600 | 6.0 × 10⁻¹⁹ | ||
| v1 + v3 | 3708 | 1.8 × 10⁻¹⁸ | ||
| Methane | ||||
| Assignment | Position (cm−1) | A(6) (cm molec−1) | n(3) | ρ(3) (g cm−3) |
| v4 | 1300 | 1.3 × 10⁻¹⁸ | 1.34 ± 0.04 | 0.45 ± 0.03 |
| v3 | 3008 | 6.6 × 10⁻¹⁸ | ||
| v1 + v4 | 4204 | 2.9 × 10⁻¹⁹ | ||
| v3 + v4 | 4303 | 4.2 × 10⁻¹⁹ | ||
| Ethane | ||||
| Assignment | Position (cm−1) | A(6) (cm molec−1) | n(7) | ρ(8) (g cm−3) |
| v12 | 819 | 2.2 × 10⁻¹⁹ | 1.34 | 0.72 ± 0.07 |
| v2 + v6 | 2736 | 1.4 × 10⁻¹⁹ | ||
| v5 + v9 | 4066 | 1.4 × 10⁻¹⁹ | ||
| v9 + v10 | 4163 | 1.7 × 10⁻¹⁹ | ||
| v5 + v8 | 4323 | 1.9 × 10⁻¹⁹ | ||
| v8 + v10 | 4401 | 1.8 × 10⁻¹⁹ | ||
| Propane | ||||
| Assignment | Position (cm−1) | A(6) (cm molec−1) | n(6) | ρ(9) (g cm−3) |
| v26 | 747 | 1.0 × 10⁻¹⁹ | 1.36 ± 0.05 | 0.76 |
| v6 | 1384 | 1.8 × 10⁻¹⁹ | ||
| 2v6 | 2781 | 8.5 × 10⁻²⁰ | ||
| v1 + v19 | 4287 | 1.2 × 10⁻¹⁹ | ||
| Butane | ||||
| Assignment | Position (cm−1) | A(6) (cm molec−1) | n(6) | ρ(9) (g cm−3) |
| v32 | 1376 | 4.2 × 10⁻¹⁹ | 1.38 ± 0.05 | 0.83 |
| v13 | 2923 | 3.3 × 10⁻¹⁸ | ||
Note. Molecular oxygen was not observed in the infrared, but a density of 1.542 g cm−1 was used for calculations (Roder 1978).
References. (1) Turner et al. (2015); (2) Francia & Nixon (1973); (3) Bouilloud et al. (2015); (4) Westley et al. (1998); (5) Hagen et al. (1981); (6) this study; (7) Hudson et al. (2014); (8) Van Nes & Vos (1978); (9) Yaws (2008).
Download table as: ASCIITypeset image
Table 3. Infrared Band Positions for Methane (CH4), Ethane (C2H6), Propane (C3H8), and Butane (C4H10) Observed for 500 nm Thick Pure Ices at 10 K
| Position (cm−1) | Assignment |
|---|---|
| Methane (CH4)1 | |
| 1300 | v4 |
| 2814 | v2 + v4 |
| 3008 | v3 |
| 4204 | v1 + v4 |
| 4303 | v3 + v4 |
| 4531 | v2 + v3 |
| Ethane (C2H6)2 | |
| 819 | v12 |
| 1371 | v6 |
| 1461 | v11 |
| 2646 | v8 + v12 |
| 2736 | v2 + v6 |
| 2878 | v5 |
| 2910 | v8 + v11 |
| 2941 | v8 + v11 |
| 2969 | v10 |
| 4066 | v5 + v9 |
| 4130 | 3v6 |
| 4163 | v9 + v10 |
| 4323 | v5 + v8 |
| 4401 | v8 + v10 |
| Propane (C3H8)3,4 | |
| 747 | v26 |
| 867 | v8 |
| 919 | v21 |
| 1049 | v20 |
| 1156 | v7 |
| 1185 | v25 |
| 1333 | v19 |
| 1369 | v18 |
| 1384 | v6 |
| 1451 | v5 |
| 1466 | v4 |
| 2650 | v4 + v6/v18 |
| 2729 | 2v18 |
| 2781 | 2v6 |
| 2869 | v3 |
| 2891 | 2v5 |
| 2933 | 2v4 |
| 2957 | v1/v2 |
| 4024 | v1 + v7 |
| 4054 | v3 + v25 |
| 4116 | 2v4 + v6/v18 |
| 4145 | v1 + v25 |
| 4205 | v3 + v19 |
| 4241 | v3 + v18 |
| 4287 | v1 + v19 |
| 4327 | v1 + v4 |
| 4383 | 2v4 + v5 |
| Butane (C4H10)4,5 | |
| 730 | v17 |
| 963 | v35 |
| 1288 | v33 |
| 1376 | v32 |
| 1465 | v14 |
| 2636 | v14 + v24 |
| 2727 | 2v32 |
| 2859 | v29 |
| 2871 | v28 |
| 2923 | v13 |
| 2955 | v12 |
| 4335 | v12 + v6 |
References. (1) Turner et al. (2015); (2) Abplanalp & Kaiser (2016); (3) Snyder & Schachtschneider (1963); (4) Shimanouchi (1972); (5) Murphy et al. (1991).
The ice mixtures were then irradiated for 60 minutes with 5 KeV electrons at a current of 0 nA (blank), 100 nA, 1000 nA, and 5000 nA from a Specs EQ 22–35 electron gun. The electron beam exposed an area of 3.2 ± 0.3 cm2 at an angle of 15° relative to the surface normal with an actual extraction efficiency of 78.8% of the electrons by scanning the beam over the ice surface. The electron trajectories and energy losses inside the ices were simulated by the CASINO code (Hovington et al. 1997). These simulations yielded average penetration depths from 460 ± 70 nm to 640 ± 100 nm translating to average doses between 2.1 ± 0.3 eV and 3.5 ± 0.7 eV absorbed per molecule at 100 nA irradiation current in the deposited ices (Table 1), which scales to between 21 ± 3 eV and 35 ± 7 eV at 1000 nA and between 100 ± 20 eV and 180 ± 40 eV at 5000 nA. For an interstellar ice grain, these doses correspond to a range of approximately 106 to 5 × 10⁷ years, which approaches the lifetime for an interstellar molecular cloud (Strazzulla & Johnson 1991). It is important to note that the penetration depths of the electrons are less than the thickness of the ices ensuring that the electrons interact only with the ices, but not with the silver target. After the irradiation, the irradiated ices remained at 10 K for an additional 60 minutes before being heated to 300 K at a rate of 1 K minute−1. In situ infrared data were collected by a Nicolet 6700 Fourier Transform Infrared Spectrometer at 4 cm−1 resolution throughout the irradiation and temperature programmed desorption (TPD). These data are available as a tar.gz file.
2.2. Ice Composition
In order to synthesize phosphorus-bearing molecules—including alkylphosphonic acids—in interstellar analog ices, appropriate precursor molecules that have been detected or predicted to exist on low temperature grains must be utilized; these precursor molecules must also contain carbon (C), hydrogen (H), oxygen (O), and phosphorus (P) as present in alkylphosphonic acids. First, in astrophysically relevant ices, water (H2O) presents the dominating component and can provide the required oxygen and hydrogen (Boogert et al. 2015). Second, oxygen can also be provided by carbon dioxide (CO2), which has been detected on interstellar grains at levels of 19%–28% the abundance of water ice (Boogert et al. 2015). Goldsmith et al. (2011) detected molecular oxygen toward Orion and at levels suggesting O2 comprises at most 1% of interstellar oxygen, and laboratory experiments have verified that molecular oxygen most likely represents a radiolysis product of water ice (Zheng et al. 2006a, 2006b). The reaction of phosphine with these free oxygen atoms is expected to form, e.g., the phosphorus oxoacids H3PO2, H3PO3, and H3PO4 (Figure 1), whose infrared spectra have been investigated by Chapman & Thirlwell (1964), Brun (1970), and Ahmadi et al. (2005), respectively. Third, considering the molecular structure of the alkylphosphonic acids and the existence of an alkyl moiety (Figure 1), astrophysically relevant alkanes shall also be a component of the analog ices. Here, methane (CH4) has been detected in interstellar ices at levels of up to 5% the abundance of water (Boogert et al. 2015). Ethane (C2H6) has never been detected in interstellar ices, but, based on laboratory experiments, it presents the principal alkane, along with propane (C3H8) and butane (C4H10), formed upon radiolysis of methane ices at 10 K (Bennett et al. 2006; Kim et al. 2010). Finally, a carrier of phosphorus is needed. Astrochemical models of interstellar clouds suggest that phosphorus should be depleted onto interstellar grains as phosphine (PH3) at levels below the current detection limit via infrared spectroscopy (Turner et al. 1990; Charnley & Millar 1994; Wakelam et al. 2013). Note that phosphine was identified in the circumstellar envelope of IRC+10216 (Agundez et al. 2014, 2008) as well as in the atmospheres of Jupiter (Ridgway et al. 1976) and Saturn (Gillett & Forrest 1974). Since the initial atmospheric makeup is generally related to the chemistry of the local solar nebula during planetary formation and molecular clouds provide the material for planetary formation, phosphine is expected to be present in molecular clouds and hence also on interstellar grains. Based on these considerations, we select eight sets of phosphine-rich model ices with rising complexity. Here, ice I helps to unravel the basic processes on the decomposition of phosphine in irradiated ices, whereas ice II probes potential carbon–phosphorus bond couplings. Ices III to V elucidate the reactivity of oxygen atoms released from molecular oxygen, carbon dioxide, and water with phosphine and the inherent formation of oxygen–phosphorus bonds as present in (alkyl) phosphonic acids. Eventually ices VI to VIII explore the formation of all functional groups of alkylphosphonic acids by adding the C1 to C4 alkanes to the phosphine–water and phosphine–carbon dioxide ices.
3. Results and Discussion
3.1. Ice I [PH3]
Pure phosphine (PH3) ice (Figures 3–5, Table 4) displayed the distinct peaks for ν2 (985 cm−1) and ν4 (1097 cm−1) as well as an intense peak centered at 2305 cm−1 resulting from the unresolved bands of ν1 and ν3. The irradiated ice produced mostly diphosphine (P2H4), which was easily identified at 100 nA irradiation and consistent with the results of Turner et al. (2015). For all irradiations, the ν1 (2280 cm−1), ν2 (2225 cm−1), and ν3 (1056 cm−1) normal modes were observed, while additional vibrations of ν5 (648 cm−1), ν8 (2289 cm−1), ν11 (870 cm−1), ν12 (632 cm−1), 2ν2 (4467 cm−1), and 2ν1 (4520 cm−1) were observed at higher doses. In addition, triphosphane (P3H5) was observed at higher doses, with the δ(HPP) stretches observed at 721 and 778 cm−1. The phosphorus–hydrogen stretching vibration for triphosphane and higher order phosphanes is likely present but obscured by the more intense stretches of phosphine and diphosphine. Not surprisingly, the residues that remained after the ice sublimed contained phosphorus–hydrogen stretching and, to a lesser extent, δ(PH2), which suggests the residue consists of large molecular weight phosphanes that do not sublime at room temperature even under ultra-high vacuum. This experiment shows that phosphine molecules readily react to produce more complex phosphanes (such as those seen in Turner et al. 2015) and provides the first piece of the puzzle in unraveling the capabilities of phosphine to react with neighboring constituents in ices.
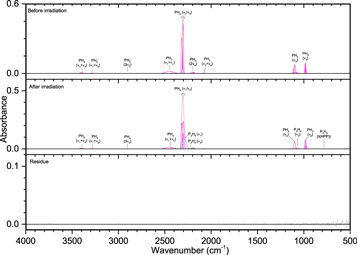
Figure 3. Infrared spectra of ice I at 10 K taken before (top) and after (middle) irradiation with 100 nA irradiation current for one hour. The remaining residue at 300 K after sublimation of the irradiated ice is shown in the bottom spectrum. The original spectrum (gray) is deconvoluted showing peaks assigned to phosphine (pink) and new peaks from irradiation (cyan), which sum to create a peak-fitted spectrum (red dashed).
Download figure:
Standard image High-resolution image
Figure 4. Infrared spectra of ice I at 10 K taken before (top) and after (middle) irradiation with 1000 nA irradiation current for one hour. The remaining residue at 300 K after sublimation of the irradiated ice is shown in the bottom spectrum. The original spectrum (gray) is deconvoluted showing peaks assigned to phosphine (pink) and new peaks from irradiation (cyan), which sum to create a peak-fitted spectrum (red dashed). The insets expand low-intensity regions of the spectrum.
Download figure:
Standard image High-resolution image
Figure 5. Infrared spectra of ice I at 10 K taken before (top) and after (middle) irradiation with 5000 nA irradiation current for one hour. The remaining residue at 300 K after sublimation of the irradiated ice is shown in the bottom spectrum. The original spectrum (gray) is deconvoluted showing peaks assigned to phosphine (pink) and new peaks from irradiation (cyan), which sum to create a peak-fitted spectrum (red dashed). The insets expand low-intensity regions of the spectrum.
Download figure:
Standard image High-resolution imageTable 4. Infrared Absorption Assignments for Ice I at 10 K, the Products of Irradiation at Different Doses, and the Residue that Remained at 300 K after the Ice Fully Sublimed
| Pristine Ice, before Irradiation (10 K) | |||
|---|---|---|---|
| Assignment | Compound | Position (cm−1) | References |
| v2 | PH3 | 985 | (1) |
| v4 | PH3 | 1097 | (1) |
| v2 + v4 | PH3 | 2068, 2082 | (1) |
| 2v4 | PH3 | 2200 | (1) |
| v1/v3 | PH3 | 2302, 2309, 2317 | (1) |
| v1 + vL | PH3 | 2350–2450 | (1) |
| 3v2 | PH3 | 2903 | (1) |
| v1 + v2 | PH3 | 3287 | (1) |
| v1 + v4 | PH3 | 3392 | (1) |
| v1 + 2v4 | PH3 | 4536 | (1) |
| v3 + 2v4 | PH3 | 4550 | (1) |
| 2v1 | PH3 | 4619 | (1) |
| New Peaks after Irradiation (10 K) | ||||
|---|---|---|---|---|
| Assignment | Compound | Position (cm−1) | Irradiation (nA) | References |
| v12 | P2H4 | 632 | 5000 | (2) |
| v5 | P2H4 | 648 | 1000, 5000 | (2) |
| δ(HPP) | P3H5 | 721 | 1000, 5000 | (3) |
| δ(HPP) | P3H5 | 778 | 100, 1000, 5000 | (3) |
| v11 | P2H4 | 870 | 1000, 5000 | (2) |
| v3 | P2H4 | 1059 | 100, 1000, 5000 | (2) |
| v2 | P2H4 | 2225 | 100, 1000, 5000 | (2) |
| v1 | P2H4 | 2280 | 100, 1000, 5000 | (2) |
| v8 | P2H4 | 2289 | 5000 | (2) |
| 2v2 | P2H4 | 4467 | 1000, 5000 | (4) |
| 2v1 | P2H4 | 4520 | 1000, 5000 | (4) |
| Residue (300 K) | |||
|---|---|---|---|
| Assignment | Position (cm−1) | Irradiation (nA) | References |
| δ(PH2) | 1052 | 1000 | (5) |
| v(PH) | 2229, 2251 | 1000, 5000 | (5) |
Note. vL defines the lattice mode.
References. (1) Turner et al. (2015); (2) Durig et al. (1996); (3) Ding & Zhang (1996); (4) This study; (5) Socrates (2004).
Download table as: ASCIITypeset image
3.2. Ice II [PH3/CH4]
The addition of methane (CH4) to phosphine ices (Figures 6–8, Table 5) was observed through the ν3 (3002 cm−1) and ν4 (1302 cm−1) fundamentals, as well as a small peak for the infrared inactive ν2 (1525 cm−1) vibration. Upon irradiation, phosphine produced diphosphine and triphosphane in a similar manner to ice I, while the only hydrocarbon seen at all irradiations was ethane (C2H6), which displayed peaks for ν5 (2880 cm−1), ν6 (1370 cm−1), ν10 (2968 cm−1), ν11 (1461 cm−1), ν12 (821 cm−1), and ν8 + ν11 (2936 cm−1). At higher doses, two bands were seen for propane (C3H8), the ν1 (2956 cm−1) and ν21 (912 cm−1) vibrations, while at 5000 nA the only unsaturated compound produced, ethylene (C2H4), was observed at ν7 (947 cm−1) and ν9 (3087 cm−1). The reaction of phosphine and methane was limited compared to reactions with themselves, and the only product identified in the irradiated ices was methylphosphine (CH3PH2), for which the associated vibrations of ω(CH3) (984 cm−1), δas(CH3) (1412 cm−1), ν(PH) (2300 cm−1), and ν(CH) (912 cm−1) were observed. Methylphosphine is significant because it establishes that ices of phosphine and methane can lead to phosphorus–carbon bonding and with further oxidation, methylphosphine could be a precursor in the formation of methylphosphonic acid. Finally, the peaks in the residue fall into three general categories and mostly appear only after 5000 nA irradiation, which suggests that products of phosphine and methane have a sufficiently high vapor pressure to sublime below room temperature except at high irradiation doses. The first category is phosphorus–hydrogen stretching (2260 cm−1), which is typical of a phosphine-containing ice and is the only infrared band that was seen at less than 5000 nA. Second is a group of four peaks associated with carbon–hydrogen stretching: νs(CH) on CH2 (2861 cm−1), νs(CH) on CH3 (2889 cm−1), νas(CH) on CH2 (2912 cm−1), and νas(CH) on CH3 (2949 cm−1). The third group of vibrations belongs to the P–CH3 moiety: ρ(CH3) (867 and 883 cm−1), δs(CH3) (1275 cm−1), and δas(CH3) (1409 cm−1). Thus, these bands indicate that the molecules in the residue contain phosphorus–hydrogen bonds, carbon–hydrogen bonds, and most significantly, carbon–phosphorus bonds. Here, a substantial step in the systematic untangling of the production of alkylphosphonic acids is supplied as phosphorus–carbon bonds were observed from a simple binary ice mixture. These results show that the bottom-up approach for synthesis of the phosphorus–carbon bond is in fact feasible within interstellar ices (Turner et al. 2016).

Figure 6. Infrared spectra of ice II at 10 K taken before (top) and after (middle) irradiation with a 100 nA irradiation current for one hour. The remaining residue at 300 K after sublimation of the irradiated ice is shown in the bottom spectrum. The original spectrum (gray) is deconvoluted showing peaks assigned to phosphine (pink) and methane (green), and new peaks from irradiation (cyan), which sum to create a peak-fitted spectrum (red dashed). The inset expands low-intensity regions of the spectrum.
Download figure:
Standard image High-resolution image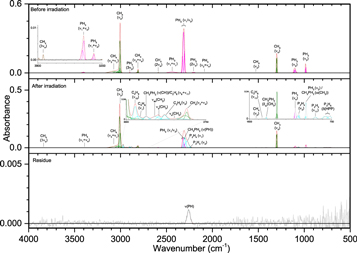
Figure 7. Infrared spectra of ice II at 10 K taken before (top) and after (middle) irradiation with a 1000 nA irradiation current for one hour. The remaining residue at 300 K after sublimation of the irradiated ice is shown in the bottom spectrum. The original spectrum (gray) is deconvoluted showing peaks assigned to phosphine (pink) and methane (green), and new peaks from irradiation (cyan), which sum to create a peak-fitted spectrum (red dashed). The insets expand low-intensity regions of the spectrum.
Download figure:
Standard image High-resolution image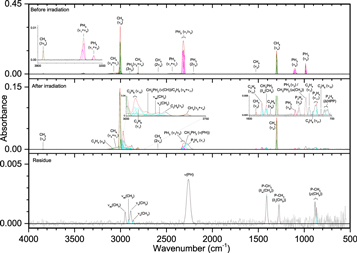
Figure 8. Infrared spectra of ice II at 10 K taken before (top) and after (middle) irradiation with a 5000 nA irradiation current for one hour. The remaining residue at 300 K after sublimation of the irradiated ice is shown in the bottom spectrum. The original spectrum (gray) is deconvoluted showing peaks assigned to phosphine (pink) and methane (green), and new peaks from irradiation (cyan), which sum to create a peak-fitted spectrum (red dashed). The insets expand low-intensity regions of the spectrum.
Download figure:
Standard image High-resolution imageTable 5. Infrared Absorption Assignments for Ice II at 10 K, the Products of Irradiation at Different Doses, and the Residue that Remained at 300 K after the Ice Fully Sublimed
| Pristine Ice, before Irradiation (10 K) | |||
|---|---|---|---|
| Assignment | Compound | Position (cm−1) | References |
| v2 | PH3 | 986 | (1) |
| v4 | PH3 | 1104 | (1) |
| v4 | CH4 | 1302 | (2) |
| v2 | CH4 | 1525 | (2) |
| v2 + v4 | PH3 | 2080 | (1) |
| 2v4 | PH3 | 2204 | (1) |
| v1/v3 | PH3 | 2306, 2315, 2323 | (1) |
| v1 + vL | PH3 | 2350–2450 | (1) |
| 2v4 | CH4 | 2590 | (2) |
| v2 + v4 | CH4 | 2809 | (2) |
| 3v2 | PH3 | 2899 | (1) |
| v3 | CH4 | 3002 | (2) |
| v3 + vL | CH4 | 3015–3115 | (2) |
| v1 + v2 | PH3 | 3292 | (1) |
| v1 + v4 | PH3 | 3402 | (1) |
| 3v4 | CH4 | 3841 | (2) |
| v1 + v4 | CH4 | 4193 | (2) |
| v3 + v4 | CH4 | 4292 | (2) |
| v1 + 2v4 | PH3 | 4534 | (1) |
| v3 + 2v4 | PH3 | 4550 | (1) |
| 2v1 | PH3 | 4615 | (1) |
| New Peaks after Irradiation (10 K) | ||||
|---|---|---|---|---|
| Assignment | Compound | Position (cm−1) | Irradiation (nA) | References |
| δ(HPP) | P3H5 | 753 | 1000, 5000 | (3) |
| δ(HPP) | P3H5 | 782 | 100, 1000, 5000 | (3) |
| v12 | C2H6 | 821 | 5000 | (4) |
| v11 | P2H4 | 875 | 1000, 5000 | (5) |
| v21 | C3H8 | 912 | 5000 | (6) |
| v7 | C2H4 | 947 | 5000 | (7) |
| ω(CH3) | CH3PH2 | 984 | 1000, 5000 | (8) |
| v3 | P2H4 | 1059 | 100, 1000, 5000 | (5) |
| v6 | C2H6 | 1370 | 5000 | (4) |
| δas(CH3) | CH3PH2 | 1412 | 1000, 5000 | (8) |
| v11 | C2H6 | 1461 | 1000, 5000 | (4) |
| v2 | P2H4 | 2245 | 1000 | (5) |
| v1 | P2H4 | 2275 | 100, 1000, 5000 | (5) |
| v(PH) | CH3PH2 | 2300 | 100, 1000, 5000 | (8) |
| vs(CH2) | CnH2n+2(n ≥ 3) | 2850 | 1000 | (9) |
| v5 | C2H6 | 2880 | 1000, 5000 | (4) |
| vs(CH3) | CnH2n+2(n ≥ 3) | 2895 | 1000, 5000 | (9) |
| vas(CH2) | CnH2n+2(n ≥ 3) | 2907 | 1000, 5000 | (9) |
| v(CH), v8 + v11 | CH3PH2, C2H6 | 2936 | 1000, 5000 | (8), (4) |
| v1 | C3H8 | 2956 | 1000, 5000 | (6) |
| v10 | C2H6 | 2968 | 100, 1000, 5000 | (4) |
| v9 | C2H4 | 3087 | 5000 | (4) |
| 2v1 | P2H4 | 4520 | 1000 | (5) |
| Residue (300 K) | |||
|---|---|---|---|
| Assignment | Position (cm−1) | Irradiation (nA) | References |
| P–CH3 ρ(CH3) | 867 | 5000 | (9) |
| P–CH3 ρ(CH3) | 883 | 5000 | (9) |
| P–CH3 δs(CH3) | 1275 | 5000 | (9) |
| P–CH3 δas(CH3) | 1409 | 5000 | (9) |
| v(PH) | 2260 | 1000, 5000 | (9) |
| CH2 vs(CH) | 2861 | 5000 | (9) |
| CH3 vs(CH) | 2889 | 5000 | (9) |
| CH2 vas(CH) | 2912 | 5000 | (9) |
| CH3 vas(CH) | 2949 | 5000 | (9) |
Note. vL defines the lattice mode.
References. (1) Turner et al. (2015); (2) Turner et al. (2016); (3) Ding & Zhang (1996); (4) Abplanalp & Kaiser (2016); (5) Durig et al. (1996); (6) Shimanouchi (1972); (7) Zhou et al. (2014); (8) Kim & Zeroka (2001); (9) Socrates (2004).
3.3. Ice III [PH3/O2]
Three sources of oxygen were chosen for this study: water (H2O), carbon dioxide (CO2), and dioxygen (O2). While small amounts of O2 have been detected in the interstellar medium, it largely serves as a good foundation for the study of reactions of atomic oxygen with phosphine and as a carbon-free reference for comparison with the carbon dioxide ices. Although previous studies (Bennett & Kaiser 2005; Ennis et al. 2011) observed the O2 fundamental stretch in pure oxygen ices at 1549 cm−1, these mixed ices with phosphine show no features related to O2 (Figures 9–11, Table 6). However, the phosphine bands are less intense, and upon irradiation with even 100 nA, their intensities decline to approximately 10%, which indicates that irradiated dioxygen is much more efficient at reacting with phosphine than methane. After irradiation, several oxidized phosphorus peaks were observed at the expense of phosphanes, as only two peaks for diphosphine (ν1 (2284 cm−1) and ν3 (1060 cm−1)) were seen. Also, the irradiated oxygen produced ozone (O3), observed at ν3 (1040 cm−1) and its overtone 2ν3 (2108 cm−1). In general, the broad absorption features assigned to phosphorus with oxygen are identified as function groups that could belong to several molecules and numerous combinations of phosphorus, oxygen, and hydrogen. At lower frequencies exists a complex of band bounded by ν(P–O) with peak intensity between 930 and 1000 cm−1 and by ν(P=O) with peak intensity ranging from 1160 to 1270 cm−1. Intermediate between these bounds exists δ(PH2) bands near 1050 cm−1, which includes the ν3 fundamental seen in this and previous ices. The P–OH moiety is evident by the location of oxygen–hydrogen stretches around 2170 and 2700 cm−1, and the band at 1680 cm−1 indicates that O=P–OH is also present. That the band at 2700 cm−1 is greater intensity than 2170 cm−1 suggests a high concentration of phosphoric acid for the 1000 nA residues, while the roughly equal intensities at 5000 nA indicate greater amounts of phosphonic acid (Socrates 2004). However, this method is limited in the irradiated ices because the ν4(H2O) band contributes to the 1680 cm−1 absorption, thus complicating the comparison of peak intensities. Other water bands that formed from irradiation include νL (800 cm−1) and the broad oxygen–hydrogen stretches of ν1 and ν3 between 3000 and 3600 cm−1. While water is not unexpected from this experimental mixture, the ease at which phosphine is oxidized to form compounds similar to phosphonic and phosphoric acid with P=O, P–OH, and combined O=P–OH is promising for phosphine's potential as a precursor to alkylphosphonic acids.

Figure 9. Infrared spectra of ice III at 10 K taken before (top) and after (middle) irradiation with a 100 nA irradiation current for one hour. The remaining residue at 300 K after sublimation of the irradiated ice is shown in the bottom spectrum. The original spectrum (gray) is deconvoluted showing peaks assigned to phosphine (pink) and new peaks from irradiation (cyan), which sum to create a peak-fitted spectrum (red dashed). No molecular oxygen peaks were observed. The v1 and v3 vibration for water are labeled as "O" (out-of-phase with neighboring molecules), "L" (longitudinal), and "T" (transversal).
Download figure:
Standard image High-resolution image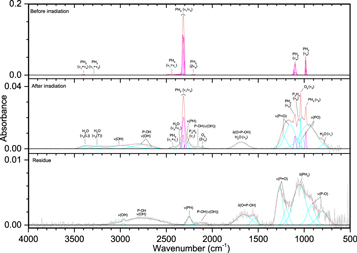
Figure 10. Infrared spectra of ice III at 10 K taken before (top) and after (middle) irradiation with 1000 nA irradiation current for one hour. The remaining residue at 300 K after sublimation of the irradiated ice is shown in the bottom spectrum. The original spectrum (gray) is deconvoluted showing peaks assigned to phosphine (pink) and new peaks from irradiation (cyan), which sum to create a peak-fitted spectrum (red dashed). No molecular oxygen peaks were observed. The v3 vibration for water is labeled as "L" (longitudinal) or "T" (transversal).
Download figure:
Standard image High-resolution image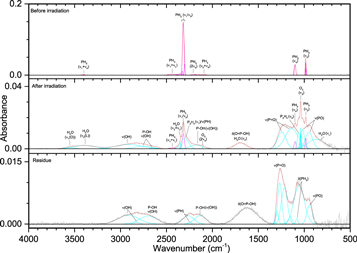
Figure 11. Infrared spectra of ice III at 10 K taken before (top) and after (middle) irradiation with 5000 nA irradiation current for one hour. The remaining residue at 300 K after sublimation of the irradiated ice is shown in the bottom spectrum. The original spectrum (gray) is deconvoluted showing peaks assigned to phosphine (pink) and new peaks from irradiation (cyan), which sum to create a peak-fitted spectrum (red dashed). No molecular oxygen peaks were observed. The v1 vibration for water are labeled as "O" (out-of-phase with neighboring molecules), while the v3 vibration is labeled as "L" (longitudinal).
Download figure:
Standard image High-resolution imageTable 6. Infrared Absorption Assignments for Ice III at 10 K, the Products of Irradiation at Different Doses, and the Residue that Remained at 300 K after the Ice Fully Sublimed
| Pristine Ice, before Irradiation (10 K) | |||
|---|---|---|---|
| Assignment | Compound | Position (cm−1) | References |
| v2 | PH3 | 987 | (1) |
| v4 | PH3 | 1100 | (1) |
| v2 + v4 | PH3 | 2087, 2143 | (1) |
| 2v4 | PH3 | 2192, 2202 | (1) |
| v1/v3 | PH3 | 2303, 2317, 2324 | (1) |
| v1 + vL | PH3 | 2350–2450 | (1) |
| v1 + v2 | PH3 | 3287 | (1) |
| v1 + v4 | PH3 | 3399 | (1) |
| v1 + 2v4 | PH3 | 4536 | (1) |
| v3 + 2v4 | PH3 | 4550 | (1) |
| New Peaks after Irradiation (10 K) | ||||
|---|---|---|---|---|
| Assignment | Compound | Position (cm−1) | Irradiation (nA) | References |
| vL | H2O | 790–870 | 100, 1000, 5000 | (2) |
| v(P–O) | 900–1050 | 100, 1000, 5000 | (3) | |
| v3 | O3 | 1040 | 100, 1000, 5000 | (4) |
| v3 | P2H4 | 1059 | 100, 1000, 5000 | (5) |
| v(P=O) | 1100–1300 | 100, 1000, 5000 | (3) | |
| δ(O=P–OH) | 1630–1740 | 100, 1000, 5000 | (3) | |
| v4 | H2O | 1630–1740 | 100, 1000, 5000 | (2) |
| 2v3 | O3 | 2108 | 100, 1000, 5000 | (4) |
| P–OH v(OH) | 2170 | 100, 1000, 5000 | (3) | |
| v1 | P2H4 | 2279 | 100, 1000, 5000 | (5) |
| v(PH) | 2270–2320 | 100, 1000, 5000 | (3) | |
| v2 + vL | H2O | 2345 | 100, 1000, 5000 | (2) |
| P–OH v(OH) | 2600–2800 | 100, 1000, 5000 | (3) | |
| v(OH) | 2825–3000 | 100, 1000, 5000 | (3) | |
| v3 (transversal) | H2O | 3190–3250 | 100, 1000 | (2) |
| v3 (longitudinal) | H2O | 3400 | 100, 1000, 5000 | (2) |
| v1 (out of phase) | H2O | 3520–3550 | 100, 5000 | (2) |
| Residue (300 K) | |||
|---|---|---|---|
| Assignment | Position (cm−1) | Irradiation (nA) | References |
| v(P–O) | 800–950 | 1000, 5000 | (3) |
| δ(PH2) | 1030–1100 | 1000, 5000 | (3) |
| v(P=O) | 1150–1300 | 1000, 5000 | (3) |
| δ (O=P–OH) | 1540–1660 | 1000, 5000 | (3) |
| P–OH v(OH) | 2100–2190 | 100, 1000, 5000 | (3) |
| v(PH) | 2260 | 100, 1000, 5000 | (3) |
| P–OH v(OH) | 2700–2770 | 1000, 5000 | (3) |
| v(OH) | 2820–3500 | 100, 1000, 5000 | (3) |
Note. vL defines the lattice mode and no absorption peaks were observed for molecular oxygen.
References. (1) Turner et al. (2015); (2) Hagen et al. (1981); (3) Socrates (2004); (4) Ennis et al. (2011); (5) Durig et al. (1996).
Download table as: ASCIITypeset image
3.4. Ice IV [PH3/CO2]
Carbon dioxide (CO2) adds a level of complexity in that four elements are present in this ice (Figures 12–14, Table 7). Although carbon is again present in this system like in ice II, the purpose of adding carbon dioxide is as a source of oxygen from the decomposition of carbon dioxide to carbon monoxide (CO) and atomic oxygen, and thus the expected results are more similar to ice III. A downside to using carbon dioxide is that its most intense peak, ν3 (2335 cm−1) not only overlaps with ν1/ν3 of phosphine but dwarfs and obscures phosphine and some products with phosphorus–hydrogen bonding. Besides the ν3 vibration and its carbon-13 isotopic peak (2274 cm−1), the ν2 band appears prominently at 665 cm−1. The only carbon-containing compound detected in the irradiated was carbon monoxide at 2137 cm−1 and for 13CO, 2092 cm−1. The carbonyl functional group, ν(C=O), was also observed around 1765 cm−1, but given its broad low intensity and overlapping neighboring peaks the specific nature of this carbonyl stretch cannot be ascertained. Other than these bands, the products were similar to the system of phosphine and oxygen. Water was observed at all irradiations through the ν1, ν2, ν3, and νL bands. Similarly, the oxidized phosphorus functional groups of ν(P–O) (950 cm−1), ν(P=O) (1150–1300 cm−1), δ(O=P–OH) (1712 cm−1), and P–OH ν(OH) (2170 and 2680 cm−1) were observed at after irradiation and in the residues for the 1000 nA and 5000 nA experiments. Diphosphine was also detected after irradiation at 1000 nA, while the functional groups ν(PH) and δ(PH2) were detected both after irradiation and in the residues. A comparison of the P–OH bands at 1712, 2170, and 2680 cm−1 indicates that for the 1000 and 5000 nA experiments, phosphonic acid is the dominant source of the P–OH moiety in the residue. The 5000 nA residue also has a band assigned to phosphorus–carbon stretching (745 cm−1), although no other carbon stretches are available to help elucidate the nature of the compounds that might contain this bond. These results readily supply the next step in understanding the possible formation mechanism toward alkylphosphonic acids, as phosphonic acid vibrations are easily detected.
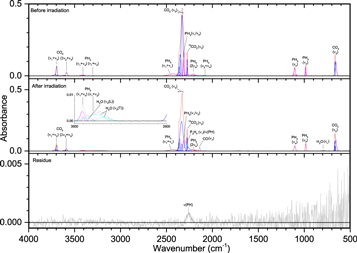
Figure 12. Infrared spectra of ice IV at 10 K taken before (top) and after (middle) irradiation with 100 nA irradiation current for one hour. The remaining residue at 300 K after sublimation of the irradiated ice is shown in the bottom spectrum. The original spectrum (gray) is deconvoluted showing peaks assigned to phosphine (pink) and carbon dioxide (blue), and new peaks from irradiation (cyan), which sum to create a peak-fitted spectrum (red dashed). The v3 vibration for water is labeled as "L" (longitudinal) or "T" (transversal). The inset expands low-intensity regions of the spectrum.
Download figure:
Standard image High-resolution image
Figure 13. Infrared spectra of ice IV at 10 K taken before (top) and after (middle) irradiation with a 1000 nA irradiation current for one hour. The remaining residue at 300 K after sublimation of the irradiated ice is shown in the bottom spectrum. The original spectrum (gray) is deconvoluted showing peaks assigned to phosphine (pink) and carbon dioxide (blue), and new peaks from irradiation (cyan), which sum to create a peak-fitted spectrum (red dashed). The v1 and v3 vibration for water are labeled as "O" (out-of-phase with neighboring molecules), "I" (in-phase with neighboring molecules), "L" (longitudinal), and "T" (transversal). The insets expand low-intensity regions of the spectrum.
Download figure:
Standard image High-resolution image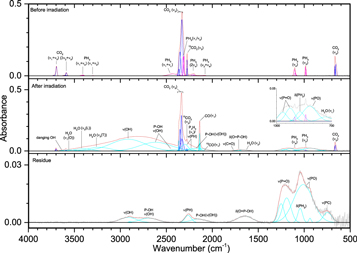
Figure 14. Infrared spectra of ice IV at 10 K taken before (top) and after (middle) irradiation with a 5000 nA irradiation current for one hour. The remaining residue at 300 K after sublimation of the irradiated ice is shown in the bottom spectrum. The original spectrum (gray) is deconvoluted showing peaks assigned to phosphine (pink) and carbon dioxide (blue), and new peaks from irradiation (cyan), which sum to create a peak-fitted spectrum (red dashed). The v1 and v3 vibration for water are labeled as "O" (out-of-phase with neighboring molecules), "L" (longitudinal), and "T" (transversal). The inset expands low-intensity regions of the spectrum.
Download figure:
Standard image High-resolution imageTable 7. Infrared Absorption Assignments for Ice IV at 10 K, the Products of Irradiation at Different Doses, and the Residue that Remained at 300 K after the Ice Fully Sublimed
| Pristine Ice, before Irradiation (10 K) | |||
|---|---|---|---|
| Assignment | Compound | Position (cm−1) | References |
| v2 | CO2 | 665 | (1) |
| v2 | PH3 | 986 | (2) |
| v4 | PH3 | 1103 | (2) |
| v2 + v4 | PH3 | 2080 | (2) |
| 2v4 | PH3 | 2203 | (2) |
| v3 | 13CO2 | 2274 | (1) |
| v1/v3 | PH3 | 2309, 2316 | (2) |
| v3 | CO2 | 2325–2365 | (1) |
| v1 + vL | PH3 | 2435 | (2) |
| v1 + v2 | PH3 | 3300 | (2) |
| v1 + v4 | PH3 | 3407 | (2) |
| 2v2 + v3 | CO2 | 3588 | (1) |
| v1 + v3 | CO2 | 3694 | (1) |
| v1 + v3 | PH3 | 4554 | (2) |
| 2v3 | PH3 | 4662 | (2) |
| New Peaks after Irradiation (10 K) | ||||
|---|---|---|---|---|
| Assignment | Compound | Position (cm−1) | Irradiation (nA) | References |
| vL | H2O | 800 | 100, 1000, 5000 | (3) |
| v(P–O) | 930–970 | 1000, 5000 | (4) | |
| δ(PH2) | 1044 | 5000 | (4) | |
| v3 | P2H4 | 1060 | 1000 | (5) |
| v(P=O) | 1140–1300 | 1000, 5000 | (4) | |
| v2 | H2O | 1630 | 1000, 5000 | (3) |
| δ(O=P–OH) | 1712 | 1000, 5000 | (4) | |
| v(C=O) | 1765 | 1000, 5000 | (4) | |
| v1 | 13CO | 2092 | 1000, 5000 | (1) |
| v1 | CO | 2137 | 100, 1000, 5000 | (1) |
| P–OH v(OH) | 2170 | 5000 | (4) | |
| v1 | P2H4 | 2284 | 100, 1000, 5000 | (5) |
| v(PH) | 2230–2330 | 100, 1000, 5000 | (4) | |
| P–OH v(OH) | 2400–2680 | 1000, 5000 | (4) | |
| v(OH) | 2850–2950 | 1000, 5000 | (4) | |
| v1(in phase) | H2O | 3037 | 1000 | (3) |
| v3(transversal) | H2O | 3170–3270 | 100, 1000, 5000 | (3) |
| v3(longitudinal) | H2O | 3360–3410 | 100, 1000, 5000 | (3) |
| v1(out of phase) | H2O | 3557 | 1000, 5000 | (3) |
| dangling OH | H2O | 3620–3670 | 1000, 5000 | (6) |
| Residue (300 K) | |||
|---|---|---|---|
| Assignment | Position (cm−1) | Irradiation (nA) | References |
| v(PC) | 745 | 5000 | (4) |
| v(P–O) | 950–1010 | 1000, 5000 | (4) |
| δ(PH2) | 1045 | 1000, 5000 | (4) |
| v(P=O) | 1180–1250 | 1000, 5000 | (4) |
| δ(O=P–OH) | 1647 | 1000, 5000 | (4) |
| P–OH v(OH) | 2152 | 1000, 5000 | (4) |
| v(PH) | 2250 | 100, 1000, 5000 | (4) |
| P–OH v(OH) | 2690 | 1000, 5000 | (4) |
| v(OH) | 2900–3250 | 1000, 5000 | (4) |
Note. vL defines the lattice mode.
References. (1) Bennett et al. (2004); (2) Turner et al. (2015); (3) Hagen et al. (1981); (4) Socrates (2004); (5) Durig et al. (1996); (6) de Barros et al. (2015).
Download table as: ASCIITypeset image
3.5. Ice V [PH3/H2O]
While the irradiation of molecular oxygen and carbon dioxide produces a free reactive oxygen atom, reactions with water (Figures 15–17, Table 8) are expected to proceed differently as the hydroxyl radical (OH) is formed instead during irradiation. The unirradiated ice shows consistent features to the water produced in ices III and IV, including the broad νL band centered near 750 cm−1 and its small overtone at 1465 cm−1, the asymmetric ν2 band, the combination band of νL and ν2 that falls in the ν(PH) region at 2335 cm−1, and the complex of ν(OH) absorptions between 3000 and 3600 cm−1. These broad absorptions include ν1, which is split between vibrations that are in-phase and out-of-phase with its neighbors (3050 and 3500 cm−1), and ν3, which is also split between the transversal (3200 cm−1) and longitudinal (3350 cm−1) vibrations. The thickness of this ice is around 1 μm, which is sufficient for the transversal mode to be observed and not neutralized by the metal surface selection rule (MSSR; Horn et al. 1995; Zondlo et al. 1997; Maté et al. 2003). The transversal mode, which arises from a transition dipole moment parallel to the surface and absorbs the s-polarized component of the infrared radiation, can be canceled out in much thinner films by the MSSR. Also, the notch seen in this peak can be attributed to coupling of the real refractive index (n) and the absorption index (k), resulting in a change of reflectivity that becomes more pronounced with increasing film thickness (Horn et al. 1995). Furthermore, this complex includes a prominent absorption at 3570 cm−1 that was not seen in previous non-phosphorus containing ices. A similar spectral feature was seen by de Barros et al. (2015), which they assigned to dangling OH bonds. The irradiated ice is comparatively simple, with the only non-oxygen-containing bands belonging to P2H4 (1060 and 2286 cm−1), ν(PH) (2220–2300 cm−1), and δ(PH2) (1035 cm−1). The latter two features are also observed in the residue. Compared to carbon dioxide and molecular oxygen, water reacted with phosphine less readily and produced fewer oxygenated phosphorus compounds. At 100 nA irradiation, the spectrum was nearly unchanged, and even at 1000 nA the only new phosphorus/oxygen bands were small signals for ν(P=O) (1135 cm−1) and P–OH ν(OH) (2780 cm−1). However, small signals for ν(P–O) and δ(O=P–OH) could be obscured by the νL and ν2 bands of water, and ν(P–O) was visible in the residue. All of these vibrations were visible in the 5000 nA experiment, although still muted compared to the carbon dioxide ices. Missing from all irradiated ices was the P–OH ν(OH) at 2170 cm−1, although a small peak appeared in the residue at 5000 nA. Unlike the carbon dioxide and molecular oxygen residues at 5000 nA, these peaks from the water experiments indicate a low concentration of phosphonic acid and instead greater amounts of phosphoric and phosphinic acid (H3PO2). In summary, ices of phosphine with oxygen, carbon dioxide, and water each can produce, given sufficient irradiation, compounds that include a phosphorus-oxygen double bond (P=O), single bond (P–O), including to a hydroxyl group (P–OH), and the combination of these functional groups (O=P–OH). However, these signals were visible in the oxygen ices after just 100 nA irradiation, while carbon dioxide required 1000 nA and water needed the highest dose of 5000 nA for detection. These ice mixtures also contained phosphorus–hydrogen bonding that appeared comparatively more intense in the residues than they did in the irradiated ices, which suggests a large number of phosphorus–oxygen compounds were able to sublime from the ice while more phosphorus–hydrogen compounds remained in the residue. These results help to show possible barriers in the synthesis of the phosphonic acid group within water ice, which is the major component of interstellar ices.

Figure 15. Infrared spectra of ice V at 10 K taken before (top) and after (middle) irradiation with a 100 nA irradiation current for one hour. The remaining residue at 300 K after sublimation of the irradiated ice is shown in the bottom spectrum. The original spectrum (gray) is deconvoluted, showing peaks assigned to phosphine (pink) and water (blue), and new peaks from irradiation (cyan), which sum to create a peak-fitted spectrum (red dashed). The v1 and v3 vibration for water are labeled as "O" (out-of-phase with neighboring molecules), "I" (in-phase with neighboring molecules), "L" (longitudinal), and "T" (transversal).
Download figure:
Standard image High-resolution image
Figure 16. Infrared spectra of ice V at 10 K taken before (top) and after (middle) irradiation with a 1000 nA irradiation current for one hour. The remaining residue at 300 K after sublimation of the irradiated ice is shown in the bottom spectrum. The original spectrum (gray) is deconvoluted, showing peaks assigned to phosphine (pink) and water (blue), and new peaks from irradiation (cyan), which sum to create a peak-fitted spectrum (red dashed). The v1 and v3 vibration for water are labeled as "O" (out-of-phase with neighboring molecules), "I" (in-phase with neighboring molecules), "L" (longitudinal), and "T" (transversal).
Download figure:
Standard image High-resolution image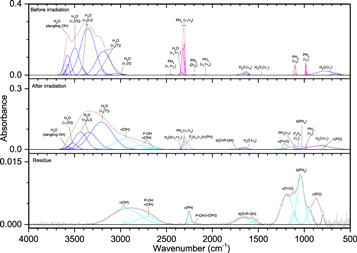
Figure 17. Infrared spectra of ice V at 10 K taken before (top) and after (middle) irradiation with a 5000 nA irradiation current for one hour. The remaining residue at 300 K after sublimation of the irradiated ice is shown in the bottom spectrum. The original spectrum (gray) is deconvoluted showing peaks assigned to phosphine (pink) and water (blue), and new peaks from irradiation (cyan), which sum to create a peak-fitted spectrum (red dashed). The v1 and v3 vibration for water are labeled as "O" (out-of-phase with neighboring molecules), "I" (in-phase with neighboring molecules), "L" (longitudinal), and "T" (transversal).
Download figure:
Standard image High-resolution imageTable 8. Infrared Absorption Assignments for Ice V at 10 K, the Products of Irradiation at Different Doses, and the Residue that Remained at 300 K after the Ice Fully Sublimed
| Pristine Ice, before Irradiation (10 K) | |||
|---|---|---|---|
| Assignment | Compound | Position (cm−1) | References |
| vL | H2O | 650–800 | (1) |
| v2 | PH3 | 985 | (2) |
| v4 | PH3 | 1101 | (2) |
| 2vL | H2O | 1465 | (1) |
| v2 | H2O | 1600–1670 | (1) |
| v2 + v4 | PH3 | 2075 | (2) |
| 2v4 | PH3 | 2190, 2205 | (2) |
| v1/v3 | PH3 | 2300, 2308, 2321 | (2) |
| v2 + vL | H2O | 2335 | (1) |
| v1 + vL | PH3 | 2431, 2471 | (1) |
| v1 (in phase) | H2O | 3050 | (1) |
| v3 (transversal) | H2O | 3150–3250 | (1) |
| v3 (longitudinal) | H2O | 3320–3420 | (1) |
| v1 (out of phase) | H2O | 3450–3520 | (1) |
| dangling OH | H2O | 3550–3620 | (3) |
| 2v1 | PH3 | 4532 | (1) |
| v1 + v3 | PH3 | 4554 | (1) |
| New Peaks after Irradiation (10 K) | ||||
|---|---|---|---|---|
| Assignment | Compound | Position (cm−1) | Irradiation (nA) | References |
| v(P–O) | 790 | 5000 | (4) | |
| δ(PH2) | 1025 | 5000 | (4) | |
| v3 | P2H4 | 1060 | 1000, 5000 | (5) |
| v(P=O) | 1140–1250 | 1000, 5000 | (4) | |
| δ(O=P–OH) | 1714 | 5000 | (4) | |
| v1 | P2H4 | 2286 | 1000, 5000 | (4) |
| v(PH) | 2286 | 100, 1000, 5000 | (5) | |
| P–OH v(OH) | 2650–2780 | 1000, 5000 | (4) | |
| v(OH) | 2900–2950 | 100, 1000, 5000 | (4) | |
| Residue (300 K) | |||
|---|---|---|---|
| Assignment | Position (cm−1) | Irradiation (nA) | References |
| v(P–O) | 790–1000 | 1000, 5000 | (4) |
| δ(PH2) | 1040 | 1000, 5000 | (4) |
| v(P=O) | 1110–1250 | 1000, 5000 | (4) |
| δ(O=P–OH) | 1540–1670 | 5000 | (4) |
| P–OH v(OH) | 2220 | 5000 | (4) |
| v(PH) | 2220–2250 | 1000, 5000 | (4) |
| P–OH v(OH) | 2710 | 5000 | (4) |
| v(OH) | 2950–3275 | 1000, 5000 | (4) |
Note. vL defines the lattice mode.
References. (1) Hagen et al. (1981); (2) Turner et al. (2015); (3) de Barros et al. (2015); (4) Socrates (2004); (5) Durig et al. (1996).
Download table as: ASCIITypeset image
3.6. Ice VI [PH3/CO2/CH4]
Ice VI (Figures 18–20, Table 9) represents the first of three ice mixtures capable of forming an alkylphosphonic acid. Previous ices have shown that phosphine with methane is capable of forming the phosphorus–carbon bond, while phosphine with carbon dioxide results in functional groups present in a phosphonic acid. The unirradiated ice contained the expected peaks seen in ices II and IV, and the spectrum after 100 nA irradiated was fairly unremarkable with only small peaks for CO (2137 cm−1), ν(PH) (2330 cm−1), δ(O=P–OH) (1700 cm−1), and ν(POC) (800 cm−1), the latter, which also remained in the residue. Increasing the current to 1000 nA provided more detailed results with the only compounds detected being CO, C2H6 (ν10, ν11, and ν12), and H2O (ν2 and ν3). The phosphorus–carbon bond was established by bands from ν(PC) (722 cm−1), P–CH3 ρ(CH3) (875 cm−1), and P–CH3 δas(CH3) (1419 cm−1), with only the latter remaining in the residue. Absorptions of phosphorus and oxygen include ν(P–O) (955 cm−1), ν(P=O) (1130–1360 cm−1), δ(O=P–OH) (1720 cm−1), and also in the residue P–OH ν(OH) (2790 cm−1). This residue also contains carbon–hydrogen stretching at 2895 cm−1 (CH3 νs(CH)) and 2977 cm−1 (CH3 νas(CH)) and phosphorus–hydrogen vibrations at 1050 cm−1 (δ(PH2)) and 2267 cm−1 (ν(PH)). The 5000 nA experiment shows similar and more intense results. Additional peaks for C2H6 (ν5 and ν6) appeared as did the P–OH ν(OH) stretch at 2130 cm−1, although the broad H2O νL band now masks many low frequency peaks. Notably, this is the first ice mixture in which diphosphine was not identified, which suggests that phosphine is sufficiently diluted by other compounds that it cannot react with itself to form a phosphorus–phosphorus bond. The residue spectrum has two new peaks of note: first is P–CH3 (δs(CH3)) at 1302 cm−1 and the second is P–O–CH3 (δ(CH3)) at 1456 cm−1, which along with the ν(P–O–C) stretching seen at 1000 nA shows the potential for this ice mixture to form methyl ester phosphorus oxoacids. The degree to which these bands exist in the irradiated ice is hidden by CH4 (ν4) and C2H6 (ν11), respectively. Also, the residue spectrum lacks the P–OH ν(OH) stretch at 2130 cm−1, which indicates the residue has a higher concentration of phosphoric acid.

Figure 18. Infrared spectra of ice VI at 10 K taken before (top) and after (middle) irradiation with a 100 nA irradiation current for one hour. The remaining residue at 300 K after sublimation of the irradiated ice is shown in the bottom spectrum. The original spectrum (gray) is deconvoluted showing peaks assigned to phosphine (pink), carbon dioxide (blue), and methane (green), and new peaks from irradiation (cyan), which sum to create a peak-fitted spectrum (red dashed).
Download figure:
Standard image High-resolution image
Figure 19. Infrared spectra of VI ice at 10 K taken before (top) and after (middle) irradiation with a 1000 nA irradiation current for one hour. The remaining residue at 300 K after sublimation of the irradiated ice is shown in the bottom spectrum. The original spectrum (gray) is deconvoluted showing peaks assigned to phosphine (pink), carbon dioxide (blue), and methane (green), and new peaks from irradiation (cyan), which sum to create a peak-fitted spectrum (red dashed). The inset expands low-intensity regions of the spectrum. The v3 vibration for water is labeled "L" for longitudinal.
Download figure:
Standard image High-resolution image
Figure 20. Infrared spectra of VI ice at 10 K taken before (top) and after (middle) irradiation with 5000 nA irradiation current for one hour. The remaining residue at 300 K after sublimation of the irradiated ice is shown in the bottom spectrum. The original spectrum (gray) is deconvoluted showing peaks assigned to phosphine (pink), carbon dioxide (blue), and methane (green), and new peaks from irradiation (cyan), which sum to create a peak-fitted spectrum (red dashed). The inset expands low-intensity regions of the spectrum. The inset expands low-intensity regions of the spectrum. The v3 vibrations for water are labeled "L" for longitudinal and "T" for transversal.
Download figure:
Standard image High-resolution imageTable 9. Infrared Absorption Assignments for Ice VI at 10 K, the Products of Irradiation at Different Doses, and the Residue that Remained at 300 K after the Ice Fully Sublimed
| Pristine Ice, before Irradiation (10 K) | |||
|---|---|---|---|
| Assignment | Compound | Position (cm−1) | References |
| v2 | CO2 | 665 | (1) |
| v2 | PH3 | 986 | (2) |
| v4 | PH3 | 1103 | (2) |
| v4 | CH4 | 1300 | (3) |
| v2 | CH4 | 1530 | (3) |
| v2 + v4 | PH3 | 2080 | (2) |
| 2v4 | PH3 | 2203 | (2) |
| v3 | 13CO2 | 2274 | (1) |
| v1/v3 | PH3 | 2309, 2316 | (2) |
| v3 | CO2 | 2325–2365 | (1) |
| v1 + vL | PH3 | 2435 | (2) |
| v2 + v4 | CH4 | 2812 | (3) |
| 3v2 | PH3 | 2901 | (2) |
| v3 | CH4 | 3005 | (3) |
| v3 + vL | CH4 | 3070 | (3) |
| v1 + v4 | PH3 | 3407 | (2) |
| 2v2 + v3 | CO2 | 3588 | (1) |
| v1 + v3 | CO2 | 3694 | (1) |
| v1 + v4 | CH4 | 4200 | (3) |
| v3 + v4 | CH4 | 4296 | (3) |
| New Peaks after Irradiation (10 K) | ||||
|---|---|---|---|---|
| Assignment | Compound | Position (cm−1) | Irradiation (nA) | References |
| v(PC) | 726 | 1000 | (4) | |
| v(P–O–C) | 790 | 100, 1000 | (4) | |
| v12 | C2H6 | 814 | 1000 | (5) |
| vL | H2O | 830 | 5000 | (6) |
| P–CH3 ρ(CH3) | 875 | 1000, 5000 | (4) | |
| v(P–O) | 950–975 | 1000, 5000 | (4) | |
| δ(PH2) | 1030 | 5000 | (4) | |
| v(P=O) | 1140–1350 | 1000, 5000 | (4) | |
| v6 | C2H6 | 1367 | 5000 | (5) |
| P–CH3 δas(CH3) | 1416 | 1000, 5000 | (4) | |
| v11 | C2H6 | 1460 | 1000, 5000 | (5) |
| v2 | H2O | 1640–1680 | 1000, 5000 | (6) |
| δ(O=P–OH) | 1710 | 100, 1000, 5000 | (4) | |
| P–OH v(OH) | 2120 | 5000 | (4) | |
| v1 | CO | 2137 | 100, 1000, 5000 | (1) |
| v(PH) | 2250–2350 | 100, 1000, 5000 | (4) | |
| v5 | C2H6 | 2877 | 5000 | (5) |
| v(OH) | 2910 | 5000 | (4) | |
| v10 | C2H6 | 2973 | 1000, 5000 | (5) |
| v3(transversal) | H2O | 3210 | 5000 | (6) |
| v3(longitudinal) | H2O | 3360–3410 | 1000, 5000 | (6) |
| Residue (300 K) | |||
|---|---|---|---|
| Assignment | Position (cm−1) | Irradiation (nA) | References |
| v(P–O–C) | 810 | 100 | (4) |
| P–CH3 ρ(CH3) | 880 | 5000 | (4) |
| v(P–O) | 940–1010 | 1000, 5000 | (4) |
| δ(PH2) | 1045 | 1000 | (4) |
| v(P=O) | 1170–1250 | 1000, 5000 | (4) |
| P–CH3 δs(CH3) | 1300 | 5000 | (4) |
| P–CH3 δas(CH3) | 1410 | 1000, 5000 | (4) |
| P–O–CH3 δas(CH3) | 1456 | 5000 | (4) |
| δ(O=P–OH) | 1640–1720 | 1000, 5000 | (4) |
| v(PH) | 2250–2400 | 5000 | (4) |
| P–OH v(OH) | 2630–2820 | 1000, 5000 | (4) |
| vs(CH2) | 2968 | 5000 | (4) |
| vs(CH3) | 2895 | 1000 | (4) |
| vas(CH2) | 2910 | 5000 | (4) |
| vas(CH3) | 2975 | 1000, 5000 | (4) |
| v(OH) | 2900–3200 | 1000, 5000 | (4) |
Note. vL defines the lattice mode.
References. (1) Bennett et al. (2004); (2) Turner et al. (2015); (3) Turner et al. (2016); (4) Socrates (2004); (5) Abplanalp & Kaiser (2016); (6) Hagen et al. (1981).
3.7. Ice VII [PH3/CO2/CH4/C2H6/C3H8/C4H10]
The alkylphosphonic acids discovered in the Murchison meteorite not only included methylphosphonic acid but also contained C2 to C4 alkyl side chains. Because of this, the C2 to C4 alkanes—ethane (C2H6), propane (C3H8), and butane (C4H10)—where added to the mixture of ice VI to study its potential to form each of the alkylphosphonic acids (Figures 21–23, Table 10). These new alkanes are well-represented in the unirradiated ice with fundamentals for ethane (ν5 (2878 cm−1), ν6 (1370 cm−1), ν10 (2970 cm−1), ν11 (1464 cm−1), and ν12 (820 cm−1)), propane (ν1/ν2 (2956 cm−1), ν3 (2871 cm−1), ν4 (1471 cm−1), ν6 (1383 cm−1), ν18 (1370 cm−1, with ethane ν6), and ν25 (748 cm−1)), and butane (ν12 (2956 cm−1, with propane ν1/ν2), ν13 (2922 cm−1), ν14 (1460 cm−1), ν17 (728 cm−1), ν29 (2860 cm−1), and ν32 (1377 cm−1)) observed along with numerous overtones and combination bands. Despite the complex mixture, the irradiation products were straightforward. Water (νL, ν1, ν2, and ν3) and CO were observed as expected, beginning with 100 nA, and like ice VI the residue of the 100 nA experiment was minimal. The phosphorus-oxygen double bond was already seen at 100 nA (ν(P=O) at 1170 cm−1 and δ(O=P=OH) at 1700 cm−1), and although diphosphine was not detected again at any dose, ν(PH) appears at 100 nA irradiation. After 1000 and 5000 nA irradiation the residue spectra showed additional signs of interactions between phosphorus and carbon. The ν(PC) (770 cm−1), P–CH3 δs(CH3) (1300 cm−1), and P–CH2R δ(CH2) (1413 cm−1, where R=alkyl group or H) vibrations confirm the phosphorus–carbon bond, while P–O–CH3 δ(CH3) (1455 cm−1) and P–O–C2H5 δ(CH3) (1373 cm−1) not only demonstrate methoxy linkages to phosphorus but also that larger alkanes, such as in this case the ethyl group, can be incorporated in alkoxy functional groups with phosphorus. Also of note in the 5000 nA irradiated ice is the detection of ethylene, first seen in ice II, at 1434 cm−1 (ν12), 3068 cm−1 (ν2 + ν12), and 3086 cm−1 (ν9). Similar to ice VI, ν(P–O) (970 cm−1) and P–OH ν(OH) (2650 cm−1) were detected while only a scarce amount of P–OH ν(OH) (2180 cm−1) was observed—none of which remained in residues. Finally, as might be expected from the alkane mixture, the residues show a complex of carbon–hydrogen stretches from 2850 to 2990 cm−1.

Figure 21. Infrared spectra of ice VII at 10 K taken before (top) and after (middle) irradiation with a 100 nA irradiation current for one hour. The remaining residue at 300 K after sublimation of the irradiated ice is shown in the bottom spectrum. The original spectrum (gray) is deconvoluted showing peaks assigned to phosphine (pink), carbon dioxide (blue), methane (green), ethane (black), propane (violet), and butane (orange), and new peaks from irradiation (cyan), which sum to create a peak-fitted spectrum (red dashed). The insets expand low-intensity regions of the spectrum. The v1 and v3 vibration for water are labeled as "O" (out-of-phase with neighboring molecules), "I" (in-phase with neighboring molecules), "L" (longitudinal), and "T" (transversal).
Download figure:
Standard image High-resolution image
Figure 22. Infrared spectra of ice VII at 10 K taken before (top) and after (middle) irradiation with a 1000 nA irradiation current for one hour. The remaining residue at 300 K after sublimation of the irradiated ice is shown in the bottom spectrum. The original spectrum (gray) is deconvoluted showing peaks assigned to phosphine (pink), carbon dioxide (blue), methane (green), ethane (black), propane (violet), and butane (orange), and new peaks from irradiation (cyan), which sum to create a peak-fitted spectrum (red dashed). The insets expand low-intensity regions of the spectrum. The v1 and v3 vibration for water are labeled as "I" (in-phase with neighboring molecules), "L" (longitudinal), and "T" (transversal).
Download figure:
Standard image High-resolution image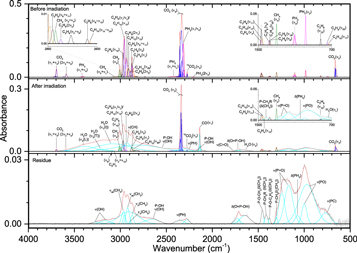
Figure 23. Infrared spectra of ice VII at 10 K taken before (top) and after (middle) irradiation with a 5000 nA irradiation current for one hour. The remaining residue at 300 K after sublimation of the irradiated ice is shown in the bottom spectrum. The original spectrum (gray) is deconvoluted showing peaks assigned to phosphine (pink), carbon dioxide (blue), methane (green), ethane (black), propane (violet), and butane (orange), and new peaks from irradiation (cyan), which sum to create a peak-fitted spectrum (red dashed). The insets expand low-intensity regions of the spectrum. The v1 and v3 vibration for water are labeled as "I" (in-phase with neighboring molecules), "L" (longitudinal), and "T" (transversal).
Download figure:
Standard image High-resolution imageTable 10. Infrared Absorption Assignments for Ice VII at 10 K, the Products of Irradiation at Different Doses, and the Residue that Remained at 300 K after the Ice Fully Sublimed
| Pristine Ice, before Irradiation (10 K) | |||
|---|---|---|---|
| Assignment | Compound | Position (cm−1) | References |
| v2 | CO2 | 663 | (1) |
| v17 | C4H10 | 728 | (2) |
| v25 | C3H8 | 748 | (2) |
| v12 | C2H6 | 820 | (3) |
| v2 | PH3 | 986 | (4) |
| v4 | PH3 | 1103 | (4) |
| v4 | CH4 | 1300 | (5) |
| v6 | C2H6 | 1370 | (3) |
| v18 | C3H8 | 1370 | (2) |
| v32 | C4H10 | 1377 | (2) |
| v6 | C3H8 | 1383 | (2) |
| v14 | C4H10 | 1460 | (2) |
| v11 | C2H6 | 1464 | (3) |
| v4 | C3H8 | 1471 | (2) |
| 2v4 | PH3 | 2203 | (4) |
| v3 | 13CO2 | 2274 | (1) |
| v1/v3 | PH3 | 2310, 2317 | (4) |
| v3 | CO2 | 2325–2365 | (1) |
| v1 + vL | PH3 | 2425 | (4) |
| v14 + v24 | C4H10 | 2636 | (2) |
| v8 + v12 | C2H6 | 2650 | (3) |
| v2 + v6 | C2H6 | 2733 | (3) |
| 2v6 | C3H8 | 2784 | (2) |
| v2 + v4 | CH4 | 2812 | (5) |
| v6 + v11 | C2H6 | 2826 | (3) |
| v29 | C4H10 | 2860 | (2) |
| v3 | C3H8 | 2871 | (2) |
| v5 | C2H6 | 2878 | (3) |
| 2v5 | C3H8 | 2892 | (2) |
| v8 + v11 | C2H6 | 2912 | (3) |
| v13 | C4H10 | 2922 | (2) |
| 2v4 | C3H8 | 2934 | (2) |
| v1/v2 | C3H8 | 2956 | (2) |
| v12 | C4H10 | 2956 | |
| v10 | C2H6 | 2970 | (3) |
| v3 | CH4 | 3005 | (5) |
| v3 + vL | CH4 | 3030 | (5) |
| v1 + v4 | PH3 | 3407 | (4) |
| 2v2 + v3 | CO2 | 3588 | (1) |
| v1 + v3 | CO2 | 3694 | (1) |
| see Table 3 for complete list | 4000–4600 | (2) | |
| New Peaks after Irradiation (10 K) | ||||
|---|---|---|---|---|
| Assignment | Compound | Position (cm−1) | Irradiation (nA) | References |
| vL | H2O | 730–815 | 1000, 5000 | (6) |
| v(P–O) | 915–990 | 1000, 5000 | (7) | |
| δ(PH2) | 1042 | 5000 | (7) | |
| v(P=O) | 1100–1250 | 100, 1000, 5000 | (7) | |
| P–CH2Rδ(CH2) | 1415 | 1000, 5000 | (7) | |
| v12 | C2H4 | 1436 | 5000 | |
| v2 | H2O | 1645 | 1000, 5000 | (6) |
| δ(O=P–OH) | 1710 | 100, 1000, 5000 | (7) | |
| v(C=O) | 1770 | 1000, 5000 | (7) | |
| v1 | CO | 2138 | 100, 1000, 5000 | (1) |
| P–OH v(OH) | 2180 | 5000 | ||
| v(PH) | 2250–2350 | 100, 1000, 5000 | (7) | |
| P–OH v(OH) | 2500–2900 | 1000, 5000 | (7) | |
| v(OH) | 2855 | 1000 | (7) | |
| v(CH) | 2830–3000 | 100, 1000, 5000 | (7) | |
| v2 + v12 | C2H4 | 3066 | 5000 | (8) |
| v1 (in phase) | H2O | 3070 | 100, 1000, 5000 | (6) |
| v9 | C2H4 | 3087 | 5000 | (8) |
| v3 (transversal) | H2O | 3230 | 100, 1000, 5000 | (6) |
| v3 (longitudinal) | H2O | 3405 | 100, 1000, 5000 | (6) |
| v1 (out of phase) | H2O | 3470 | 100 | (6) |
| Residue (300 K) | |||
|---|---|---|---|
| Assignment | Position (cm−1) | Irradiation (nA) | References |
| v(PC) | 765–795 | 1000, 5000 | (7) |
| v(P–O) | 950–1010 | 1000, 5000 | (7) |
| δ(PH2) | 1070 | 5000 | (7) |
| v(P=O) | 1150–1250 | 1000, 5000 | (7) |
| P–CH3 δs(CH3) | 1300 | 5000 | (7) |
| P–O–C2H5 δ(CH3) | 1375 | 5000 | (7) |
| P–CH2R δ(CH2) | 1410 | 5000 | (7) |
| P–O–CH3 δ(CH3) | 1456 | 1000, 5000 | (7) |
| δ(O=P–OH) | 1640–1720 | 1000, 5000 | (7) |
| v(PH) | 2270–2350 | 1000, 5000 | (7) |
| P–OH v(OH) | 2650 | 5000 | (7) |
| vs(CH2) | 2968 | 1000, 5000 | (7) |
| vs(CH3) | 2895 | 1000, 5000 | (7) |
| vas(CH2) | 2918 | 1000, 5000 | (7) |
| vas(CH3) | 2970 | 1000, 5000 | (7) |
| v(OH) | 2900–3450 | 1000, 5000 | (7) |
Note. vL defines the lattice mode.
References. (1) Bennett et al. (2004); (2) this work with assignments from Shimanouchi (1972); (3) Abplanalp & Kaiser (2016); (4) Turner et al. (2015); (5) Turner et al. (2016); (6) Hagen et al. (1981); (7) Socrates (2004); (8) Abplanalp & Kaiser (2017).
3.8. Ice VIII [PH3/H2O/CH4/C2H6/C3H8/C4H10]
The final ice mixture replaces carbon dioxide in ice VII with water as the oxygen source (Figures 24–26, Table 11). The unirradiated ice is as reported in previous ice mixtures, and although the phosphorus–hydrogen stretching area is no longer overlapped with bands from carbon dioxide, it is immediately evident that small, low frequency bands are partially obscured by H2O (νL) and that oxygen–hydrogen stretching will complicate the nearby overlapping carbon–hydrogen stretching region. Diphosphine, which was absent in the CO2 ices VI and VII, returns at all irradiation doses, and this marks the only difference seen in the 100 nA ice other than a small amount of P–OH ν(OH) near 2740 cm−1. The residue at 100 nA is more notable than in ices VI and VII and includes phosphorus–hydrogen, phosphorus–oxygen (perhaps as P–O–C), oxygen–hydrogen, and carbon–hydrogen bonds. At 1000 nA, the irradiated ice contains two additional peaks, demonstrating that the phosphorus–carbon bond is formed: CH3PH2 ω(CH3) at 985 cm−1 and P–CH2R (where R is an alkyl group or H) δ(CH2) at 1414 cm−1. The residue includes oxygen–hydrogen stretches, including that for P–OH at 2640 cm−1, as well as ν(PO), ν(P=O), and δ(O=P–OH). Besides P-H and C-H stretches, the residue also shows P–CH2R δ(CH2) and P–O–CH3 δ(CH3) at 1452 cm−1. A small peak at 2140 cm−1, which is normally associated with the broad P–OH v(OH) vibration, appears in the 5000 nA irradiated ice and likely belongs to CO, and this peak does not remain in the residue, leading again to the conclusion that phosphoric acid contributes mostly to the ν(OH) stretching. The P–CH3 ρ(CH3) vibration (880 cm−1) and ν(PH) stretch of CH3PH2 (2308 cm−1) can also be seen in this ice, as well as the v12 (1438 cm−1), v2 + v12 (3066 cm−1), and v9 (3084 cm−1) bands of ethylene. The residue at 5000 nA shows P–O–C2H5 (1374 cm−1), which was not seen at lower doses but again shows the capability for multi-carbon alkyl groups to create compounds with phosphorus and oxygen.
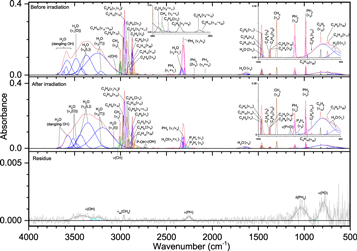
Figure 24. Infrared spectra of ice VIII at 10 K taken before (top) and after (middle) irradiation with a 100 nA irradiation current for one hour. The remaining residue at 300 K after sublimation of the irradiated ice is shown in the bottom spectrum. The original spectrum (gray) is deconvoluted showing peaks assigned to phosphine (pink), water (blue), methane (green), ethane (black), propane (violet), and butane (orange), and new peaks from irradiation (cyan), which sum to create a peak-fitted spectrum (red dashed). The insets expand low-intensity regions of the spectrum. The v1 and v3 vibration for water are labeled as "O" (out-of-phase with neighboring molecules), "I" (in-phase with neighboring molecules), "L" (longitudinal), and "T" (transversal).
Download figure:
Standard image High-resolution image
Figure 25. Infrared spectra ice VIII at 10 K taken before (top) and after (middle) irradiation with a 1000 nA irradiation current for one hour. The remaining residue at 300 K after sublimation of the irradiated ice is shown in the bottom spectrum. The original spectrum (gray) is deconvoluted showing peaks assigned to phosphine (pink), water (blue), methane (green), ethane (black), propane (violet), and butane (orange), and new peaks from irradiation (cyan), which sum to create a peak-fitted spectrum (red dashed). The insets expand low-intensity regions of the spectrum. The v1 and v3 vibration for water are labeled as "O" (out-of-phase with neighboring molecules), "I" (in-phase with neighboring molecules), "L" (longitudinal), and "T" (transversal).
Download figure:
Standard image High-resolution image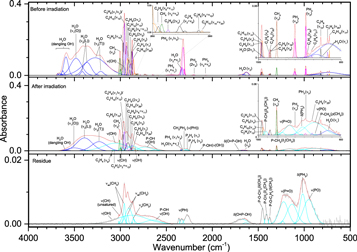
Figure 26. Infrared spectra of ice VIII at 10 K taken before (top) and after (middle) irradiation with a 5000 nA irradiation current for one hour. The remaining residue at 300 K after sublimation of the irradiated ice is shown in the bottom spectrum. The original spectrum (gray) is deconvoluted showing peaks assigned to phosphine (pink), water (blue), methane (green), ethane (black), propane (violet), and butane (orange), and new peaks from irradiation (cyan), which sum to create a peak-fitted spectrum (red dashed). The insets expand low-intensity regions of the spectrum. The v1 and v3 vibration for water are labeled as "O" (out-of-phase with neighboring molecules), "L" (longitudinal), and "T" (transversal).
Download figure:
Standard image High-resolution imageTable 11. Infrared Absorption Assignments for Ice VIII at 10 K, the Products of Irradiation at Different Doses, and the Residue that Remained at 300 K after the Ice Fully Sublimed
| Pristine Ice, before Irradiation (10 K) | |||
|---|---|---|---|
| Assignment | Compound | Position (cm−1) | References |
| vL | H2O | 600–900 | (1) |
| v17 | C4H10 | 733 | (2) |
| v25 | C3H8 | 747 | (2) |
| v12 | C2H6 | 819 | (3) |
| v21 | C3H8 | 918 | (2) |
| v35 | C4H10 | 962 | (2) |
| v2 | PH3 | 986 | (4) |
| v4 | PH3 | 1103 | (4) |
| v4 | CH4 | 1300 | (5) |
| v6 | C2H6 | 1368 | (3) |
| v18 | C3H8 | 1368 | (2) |
| v32 | C4H10 | 1375 | (2) |
| v6 | C3H8 | 1383 | (2) |
| 2vL | H2O | 1451 | (1) |
| v14 | C4H10 | 1461 | (2) |
| v11 | C2H6 | 1463 | (3) |
| v4 | C3H8 | 1470 | (2) |
| v2 | H2O | 1630–1670 | (1) |
| v2 + v4 | PH3 | 2078 | (4) |
| 2v4 | PH3 | 2203 | (4) |
| v1/v3 | PH3 | 2310, 2318 | (4) |
| v2 + vL | H2O | 2333 | (1) |
| v1 + vL | PH3 | 2450 | (4) |
| v14 + v24 | C4H10 | 2636 | (2) |
| v8 + v12 | C2H6 | 2650 | (3) |
| v2 + v6 | C2H6 | 2733 | (3) |
| 2v6 | C3H8 | 2784 | (2) |
| v2 + v4 | CH4 | 2812 | (5) |
| v6 + v11 | C2H6 | 2825 | (3) |
| v(CH) | various | 2850–3000 | (6) |
| v29 | C4H10 | 2860 | (2) |
| v3 | C3H8 | 2871 | (2) |
| v5 | C2H6 | 2878 | (3) |
| 2v5 | C3H8 | 2892 | (2) |
| v8 + v11 | C2H6 | 2912 | (3) |
| v13 | C4H10 | 2922 | (2) |
| 2v4 | C3H8 | 2934 | (2) |
| v1/v2 | C3H8 | 2955 | (2) |
| v12 | C4H10 | 2955 | (2) |
| v10 | C2H6 | 2969 | (2) |
| v3 | CH4 | 3004 | (5) |
| v1 (in phase) | H2O | 3085 | (1) |
| v3 (transversal) | H2O | 3280–3250 | (1) |
| v3 (longitudinal) | H2O | 3350–3420 | (1) |
| v1 (out of phase) | H2O | 3480–3510 | (1) |
| dangling OH | H2O | 3550–3700 | (7) |
| see Table 3 for complete list | 4000–4600 | (2) | |
| New Peaks after Irradiation (10 K) | ||||
|---|---|---|---|---|
| Assignment | Compound | Position (cm−1) | Irradiation (nA) | References |
| P–CH3 ρ(CH3) | 880 | 5000 | (6) | |
| v(P–O) | 886 | 5000 | (6) | |
| ω(CH3) | CH3PH2 | 984 | 1000 | (8) |
| δ(PH2) | 1025 | 5000 | (6) | |
| v3 | P2H4 | 1073 | 100, 1000 | (9) |
| v(P=O) | 1130–1230 | 100, 1000, 5000 | (6) | |
| P–CH2R δ(CH2) | 1415 | 1000, 5000 | (6) | |
| v12 | C2H4 | 1438 | ||
| δ(O=P–OH) | 1704 | 5000 | (6) | |
| v1 | CO | 2140 | 5000 | (8) |
| v2 | P2H4 | 2260 | 100, 5000 | (10) |
| v1 | P2H4 | 2290 | 100, 5000 | (10) |
| v(PH) | CH3PH2 | 2303 | 5000 | (9) |
| v(PH) | 2250–2350 | 1000 | (6) | |
| P–OH v(OH) | 2600–2800 | 100, 1000, 5000 | (6) | |
| v(OH) | 2850–3100 | 5000 | (6) | |
| v(CH) | 2850–3000 | 1000, 5000 | (6) | |
| v2 + v12 | C2H4 | 3066 | 5000 | (11) |
| v9 | C2H4 | 3087 | 5000 | (11) |
| Residue (300 K) | |||
|---|---|---|---|
| Assignment | Position (cm−1) | Irradiation (nA) | References |
| v(P–O) | 790–980 | 100, 1000, 5000 | (6) |
| δ(PH2) | 1015–1030 | 100, 5000 | (6) |
| v(P=O) | 1100–1250 | 1000, 5000 | (6) |
| P–O–C2H5 δ(CH3) | 1375 | 5000 | (6) |
| P–CH3 δas(CH3) | 1410 | 1000, 5000 | (6) |
| P–O–CH3 δas(CH3) | 1456 | 1000, 5000 | (6) |
| δ(O=P–OH) | 1650–1670 | 1000, 5000 | (6) |
| v(PH) | 2250–2350 | 100, 1000, 5000 | (6) |
| P–OH v(OH) | 2650 | 1000, 5000 | (6) |
| vs(CH2) | 2968 | 1000, 5000 | (6) |
| vas(CH2) | 2911 | 1000, 5000 | (6) |
| vas(CH3) | 2965 | 100, 1000, 5000 | (6) |
| v(CH) (unsaturated) | 3015 | 1000, 5000 | (6) |
| v(OH) | 2800–3450 | 100, 1000, 5000 | (6) |
Note. vL defines the lattice mode.
References. (1) Hagen et al. (1981); (2) this work, see Table 3; (3) Abplanalp & Kaiser (2016); (4) Turner et al. (2015); (5) Turner et al. (2016); (6) Socrates (2004); (7) de Barros et al. (2015); (8) Bennett et al. (2004); (9) Kim & Zeroka (2001); (10) Durig et al. (1996); (11) Abplanalp & Kaiser (2017).
3.9. Summary
Irradiated phosphine ices regularly form, with a few exceptions, diphosphine and residues with ν(PH) and δ(PH2). The reaction of phosphine with methane and higher order alkanes can be seen with the low-frequency phosphorus–carbon bond, the P–CH3 ρ(CH3) vibration, the P–CH2R δ(CH2) band, where R can be an alkyl group or hydrogen (if hydrogen, this band would be labeled P–CH3 δas(CH3) and occurs at the same frequency), the P–CH3 δs(CH3), and the vibrations of the compound methylphosphine (CH3PH2). The addition of oxygen to mixture via carbon dioxide, water, or dioxygen often results in residues with ν(P–O), ν(P=O), and δ(O=P–OH), and two bands for P–OH ν(OH). When an alkane is present, P–O–CH3 δ(CH3) and P–O–C2H5 δ(CH3) were also observed. This systematic study of the irradiation of interstellar ice analogs, from simple to complex, shows that not only can phosphine readily react to interstellar ices, but it is in fact capable of producing all of the necessary bonding to produce alkylphosphonic acids. In conclusion, all functional groups necessary to form methylphosphonic acid are present (Figure 27), although whether they are present simultaneously in the same molecule cannot be ascertained using only infrared spectroscopy. However, more sensitive experiments are being designed to extract the true identity of these residues and the confirmation of alkylphosphonic acids in phosphine-containing interstellar ices.

Figure 27. Structure of methylphosphonic acid, indicating the functional groups observed in the irradiated ice samples and their residues. These functional groups include (1) δ(O=P–OH) (1540–1720 cm−1), (2) v(P=O) (1100–1300 cm−1), (3) v(P–O) (800–1050 cm−1), (4) P–OH v(OH) (2100–2220 cm−1, 2600–2800 cm−1), (5) CH3 v(CH) (2850–3000 cm−1), and (6) P–CH3 δ(CH3) (1300, 1410 cm−1) and P–CH3 ρ(CH3) (875 cm−1). Thus, the infrared spectra indicate that each functional group of methylphosphonic acid is present.
Download figure:
Standard image High-resolution image
4. Astrophysical Implications
We would like to discuss these findings within the context of the Origins of Life theme. Phosphorus in its highest oxidation state P(V), as present in the phosphate moiety ( ), plays a central role in contemporary terrestrial biochemistry (Pasek 2008). The transmission of genetic information through self-replication (DNA/RNA), biochemical energy transfer processes (ATP/ADP), cell bilayer materials (phospholipids), and structural building blocks like hydroxyapatite in teeth and bones all exploit the phosphate group (
 ). To this extent, our results provide evidence that the irradiation of our phosphine-rich ice mixtures can lead to P–O–C bond linkages, which are found in each non-structural biomolecule mentioned above. However, Gulick highlighted key problems with phosphates in prebiotic chemistry, citing a poor water solubility of their metal salts and slow chemical reactivity in the absence of activating chemicals (Gulick 1955). Therefore, the insolubility of phosphates in water presents a significant uncertainty in the chemistry for the origin of life. Gulick suggested that schreibersite ((Fe, Ni)3P), a minor constituent of iron–nickel meteorites (Buchwald 1977) that has been classified as one of the first phosphorus-bearing chemicals to condense from the early solar nebula (Sears 1978), could have been oxidized in the presence of water to form phosphorus-bearing acids like hypophosphorous acid (H3PO2). The resulting acids would be more soluble than phosphate minerals and hence biologically available for early life forms under anoxic reducing atmospheric conditions. Therefore, despite the dominance of the phosphate moiety in contemporary biochemistry, there is growing evidence that nature exploited lower oxidation states of phosphorus such as P(III) as found in alkylphosphonic acids during the early development of life on Earth. In fact, while most life on Earth uses P(V), P(III) compounds have been isolated from microorganisms while other microorganisms have developed the means to cleave the C–P bonds of organophosphonic acids to incorporate the phosphorus into phosphate moieties (Horsman & Zechel 2016). It is unknown if the first biomolecules maintained this P(III) oxidation state or contained fully oxidized phosphorus P(V) similar to current biomolecules. Alkylphosphonic acids are stable under the high ultraviolet flux on early Earth, so they could have been utilized as prebiotic molecules with a reduced form of phosphorus. These biomolecules may have persisted until atmospheric oxygen began increasing, thus favoring the oxidation state of P(V). But abiotic pathways to reduced forms of P(III) in alkylphosphonic acids have been difficult to ascertain (Pasek 2008).
Bryant & Kee (2006) also suggested that schreibersite might act as a precursor to phosphorus-bearing acids in the early-Earth ocean, and the authors hydrolyzed schreibersite in sulfuric acid and detected two phosphorus-bearing acids: phosphorous acid (H3PO3) and phosphoric acid (H3PO4). Schreibersite was also exposed in water ices at 77 K to ultraviolet light from a low pressure mercury arc tube in a photochemical reactor emitting mainly 254 nm and 185 nm. This experiment yielded phosphorus in more reduced oxidation states: hypophosphorous acid (H3PO2), phosphorous acid (H3PO3), as well as phosphoric acid (H3PO4). Finally, a dilute solution of sodium hypophosphite (NaH2PO2) was photolyzed in liquid water and ethanol. These results suggest that reduced organophosphorus compounds may have been formed upon photolysis in the presence of liquid water on the early Earth. Bryant et al. (2009) also proposed that phosphorus-bearing acids can be formed via electrochemistry of schreibersite. Here, schreibersite was pressed into a wafer and utilized as an anode in a galvanic cell containing an aqueous sodium chloride (NaCl) solution. The corrosion led to phosphorous acid (H3PO3) and phosphoric acid (H3PO4) at levels of a few percent. This study indicates that low-oxidation state phosphorus compounds can be formed from schreibersite in liquid water if an electric potential is present. Furthermore, Bryant et al. (2013) exposed samples of the Sikhote-Alin iron meteorite with hydrochloric acid to simulate geothermal environments such as volcanically heated water. The results indicate that the iron–nickel matrix that surrounded schreibersite was preferentially corroded and allowed the phosphorus-bearing mineral to be converted to phosphites (H2PO3−).
Pasek et al. (Pasek & Lauretta 2005; Pasek et al. 2014, 2015, 2007) proposed an aqueous corrosion of meteoritic phosphide minerals followed by a radical-mediated phosphorus–carbon coupling as a source for organic phosphorus-bearing acids. In detail, iron phosphide (Fe3P), which was used as an analog for meteoric schreibersite, was corroded under oxygen gas in an aqueous buffer solution with additions of acetic acid (CH3COOH) and ethanol (C2H5OH). The authors detected three classes of organic phosphorus-bearing acids: (i) organic acetyl phosphorus compounds [(HO)2OPCH2COOH], (ii) methylenephosphorus compounds [(HO)2OPCH2OH; (HO)2OPCH2PO(OH)2], and (iii) phosphonoformates [(HO)2OPCOOH] with molecules in brackets carrying C–P-bonds. The high concentration of phosphite ( ) in Archean carbonates (3.5 × 10⁹ years) may be explained by the meteoric delivery of schreibersite. Glycerol (C3H8O3), a common organic molecule in Murchison, was found to react with schreibersite in water to yield glycerol-phosphate—a component of phospholipids (Pasek et al. 2013).
Furthermore, de Graaf et al. investigated in laboratory experiments to what extent alkylphosphonic acids can be synthesized from phosphorous acid (H3PO3) and organic compounds, thus benefitting from the fact that in both the phosphorous acid and the prospective alkylphosphonic acids, phosphorus is in the same oxidation state, P(III), and hence no oxidation-reduction reaction needs to be considered (de Graaf et al. 1995). Aqueous solutions of phosphorous acid (H3PO3) and formaldehyde (H2CO) were photolyzed with a mercury vapor arc tube (254 nm; 185 nm) resulting in a 19% conversion to hydroxymethyl phosphonic acid (HOCH2H2PO3) and minor amounts of hydroxylethyl phosphonic acid (HOCH2CH2H2PO3). Reactions with methanol/ethanol also produced hydroxylmethyl phosphonic acid (HOCH2H2PO3) and hydroxyethyl phosphonic acid (HOCH2CH2H2PO3). Exploiting acetone (CH3COCH3) resulted in a 17% conversion to methylphosphonic acid (CH3-H2PO3). In follow-up studies, the authors prepared dilute aqueous solutions of acetylene (C2H2) in the presence of sodium phosphite (Na2HPO3) and subjected this mixture to ultraviolet light (de Graaf et al. 1997). This yielded vinylphosphonic acid (C2H3H2PO3). The authors speculated that if hydration of schreibersite yields phosphorous acid (H3PO3), and the latter is dissolved in water, organic phosphonic acids might have been formed with the help of ultraviolet radiation on early Earth.
Finally, Gorell et al. proposed an extraterrestrial route to the formation of alkylphosphonic acids involving methinophosphide (HCP) and water (Gorrell et al. 2006). Electronic structure calculations depicted that the multistep hydrolysis and oxidation processes can lead to methylphosphonic acid via hydrogen elimination pathways in an overall strongly exoergic reaction by about 400 KJ mol−1. However, the authors highlighted the existence of significant entrance barriers (classical activation energies) of at least 40 KJ mol−1. The involvement of these barriers prohibits the formation of methylphosphonic acid in liquid water, thus effectively prohibiting this reaction without the presence of "external" energy sources such as high energy photons or cosmic-ray particles. Therefore, the author proposed the formation of alkylphosphonic acids on interstellar grains exposed to high energy ionizing radiation.
To summarize, previous laboratory experiments focused essentially on the hydrolysis, photolysis, and galvanic corrosion of phosphides and an ultraviolet radiation mediated synthesis of organic phosphonic acids. These studies suggested that phosphorous acid together with organic phosphonic acids can be formed in the presence of liquid water. However, these simulation experiments failed to expose abiotic pathways leading to the formation of alkylphosphonic acids on ices of interstellar grains at astrophysically relevant temperatures of 10 K, where liquid water does not exist. On the other hand, the present laboratory investigations provided compelling evidence on the formation of key functional groups present in alkylphosphonic acids (Figure 27) by exploiting simple precursor molecules as present on interstellar grains in cold molecular clouds, which upon interaction with ionizing radiation form these key functional groups from the "bottom up" incorporating phosphorus via phosphine (PH3). These experiments revealed that oxygen sources readily react with phosphine to form both P–O and P=O bonds in all ice mixtures, while carbon–phosphorus bond coupling is more subtle and must rely on less intense peaks related to the effect of the phosphorus atom on the vibrations of, e.g., a methyl group. Future experiments shall focus on the identification of individual alkylphosphonic acids online and in situ utilizing sensitive mass spectrometry techniques, as well as ex situ analysis of the residual compounds that do not readily enter the gas phase. Furthermore, the structural isomers—molecules with the same chemical formula but different connectivity of atoms—of the subliming species should be detected. This requires the exploitation of photoionization (PI) of the neutral subliming molecules via tunable vacuum ultraviolet (VUV) based on discrete ionization potentials and detecting the ions via a reflectron time-of-flight mass spectrometer (PI-ReTOF-MS). This method has been utilized previously in space simulation experiments (Jones & Kaiser 2013; Maity et al. 2014; Abplanalp et al. 2016a, 2016b) in the analysis of complex organic molecules (COMs) formed via interaction of ionizing radiation with low temperature interstellar analog ices.
The authors would like to thank NASA for support under grant NNX16AD27G (UNTANGLING THE FORMATION OF ALKYLPHOSPHONIC ACIDS IN INTERSTELLAR ANALOG ICES).