
Abstract
Spatial structures of the ion flux to the substrate are measured in an rf ring-shaped magnetized sputtering plasma with two facing cylindrical ZnO/Al2O3 targets at various argon gas pressures of 0.13, 0.67, and 0.93 Pa. Spatial distributions of the Hall parameter and Larmor radius of electrons and ions are also discussed by using simulated values of the magnetic flux density. The magnitude of the ion flux for 0.13 and 0.67 Pa is of the order of 1020 m−2 s−1, while for 0.93 Pa it is of the order of 1021 m−2 s−1 at a fixed rf power of 20 W. The radial profile of the ion flux has a peak at the position of the ring-shaped groove near an rf electrode and then becomes uniform further away from the electrode at all gas pressures. It is found that the axial profile of the deviation from a uniform profile estimated from the radial profile of the ion flux has two decay characteristics (1st decay length of 13.9–17.5 mm and 2nd decay length of 52.6–66.7 mm) and their decay lengths decrease with increasing the gas pressure.
Export citation and abstract BibTeX RIS
1. Introduction
Transparent conductive oxide (TCO) films such as indium tin oxide (ITO) are widely used for electric wiring in photovoltaic cells and touch-panels on smart phones. Recently, an aluminium-doped zinc oxide (AZO) has been identified as an alternative material for ITO. 1)
The TCO films are prepared by magnetron plasma sputtering, 2–21) because a high-quality and high-deposition rate are attained. However, the resistivity of the AZO films deposited is not uniform at lower substrate temperature. 3) It has been reported that high-energy oxygen negative ions and neutral oxygen atoms bombard the AZO films, which causes the high resistivity to occur in the region of the closed magnetron plasma. 22,23) In the conventional magnetron sputtering, a substrate temperature higher than 350 °C is required to realize a uniform spatial distribution. However, the method cannot be applied to materials of deformation-temperatures lower than 100 °C such as flexible sheets and plastic plates whose utilization are expected for promoting the digital transformation and the internet of things. The cause of the high resistivity is plasma damage due to the impact of high-energy oxygen ions and atoms on the films as mentioned above. That is, these particles generated in the closed magnetron plasma area are directly irradiated to the films.
In order to solve the problem of the direct irradiation, a sputtering method from two facing targets 24) where the substrate is positioned at the direction of perpendicular to the targets, was developed with a DC magnetic field. In this plasma source, particles do not irradiate the films directly so that the plasma damage is reduced.
Therefore, in order to avoid the plasma damage to the AZO films, the facing target sputtering method 25–34) is widely utilized. In general, two plate targets are faced with a separation and the permanent magnets are positioned in their backsides to magnetize the plasma. The deposition rate for the facing target sputtering method is lower than that for the conventional magnetron sputtering. The reason for this process limitation is the fact that particles sputtered from the two facing targets can leave the region between the targets in multiple directions. As the substrate is located in one of these directions, only a fraction of the sputtered particles is used for deposition.
In our previous works, 29,30) a novel facing target sputtering method has been developed to improve the lower deposition rate: Two cylindrical targets are mounted in a ring-shaped hollow groove of an aluminum disk driven by an rf voltage of 13.56 MHz. Thus, our facing target system has an only one opening area. Thus, the particles sputtered from the two targets are reflected at the bottom of the ring-shaped hollow groove and then can contribute to the deposition at the substate at the opening area to increase the deposition rate.
On the other hand, it is well-known that the gas pressure affects the film deposition because the density and the energy of ions incident to the target depends on the gas pressure. However, the spatial profile of the rf ring-shaped magnetized plasma is not known at various gas pressures. The ion flux to the substrate is an important factor to determine the thin films deposited at various gas pressures.
In this paper, the spatial structures of the ion saturation current, which is proportional to the ion flux, have been measured by moving a Langmuir probe radially and axially. In this way, the radial profiles of the ion flux at various axial distances from the electrode are estimated from the ion saturation current, and their characteristics are discussed at various gas pressures of 0.13, 6.65, and 9.31 Pa. The spatial profiles of the Hall parameter and Larmor radius of electrons and ions are also calculated to discuss their magnetizations by using values of the magnetic flux density obtained from simulations.
2. Experimental methods
As shown in Fig. 1, an aluminium hollow electrode (diameter of 156 mm) with a ring-shaped groove of an inner diameter of 70.2 mm, an outer diameter of 101.6 mm and a depth of 15 mm is used as an AZO target electrode. 30) Two facing cylindrical ZnO/Al2O3(2 wt%) targets with inner diameters of 70.2 mm and 95.6 mm, respectively, and outer diameters of 76.2 mm and 101.6 mm, respectively, are mounted in the groove of the ring-shaped hollow electrode. 30) A magnetic field to confine the plasma in the groove region is generated by placing permanent magnets behind both sidewalls of the groove as shown in Fig. 1 and described in more detail in Sect. 3. The rf input power at 13.56 MHz is fixed at 20 W and the argon gas pressure is changed from 0.13 to 0.93 Pa. The ion saturation current is measured by a loop heated probe of 0.5 mm diameter and 10 mm length biased at −70 V to avoid the deposition of AZO thin films to the probe. Spatial profiles of the ion saturation current are measured by moving the heated probe axially and radially. The ion saturation current Iis is described by the following equation: 35,36)

where q, Sp and Γi are the electronic charge, the probe area, and the ion flux density, respectively. Correspondingly, the ion flux density Γi is estimated from the measured ion saturation current and the electronic charge as well as the probe area.
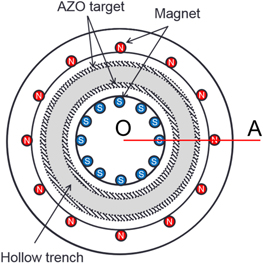
Fig. 1. Front view of the ring-shaped hollow electrode with 24 cylindrical magnets consisting of 12 inner S-pole magnets and 12 outer N-pole magnets - reproduced from Ref. 30) under Creative Commons Attribution 4.0 International Public License https://creativecommons.org/licenses/by/4.0/.
Download figure:
Standard image High-resolution image3. Results and discussion
3.1. Arrangement of magnets in the ring-shaped hollow electrode and magnetic characteristics of electrons and ions
Figure 1 shows a front view of the ring-shaped hollow electrode with 24 cylindrical magnets consisting of 12 inner S-pole magnets and 12 outer N-pole magnets. 24 cylindrical neodymium magnets are set up symmetrically to enclose the hollow groove. Here, an iron yoke is not used to fix the magnets in this work because it is unstable to fix them and can affect the magnetic field profile around them. Instead, they are mounted in a plastic cylinder as ring-shaped products with 12 holes. The size of the magnets is 6 mm in diameter and 10 mm in length. The surface magnetic flux density is 575 mT. A 2D magnetic field simulation in a cross section of the line O–A as shown in Fig. 1 is calculated by a conventional commercial electromagnetic simulator Murata software Femtet. Figure 2 shows the simulated 2D magnetic flux lines around the magnets. It is found that the magnetic field lines close the outlet of the groove, so that electrons are expected to be confined in the hollow groove. Figure 3 shows radial profiles of the absolute magnetic flux density at various axial distances of z = 5–50 mm from the hollow electrode. Two dashed lines denote the position of the groove. Here, the absolute magnetic flux density  is estimated by the following equation:

where Br and Bz are the radial and axial components of the magnetic flux density as shown in Fig. 2, respectively. It is found that the magnetic flux density has a valley with a value of approximately 17 mT at z = 5 mm near the hollow electrode. It is seen that the magnetic flux density decreases with increasing the axial distance, and the absolute value is less than 5 mT at the axial positions of z ≥ 30 mm.
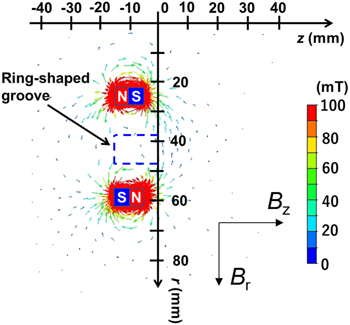
Fig. 2. 2D magnetic flux lines around the magnets in a cross section of line O–A as shown in Fig. 1.
Download figure:
Standard image High-resolution image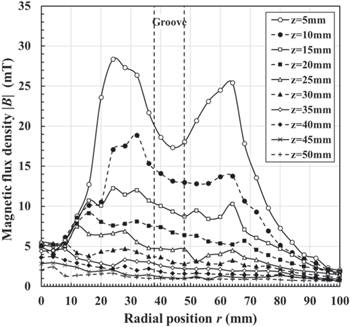
Fig. 3. Radial profiles of the absolute magnetic flux density at various axial distances of z = 5–50 mm from the hollow electrode. Two dashed lines denote a position of the groove.
Download figure:
Standard image High-resolution imageThe Hall parameter h and Larmor radius rL are often investigated to discuss the magnetic characteristics of electrons and ions in magnetized plasmas. 36) The Hall parameter h is expressed as the following equation:

where  and
and  are the angular cyclotron frequency and collision frequency of charged particles, respectively. The angular cyclotron frequency is calculated based on the electronic charge, the charged particle mass, and the magnetic flux density, while the collision frequency is estimated from the gas pressure, collision cross section, and thermal velocity. The Larmor radius rL is given by the following equation:

where  and
and  are the thermal velocity and the angular cyclotron frequency of charged particles, respectively.
Figures 4(a) and 4(b) show the radial profiles of the electron Hall parameter he and the Larmor radius rLe at various axial distances, respectively. Here, the argon gas pressure is fixed at 0.13 Pa for calculating the Hall parameter. It is recognized that the radial profiles of the electron Hall parameter he and Larmor radius rLe are proportional and inversely proportional to the radial profiles of the magnetic flux density as shown in Fig. 3, respectively. It is found that he is higher than 40 at all positions at a fixed Ar gas pressure of 0.13 Pa, whereas the electron Larmor radius rLe is lower than 10 mm at all positions. In particular, rLe is less than 1 mm at 10 mm < r < 70 mm near the hollow electrode at z ≤ 15 mm. That is, electrons are strongly confined by the magnetic field lines to produce the high-density plasma near the hollow electrode.
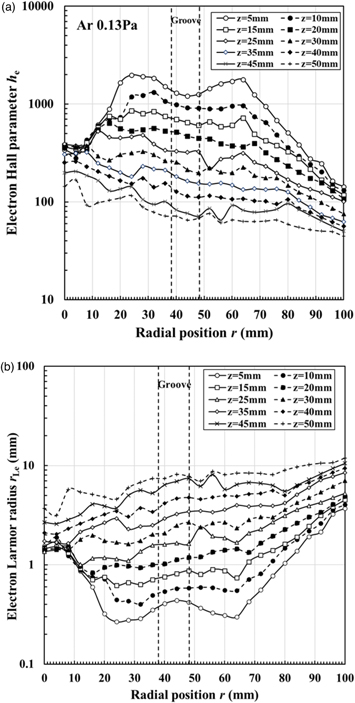
Fig. 4. (a) and (b) Radial profiles of the electron Hall parameter he and Larmor radius rLe at various axial distances, respectively. Here, the argon gas pressure is fixed at 0.13 Pa for calculating the Hall parameter.
Download figure:
Standard image High-resolution imageFigures 5(a) and 5(b) show the radial profiles of the ion Hall parameter hi and Larmor radius rLi at various axial positions, respectively. It is found that the ion Hall parameter hi is lower than 2 at all positions at a fixed Ar gas pressure of 0.13 Pa, while the ion Larmor radius rLi is higher than 20 mm at all positions. Thus, ions are not magnetized. It is possible to measure the ion saturation current with the probe because the ions are not affected by the magnetic field. In fact, the ion Larmor radius is much larger than the probe radius of 0.5 mm.
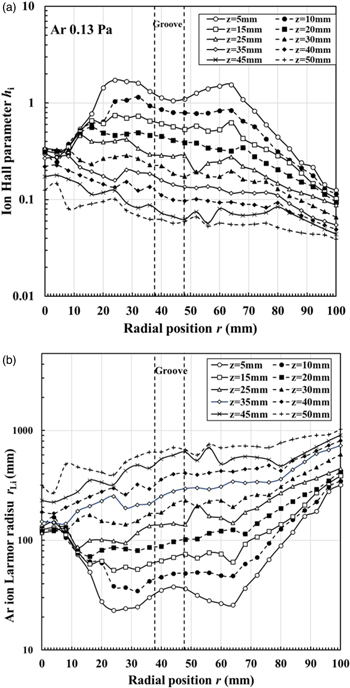
Fig. 5. (a) and (b) Radial profiles of the ion Hall parameter hi and Larmor radius rLi at various axial positions, respectively. Here, the argon gas pressure is fixed at 0.13 Pa for calculating the Hall parameter.
Download figure:
Standard image High-resolution image3.2. Spatial profiles of the ion flux to the substrate at various gas pressures
Figure 6 shows the radial profile of the ion flux at various axial distances of z = 5–50 mm from the rf powered electrode at an argon pressure of 0.13 Pa. Here, the radius of the rf electrode is 78 mm and the position of the groove is between r = 38 and 48 mm. The magnitude of the ion flux is of the order of 1020 m−2 s−1. It is seen that the radial profile of the ion flux has a peak of 2.3 × 10²⁰ m−2 s−1 (the ion density is ni ≈ 1.5 × 10¹¹ m−3 under the assumption of an electron temperature of 4 eV based on our previous work 30)) at r = 45.5 mm and z = 5 mm and then the peak decreases from 2.3 to 1.7 × 10²⁰ m−2 s−1 gradually with increasing the axial distance z from 10 to 20 mm. The radial profile of the ion flux approaches a uniform profile with increasing axial distance z from 20 to 50 mm. This phenomenon is ascribed by a diffusion effect of ions.
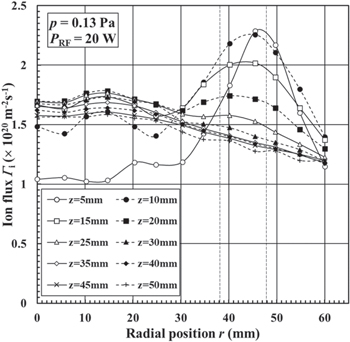
Fig. 6. Radial profile of the ion flux at various axial distances of z = 5–50 mm from the rf powered electrode at an argon pressure of 0.13 Pa. Here, the radius of the rf electrode is 78 mm and the position of the groove is between r = 38 and 48 mm.
Download figure:
Standard image High-resolution imageFigure 7 shows the radial profile of the ion flux at a gas pressure of 0.67 Pa. The ion flux has a peak of 3.1 × 10²⁰ m−2 s−1 (ni ≈ 2.0 × 10¹¹ m−3) at r = 45.5 mm in the ring-shaped groove. The peak value for p = 0.67 Pa is approximately 1.3 times higher than that for p = 0.13 Pa. The peak decreases from 2.8 to 2.0 × 10²⁰ m−2 s−1 gradually with increasing the axial distance z from 10 to 20 mm and the radial profile of the ion flux becomes uniform.
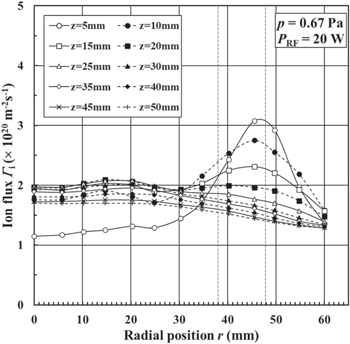
Fig. 7. Radial profile of the ion flux at various axial distances of z = 5–50 mm from the rf powered electrode at an argon pressure of 0.67 Pa.
Download figure:
Standard image High-resolution imageFigure 8 shows the radial profile of the ion flux at an argon pressure of 0.93 Pa. The peak value is 3.2 × 10²⁰ m−2 s−1 (ni ≈ 2.0 × 10¹² m−3) at r = 45.5 mm. The magnitude of the ion flux is of the order of 1021 m−2 s−1 and becomes ten times higher than that observed at the gas pressure of 0.13 Pa. It seems that the spatial structure of the ion flux at a gas pressure of 0.93 Pa is similar to that observed for the gas pressures of 0.13 and 0.67 Pa.
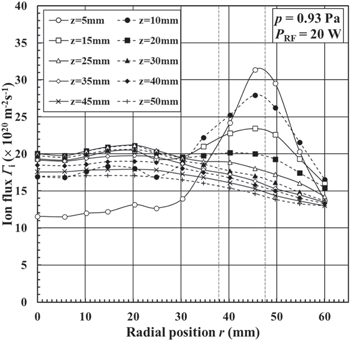
Fig. 8. Radial profile of the ion flux at various axial distances of z = 5–50 mm from the rf powered electrode at an argon pressure of 0.93 Pa.
Download figure:
Standard image High-resolution imageTable I shows ion flux measured in three different sputtering systems, i.e. a DC magnetron, 37) a high-power impulse magnetron sputtering (HiPIMS), 38) and in the plasma source used in this work. These previous works on the DC magnetrons and the HiPIMS 37,38) have not reported the spatial profile of the ion flux, but the maximum value of its radial profile. Comparing the ion flux in these sputtering systems is difficult because of the different experimental conditions. The ion flux in our work is the highest value among these systems, although the input power in the other system is 5–10 times higher than the one used in this work. Thus, our sputtering system produces high-density plasma more efficiently.
Table I. Ion flux in three different sputtering systems.
| This work | DC magnetron (Ref. 37) | HiPIMS (Ref. 38) | |
|---|---|---|---|
| Ar gas pressure (Pa) | 0.93 | 0.53 | 2 |
| Input power (W) | 20 | 100 | 200 |
| Distance from target (mm) | 50 | 130 | 45 |
| Ion flux (m−2 s−1) | 1.7 × 10²¹ | 1.6 × 10¹⁸ | 8.7 × 10²⁰ |
In this section, the transport of the ions generated in the rf ring-shaped magnetized sputtering plasmas with two facing cylindrical AZO targets has only been described, although a discussion including the transport of sputtered species and radicals is also important for preparing thin films. However, the ion flux profile is strongly related to the spatial distributions of the sputtered species and radicals generated in the plasma and determines the spatial structure of the deposited film.
3.3. Axial profile of the deviation of the radial profile of the ion flux
The radial profile of the ion flux was found to change with increasing the axial position at various gas pressures. A finite deviation of the ion flux profile is present at all spatial positions and all gas pressures as shown in Figs. 6–8. In order to discuss the axial variation of this deviation of the ion flux profile from a perfectly uniform profile quantitatively, this deviation needs to be defined based on the radial profile of the ion flux. The deviation D of the radial profile of the ion flux is defined by the following equation:

where Γimax and Γimin denote the maximum and minimum values of the radial profile of the ion flux, respectively. The parameter D = 0 means that the radial profile of the ion flux is completely uniform. Since the ion flux influences the quality of the deposited films, D determines the radial profile of the film thickness and its characteristics, such as resistivity and transparency of the deposited AZO films which play a very important role for the performance of electronic devices.
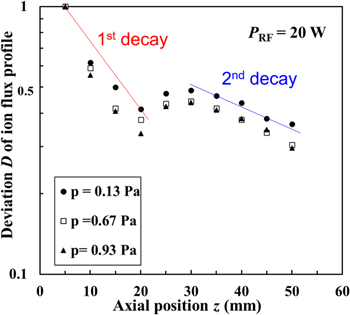
The axial profile of the deviation D at various gas pressures is shown in Fig. 9. Here, D is normalized by the value at z = 5 mm. It is seen that the axial profile of the deviation D has two decay characteristics consisting of a 1st decay from z = 5 to 20 mm and a 2nd decay from z = 30 to 50 mm. It is found for an argon gas pressure of p = 0.13 Pa that the deviation D decreases from 1 to 0.41 with increasing axial position z from 5 to 20 mm and then has a peak of 0.49, and again decreases from 0.49 to 0.36 with increasing z from 30 to 50 mm. The data for p = 0.67 and 0.93 Pa show the same profile as the data for p = 0.13 Pa. The characteristic decay length λ for the 1st and 2nd decay lines is obtained from the following equation:

Therefore, the exponential characteristics are based on the diffusion mechanism, i.e. the ions diffuse due to the presence of a density gradience to minimize the deviation of the radial profile of the ion flux. The physical meaning of the decay lengths is related to the diffusion lengths of the ions.
Fig. 9. Axial profile of the deviation D of the radial ion flux profile for the fixed rf power of 20 W at various gas pressures.
Download figure:
Standard image High-resolution image
It is seen that their decay lengths almost decrease with increasing the gas pressure as shown in Fig. 9. Table II shows the characteristic decay length λ estimated from the axial profile of deviation D. It is found that the 1st decay length is short with a length of 13.9–17.5 mm, and the 2nd decay length is long with a length of 52.6–66.7 mm.
Table II. Characteristic decay length estimated from the axial profile of deviation D of the radial profile of the ion flux at various argon gas pressures.
| Ar gas pressure p (Pa) | 1st decay length λ1 (mm) | 2nd decay length λ2 (mm) |
|---|---|---|
| 0.13 | 17.5 | 66.7 |
| 0.67 | 15.4 | 52.6 |
| 0.93 | 13.9 | 52.6 |
The deviation of the radial profiles of the ion flux as shown in Figs. 6–8 is strongly related to the radial gradient of the ion flux. That is, the deviation should decrease with increasing the radial gradient of the ion flux so that the radial profile of the ion flux approaches a uniform profile.
As shown in Table II, for the 1st decay line, the decay length decreases from 17.5 to 13.9 mm with increasing gas pressure from 0.13 to 0.93 Pa, while for the 2nd decay line, it decreases from 66.7 to 52.6 mm. For the 1st decay line as shown in Fig. 9, the axial position of the radial gradient of the ion flux is selected at z = 5 mm, whereas for 2nd decay line, it is chosen at z = 30 mm. The radial gradients of the ion flux for the peak are estimated from the data as shown in Figs. 6–8. For the 1st decay property, Table III shows the radial gradients of the ion flux at r = 45.5 mm towards the center and the edge for z = 5 mm at various gas pressures of 0.13, 0.67, and 0.93 Pa in Figs. 6–8. For Ar gas pressure of 0.13 Pa, the radial gradients towards the center and the edge are 7.2 × 10²¹ and 7.8 × 10²¹ m−3 s−1, respectively. When the gas pressure increases from 0.67 to 0.93 Pa, the radial gradient towards the center increases from 1.1 × 10²¹ to 1.1 × 10²³ m−3 s−1, whereas the radial gradient towards the edge increases from 1.2 × 10²² to 1.2 × 10²³ m−3 s−1. Thus, the 1st decay length decreases with increasing the gas pressure.
Table III. Radial gradients of the ion flux at r = 45.5 mm towards the center and the edge for z = 5 mm at various gas pressures of 0.13, 0.67 and 0.93 Pa in Figs. 6–8 for 1st decay line.
| Ar gas pressure p (Pa) |
 (m−3s−1) (m−3s−1) |
 (m−3s−1) (m−3s−1) |
|---|---|---|
| 0.13 | 7.2 × 10²¹ | 7.8 × 10²¹ |
| 0.67 | 1.1 × 10²² | 1.2 × 10²² |
| 0.93 | 1.1 × 10²³ | 1.2 × 10²³ |
As shown in Fig. 9, the axial profile of the deviation of the ion flux also indicates the 2nd decay characteristic at various gas pressures. This results from the peaks of the ion flux at r = 14.7 mm and 20.3 mm as shown in Figs. 6–8. Table IV shows radial gradients of the ion flux at r = 14.7 mm for Ar gas pressure of 0.13 Pa and r = 20.3 mm for Ar gas pressures of 0.67 and 0.93 Pa towards the center and the edge for z = 30 mm in Figs. 6–8 for the 2nd decay property. It is seen that the radial gradients towards the center and the edge are 7.2 × 10²⁰ and 6.6 × 10²⁰ m−3 s−1, respectively for the gas pressure of 0.13 Pa, whereas for the gas pressure of 0.67 Pa, are 5.4 × 10²⁰ and 1.6 × 10²¹ m−3 s−1, respectively. On the other hand, for the gas pressure of 0.93 Pa, the radial gradients towards the center and the edge are 7.3 × 10²¹ and 1.5 × 10²² m−3 s−1, respectively. The radial gradients for 2nd decay line are lower than those for the 1st decay line so that the decay length for 2nd decay line is longer than the one for the 1st decay line.
Table IV. Radial gradients of the ion flux at r = 14.7 mm for an Ar gas pressure of 0.13 Pa and r = 20.3 mm for an Ar gas pressure of 0.67 and 0.93 Pa towards the center and the edge for z = 30 mm in Figs. 6–8 for 2nd decay property.
| Ar gas pressure p (Pa) |
 (m−3 s−1) (m−3 s−1) |
 (m−3 s−1) (m−3 s−1) |
|---|---|---|
| 0.13 | 7.2 × 10²⁰ | 6.6 × 10²⁰ |
| 0.67 | 5.4 × 10²⁰ | 1.6 × 10²¹ |
| 0.93 | 7.3 × 10²¹ | 1.5 × 10²² |
4. Conclusions
The radial profiles of the ion flux at various axial positions have been measured in a ring-shaped magnetized sputtering plasma with two facing cylindrical AZO targets at different argon gas pressures because the ion flux plays an important role for the quality of deposited thin films. The ion flux has a magnitude of the order of 1020–1021 m−2 s−1 at the rf input power of 20 W and argon gas pressures of 0.13–0.93 Pa. It is found that the radial profile of the ion flux has a peak-shaped distribution close to the target and then becomes uniform with increasing the axial position of the rf powered electrode. The axial profile of the deviation of the radial profile of the ion flux has two decay characteristics with a short decay length of 13.9–17.5 mm and a long decay length of 52.6–66.7 mm, whereas the length decreases with increasing the gas pressure.
Acknowledgments
The work was financially supported by JSPS KAKENHI Grant No. JP22H01196, JKA and its promotion funds from AUTORACE and Joint Research of Ocean Energy from the Institute of Ocean Energy, Saga University. J. Schulze acknowledges support from the German Research Foundation in the frame of the project "Plasmabasierte Prozessfuehrung von reaktiven Sputterprozessen" (No. 417888799).