Article

Evaluation of Different Scenarios to Switch the Whole Regional Bus Fleet of an Italian Alpine Region to Zero-Emission Buses

1
Institute for Renewable Energy, European Academy of Bolzano (EURAC Research), Viale Druso 1, 39100 Bolzano, Italy
2
IREC, Jardins de les Dones de Negre 1, 2ª pl., 08930 Sant Adrià del Besòs Barcelona, Spain
*
Author to whom correspondence should be addressed.
World Electr. Veh. J. 2023, 14(4), 91; https://doi.org/10.3390/wevj14040091
Submission received: 17 February 2023 / Revised: 24 March 2023 / Accepted: 30 March 2023 / Published: 1 April 2023

Abstract

:
Public bus decarbonization is increasingly important to address the global issue of climate change. There are several challenges associated with large-scale introduction of zero-emission technologies in public fleets. This is especially the case in an extra-urban context, of mountain regions with challenging weather conditions. In this work the analysis of the state-of-the-art ZEBs, local bus lines, and timetables was performed to understand the best fit of technology—battery electric buses (BEBs) or fuel cell electric buses (FCEBs)—for each line in such a region. Further, a simulation tool was developed to calculate the compatibility of zero-emission technologies with the current needs of the public transportation considering distance, altitude difference, and climate conditions. The results show that a complete switch of the fleet is possible with a slight increase in the number of buses and that there is no clear difference in the distance covered in mountainous areas by BEBs versus FCEBs, but that both technologies can cover similar distances. The tool developed is not limited to bus fleets but can be applied to all kinds of fleets that cover clearly defined daily routes.

1. Introduction

Public bus decarbonization is becoming increasingly important to address the global issue of climate change. The transportation sector is one of the largest sources of greenhouse gas emissions, given that passenger travel vehicles (cars, motorbikes, and buses) produce around 45% of global transport emissions [1]. Decarbonizing the public bus fleet not only reduces emissions, but it also has a range of other benefits for both the environment and society. There are, however, several challenges associated with large-scale introduction of zero-emission technologies in public fleets, that include: high upfront costs [2], technical issues (i.e., battery range, charging times, and the reliability of the technology) [3] or financial sustainability [4] to ensure long-term maintenance and operation costs within the public domain. The public transportation authority (PTA) in the Italian Alpine province of South Tyrol has been at the forefront in the testing and implementation of the innovative zero-emission bus fleets for decades [5] and foresees the complete phase-out of diesel buses and their replacement with zero emission buses (ZEBs). The geographical and climatic characteristics of the province also represent peculiarities for currently available zero-emission technologies and their management. South Tyrol is the most northern province of Italy and is located in the Dolomite Alps with around 60% of the area located above 1500 m a.s.l., only 4% of the area is located below 500 m a.s.l. Besides its around 530,000 inhabitants [6], it is visited by several million tourists per year. To act as a representative region for green transport [7] and in consideration of the climate policy developments in Europe, South Tyrol approved an ambitious provincial climate plan [8], which includes drastic reduction of transport GHG emissions. In this work, first the analysis of the state-of-the art ZEBs, South Tyrolean bus lines, and their timetables was carried out. The goal of the study was to understand which technology—battery electric buses (BEBs) or fuel cell electric buses (FCEBs)—is appropriate for a particular line. Furthermore, a simulation tool was developed to calculate the compatibility of zero-emission technologies with the current needs of the public transportation service in South Tyrol to provide a preliminary study to decision-makers. The authors adopted a simplified energy modelling methodology, accepting model limitations. To the best of the authors’ knowledge, there have not yet been scholarly studies that combine the relationship among several important factors [9] for zero-emission fleets in extra-urban environments: elevation, temperature considerations, longer distances, timetables, and both electric and hydrogen bus technologies.

2. Literature Review on State-of-Art of Zero-Emission Fleets Simulation Tools Used in Planning

While several works concentrate on the evaluation and comparison of the environmental and financial performance of future electric and hydrogen fleets [10,11,12], only few offer frameworks for a regional transition with specific applications. To keep this review succinct, we focus on the relevant optimization and simulation tools that either aim at transition of large-scale fleets and/or simulate several bus technologies simultaneously. Scholars proposed simulation optimization tools and decision-making frameworks of the potential replacement of the conventional bus fleets with zero-emission ones mostly at urban scale. The authors of [13] proposed using a mixed integer linear model for the analysis of multiple bus routes at urban level in Berlin (Germany) for battery-electric buses, using such parameters as individual route, bus type, and traffic. The impact of high slope variation or longer distances was not discussed as based on the topology of the case it was not relevant. Within the optimization tools, [14] used a similar mixed integer linear cost optimization model to analyze the potential for the substitution of traditional public transportation modes with the electric buses using a function of least energy consuming routes. They assumed only constant slope values in a simplified road network with varying distances, but focused on the potential location of the infrastructure for electric buses. The authors of [15] combined energy consumption, carbon emission, and operational cost models and bi-objective model, which minimizes the total carbon emission and operational cost of all bus lines applied for the fleet of the city of Liuzhou for a mix of electric and diesel buses. Scholars considered travel distance in their energy consumption model; however, no slope considerations were included. The authors of [16] developed a mixed integer nonlinear programming with a detailed calculation of energy consumption for electric buses only applied to the transit network of Belleville city (Canada). This energy consumption module mostly considers the impact of traffic intensity as the slope variation in the case study is low. Another optimization approach through mixed integer linear model was proposed by [17] and applied for the electrification of a bus route under partial charging and battery degradation in Singapore.
Regarding simulation tools, [18] developed a model as part of a larger grid impact study to evaluate the potential implementation of only electric buses. The model was applied to the case study of the network of the city of Belleville (Canada). Simulations were performed based on a logit model that considers bus deployment on the one hand and the operation of charging systems on the other. Among the variables considered were standard urban and suburban distances for bus travel and simulated energy consumption without consideration of slope or climate impacts. In [19], a simulation tool combined bus route design, energy range, and the infrastructure scheduling for the transition to all-electric bus fleets in urban environments, with Barcelona (Spain) as the case study. Energy consumption and battery capacity in this work is calculated as a function of speed and distance, without slope and weather conditions. Within the knowledge of the authors, the only study addressing the transition of large-scale fleets towards battery-electric buses at extra-urban level was performed by [20]. They developed a model that considers distinctive spatiotemporal characteristics and difficulties associated with longer distance operation of battery-electric buses. The model suggests potential for investment optimization based on a variety of strategies that can be adopted by public transportation operators operating at regional level for charging infrastructure based on electric bus specific operation characteristics.
Specific works addressing the use of simulation tools that consider at once slopes, longer route length, and climatic conditions and their impact on energy consumption of electric and hydrogen fueled buses and therefore fleet composition as well as related infrastructure that needs to be applied in highly mountainous areas are missing in scholarly literature.

3. Materials and Methods

Within the following section the methods and materials used in order to set up the simulation tool are described. The tool has been written using Python programming language and consists of approximately 10,000 lines of code.
The tool includes two main algorithms:
The first algorithm calculates the energy consumption of BEBs and FCEBs traveling once along one specific line. In order to do so, vehicle parameters have to be assumed (Section 3.1), precise information on the lines needs to be available (Section 3.2) and the energy consumption to travel along the lines is simulated (Section 3.3).
This first algorithm is applied to each single line covered by public buses today in order to evaluate if ZEBs are able to travel one return trip on the specific line.
The second algorithm is designed to calculate the minimum number of buses and charging stations required to serve a specific bus line. To achieve this, the algorithm takes into account the timetable and frequency of the buses, energy requirements for traveling along the line (which can vary depending on the direction of travel), and the state of charge (SOC) of the batteries or hydrogen tank at the start and end of the route. It considers whether recharging or refueling is needed and positions charging or refueling stations accordingly at the beginning and end of routes. The algorithm also determines how much recharging or refueling is possible within the given timetable.
This algorithm is applied to all bus lines by considering one representative day. The algorithm considers both zero-emission bus (ZEB) technologies: electric and hydrogen. For each line, and technology, the algorithm identifies whether additional ZEB buses are required compared to the number of buses required to serve the same line using diesel buses. This need for additional buses arises when the SOC of the battery or the hydrogen available is insufficient to cover the next trip, and recharging or refueling time between trips is too short to adequately recharge or refuel.

3.1. Vehicle Study

The state-of-the-art ZEBs were implemented in order to analyze their possible employment on the different lines in South Tyrol. Before proceeding to data collection on the performances of the different models, the main ZEBs’ characteristics were identified.
Forty-one models of ZEBs were analyzed (of which 12 were FCEBs), sold in European, American, and Asian markets. Buses are classified into three categories, according to the Italian Ministerial Decree of 20 June 2003 [21] as per Table 1.
  • Given the goal of the project, evaluating the possibility of changing the current fleet of diesel buses in regional service, the class of interest is C3. Given the small number of BEBs-class C3 and the absence of FCEBs-class C3 buses at the time of data collection, C2 and C1 classes were also considered.
  • The following parameters were identified to describe the different buses:
  • Energy storage: the study considered both battery capacity in kWh (for BEBs and FCEBs), and hydrogen storage in kg (for FCEBs). Although some manufacturers state that battery capacity depends on charging velocity, authors considered slow charging condition (typical in depot) for data uniformity issues and did not include the aging process. Most of the data were derived from the manufacturer’s websites;
  • Range: It represents the maximum distance that the bus can cover in km. This parameter is influenced by the battery capacity, the HVAC (heating ventilation and air conditioning) system, the regenerative braking (recovery efficiency and braking style), and the trips and the general driving style. Many manufactures did not refer to standardized duty cycles (some of them adopted S.O.R.T. cycles [22]) and did not specify the HVAC’s influence on energy consumption. The data collected were mainly obtained from the manufacturer’s website, in some cases by emails received directly from the manufacturer or by interpolations;
  • Motor power: given the presence of wheel motors in some models, this parameter corresponds to the sum of all motor powers present in the power train. It is expressed in kW;
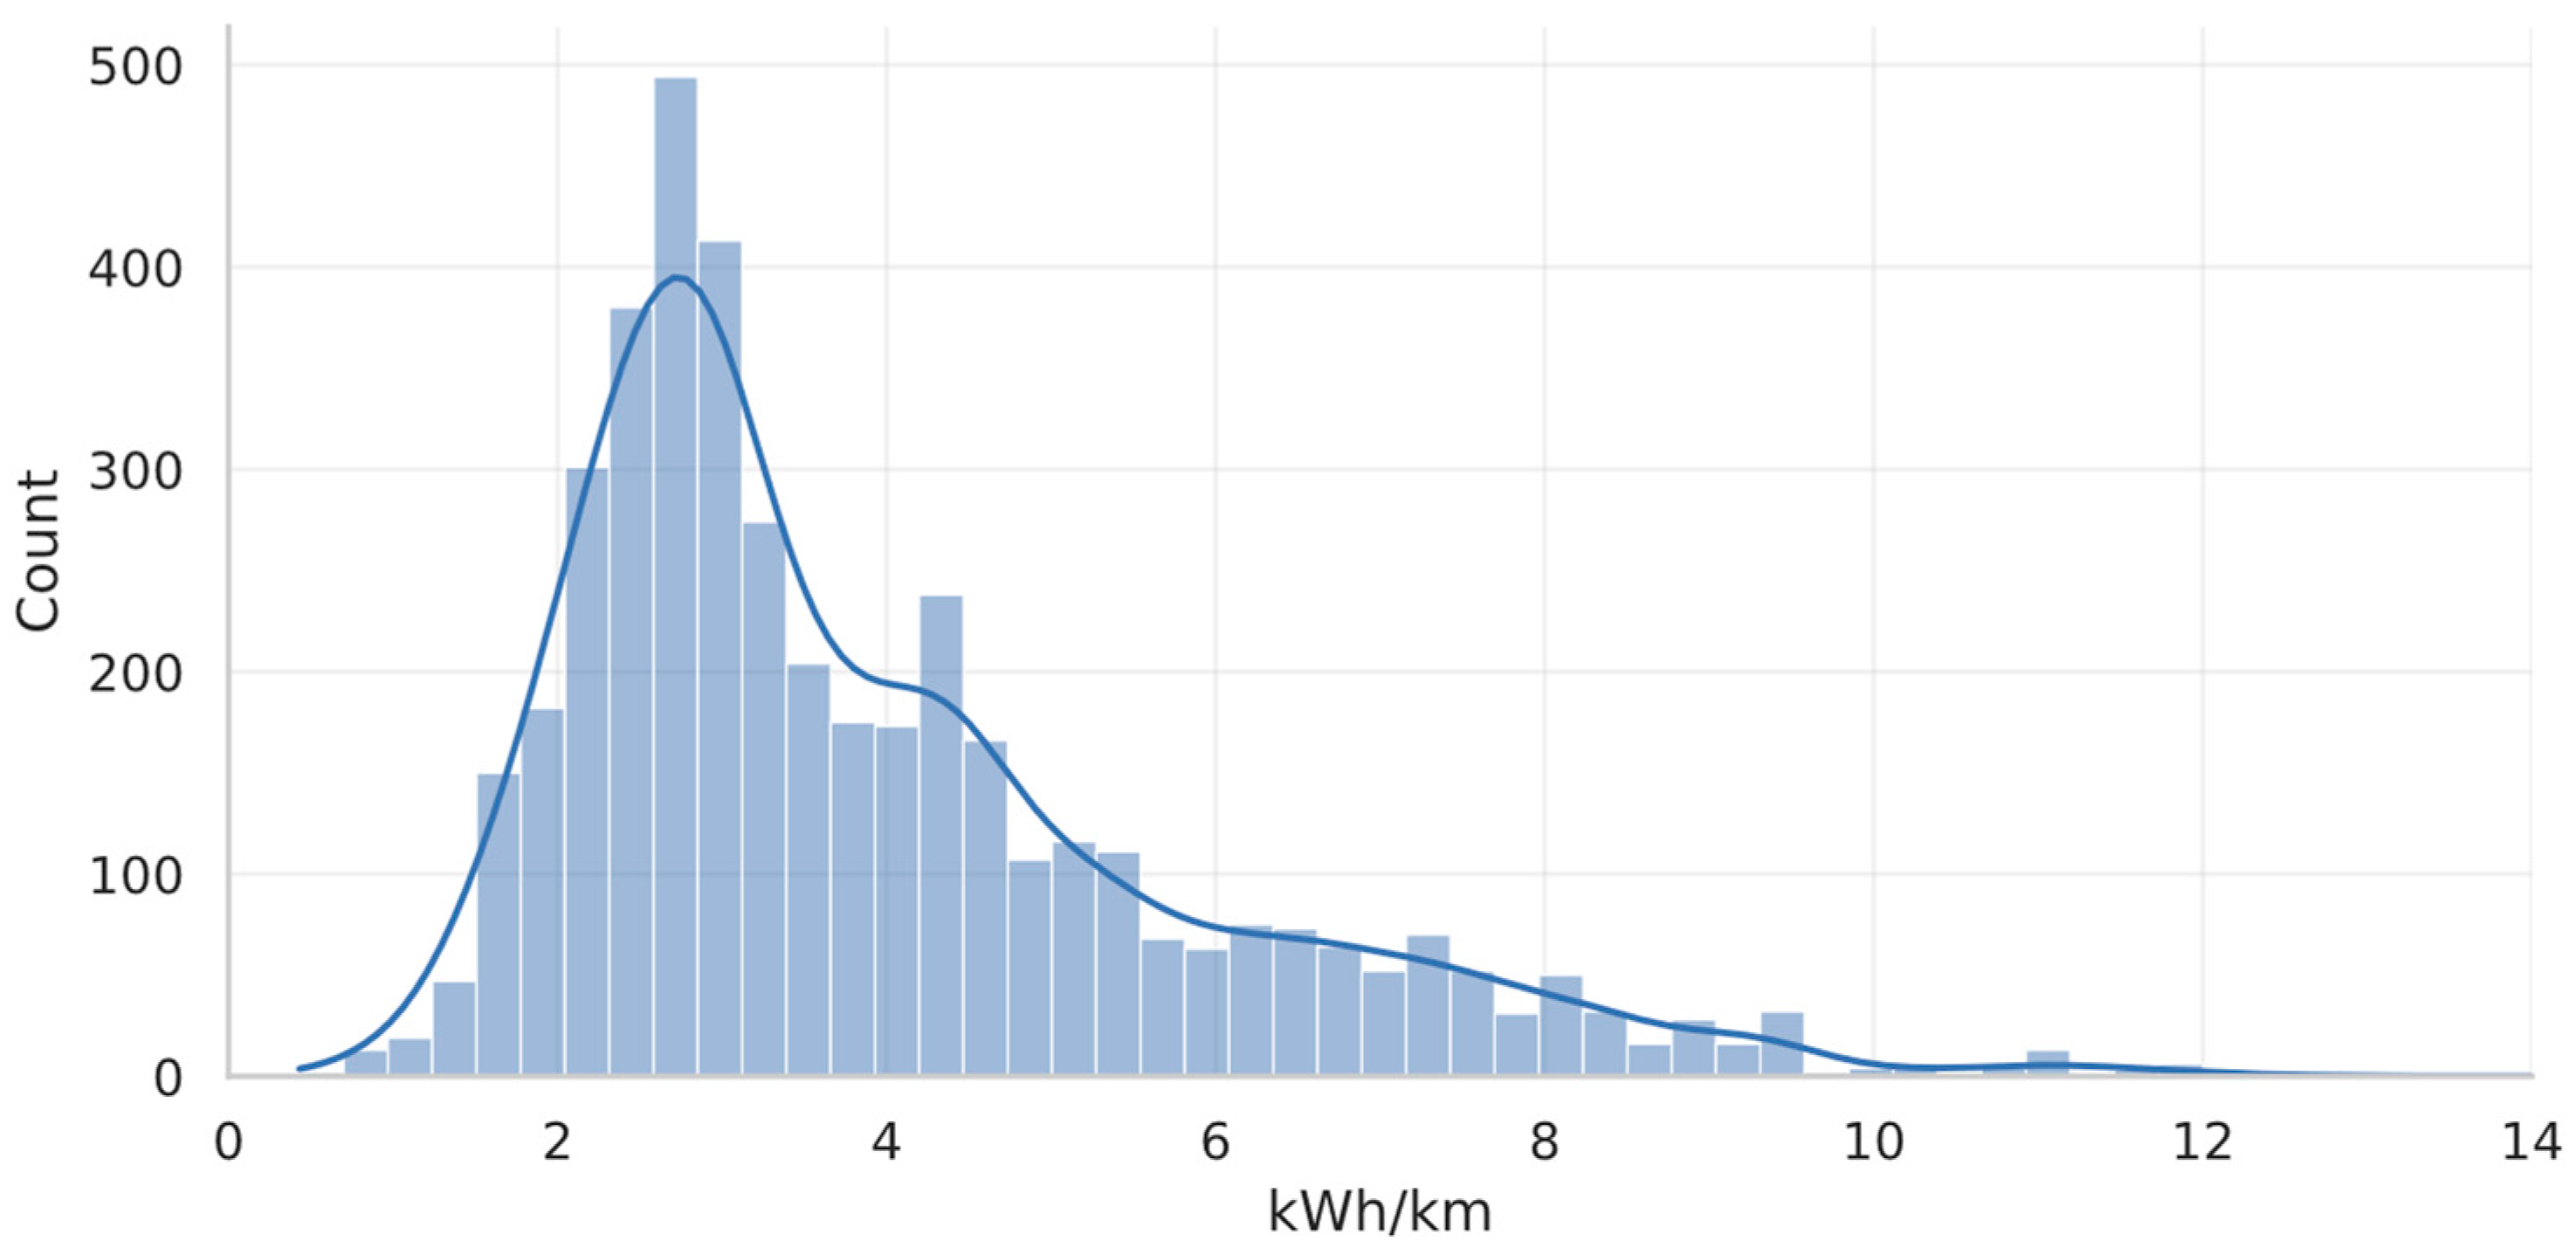
  • Specific consumption: it represents the average energy consumption to travel a distance and is expressed in kWh/km for BEBs and (kg of hydrogen)/km for FCEBs. As for the range, the specific consumption has been deduced from information received from the manufacturer (website or emails) or through interpolation. The HVAC system and the adoption of a specific running cycle have in many cases not been declared by the manufacturer;
  • Vehicle weight: this parameter is expressed in kg and was used in order to make considerations on the vehicle’s potential energy, given the variations of altitude on the South Tyrolean bus lines.
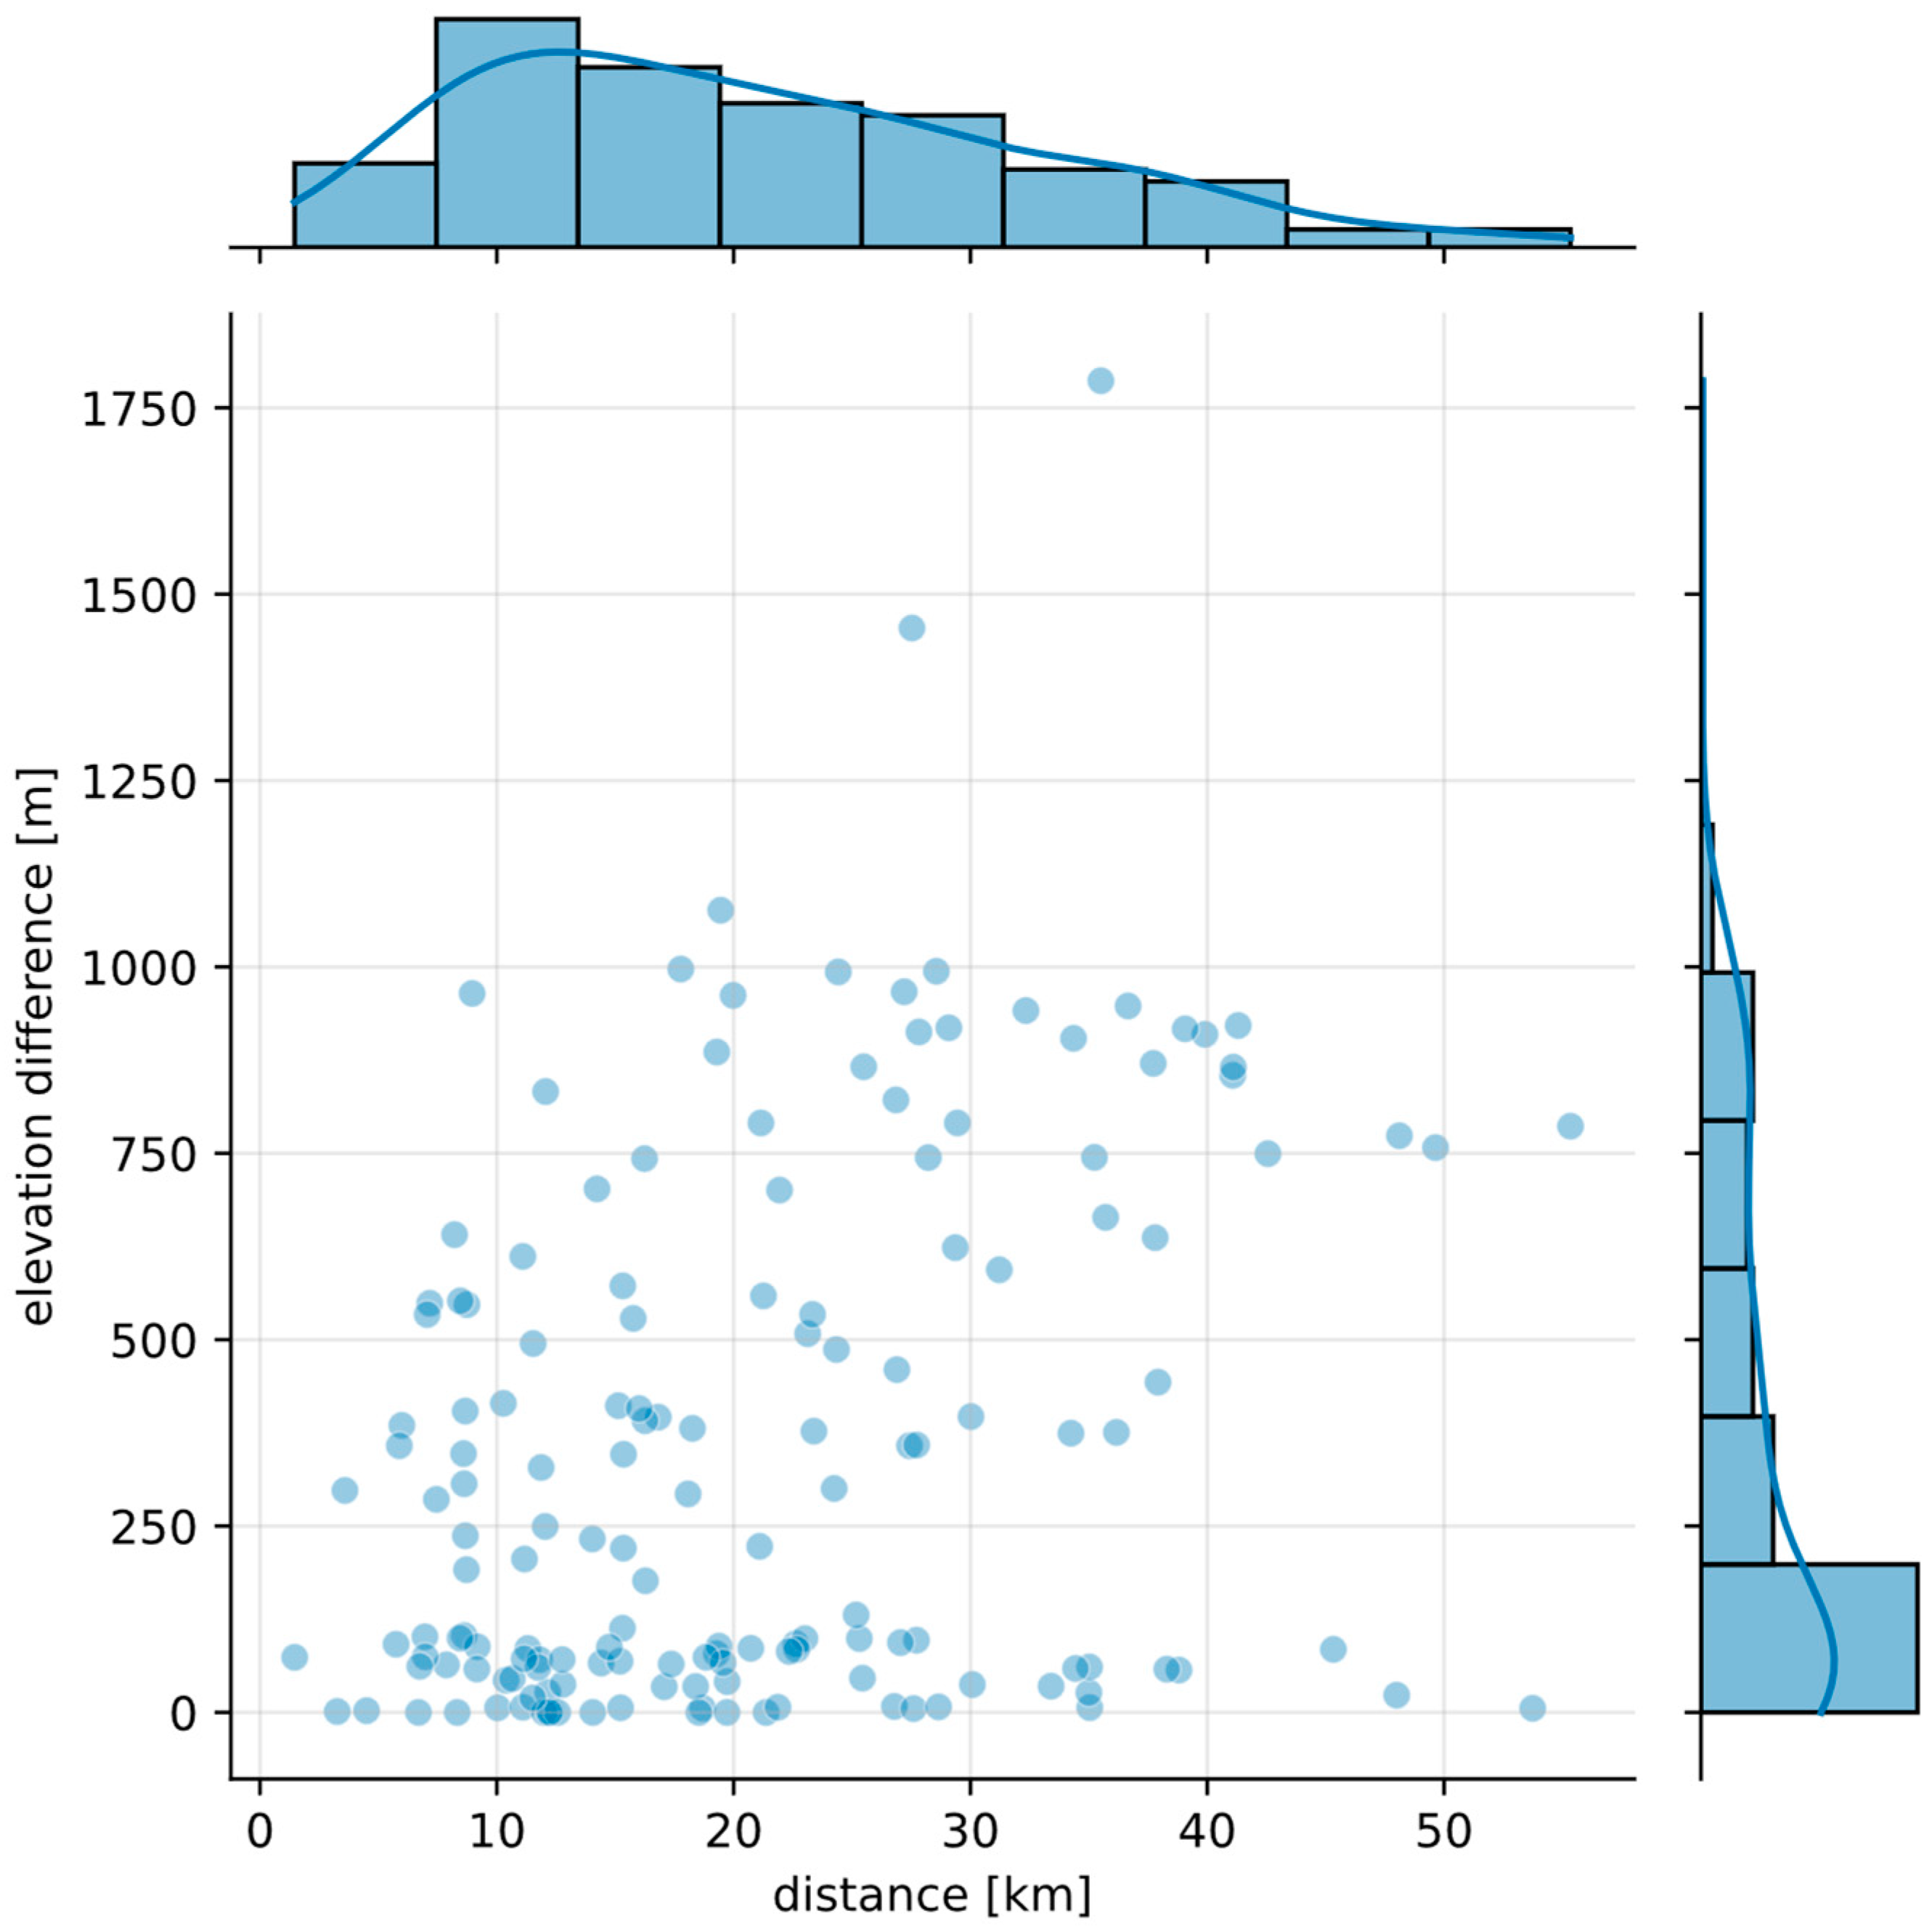
The electric bus considered for the simulations has an energy storage of 660 kWh, a motor power of 248.59 kW, a weight of 19,050 kg, a claimed range of 386 km, and an estimated specific consumption of 1.4 kWh/km. The hydrogen model used for the simulations has a range of 350 km, a storage of 38 kg of hydrogen, and a specific consumption of about 0.11 kg of hydrogen/km.

3.2. Road Network

The road network was converted into a 3D vector, combining 2D roads with digital terrain models (DTMs) using the GRASS GIS ‘v.drape’ command [23]. Figure 1 shows the intercity lines that have been simulated in South Tyrol, considering the orography of the territory. However, the 3D roads included several elevation points that were not correct due to road infrastructures: bridges, tunnels, underpasses, and subways. The official road network contained the information on the infrastructure type for each line. Therefore, the authors proceeded in interpolating the elevation of the critical infrastructure using a linear interpolation [24] with the road elevation before and after the infrastructure. An iterative linear interpolation was implemented and applied to the road network to recursively remove the road segments with a slope greater than 20%. The bus lines time schedule was provided by the local public transport organization Strutture Trasporto Alto Adige spa (STA) using the General Transit Feed Specification (GTFS) format. The time schedule provided covers the full year, however—to reduce complexity—for the simulations the authors selected one representative particularly challenging day. The bus line geometries extracted from the GTFS file were forced to follow the 3D roads network moving the bus line point to the closest 3D road point using the GeoPandas Python package [25]. Then, using Shapely [26], the authors characterized each line with the total distance (subdivided by distance up and down) and with the elevation difference (distinguished in up and down).

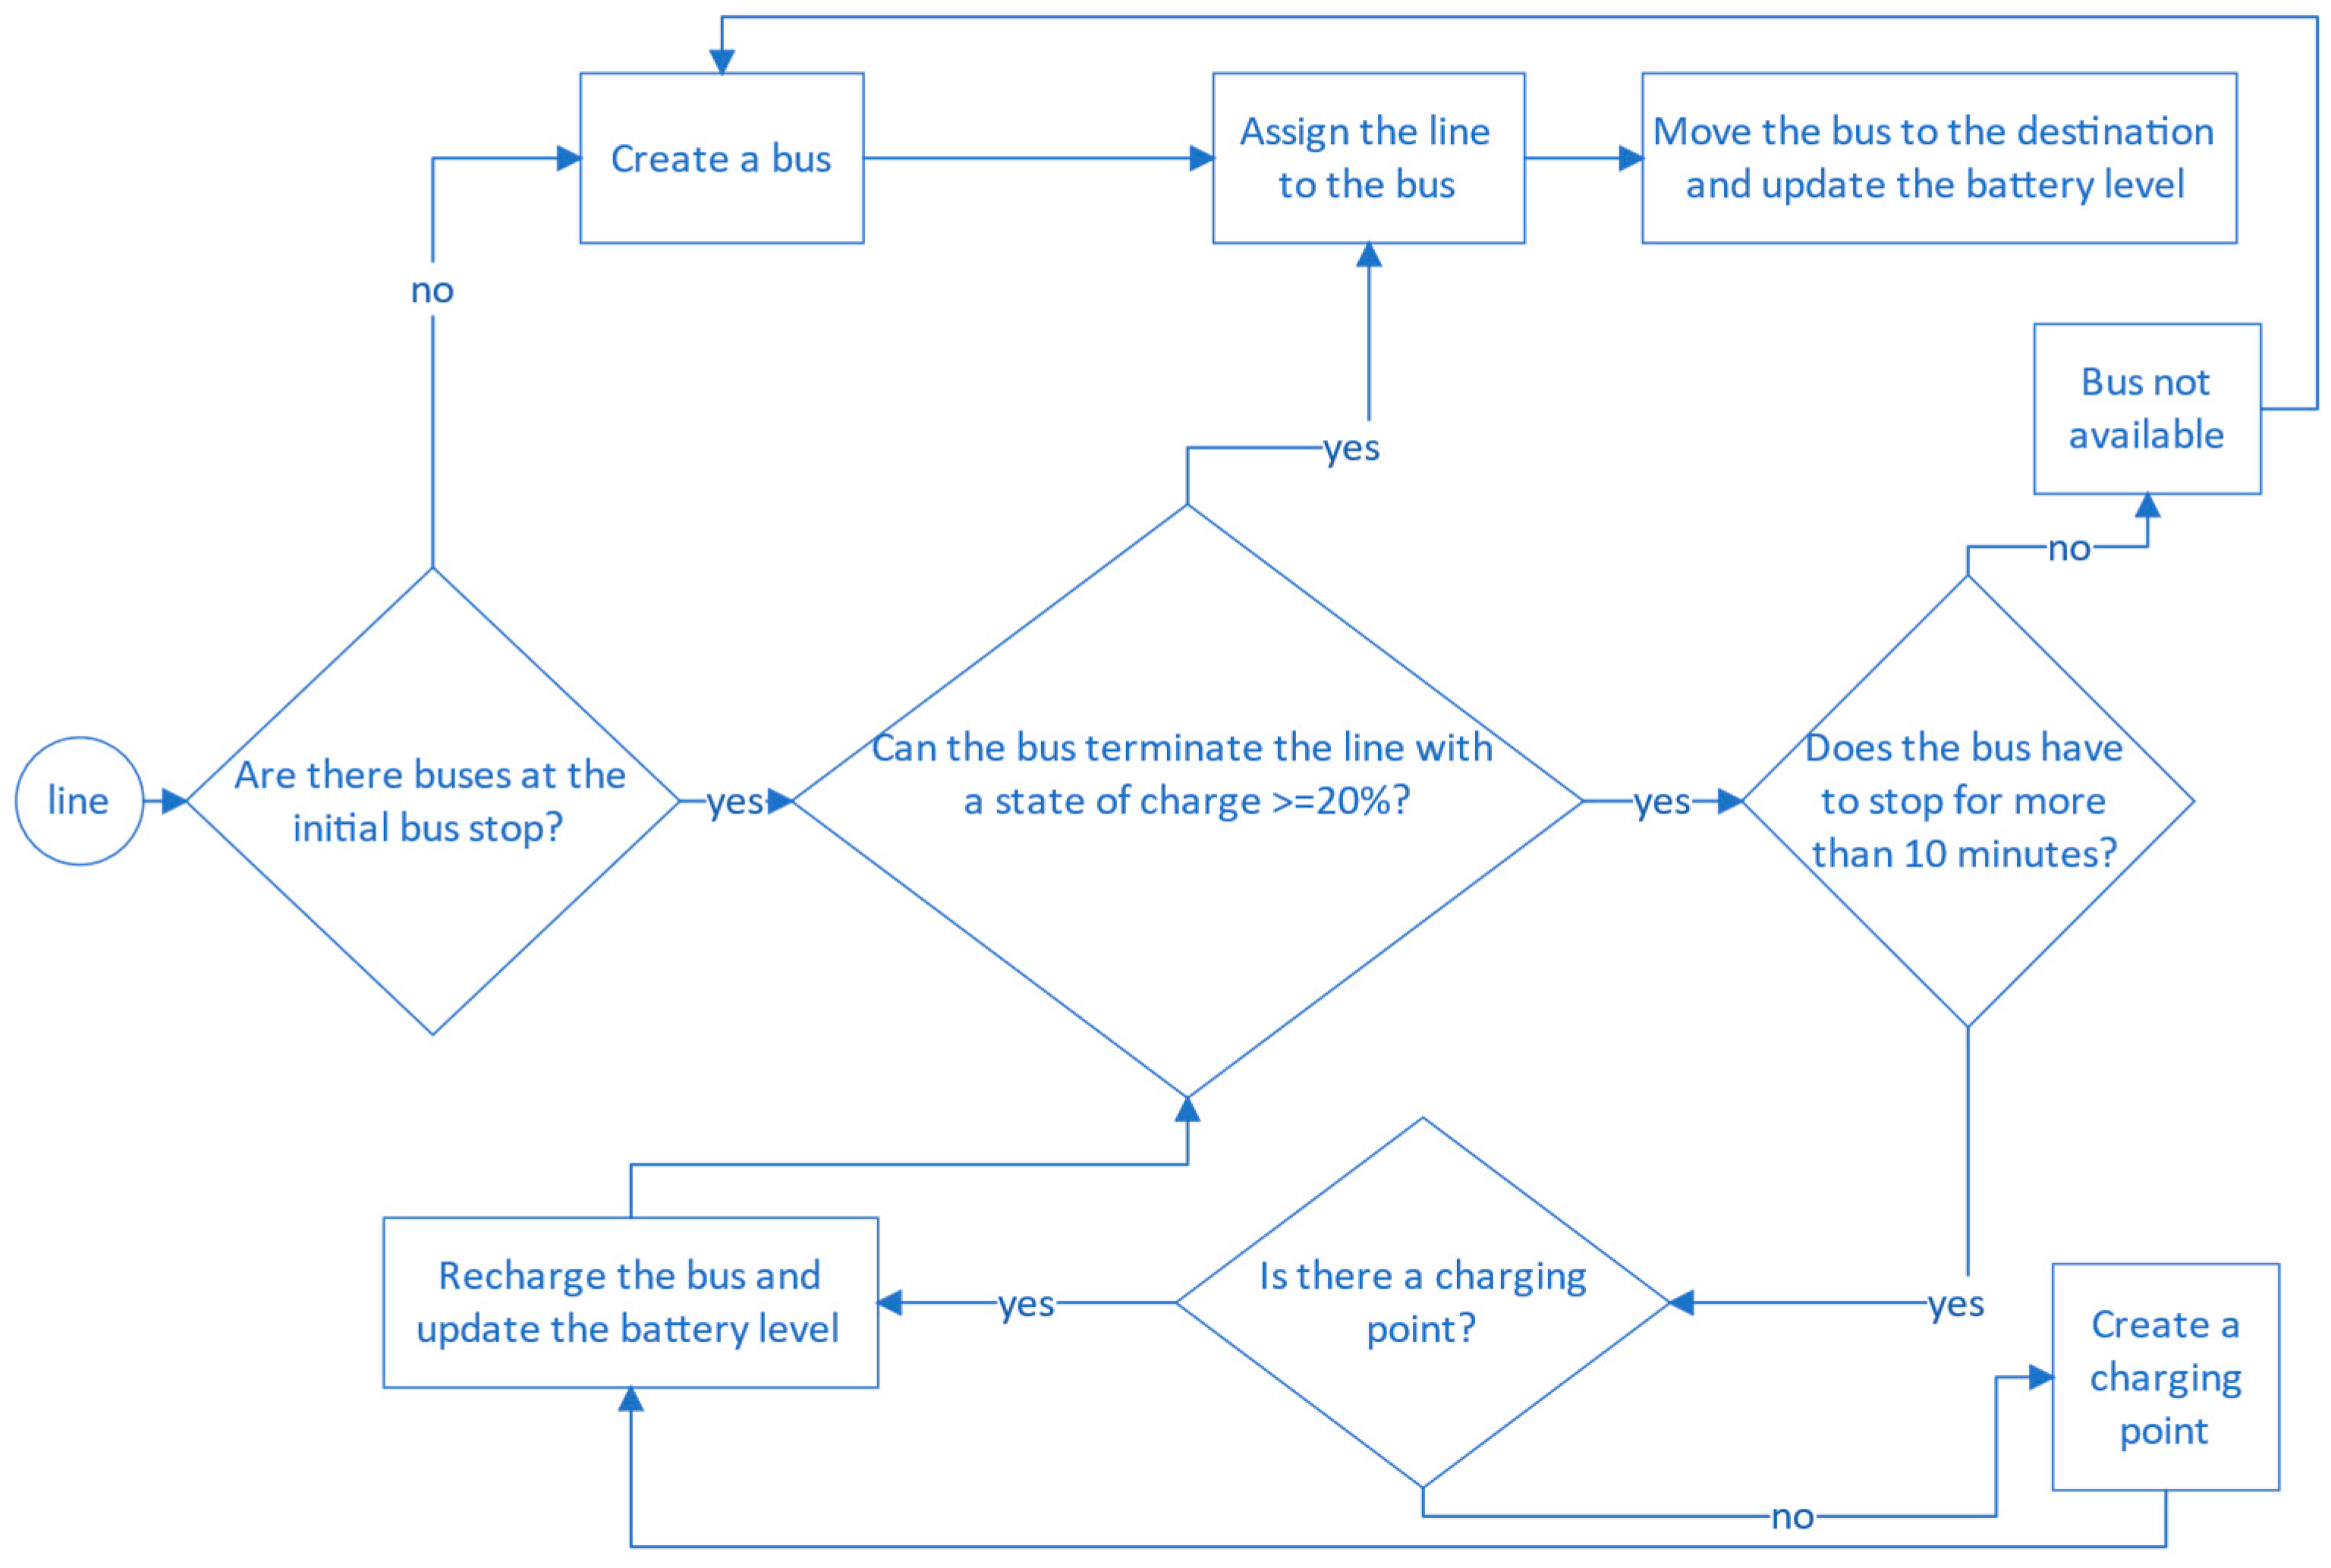
3.3. Vehicle Modelling and Assumptions

Formulas (1)–(4) provide the model used to calculate the energy consumption of electric and hydrogen buses. The model takes into account parameters such as distance travelled, height difference, vehicle weight, and climatic conditions to determine the energy required for a bus to travel a certain route. Route profiles, including total altitude difference and distance travelled uphill, downhill, and on flat terrain, are also factored in. However, traffic conditions, speed, and driver behavior are not considered due to lack of available data and the need for a different simulation model. The model also does not provide detailed information on the drive system components, which are included in the average energy consumption per kilometer used in the calculation.
The authors analyzed the bus schedule to record the cases where the stops were longer than 10 min. On the overall bus service, only 46 stops were registered. Therefore, it has been decided to ignore the stops within the line and to consider only the stops between one course and the next with a stopping time above 10 min as a potentially eligible chance to charge the bus.
The energy required by the bus to travel each line was assessed by performing a global energy balance for BEBs and FCEBs. The study aimed to assess the feasibility to move the full current public transport buses to ZEBs, therefore the analysis was conducted selecting conservative values and considering the worst conditions a bus could encounter. The energy balance was performed based on Formula (1).
E t o t = E d i s t + E u p E d o w n
where, Edist is the energy required to move the bus in a horizontal direction; and Eup and Edown are, respectively, the energy required by the bus to travel upwards and the energy that might be generated through the regenerative braking system travelling downwards. Formula (2) was applied to assess the energy due to the distance under conservative conditions.
E d i s t = c D l / η c l i m a
where, c is the specific consumption of the bus as specified by the bus model datasheet; the authors considered the kWh/km for the BEBs and the kgH2/km for the FCEBs as declared by bus model data sheet; Dl is the distance in km of the single bus line; and ηclima is the increased consumption per km due to the energy need of the space conditioning system. The actual energy consumption for space conditioning of the bus cabin can vary significantly in dependence of the outside temperature (heating or cooling need), outside air humidity (dehumidification need) and occupancy of the cabin (internal heat loads in the bus cabin reducing heating needs but enhancing cooling and air exchange needs). In the present analysis a simplified approach has been adopted inserting a fixed ηclima and choosing a conservative value so that on most days of the year the impact of the air conditioning system will be (relevantly) lower than assumed. For the BEBs, ηclima = 0.75 [27] as the efficiency of the heating system was considered and for the FCEBs, ηclima = 0.75 [28] as the efficiency of the cooling system (as for the heating system partially the use of the waste heat of the fuel cell has been considered, and therefore the cooling situation can be the more energy intensive one).
The energy required to travel up and down is defined by Formula (3).
E u p = g W b u s + W p e o p l e Δ u p / ( η u p η c l i m a )
where, g is the gravity force 9.81 m/s2; Wbus is the weight in kg of the empty bus; Wpeople is the weight in kg of the bus users calculated as the number of places available on the bus multiplied by an average weight per person of 70 kg; ∆up is the elevation difference in m; while ηup is the efficiency from battery to wheel. An efficiency of 0.85 [29] for the BEBs has been considered and 0.425 for the FCBs has been considered. The second is the result of 0.85 (battery to wheel) multiplied by the efficiency of the fuel cell (FC) to convert the hydrogen to electricity, which was considered to be 0.54 [30]; ηclima is the penalty to guarantee the comfort condition within the bus using 0.75 as in the previous formula.
The energy that might be generated through the regenerative braking system is assessed based on Formula (4):
E d o w n = g W b u s Δ d o w n ( η d o w n η c l i m a )
where, g is gravity, Wbus is the weight of the empty bus, ∆down is the elevation difference, ηdown is the efficiency from wheel to battery that was considered to be equal to 0.40 [31] for BEBs and FCEBs, and with ηclima of 0.75. A worst case assumption has been made, that the bus is full when going upwards and it is empty when going downwards (so max weight to be lifted up, and min possibility to recover energy travelling down) [31].
All BEBs in the simulation have an initial level of the battery (90%)/FCEBs a level of tank of (100%). The lower limit of the battery for the BEBs was set to be 15%, while for the FCEBs the lower limit of the tank level was set to be 5%. The simulation tool goes through the time schedule and for each line it checks if there is, in the initial/starting place, a bus, already available, with enough energy to complete the line; if yes, then the line will be assigned to the bus; if the bus that is available at the stop does not have enough energy, it checks if the bus stays at the bus stop for more than 10 min; if yes, then it creates a recharging/refueling point, then it checks if the energy in the battery/hydrogen in the tank is enough to complete the line after 10 min; if yes it assigns the line to the bus, if not it is marked that the bus is not available, it checks the next bus or creates a new one. Figure 2 shows the algorithm that describes the tool’s decision-making process.
As no specific data on the actual operation of the vehicles were available at the time of the study, it was assumed that each vehicle is “dedicated” to one single line only.
The simulation was executed under three different operative conditions. The first condition simulates the option to recharge the bus only during the night. The second condition simulates to recharge whenever the bus remains at the destination for a time longer than 10 min. The third condition follows the second one but reduces the recharge of the bus to the situation where battery/tank level is below 40%.
The recharging of the battery/tank is explained in Formula (5).
E r e c h a r g e = E f l o w T s t o p η r e c h a r g e
where, E f l o w is considered to be 150 kWh/3600 s = 0.04167 kWh/s for the BEBs and of 0.075 kgH2/s for the FCBs as recharging/refueling of the bus. This flow is multiplied by T s t o p , the number of seconds (rounded to the floor minutes) that the bus stays on the bus stop, multiplied by η r e c h a r g e , the recharge efficiency of the system (95% for the BEBs and 100% for the FCBs have been considered).

4. Results

4.1. Vehicle Study

In this section the results regarding the vehicle simulations are presented (Table 2). In particular, motor power presented a range between 150 and 350 kW for both FCBs and BEBs, similar to the actual diesel bus fleet [32].

4.2. Road Network

In the following, the results of the analysis of the road network and the energy consumption by BEBs and FCEBs in order to run the single bus lines are shown.
Each line of the bus network has been characterized by the distance and the elevation difference; Figure 3 shows the scatterplot of the bus lines considering these two variables. As can be seen, the maximum distance is less than 60 km, while the maximum elevation difference is slightly above 1750 m. The points are concentrated in the lower and left parts of the graph, where the elevation difference is small (0 to 250 m) and the distance is short (0 to 30 km).
Based on the formula described in the methodology section, the authors assessed the required energy of each line to guarantee the service under cautious conditions. Figure 4 displays the distribution of energy consumption for BEBs expressed in kWh/km for various lines (including variations of the main ones). The most frequent case is a specific energy consumption of around 3 kWh/km.
Figure 5 shows the energy consumption for each cluster (very low, low, medium, high and very high) of round-trip bus lines, taking into account the length of each line. Market-available energy storage sizes are shown in gray. As can be seen, most of the lines can be served by bus types using batteries with limited capacity (very low, low, and medium clusters of round-trip bus lines), while all the lines can be covered by buses with larger capacities available on the market (high and very high clusters of round trip bus lines), while for the FCEBs, all the bus lines can be covered by the tank capacity that is installed in the buses available on the market.
The average value of energy required for the line round trip is 139.8 kWh and 9.1 kg H2 for BEBs and FCEBs, respectively, while the maximum energy demand is 508.9 kWh and 32.5 kg H2.

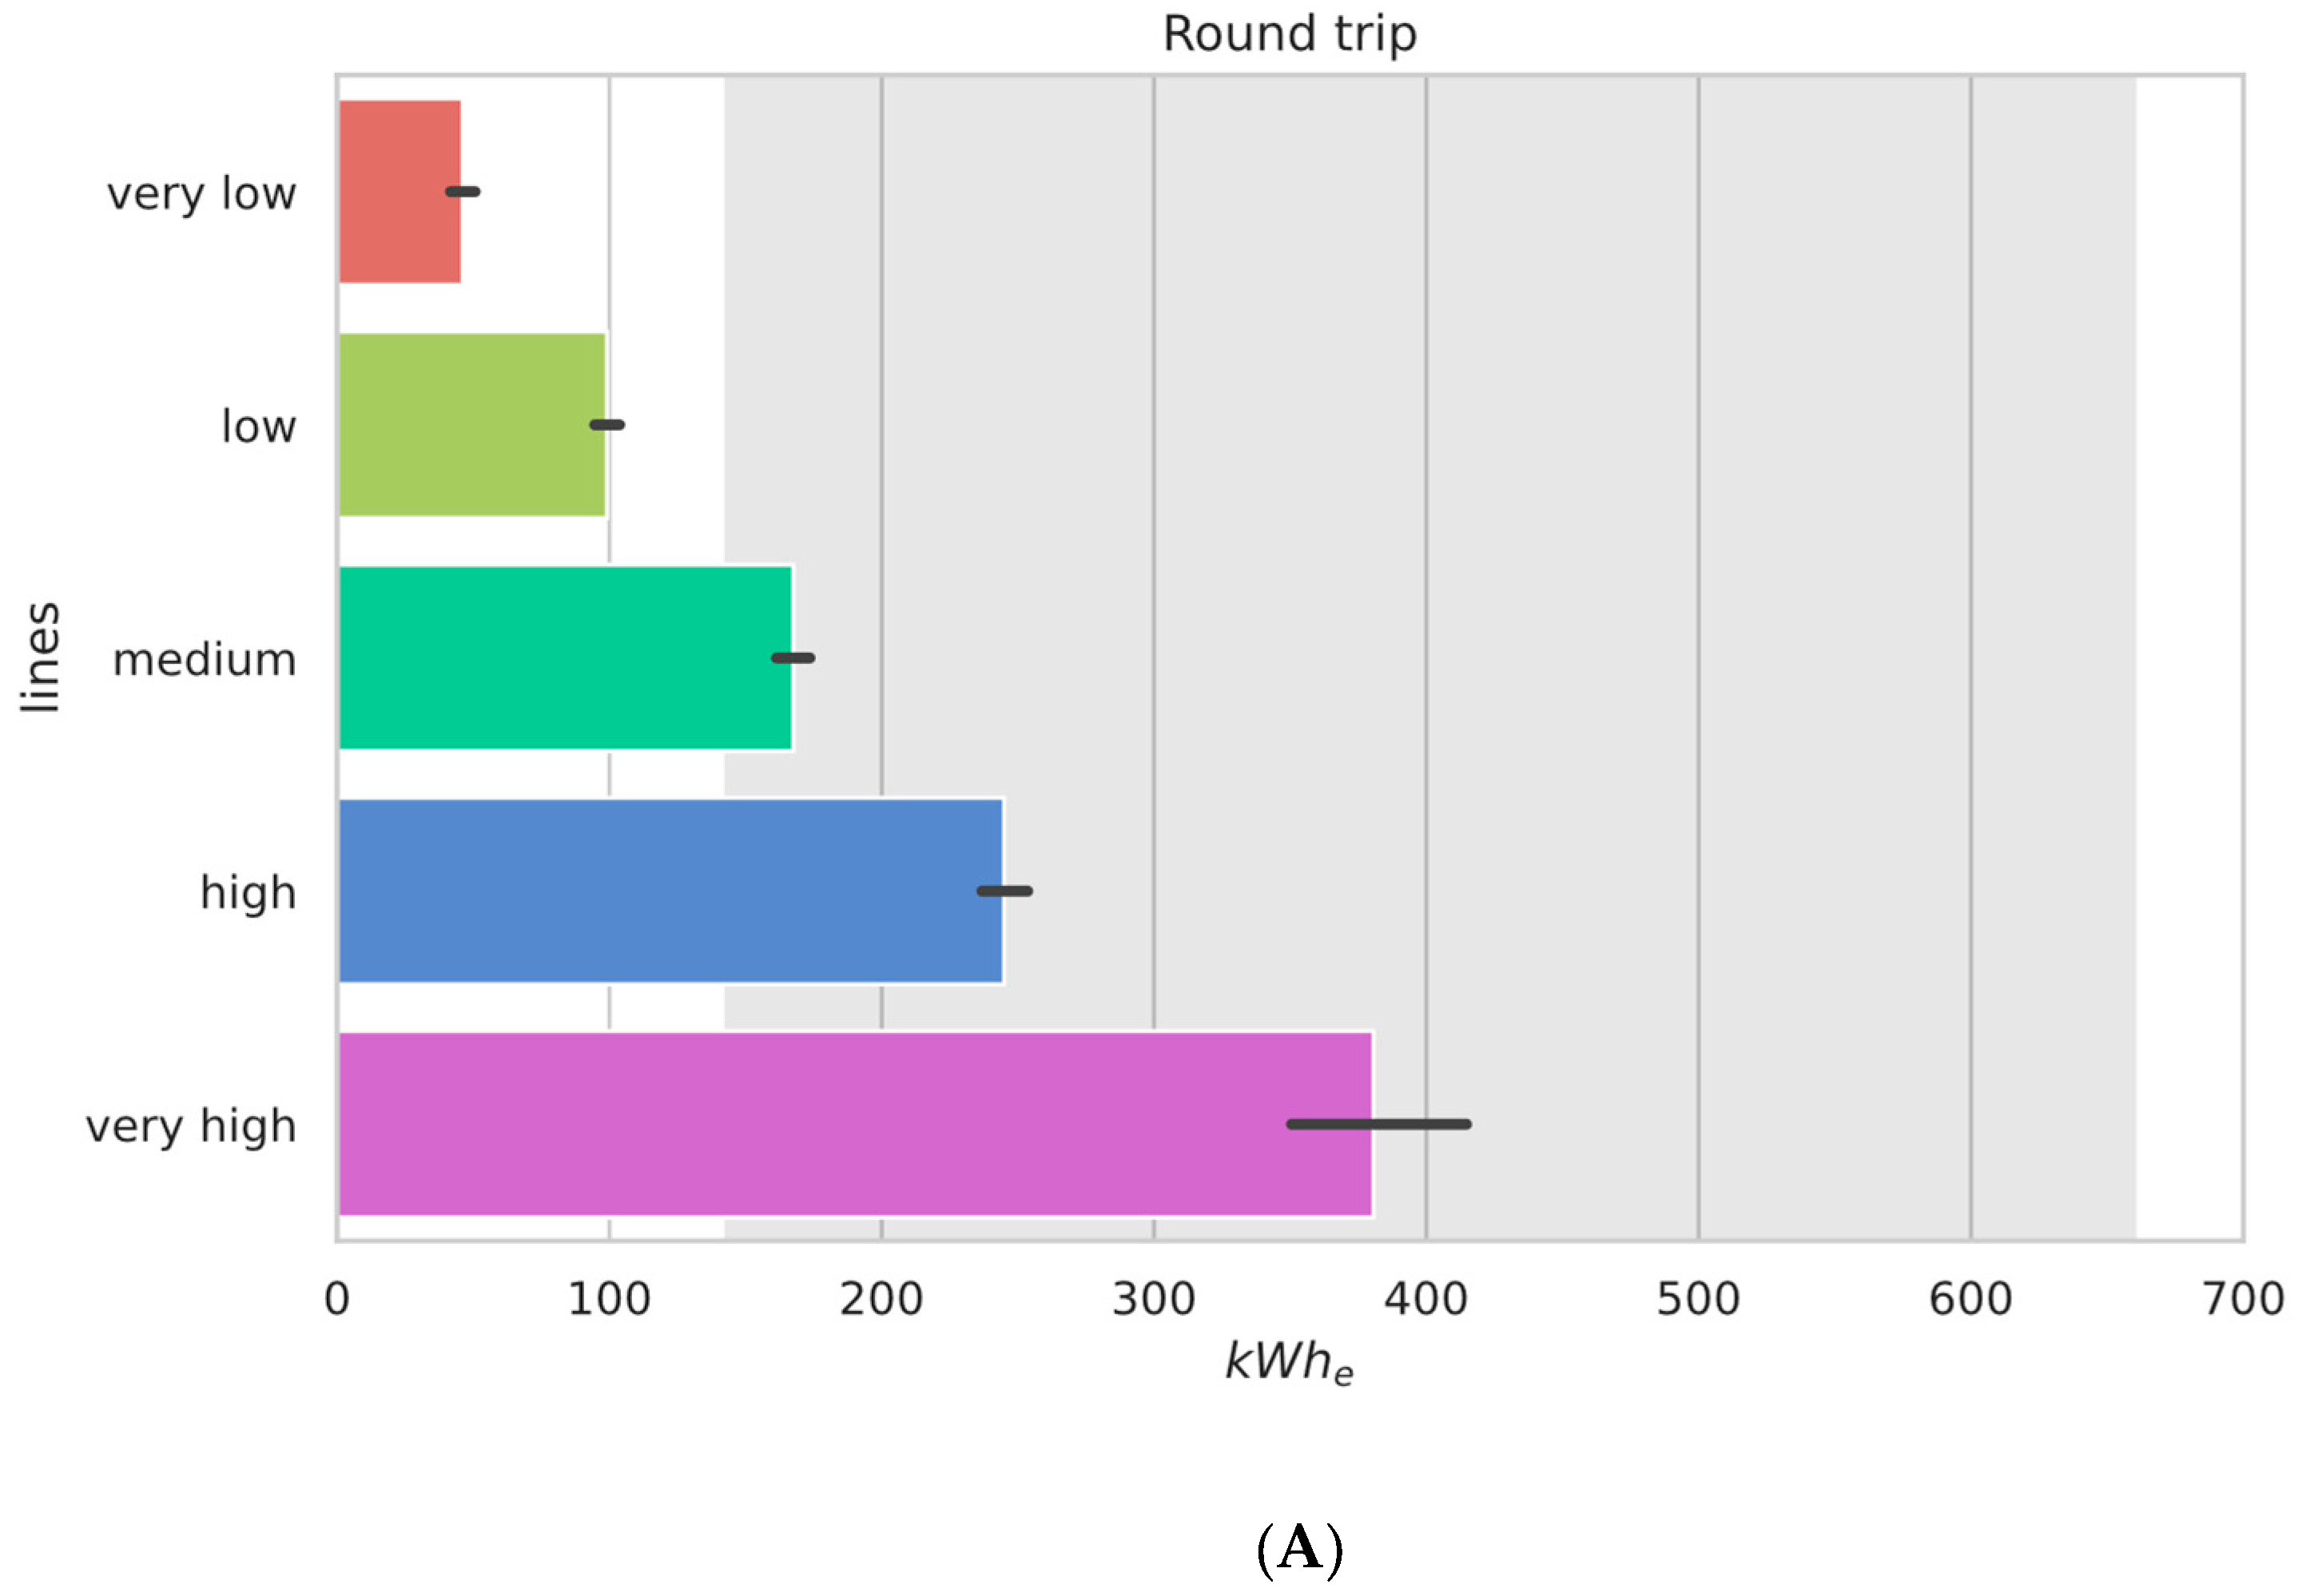
4.3. Modelling Buses Driving the Single Trips and Assumptions

As described in Section 3, three different recharging options were simulated. Based on these assumptions it was defined how many buses [32,33] are required to guarantee the bus service for a full day, for a specific line, based on different recharging options. The single recharging options can have an impact on the number of buses needed, and if only overnight charging is allowed, more buses are needed than if opportunity charging is also allowed. Figure 6 shows an example of state of charge considering the third simulation option, where opportunity charging is allowed if the battery level is below 40%. As can be seen, the bus starts the journey with the battery level at 90% and is discharging during the day, arriving at the final destination several times, around 14:00 o’clock the battery level goes below the 40% limit and as the stop was longer than 10 min, the bus status is changed to recharge.
The maximum energy required by the bus line round trip is less than the maximum capacity of the batteries and tanks of the buses on the market. Figure 7 illustrates how many lines can be covered by BEBs (A) and FCEBs (B) if a full charge is made during the night, multiple charges during the day, or whether it is necessary to increase the number of buses compared with the equivalent diesel system. With both technologies, more than 78% of the lines can be covered with the same number of buses. With both technologies, slightly more than 20% of the lines require more buses to guarantee service. Altogether, around 6% more buses are required, independent of the technology chosen (BEBs of FCEBs). In the case of FCEBs, a relevant larger number of trips can be covered with only overnight charge (41%) in comparison to BEBs (24%).
The simulation tool also estimates the number of recharge stations and hydrogen refueling points required by the regional buses. Following the used model for the BEBs the recharge infrastructure obtained is of 223 recharging stations assuming 150 kW of power capacity, while for the FCEBs the required recharge stations are 206, which become 21 if the identified stations are aggregated and clustered using a radius distance of 15 km. In fact, as the cost of hydrogen stations is relevant and at present in South Tyrol only two hydrogen refueling stations exist, it was considered as very unlikely that within a radius of 15 km several hydrogen refueling stations would be set up.

5. Discussions and Conclusions

This study evaluates the possibility to transfer extra-urban bus services in an Alpine region (South Tyrol—northern Italy) from diesel buses to battery electric buses (BEBs) or fuel cell electric buses (FCEBs).
For this purpose, a model has been set up based on the vehicle’s energy balance. Herewith the energy consumption is evaluated based on the physical characteristics of the single bus line (distance and altitude), climatic conditions, and its timetables. As such, the model can be implemented in mountainous areas and on intercity lines allowing the specific energy consumption.
A detailed study has been performed to digitize all bus lines in the region by correcting more than three million points in the digital maps (tunnels, bridges, etc.). From the analyses carried out, the average distance of the lines resulted in 17 km (max: 55 km) with an average height difference of 300 hm (max: 1786 hm). Each line (distance and height difference) was transformed into energy consumed for the specific technology. The average energy required for the outward and return of the buses on the lines resulted in 139.8 kWh for BEBs and 9.1 kg H2 for FCEBs with a maximum consumption of 508.9 kWh and 32.5 kg H2, respectively. In the very conservative calculation (assuming full bus upwards, empty bus downwards, and difficult climatic conditions) the average consumption is estimated to be 3.8 kWh/km for BEBs and 0.25 kg/km for FCEBs.
Based on the market research of available bus models and the calculated specific energy consumption, the authors conclude that 100% of the lines can be completed in a single round trip with both electric buses (higher performance models) and fuel cell buses. As the routine schedule foresees some stops of more than 10 min (which allows an electric bus to recharge), in around 80% of the cases one diesel bus can be replaced by one electric/fuel cell bus. For the remaining 20%, an increase of 6% in the number of available buses is necessary to guarantee the same time schedule. The numbers of BEBs and FCEBs needed to substitute the diesel ones could eventually be lower as the estimated energy consumption in this study was precautionary and the range of electric and hydrogen vehicles is gradually increasing due to technological progress.
The authors’ initial hypothesis that longer distances in mountainous areas can only be covered by FCEBs, while shorter ones by both FCEB and BEB, was not confirmed in this study, as there was no significant difference in the distance covered in mountainous areas by BEBs versus FCEBs. In fact, one aspect underestimated before the study was the enhanced energy recovery capacity by BEBs in comparison to FCEBs driving downwards based on the much larger battery capacity of the vehicle.
In order to guarantee the bus service under all conditions and with unchanged timetables in comparison to the current situation, the simulation led to over 200 charging points located in depots and stops where more than 10 min breaks allow (at least partial) recharge. In the case of FCEBs the resulted number of hydrogen refueling stations was very similar. The clustering of recharge/refueling stations substantially reduces the number of stations required by the regional transport system. In the case of hydrogen and considering a clustering radius of 15 km, the number drops from over 200 to 21 refueling stations.
The presented method was developed and applied for one specific region (Italian Alps) and one specific case study (extra-urban bus fleet in South Tyrol), but is considered as generally suitable for PTCs for the evaluation of the possibility to switch a fossil fuel bus fleet to BEBs and FCEBs and the related infrastructure needed. It is not limited to bus fleets but can be applied to all kind of fleets that cover clearly defined routes on a daily basis (such as logistics in the food sector, medical sector, goods transportation to stores, etc.).
Regarding the specific energy consumption/km it was noted from the beginning of the project that monitoring data on the specific lines under all conditions (winter/summer, bus loaded/unloaded) is needed in order to validate the presented assumptions and to enhance the model’s results. Such data at that time were not available. Monitoring data from the LifeAlps project [34] for the years 2021 and 2022 for over 20 buses in service in South Tyrol on specific lines are available [35]. A direct comparison of the data sets is not possible, but the results show an average consumption which is 50% lower than the one resulting from the simulations under conservative assumptions for both technologies—battery electric and fuel cell electric buses. Detailed evaluations on this dataset will follow in future works.
If further data will confirm a lower average and max consumption it suggests that a technology shift to zero emission buses will require fewer charging stations/refueling stations and less lines requiring more ZEB buses than diesel buses currently in service.

Author Contributions

Conceptualization, W.S., P.Z. and A.Z.; methodology, W.S. and P.Z.; software, P.Z.; validation, R.V.; formal analysis, W.S., A.G., P.Z. and R.V.; investigation, A.G. and P.Z.; data curation, W.S., A.G., P.Z. and R.V.; writing—original draft, W.S., A.G., P.Z., R.V. and A.Z.; writing—review and editing, W.S., A.G. and A.Z.; visualization, P.Z.; supervision, A.Z.; funding acquisition, W.S. All authors have read and agreed to the published version of the manuscript.

Funding

This research received no external funding.

Data Availability Statement

Not applicable.

Acknowledgments

The authors would like to acknowledge STA for the commissioning of the study and the fruitful cooperation. Additionally, they acknowledge the public transportation company SASA for the fruitful discussion on bus line services in South Tyrol and the EU commission for the support of the LifeAlps project allowing future detailed monitoring evaluations.

Conflicts of Interest

The authors declare no conflict of interest.

References

  1. IEA Licence: CC BY 4.0 Transport Sector CO2 Emissions by Mode in the Sustainable Development Scenario, 2000–2030. Available online: https://www.iea.org/data-and-statistics/charts/transport-sector-co2-emissions-by-mode-in-the-sustainable-development-scenario-2000-2030 (accessed on 20 December 2022).
  2. Aldenius, M.; Mullen, C.; Pettersson-Löfstedt, F. Electric Buses in England and Sweden—Overcoming Barriers to Introduction. Transp. Res. D Transp. Environ. 2022, 104, 103204. [Google Scholar] [CrossRef]
  3. Mahmoud, M.; Garnett, R.; Ferguson, M.; Kanaroglou, P. Electric Buses: A Review of Alternative Powertrains. Renew. Sustain. Energy Rev. 2016, 62, 673–684. [Google Scholar] [CrossRef]
  4. Muñoz, P.; Franceschini, E.A.; Levitan, D.; Rodriguez, C.R.; Humana, T.; Correa Perelmuter, G. Comparative Analysis of Cost, Emissions and Fuel Consumption of Diesel, Natural Gas, Electric and Hydrogen Urban Buses. Energy Convers. Manag. 2022, 257, 115412. [Google Scholar] [CrossRef]
  5. Müller, K.K.; Schnitzeler, F.; Lozanovski, A.; Skiker, S.; Ojakovoh, M. Clean Hydrogen in European Cities (CHIC)—Deliverable No. 5.3—Final Report; 2017. Available online: https://fuelcellbuses.eu/public-transport-hydrogen/final-report-chic-clean-hydrogen-european-cities (accessed on 23 November 2022).
  6. ASTAT Popolazione|Istituto Provinciale di Statistica|Provincia Autonoma di Bolzano—Alto Adige. Available online: https://astat.provincia.bz.it/it/popolazione.asp (accessed on 10 February 2023).
  7. Green Mobility Mobilità Sostenibile|Mobilità|Provincia Autonoma di Bolzano—Alto Adige. Available online: https://www.provincia.bz.it/turismo-mobilita/mobilita/mobilita-sostenibile.asp (accessed on 10 February 2023).
  8. Alto Adige Province Piano Clima Alto Adige 2040. Available online: https://ambiente.provincia.bz.it/piano-clima-energia-alto-adige-2050.asp (accessed on 12 January 2023).
  9. Papa, G.; Santo Zarnik, M.; Vukašinović, V. Electric-Bus Routes in Hilly Urban Areas: Overview and Challenges. Renew. Sustain. Energy Rev. 2022, 165, 112555. [Google Scholar] [CrossRef]
  10. Logan, K.G.; Nelson, J.D.; Hastings, A. Electric and Hydrogen Buses: Shifting from Conventionally Fuelled Cars in the UK. Transp. Res. Part D Transp. Environ. 2020, 85, 102350. [Google Scholar] [CrossRef]
  11. Hensher, D.A.; Wei, E.; Balbontin, C. Comparative Assessment of Zero Emission Electric and Hydrogen Buses in Australia. Transp. Res. Part D Transp. Environ. 2022, 102, 103130. [Google Scholar] [CrossRef]
  12. Correa, G.; Muñoz, P.M.; Rodriguez, C.R. A Comparative Energy and Environmental Analysis of a Diesel, Hybrid, Hydrogen and Electric Urban Bus. Energy 2019, 187, 115906. [Google Scholar] [CrossRef]
  13. Kunith, A.; Mendelevitch, R.; Goehlich, D. Electrification of a City Bus Network—An Optimization Model for Cost-Effective Placing of Charging Infrastructure and Battery Sizing of Fast-Charging Electric Bus Systems. Int. J. Sustain. Transp. 2017, 11, 707–720. [Google Scholar] [CrossRef] [Green Version]
  14. Hulagu, S.; Celikoglu, H.B. Electrified Location Routing Problem with Energy Consumption for Resources Restricted Archipelagos: Case of Buyukada. In 2020 Forum on Integrated and Sustainable Transportation Systems, FISTS; Institute of Electrical and Electronics Engineers Inc.: Piscataway, NJ, USA, 2020; pp. 323–327. [Google Scholar]
  15. Shao, S.; Tan, Z.; Liu, Z.; Shang, W. Balancing the GHG Emissions and Operational Costs for a Mixed Fleet of Electric Buses and Diesel Buses. Appl. Energy 2022, 328, 120188. [Google Scholar] [CrossRef]
  16. El-Taweel, N.A.; Farag, H.E.Z.; Mohamed, M. Integrated Utility-Transit Model for Optimal Configuration of Battery Electric Bus Systems. IEEE Syst. J. 2020, 14, 738–748. [Google Scholar] [CrossRef]
  17. Zhou, Y.; Meng, Q.; Ong, G.P. Electric Bus Charging Scheduling for a Single Public Transport Route Considering Nonlinear Charging Profile and Battery Degradation Effect. Transp. Res. Part B Methodol. 2022, 159, 49–75. [Google Scholar] [CrossRef]
  18. Mohamed, M.; Farag, H.; El-Taweel, N.; Ferguson, M. Simulation of Electric Buses on a Full Transit Network: Operational Feasibility and Grid Impact Analysis. Electr. Power Syst. Res. 2017, 142, 163–175. [Google Scholar] [CrossRef]
  19. Estrada, M.; Mensión, J.; Salicrú, M.; Badia, H. Charging Operations in Battery Electric Bus Systems Considering Fleet Size Variability along the Service. Transp. Res. Part C Emerg. Technol. 2022, 138, 103609. [Google Scholar] [CrossRef]
  20. Wei, R.; Liu, X.; Ou, Y.; Kiavash Fayyaz, S. Optimizing the Spatio-Temporal Deployment of Battery Electric Bus System. J. Transp. Geogr. 2018, 68, 160–168. [Google Scholar] [CrossRef]
  21. MIT Ministero Delle Infrastrutture e dei Trasporti. Available online: https://www.governo.it/it/ministeri/ministero-delle-infrastrutture-e-dei-trasporti (accessed on 10 February 2023).
  22. European Commission EUROPA—Environment—Air Quality—NEBEI Workshop. Available online: https://ec.europa.eu/environment/archives/clean_bus/ (accessed on 10 February 2023).
  23. GRASS GIS V.Drape—GRASS GIS Manual. Available online: https://grass.osgeo.org/grass82/manuals/v.drape.html (accessed on 10 February 2023).
  24. The SciPy Community Scipy.Interpolate.Interp1d—SciPy v1.10.0 Manual. Available online: https://docs.scipy.org/doc/scipy/reference/generated/scipy.interpolate.interp1d.html (accessed on 10 February 2023).
  25. Jordahl, K.; Van den Bossche, J.; Fleischmann, M.; Wasserman, J.; McBride, J.; Gerard, J.; Tratner, J.; Perry, M.; Badaracco, A.G.; Farmer, C.; et al. Geopandas/Geopandas: V0.8.1; Zenodo: Geneve, Switzerland, 2020. [Google Scholar] [CrossRef]
  26. GiTHuB GitHub—Shapely/Shapely: Manipulation and Analysis of Geometric Objects. Available online: https://github.com/shapely/shapely (accessed on 10 February 2023).
  27. Göhlich, D.; Kunith, A.; Ly, T. Technology Assessment of an Electric Urban Bus System for Berlin. WIT Trans. Built Environ. 2014, 138, 137–149. [Google Scholar] [CrossRef] [Green Version]
  28. NAF 20 Popular EVs Tested in Norwegian Winter Conditions|NAF. Available online: https://www.naf.no/elbil/aktuelt/elbiltest/ev-winter-range-test-2020/ (accessed on 10 February 2023).
  29. Chanpeng, W.; Hachanont, P. Design of Efficient In-Wheel Motor for Electric Vehicles. Energy Procedia 2014, 56, 525–531. [Google Scholar] [CrossRef] [Green Version]
  30. Dodds, P.E.; Staffell, I.; Hawkes, A.D.; Li, F.; Grünewald, P.; McDowall, W.; Ekins, P. Hydrogen and Fuel Cell Technologies for Heating: A Review. Int. J. Hydrogen Energy 2015, 40, 2065–2083. [Google Scholar] [CrossRef] [Green Version]
  31. Ranta, M.; Pihlatie, M.; Pellikka, A.P.; Laurikko, J.; Rahkola, P.; Anttila, J. Analysis and Comparison of Energy Efficiency of Commercially Available Battery Electric Buses. In Proceedings of the 2017 IEEE Vehicle Power and Propulsion Conference, VPPC, Belfort, France, 11–14 December 2017; pp. 1–5. [Google Scholar] [CrossRef]
  32. Van Hool Van Hool Ships the First CX45E Electric Coach to the US.|Van Hool. Available online: https://www.vanhool.com/en/news-fairs/van-hool-ships-the-first-cx45e-electric-coach-to-the-us (accessed on 10 February 2023).
  33. Proterra The Proterra ZX5 Electric Transit Bus|Proterra. Available online: https://www.proterra.com/products/transit-buses/ (accessed on 10 February 2023).
  34. Zero Emission LIFEIP per una Mobilità Sostenibile—LIFEalps. Available online: https://www.life-alps.eu/it/ (accessed on 10 February 2023).
  35. Estrada Poggio, A.; Balest, J.; Zubaryeva, A.; Sparber, W. Monitored Data and Social Perceptions Analysis of Battery Electric and Hydrogen Fuelled Buses in Urban and Suburban Areas. J. Energy Storage 2023. manuscript submitted for publication. [Google Scholar]
Figure 1. Bus lines analyzed in the case study of South Tyrol province, Italy.
Wevj 14 00091 g001
Figure 2. The algorithm that describes the tool’s decision-making process.
Wevj 14 00091 g002
Figure 3. Statistical analysis of the network: elevation difference vs. distance.
Wevj 14 00091 g003
Figure 4. Distribution of energy consumption for various bus lines.
Wevj 14 00091 g004
Figure 5. Energy required for each cluster of round-trip bus lines, the background dark grey color shows the battery capacity available on the market for BEBs (A) and the tank capacity available for the FCEBs (B). The number of lines for each cluster are not equally distributed. In fact, 9 lines are in the purple cluster, 17 in the blue cluster, 31 in the green cluster, and, respectively, 65 and 102 in the light green and the red cluster.
Wevj 14 00091 g005aWevj 14 00091 g005b
Figure 6. An example of the state of charge of a bus during the day travelling a specific line is shown. Each color represents a bus, the different line styles represent the bus status: the continuous line is the bus that is going to its destination (H), the dotted line is the bus that is on its way back to the origin (R), and dashed line is the bus that is waiting and/or recharging (recharge).
Wevj 14 00091 g006
Figure 7. Number of lines that can be covered by BEBs (a) and FCEBs (b) with a full recharge during the night, multiple recharges during the day, and by increasing the number of buses with respect to the bus required by a diesel equivalent system.
Wevj 14 00091 g007aWevj 14 00091 g007b
Table 1. Bus classification used in ZEB model analysis.
ClassDescription
C1vehicles built with areas designed primarily for standing passengers (normally employed in urban areas), with more than 22 passengers
C2vehicles designed primarily to carry seated passengers, designed so that standing passengers can also be transported in the aisle and/or designated area (normally employed in urban and suburban areas), with more than 22 passengers
C3vehicles built with areas designated for seated passengers only, also referred to as “coach”, with more than 22 passengers
Table 2. Vehicle study parameters.
Parameters/Vehicle TypeBEBFCEB
Energy storage150–650 kWhBattery capacity: 40–120 kWh
H2 storage: 30–38 kg
Range200–370 km300–400 km
Motor power140–350 kW140–350 kW
Specific consumption0.7–1.4 kWh/km0.085–0.1 kg/km
Weight14,000–27,000 kg20,000 kg
Disclaimer/Publisher’s Note: The statements, opinions and data contained in all publications are solely those of the individual author(s) and contributor(s) and not of MDPI and/or the editor(s). MDPI and/or the editor(s) disclaim responsibility for any injury to people or property resulting from any ideas, methods, instructions or products referred to in the content.

