Metrological Validation of Pixhawk Autopilot Magnetometers in Helmholtz Cage


1
Area of Cartographic Engineering and Geodesy, Department of Natural Resources and Environmental Engineering, School of Aerospace Engineering, University of Vigo, 32004 Ourense, Spain
2
AtlanTTic, Aerospace Technology Research Group, University of Vigo, 36310 Vigo, Spain
3
School of Aerospace Engineering, University of Vigo, 32004 Ourense, Spain
*
Author to whom correspondence should be addressed.
World Electr. Veh. J. 2022, 13(5), 85; https://doi.org/10.3390/wevj13050085
Submission received: 16 March 2022
/
Revised: 23 April 2022
/
Accepted: 5 May 2022
/
Published: 11 May 2022
Abstract
:The use of drones is very extended for multiple applications. Some of them impose attitude and navigation requirements that need appropriate measurements. Pixhawk is an open-source autopilot used on board drones that includes a magnetometer as part of its inertial measurement unit. A testing facility based on a Helmholtz cage is used to evaluate the metrological features of different magnetometer units. The first test induces a magnetic field rotation around six different Pixhawk magnetometers, simulating changes in attitude and course for a drone. The data show a standard deviation higher than 250 mG, in comparison with the standard deviation of 30 mG in the standard gaussmeter model HMR2300. The second test is focused on the stability of the magnetometer, where the Helmholtz cage simulates a certain flight altitude and course. Values obtained from Pixhawk magnetometers range between 25 mG and 116 mG for the highest peak-to-peak magnetic field amplitude, while the standard gaussmeter range is only between 1.3 mG to 5.4 mG. Considering these results, it is possible to determine the limitations of the Pixhawk autopilot magnetometer, both in terms of manufacturing tolerances and measuring stability. Therefore, users should be very careful when using this type of autopilot in professional applications that require precision and safety.
1. Introduction
Unmanned aerial vehicles (UAV), also known as drones, are systems with a wide range of applications, both in military and civil sectors. Although they appeared in the early 20th century for military purposes, it was not until the 1990s that NASA began to focus on UAV research for civil applications [1]. Since then, and most specifically in the 21st century, the civil use of drones has rapidly increased in several fields due to their low maintenance cost, high mobility, easy deployment and ability to hover, as well as their reduction of manufacturing cost because of the technological development and software implementation [2,3]. The most important civil applications of drones are related to remote sensing, infrastructure inspection, spraying systems for precision agriculture and logistics [4,5].
For UAV operation success, an accurate and robust autopilot is fundamental. The autopilot is in charge of UAV guidance during flights, limiting human operation [6]. An autopilot system should provide the hardware and software required to achieve different functions from the operational point of view. These functions are related with attitude control, way-point flight or landing and taking off operations, among others. Different elements needed for this are power management modules, on-board computers, communication links and different systems such as pressure sensors, Global Navigation Satellite System (GNSS) and inertial measurement units (IMUs). This last element includes different sensors such as gyroscopes, accelerometers and magnetometers [7,8]. In terms of software, autopilots usually include mission and trajectory planning, trajectory generation and control and digital signal processing.
Pixhawk is an open-source autopilot used in research, amateur and industrial sectors, providing advantages and disadvantages, like other open-source projects. The main benefit is the opportunity for users to adapt the system to their specific requirements, whereas one weak point is the quality control, as there is not a third-party company to provide aerospace certification and evaluate its metrological characteristics [7,9]. One of the sensors included in a Pixhawk autopilot is the magnetometer, which is used to measure the magnetic field in three axes, providing information about the course, attitude and location in space, increasing, in this way, the accuracy of the IMU [10,11].
Magnetometers can be analyzed using a Helmholtz cage-based facility. A Helmholtz cage consists of a pair of coils parallel to each other with a number of N wrappings per coil, which creates a uniform and controlled magnetic field between them for a certain current intensity. Using three orthogonal Helmholtz coils, which can be circular or squared, the magnetic field can be controlled in space [12]. There are several studies related with the use of this type of facility for small satellite testing, some focused on the design, implementation and testing of an Earth magnetic field simulator [13] and others that outline a procedure for calibrating and testing small satellite magnetometers and analyze the magnetic interference of on-board electrical activity [14]. Other examples discuss the idea of an implementable software-in-the-loop testing procedure for attitude determination systems, showing testing results using Pixhawk sensors to measure different variables and use them for attitude determination [15].
The aim of this work is the metrological analysis of the magnetometers placed on different Pixhawk devices by using a Helmholtz cage-based facility, considering tests related with magnetic field stability, for a constant drone altitude and course, and tests related with a rotational magnetic field, simulating a course or attitude change. This paper improves the characterization of on-board sensors, which is fundamental to determining the accuracy of attitude determination and subsequently the guidance, navigation and control of drone flight. The manuscript is organized as follows. First, materials and methods are listed, defining different components of the testing facility, the main characteristics of all Pixhawk devices used as well as the ground control station software and measurement procedures. Section 3 presents the numerical and graphical results obtained for these tests. Finally, conclusions of the paper are given.
2. Materials and Methods
2.1. Materials
2.1.1. Testing Facility
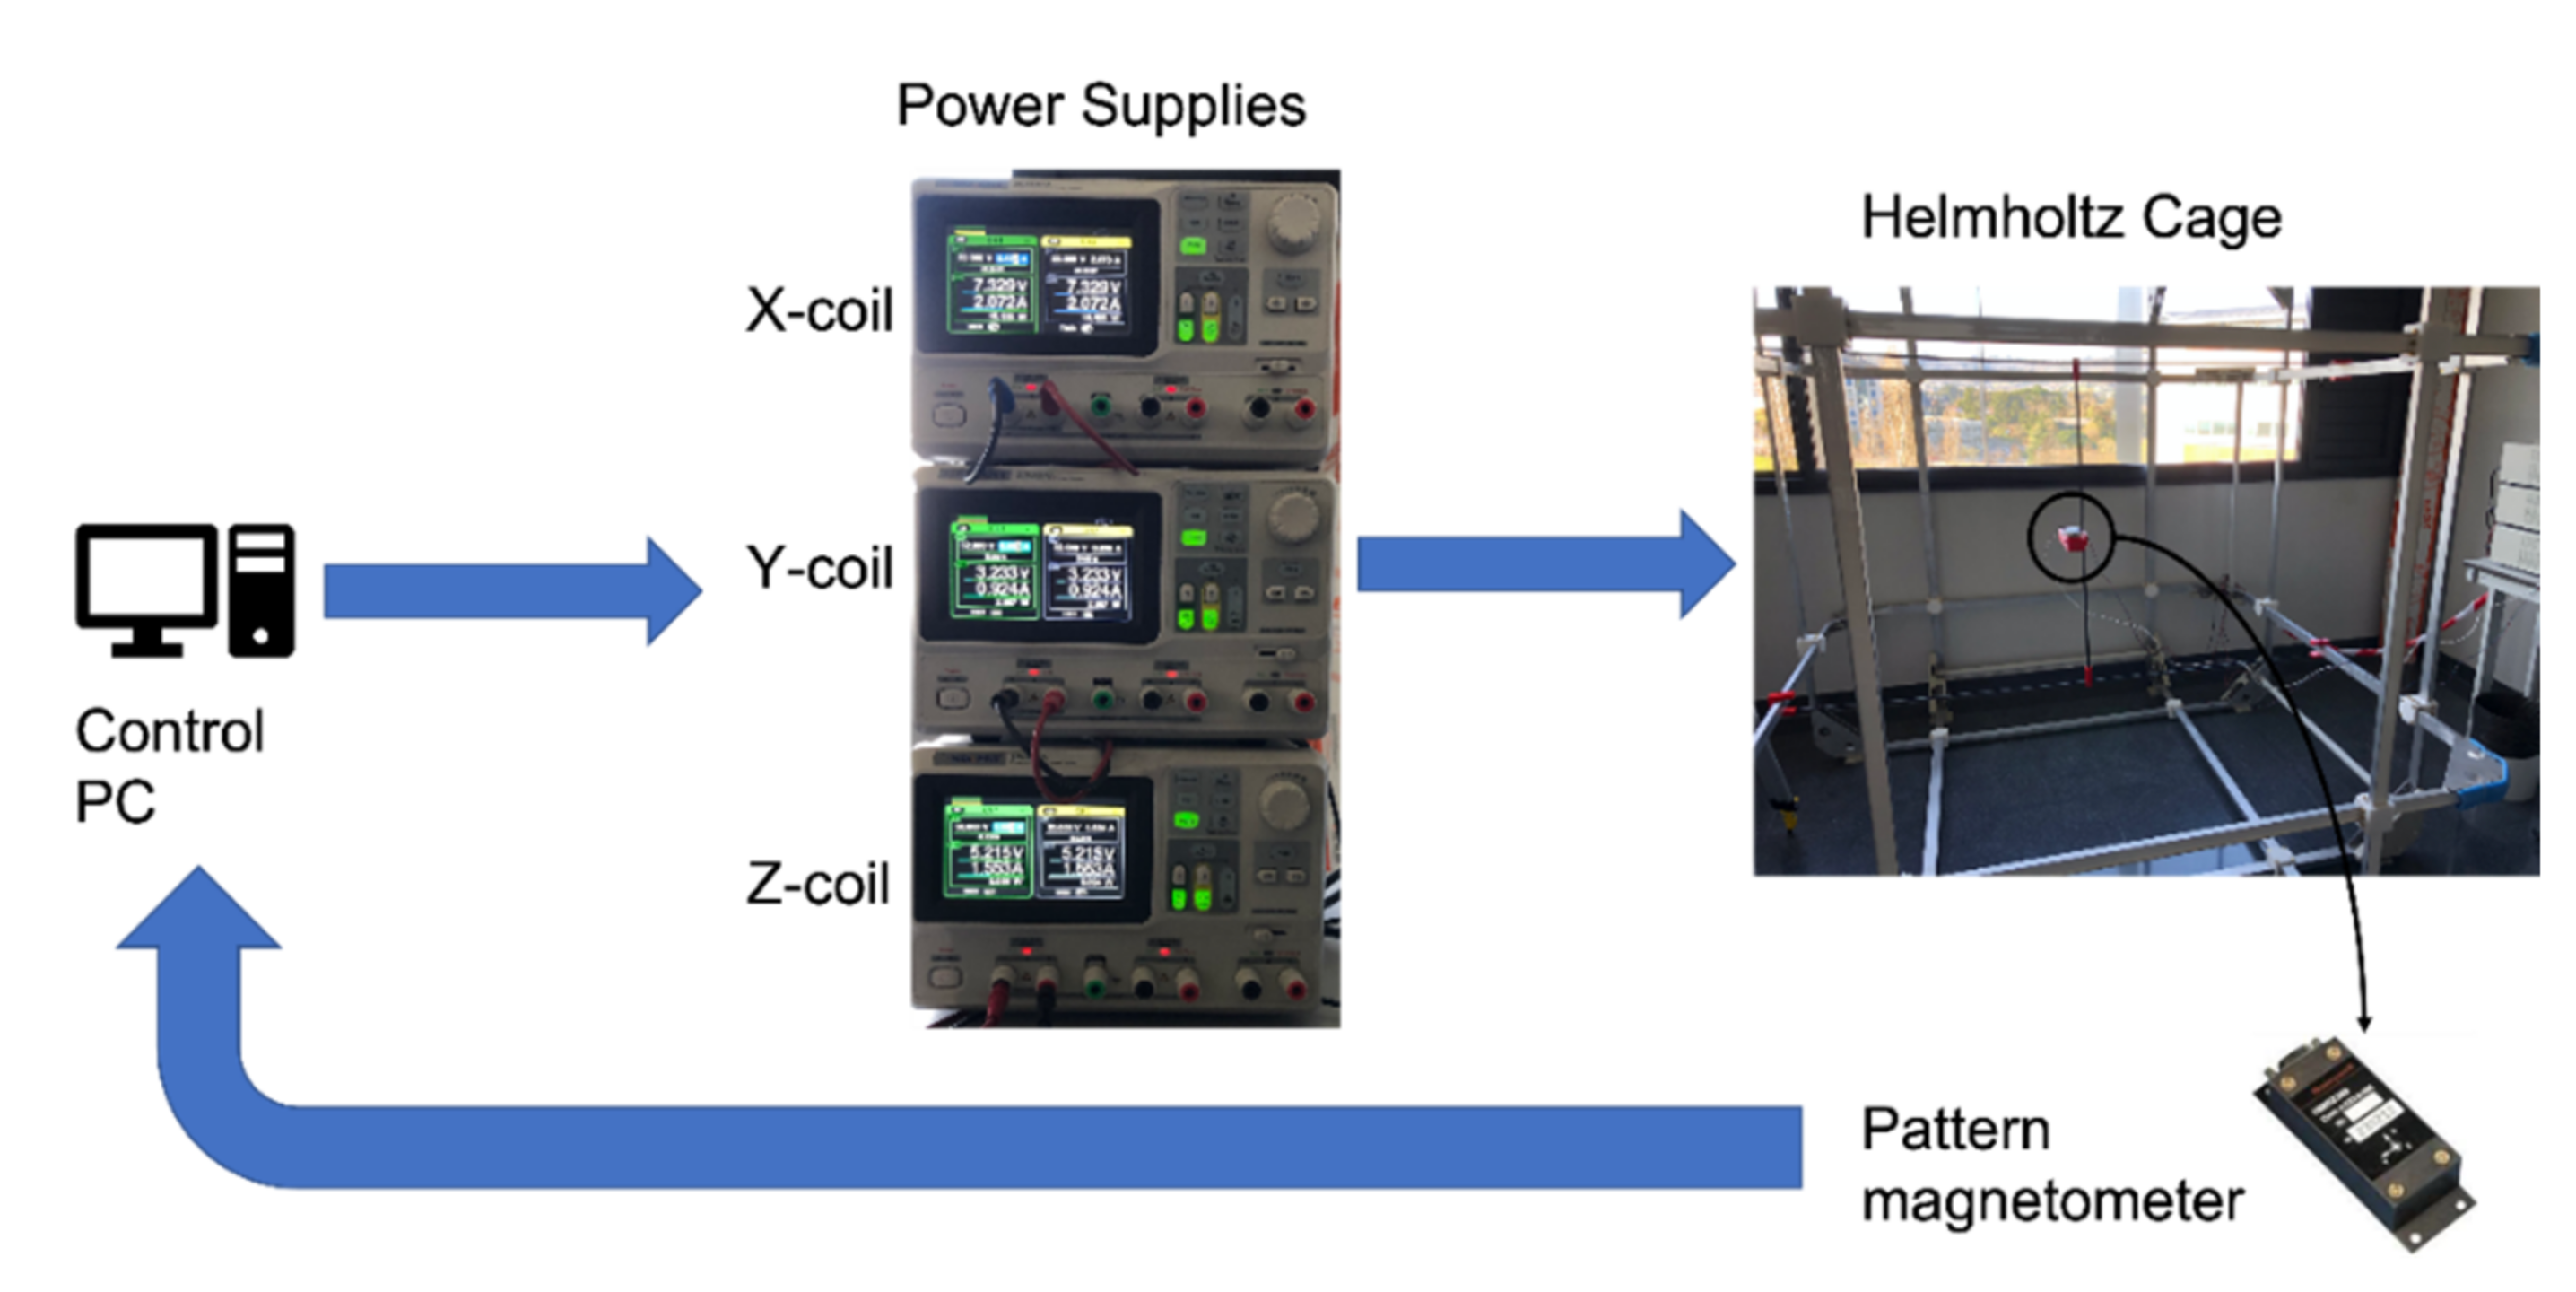
The testing facility had different elements: a Helmholtz cage, three programmable power supplies and a HMR2300 gaussmeter, which is used as a metrological standard to provide feedback between simulated and measured magnetic field values during testing, and a personal computer to control the different instruments (Figure 1). All the systems were placed in a temperature-controlled room at 20 °C. The control computer was used to select the current intensity value for the power supplies according to magnetic requirements; the Helmholtz cage generated the magnetic field depending on selected parameters of the power supplies; and, finally, the standard magnetometer measured the magnetic field in the Helmholtz cage and provided a reliable value.
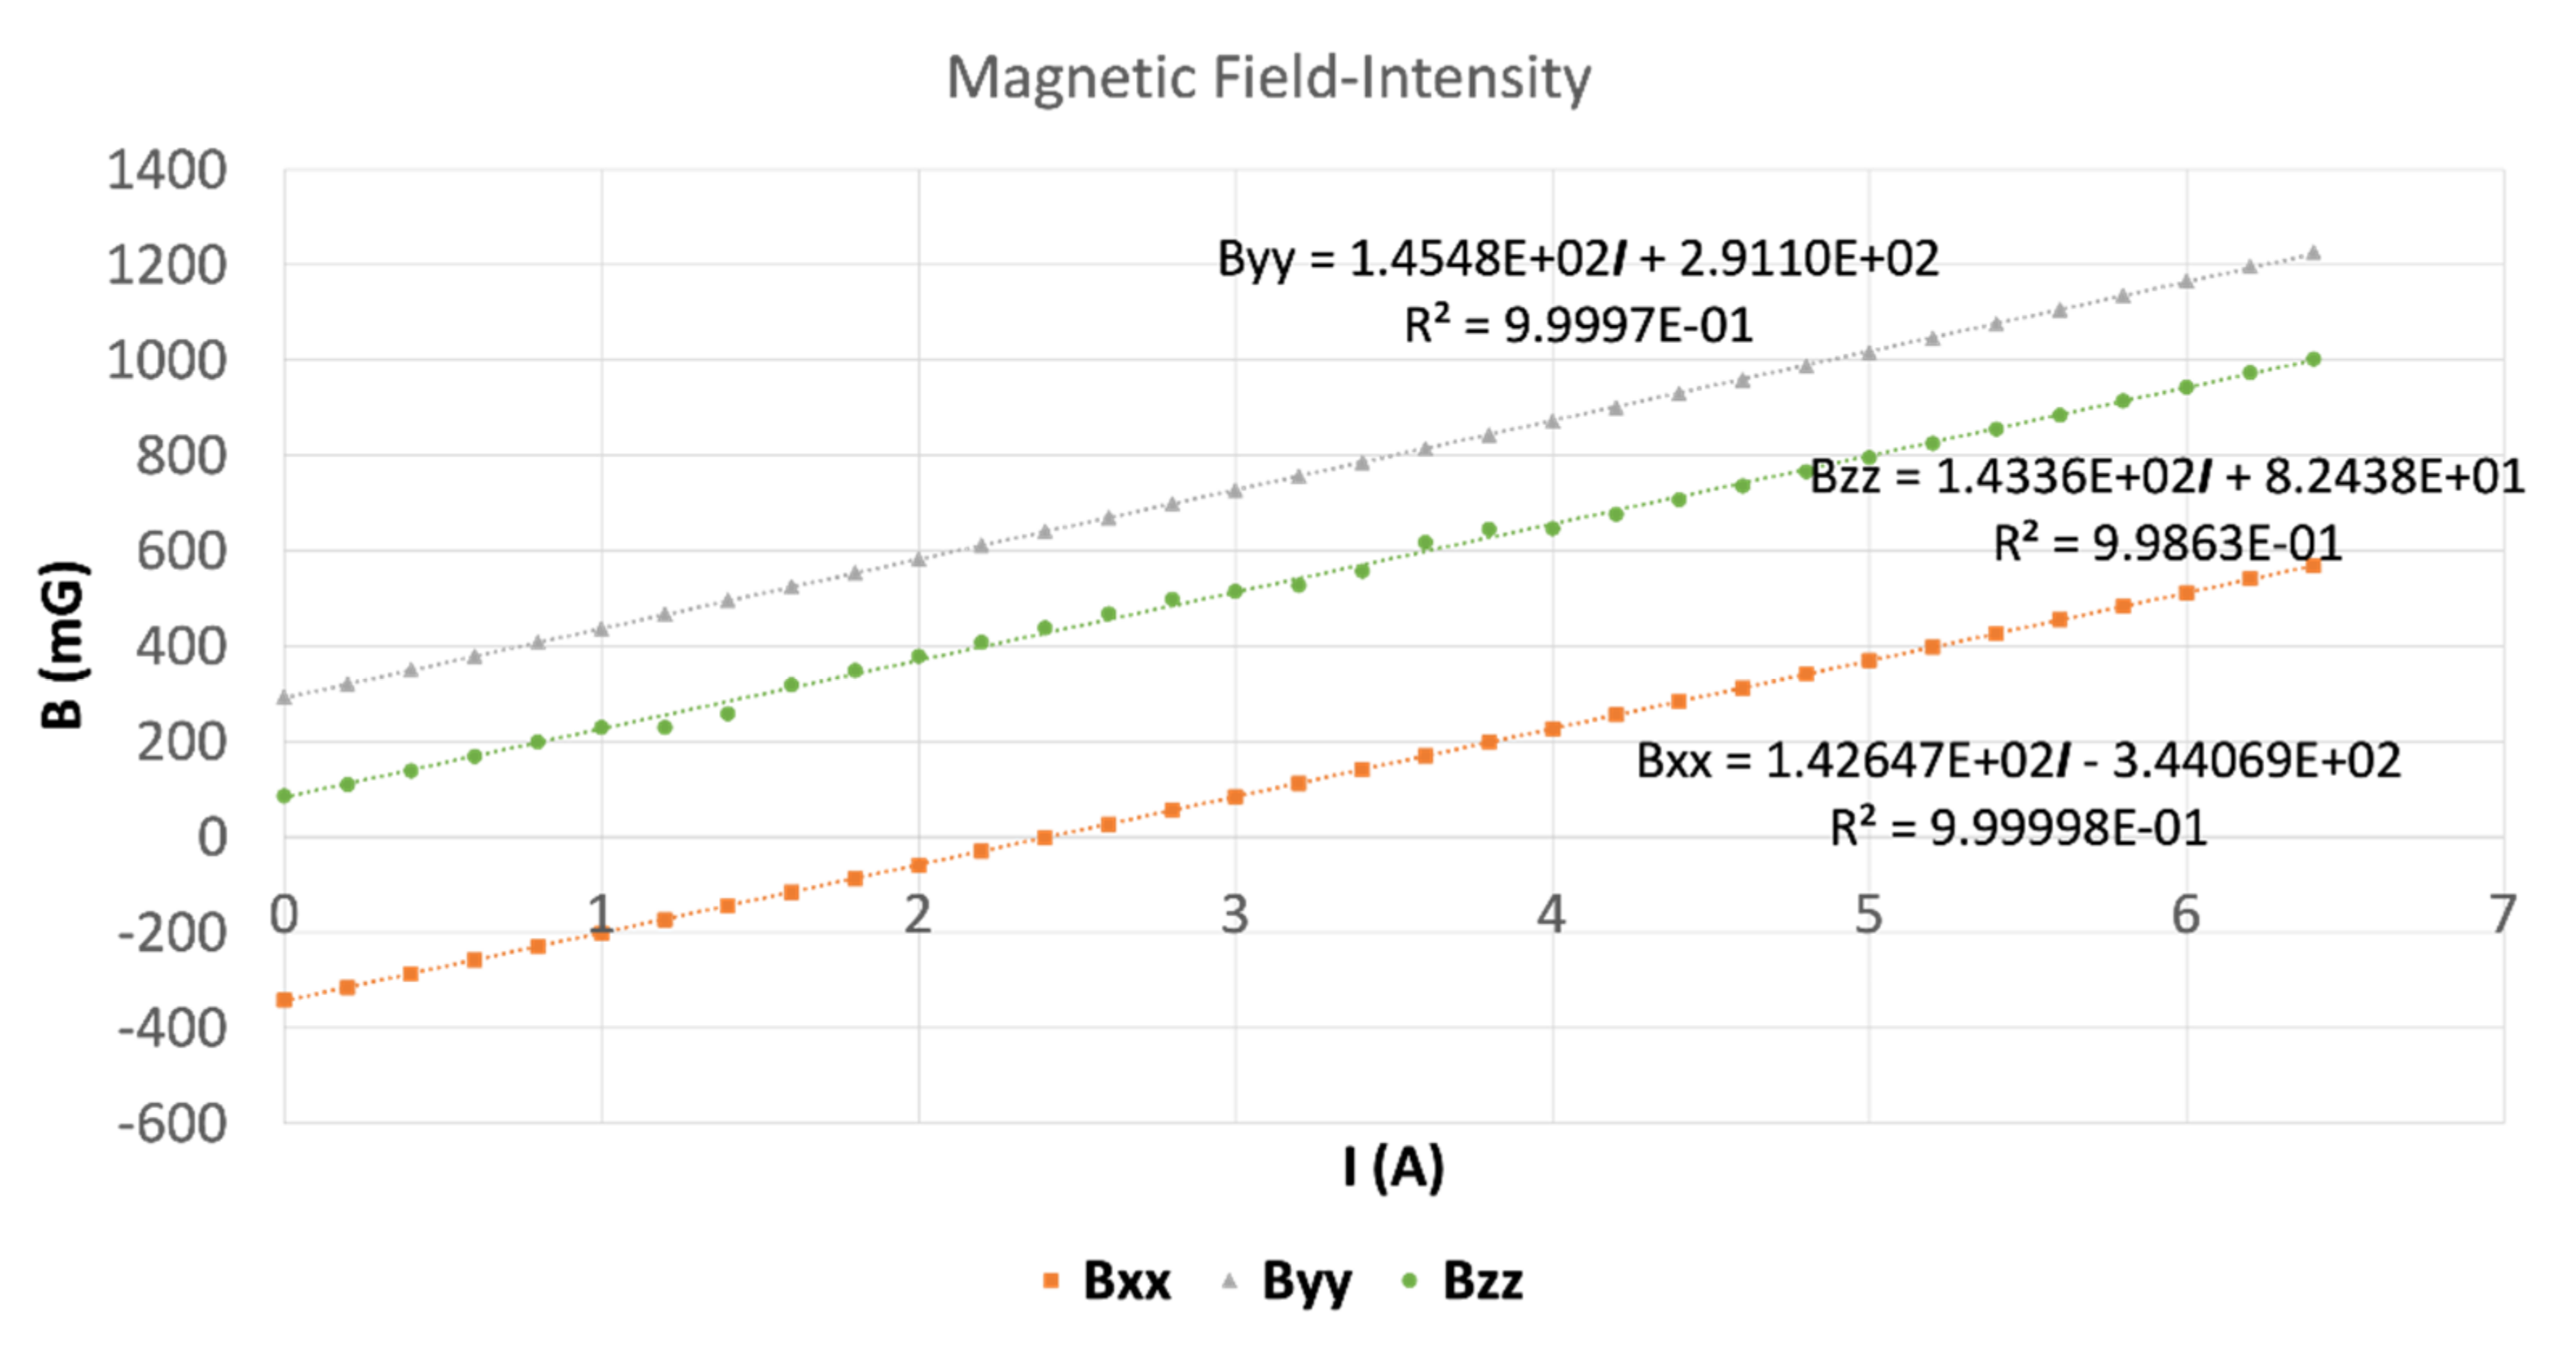
The Helmholtz cage is a device capable of simulating a magnetic field using three orthogonal pairs of coils to control its value in three directions, with these coils, for the selected model, having a squared shape. The selected model was a BHSC2000-3-B from Serviciencia (Toledo, Spain), which is suited to cancel the local magnetic field of the Earth. The main highlights of its specifications are a maximum dimensions of 2086 × 2040 × 2086 mm, a maximum magnetic field of 2.4 G for each axis and a relation field-current of approximately 0.15 G/A [16]. The Helmholtz cage allows the simulation of a magnetic field by using power supplies. To control the magnetic field’s modulus and direction, three programmable power supplies, model SPD3303X from Siglent, were used. They provided a range of use in terms of current intensity between −6.4 A to 6.4 A, working in parallel mode, applying the negative current by reversing the power supply polarity. Figure 2 shows the results obtained in a test to establish the relationship between the current intensity and the magnetic field in each coil. A linear relation between both variables can be easily calculated. The power supplies were controlled by a computer using the Python language, defining the initial parameters of the test, power supply voltage, current and time. The magnetic field in the center of the cage was measured using the HMR2300 gaussmeter to provide in-situ feedback from the experiment. This gaussmeter was previously calibrated by one of higher metrological accuracy with traceability to the National Institute of Standards and Technology (NIST, Gaithersburg, MD, USA). The calibration certificate was provided by the manufacturer.
2.1.2. Pixhawk Magnetometers
Pixhawk is a low-cost autopilot based on different versions on the Pixhawk project FMU open hardware design. It runs PX4 flight control software, which provides a standard to deliver drone hardware support and software stack [15], with FMU the name assigned to the board design standard [17]. Each Pixhawk contains on-board sensors, whose number depends on the Pixhawk model, to measure different parameters related with the vehicle state as well as environment. These sensors are three-axis gyroscopes, a three-axis accelerometer, a three-axis magnetometer, barometer and a Global Navigation Satellite System (GNSS). Using data provided by these, the autopilot can provide information related with position, speed and acceleration, as well as attitude, magnetic field and ambient pressure.
This work is focused on the accuracy of the magnetometer measurements mounted on Pixhawk boards and the tolerance in manufacturing. Tolerance indicates the metrological variability that magnetometers on-board different autopilots have. Since this is an open-source non-certified system, there is no robust metrological information, as in the case of other commercial systems, which show the traceability of the sensors to reference standards. Therefore, it is interesting that potential Pixhawk users are aware of their metrological limitations before planning the use of Pixhawk for commercial services with drones on which this autopilot is functional and could derive in risks for third parties.
Table 1 shows the different models of Pixhawk autopilots and magnetometers used in the study. Pixhawk model CubeBlack, which is named Pixhawk 6, has two different magnetometers on-board, named magnetometer-2 and magnetometer-3. Both were used to analyze this autopilot, while the other models selected had only one. All magnetometer data of these instruments are read in mG units. The table also shows the only magnetic parameters presented in the datasheet of the sensors [18,19]: the magnetic measurement range and the magnetic sensitivity. No other characteristics such as precision, accuracy or drift are shown, which also justifies the study carried out in this work.
The acquisition of magnetometer data was performed using the Mission Planner software. Mission Planner is a free, open-source ground station suite for planes, helicopters and rovers. Pixhawk can be connected in different ways, using a telemetry radio or directly using an USB cable connected to the computer [20]. For the tests in this paper, the last method was selected, and it did not imply any restriction from an operational point of view. Once autopilot is connected and firmware is installed, sensor data can be read on the computer screen (Figure 3). To automatize the data acquisition, a Python script to save the sensor data was implemented, granting the chance to analyze all the data after testing.
2.2. Testing Methodology
The methodology included two main tests: one in which the magnetic field varied around one axis and another in which the stability of the sensor is shown over time.
2.2.1. Magnetic Field Rotation Test
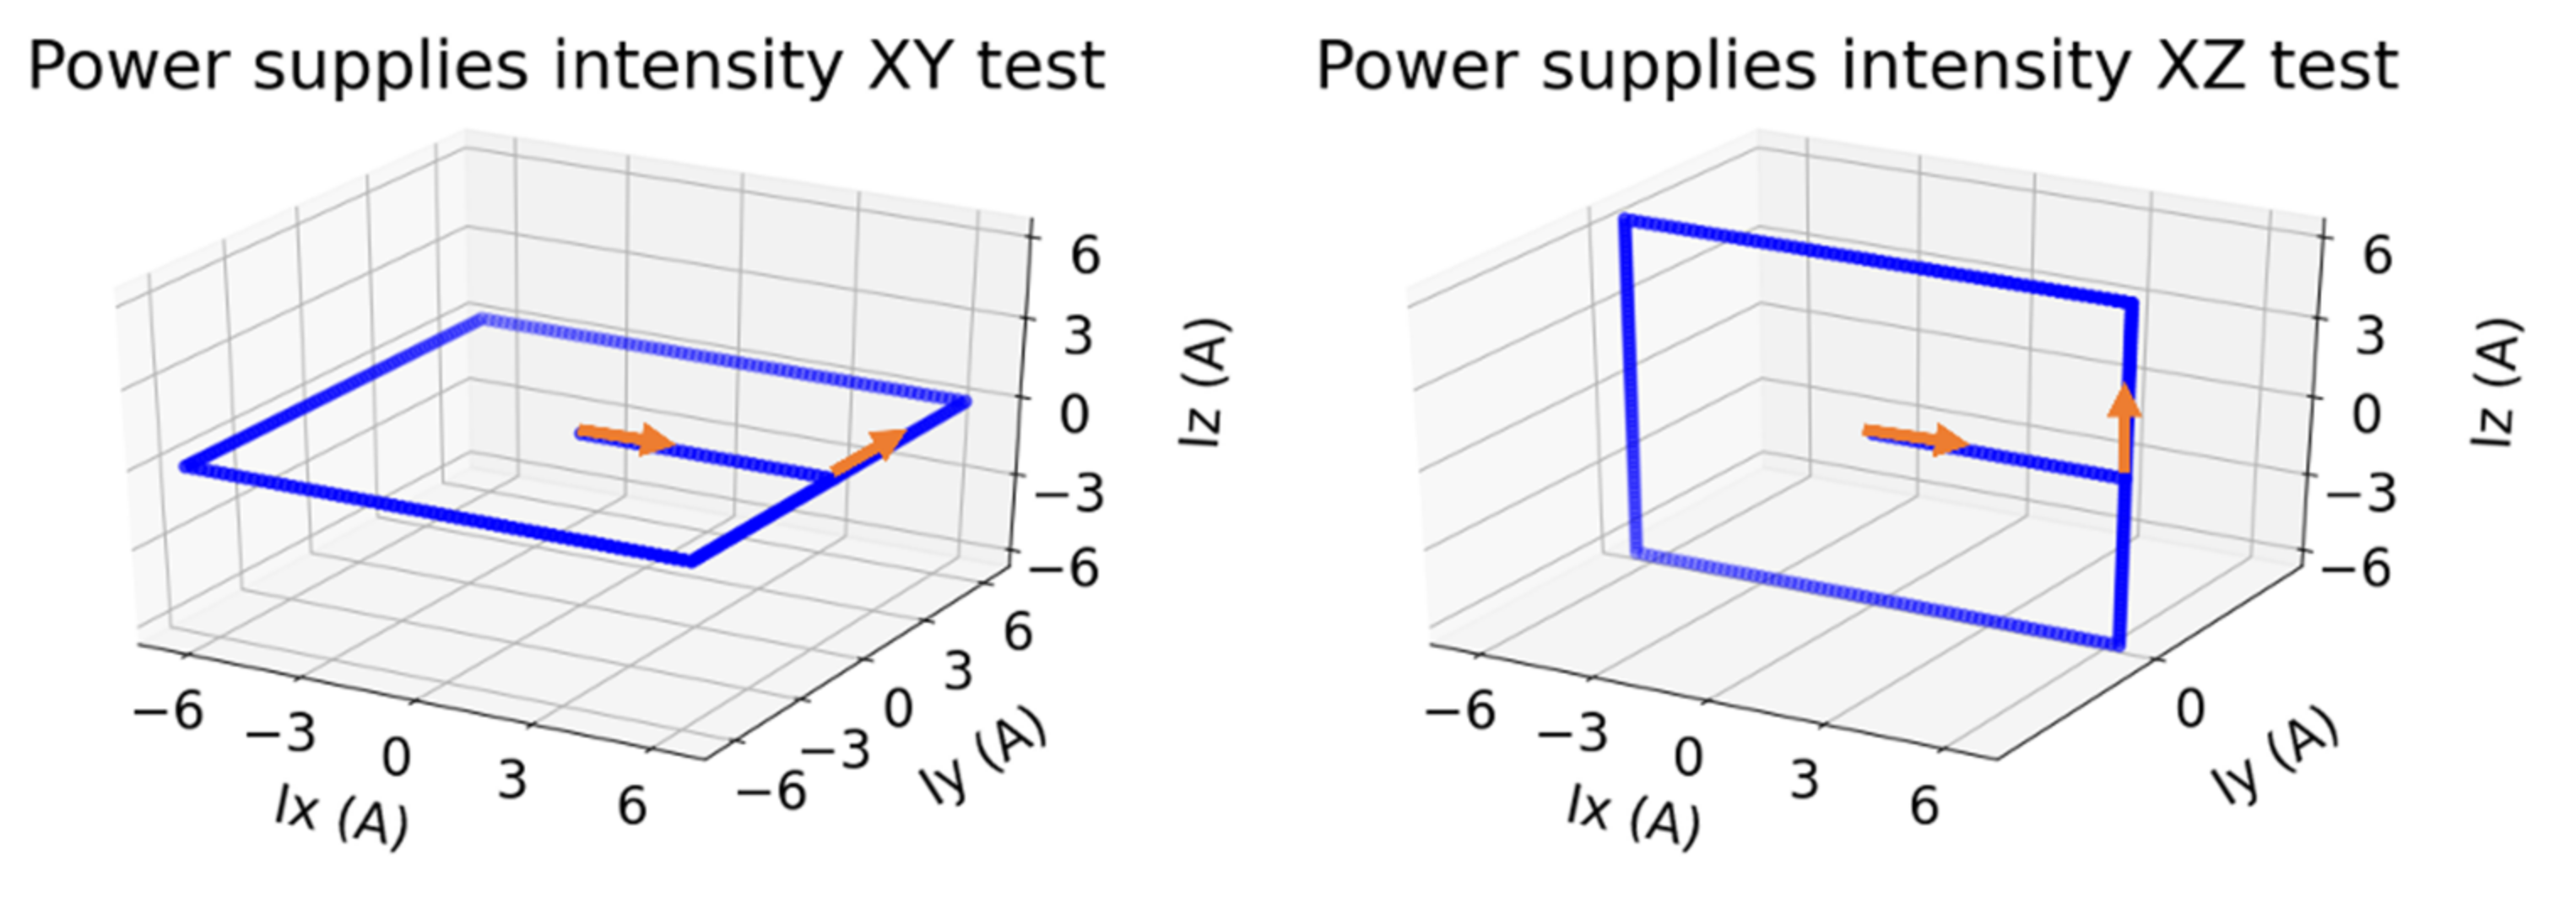
The goal of the test consisted of studying magnetometer measurements provided by the Pixhawk board when the magnetic field direction changed considerably. This is a flight situation that occurs when there are variations in the trajectory of the aircraft or when there are ascents or descents of the flight level. The way to experimentally study the response of the sensors to this situation was through the implementation of rotating magnetic fields in the Helmholtz cage. To meet all the requirements, this test needed to be repeated considering different rotation axes. In this case, it was performed around the Z axis and around the Y axis. A magnetic field was created in the analyzed plane, changing values and directions in steps of current intensity of 0.2 A to complete the rotation. Figure 4 shows these changes in terms of power supply intensity.
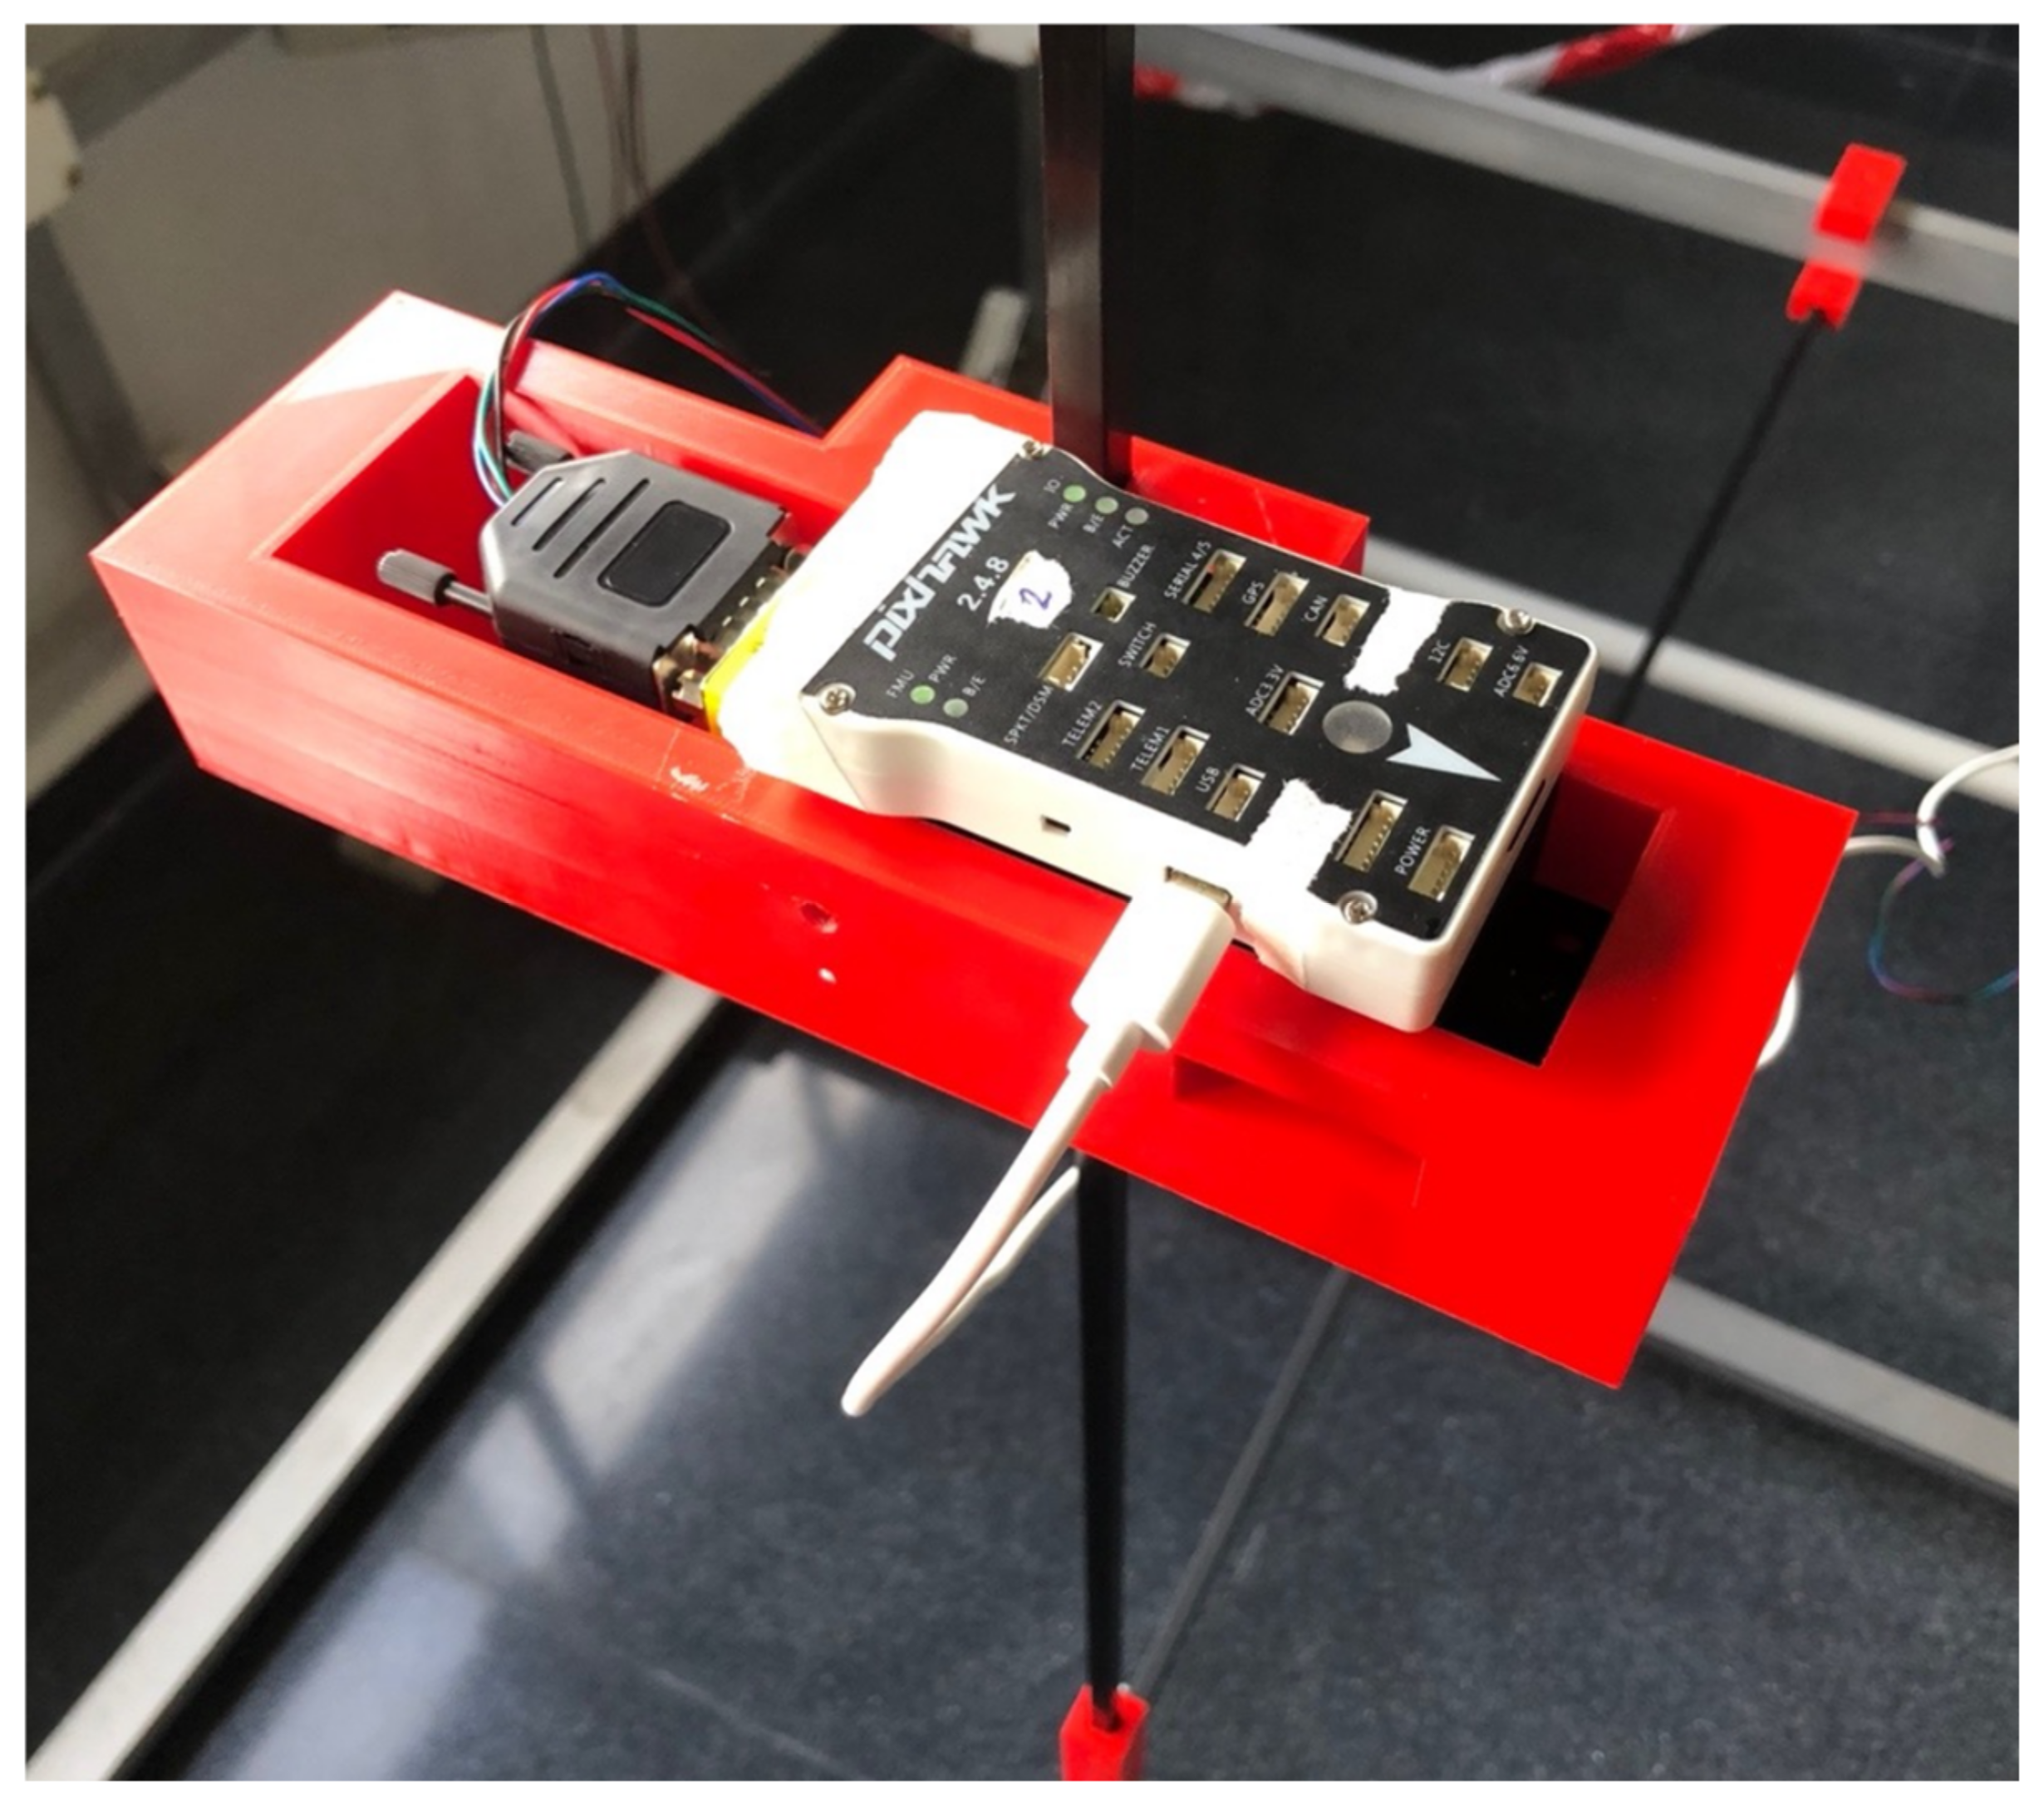
Both tests started with an increment of intensity in the X direction until a maximum was achieved. Then, in the case of the test around the z-axis, the power supply intensity in the Y direction was increased to reach its upper limit, whereas, in case of the test around the y-axis, this intensity increment was applied to the Z-coil. After that, the process continued increasing and decreasing intensity in the applied axes following Figure 4. Once power supply input values were programmed, the Pixhawk autopilot and standard gaussmeter were be placed in the Helmholtz cage as shown Figure 5, controlling their position relative to the Helmholtz cage centre. For this, a non-magnetic system created with carbon fiber bars and 3D printed components, including a box to place instrumentation, was used. To avoid errors related with magnetic field uniformity in the Helmholtz cage, instruments were positioned in the center of the testing facility.
After creating power supply input files and placing the instrumentation in the Helmholtz cage, the magnetic field rotation test was started by running the Python control scripts to manage power supplies and acquire data from the HRM2300 gaussmeter and Pixhawk. The power supplies were switched on 30 min before starting the tests to reach regime temperature and avoid errors. The test was repeated for each of the six Pixhawks and magnetometers under study.
2.2.2. Magnetic Field Stability Test
One of the key aspects of any sensor is to avoid metrological drifts when it is performing a measurement. Such instabilities in an aircraft autopilot magnetometer could cause deviations when following a given course. In this context, a stability test of the magnetometers embedded in a Pixhawk autopilot was performed. Therefore, the test’s goal was to analyze changes over time in the Pixhawk magnetometers for a defined and constant magnetic field, selected considering a determined drone flight altitude and course. Firstly, the magnetic field desired to be simulated was selected. For this, the magnetic environment in the center of the testing facility, where a gaussmeter and Pixhawk would be placed, was measured (Table 2). The magnetic field at the testing facility location (Ourense, Spain) was calculated according to the International Geomagnetic Reference Field (IGRF) model by using the National Oceanic and Atmospheric Administration (NOAA) online calculator [21]. Considering initial and target magnetic field values, the last step needed for the simulation was to use the relation between power supply intensity and the magnetic field generated in the testing facility.
After defining power supply inputs and placing gaussmeters and Pixhawks as shown in Figure 5, the stability test was started, measuring a synchronized acquisition for one hour with both the HMR2300 gaussmeter standard and each of the Pixhawk magnetometers. In the end, one file for each Pixhawk magnetometer measurements was obtained as well as six files with HRM2300 data—one for each stability test. As mentioned for the previous test, power supplies were switched on at least 30 min before starting testing to avoid errors due to operational temperature.
3. Results and Discussion
Section 3 shows the results for both the magnetic field rotation and magnetic field stability tests, focusing on the difference with respect to the gaussmeter applied as standard and also on the variation in measurements between the different Pixhawk magnetometers used during the metrological test. These comparisons define the limits on operations in terms of magnetic field measurement accuracy and tolerance.
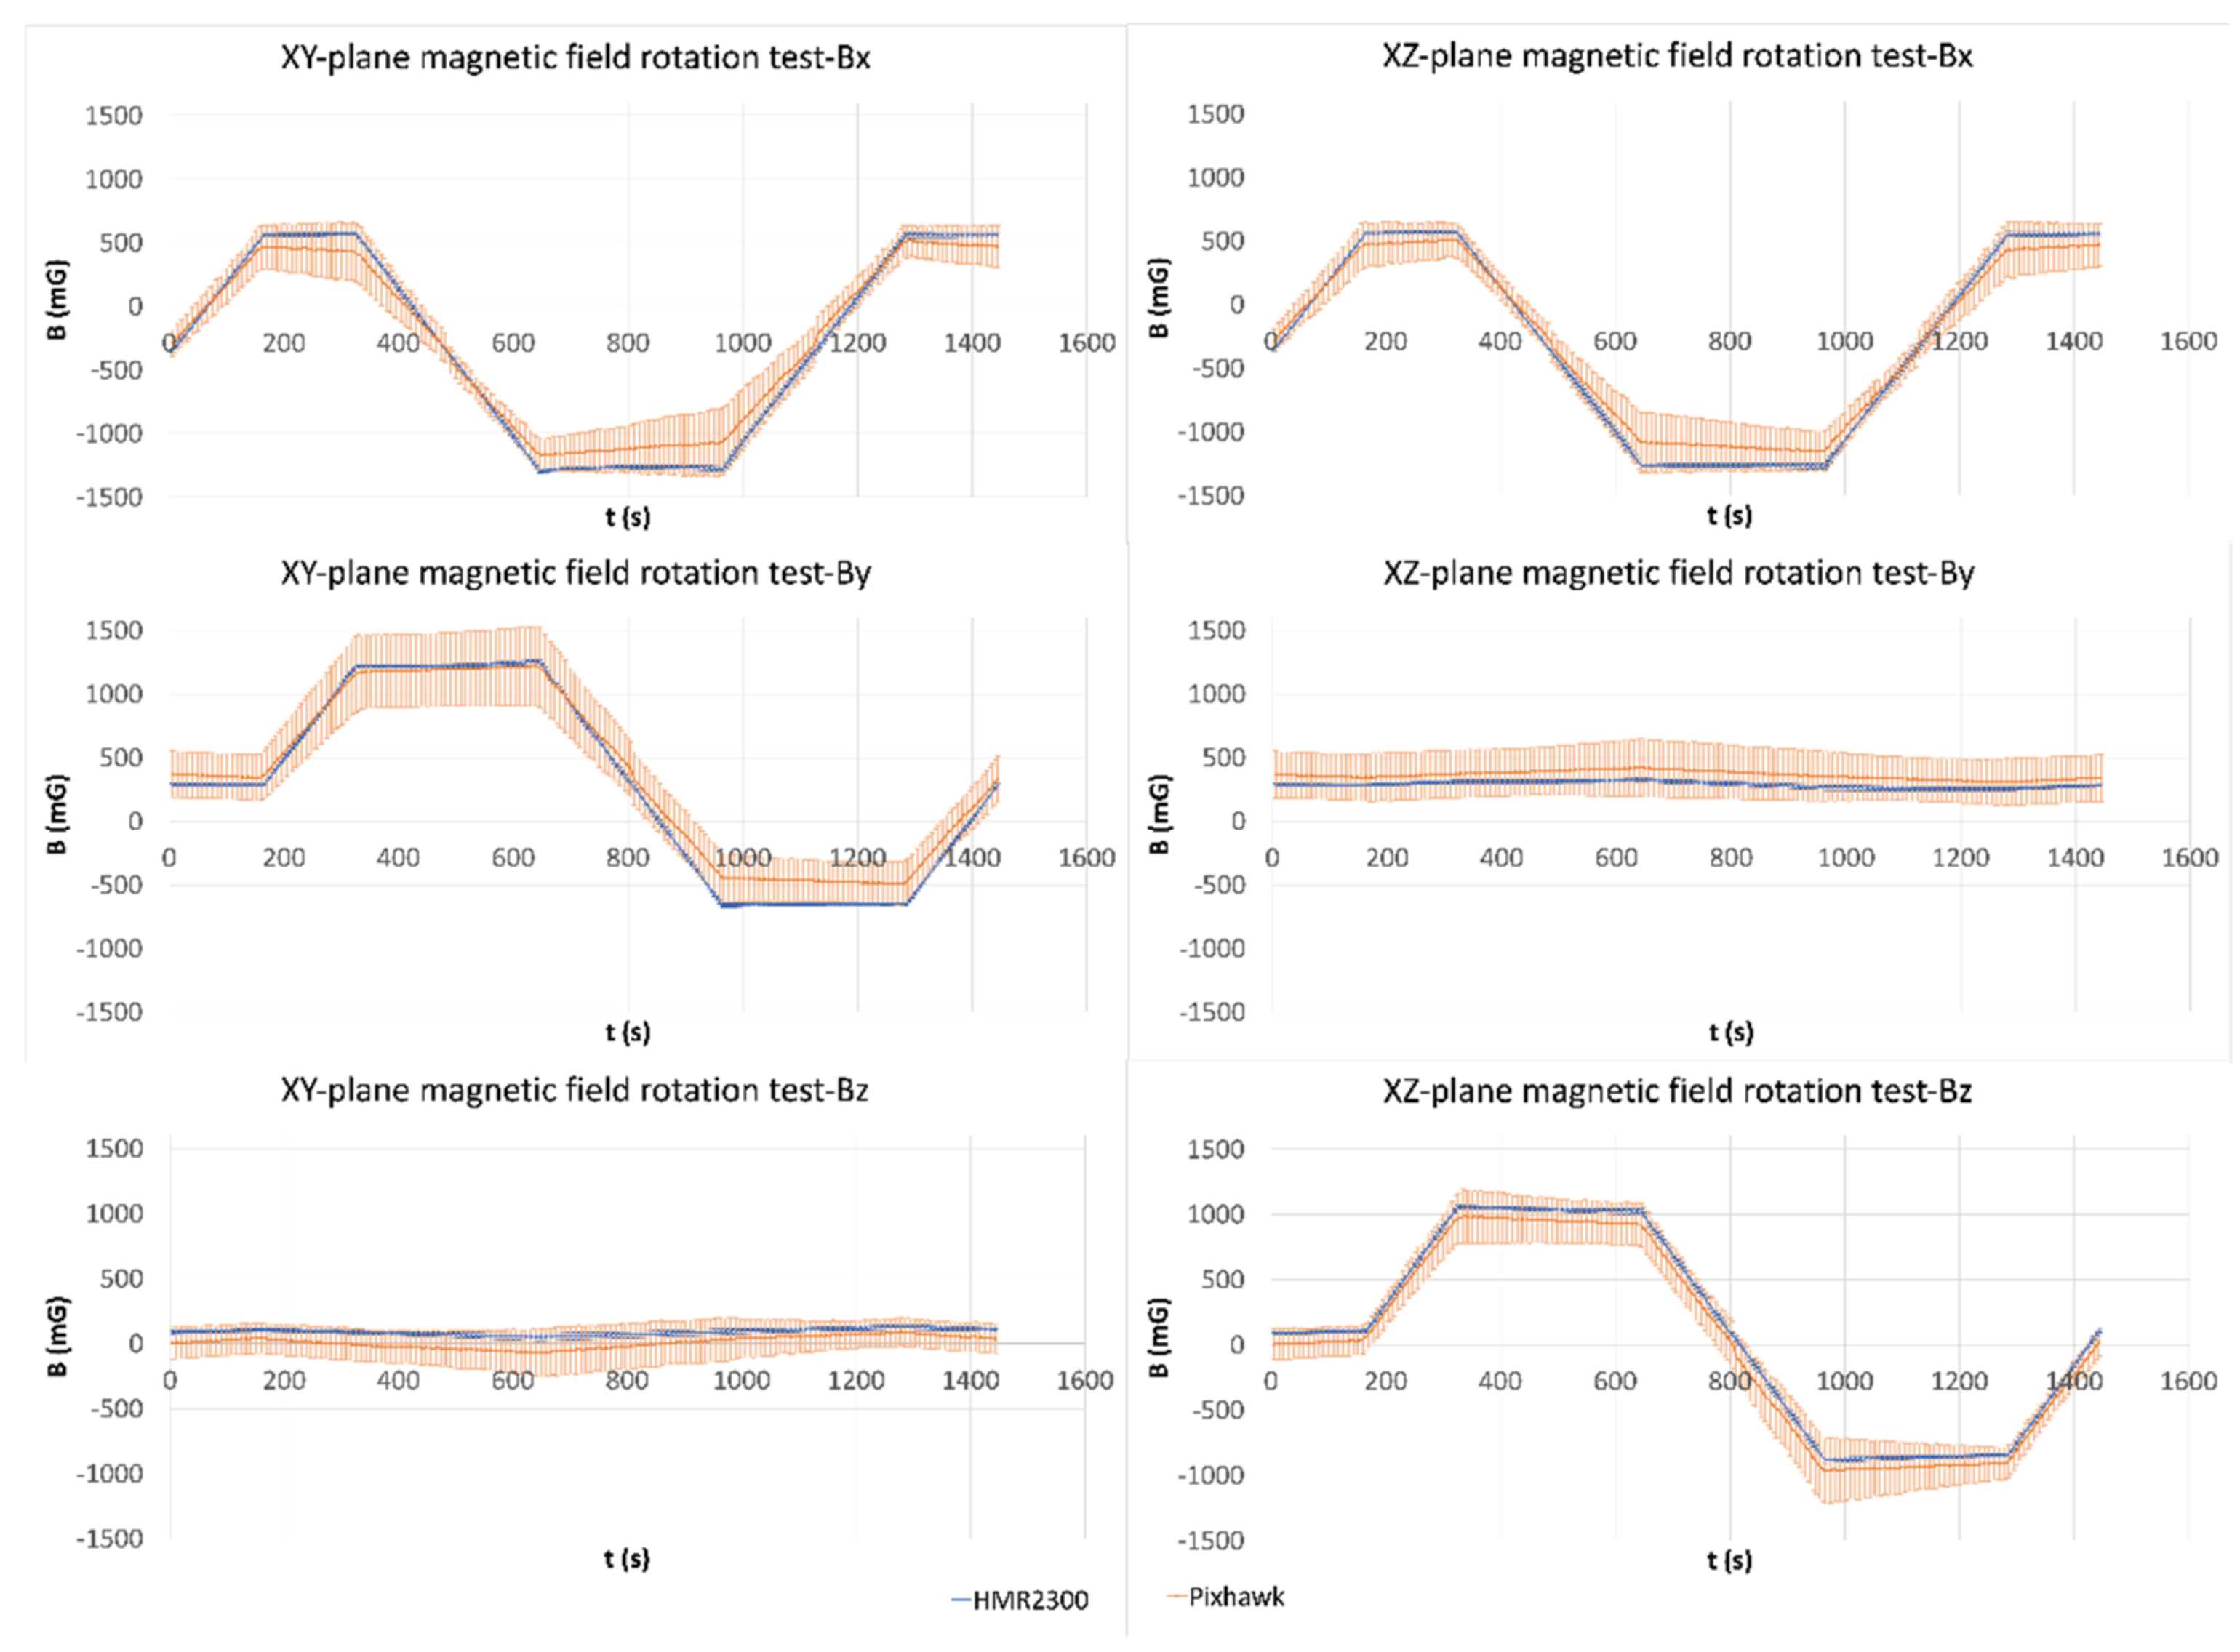
In Figure 6, the left part shows the results for the magnetic field rotation test around the Z-axis, displaying error bars related with standard deviation for each data series, using blue color for the standard gaussmeter and orange for Pixhawk magnetometers. In the first case, the standard deviation comes from the variability of the seven measurements performed with the standard gaussmeter, and in the case of Pixhawk magnetometers, the standard deviation came from the variability of the different magnetic sensors of each autopilot (Equations (1) and (2)). The standard deviation allows us, in the measurement of uncertainty calculations, to estimate the contribution of type A or random errors. The objective of the manuscript is not to evaluate a complete uncertainty budget, so type B or systematic errors are not taken into account.
where Bm is the magnetic field average obtained for each point of the graphs, Bi the magnetic field of each sensor (Pixhawk magnetometers) or the magnetic field in the different experiments (standard gaussmeter), and n the number of Pixhawk magnetometer units (7 in this study).
where Bm is the magnetic field average obtained for each point of the graphs, Bi the magnetic field of each sensor (Pixhawk magnetometers) or the magnetic field in the different experiments (standard gaussmeter), n the number of Pixhawk magnetometer units (7 in this study), and Bst the standard deviation of the measurements, used to represent the error bars on the graphs.
It is possible to appreciate a considerable difference in the magnitude of the error bars for both cases, with the data of the HMR2300 being almost insignificant with respect to Pixhawk magnetometer data. In terms of numerical values, the average standard deviation considering all axis is, in the case of the standard gaussmeter, approximately 15 mG, whereas in the case of the Pixhawk, this parameter is higher than 170 mG.
Following the same procedure, the right part of Figure 6 shows the results for the magnetic field rotation test around the Y-axis, representing error bars in the same way as the left part of Figure 6. As with magnetic field rotation around the z-axis, the results show a remarkable difference in magnitude between error bars associated with Pixhawk and those associated with the standard gaussmeter. Considering the three axes, the mean value of the standard deviations obtained for the test associated wit the standard gaussmeter was almost 16 mG, while the same parameter obtained for the Pixhawk was 170 mG.
The attitude determination accuracy for a Pixhawk flight controller based on the method of direct cosine matrix (DCM) over a magnetometer is in the order of 3° [22]. A representative variation of 5 mG in the magnetometer measurement could produce an angular variation of 1° in the attitude data, in agreement with experimental results, and impair the guidance, navigation and control of the drone. Taking this into account, an initial calibration of the Pixhawk magnetometer with the results presented in this paper could improve the attitude determination by close to one order of magnitude.
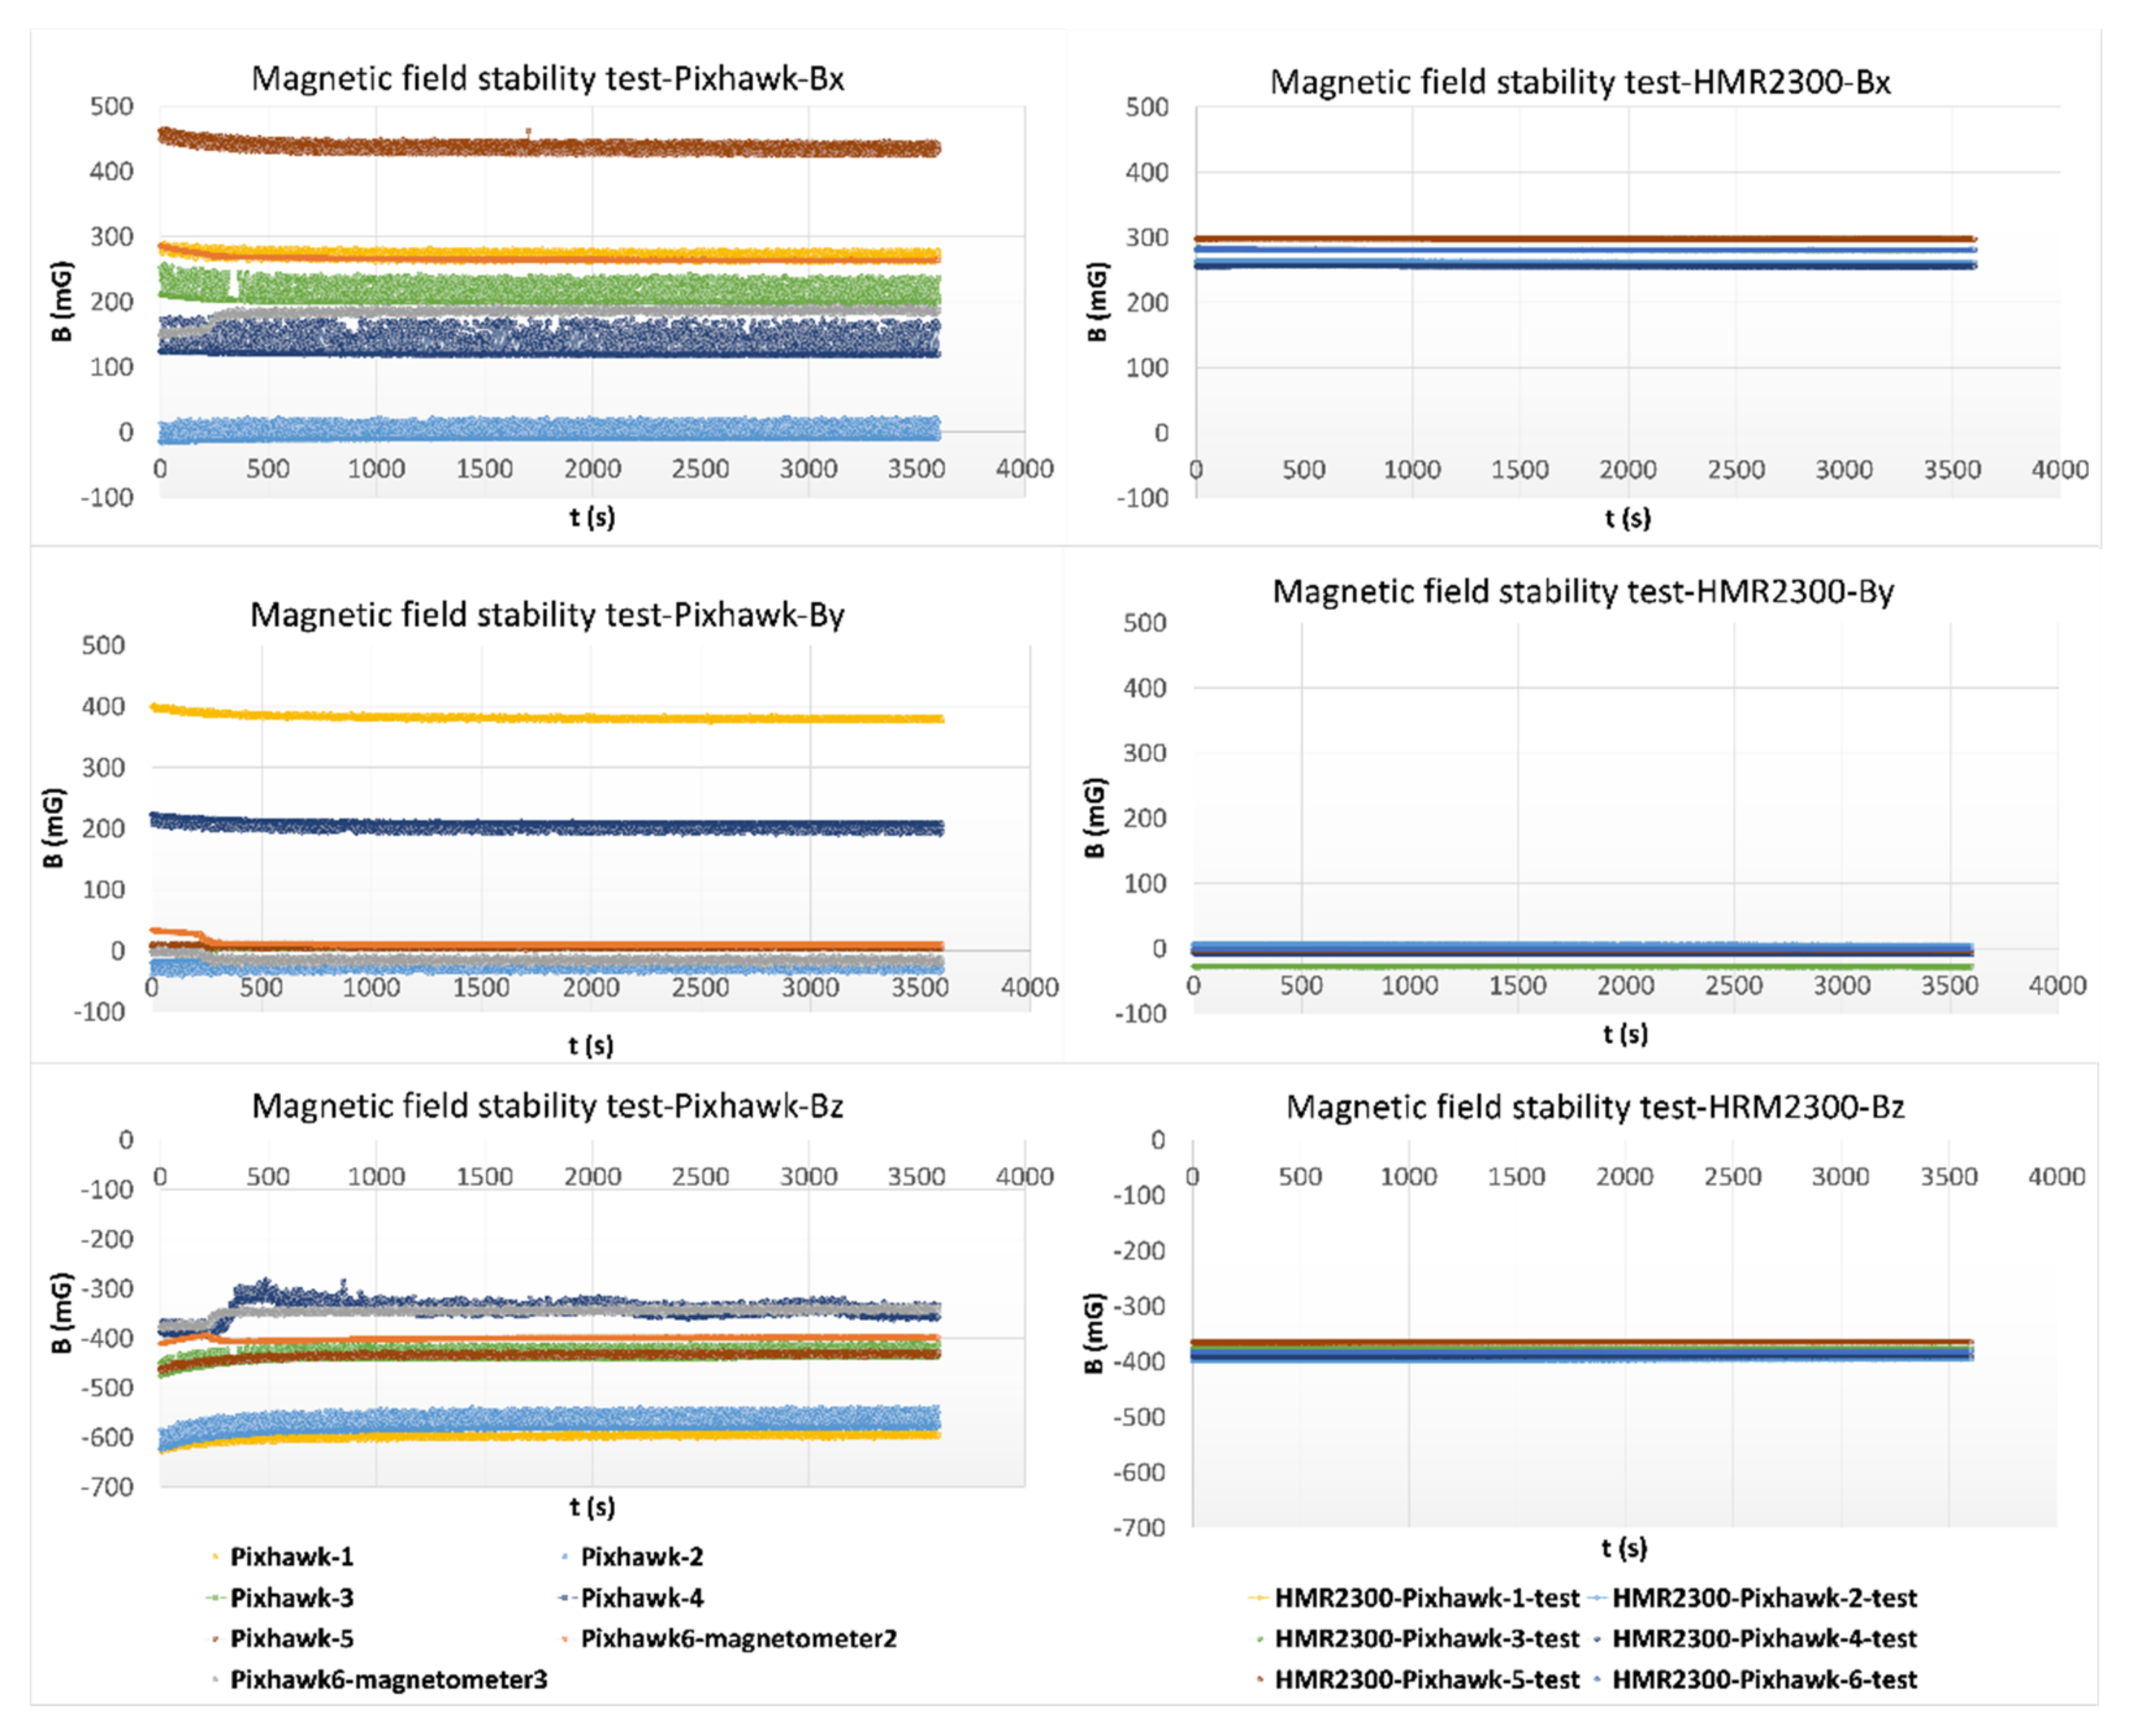
Figure 7 depicts the results for the magnetic field stability test. It provides information about the differences between the Pixhawk magnetometers and the standard gaussmeter. In most autopilots, there is an error in terms of the initial calibration showing a displacement of the magnetic field value, with this situation more pronounced in the Pixhawk-1 Y-axis with a displacement of approximately 400 mG, the Pixhawk-2 X-axis with a value around 240 mG and the Pixhwak-4 Y-axis with a difference close to 225 mG.
The peak-to-peak amplitude, considered as the difference between the maximum and minimum values measured by an instrument for the same conditions, also shows relevant information. This parameter is higher in the case of Pixhawk magnetometers than in the HMR2300 gaussmeter. For example, the worst value in terms of peak-to-peak amplitude considering the autopilot magnetometers was higher than 100 mG for Pixhawk-4, whereas the worst case for the HMR2300 gaussmeter was 5.4 mG. In a similar way, the maximum difference value was 25 mG for the Pixhwak-6 magnetometer-2, while this value only reached 1.3 mG for HMR2300 gaussmeter during the same test. A numerical comparison between the peak-to-peak amplitude for each Pixhawk and HMR2300 is collected in Table 3.
The other result of this test is the greater time needed to stabilize the magnetic field value in the case of Pixhawk magnetometers, which can be appreciated in Figure 7. The time needed ranged between 9 and 17 min for stabilization, depending on autopilot and axis, whereas it was in the order of tenths of seconds for the HMR2300 gaussmeter. According to this, to increase the accuracy of the Pixhawk autopilot in terms of magnetic field measurement, it should be switched-on for at least 17 min before starting its operations. The magnetic field data obtained were measured directly from the magnetometers without applying any additional filtering or data processing.
The information shown in Figure 7 could also allow the calibration of the Pixhawk magnetometers by calculating the difference between the measured values and those shown by the standard magnetometer. In this way, the calibration equation that corrects the results can be determined (Equation (3)).
where Bstmg is the magnetic field measured by the standard magnetometer, C is the correction of the magnetic field, and BPixhawk is the magnetic field measured by each of the Pixhawk magnetometer sensors.
4. Conclusions
In this work, the description of a testing facility for magnetic field analysis has been shown, using a Helmholtz cage to simulate a homogeneous magnetic area controlled by power supplies. This facility was used to analyze the metrological features of drone autopilot magnetometers—more specifically, Pixhawk magnetometers—by a comparison between their results and the results of a standard gaussmeter.
Results concerning the magnetic field rotation show how similar the data obtained for a test repeated six times for the standard gaussmeter are, whereas there is an important variability between the six Pixhawks under study. Their maximum standard deviation is 10 times higher than that for the HMR2300 in both cases studied—around the Z-axis and around Y-axis. In terms of stability, tests showed a higher peak-to-peak amplitude in Pixhawk magnetometers, achieving a value higher than 100 mG for the case of Pixhawk-4. The analysis from the stability test shows the amount of time needed to stabilize autopilot magnetometer measurements. This value is around 17 min to avoid an error, which is almost 70 mG for Pixhawk-4 and is between 20 mG and 35 mG for the other autopilots.
In conclusion, for Pixhawk operations, the initial time to stabilize magnetometer measurements should be taken into consideration, as well as a possible disturbance in its absolute value of tenths of mG. In addition to this, an initial calibration of the magnetometers on-board Pixhawk is recommended to increase navigation accuracy. This calibration could be implemented on any Pixhawk using open autopilot software such as PX4, contributing to improving the accuracy of the drone flight. This calibration is focused on avoiding sensor errors and complements the calibration typically performed in drones related to environmental errors. Future works could include, for example, flight tests to quantify the influence of the magnetometer sensor accuracy on the behavior of the drone dynamics. Thus, the results obtained in the present work could be tested under flight conditions and be extrapolated rigorously.
Author Contributions
Conceptualization, H.G.-J. and F.N.-M.; methodology, H.G.-J. and F.N.-M.; software, N.F.-Á.; investigation, N.F.-Á.; formal analysis, N.F.-Á., H.G.-J. and F.N.-M.; writing—original draft preparation, N.F.-Á.; writing—review and editing, H.G.-J. and F.N.-M. All authors have read and agreed to the published version of the manuscript.
Funding
This research received no external funding.
Acknowledgments
The authors would like thank Ramón Meijón for the technical support given during the Helmholtz set-up.
Conflicts of Interest
The authors declare no conflict of interest.
References
- Nonami, K. Prospect and Recent Research & Development for Civil Use Autonomous Unmanned Aircraft as UAV and MAV. J. Syst. Des. Dyn. 2007, 1, 120–128. [Google Scholar] [CrossRef] [Green Version]
- Shakhatreh, H.; Sawalmeh, A.H.; Al-Fuqaha, A.; Dou, Z.; Almaita, E.; Khalil, I.; Othman, N.S.; Khreishah, A.; Guizani, M. Unmanned Aerial Vehicles (UAVs): A Survey on Civil Applications and Key Research Challenges. IEEE Access 2019, 7, 48572–48634. [Google Scholar] [CrossRef]
- Costa, F.G.; Ueyama, J.; Braun, T.; Pessin, G.; Osorio, F.S.; Vargas, P.A. The use of unmanned aerial vehicles and wireless sensor network in agricultural applications. In Proceedings of the 2012 IEEE International Geoscience and Remote Sensing Symposium, Munich, Germany, 22–27 July 2012; pp. 5045–5048. [Google Scholar] [CrossRef]
- González-Jorge, H.; Martínez-Sánchez, J.; Bueno, M.; Arias, P. Unmanned Aerial Systems for Civil Applications: A Review. Drones 2017, 1, 2. [Google Scholar] [CrossRef]
- Otto, A.; Agatz, N.; Campbell, J.; Golden, B.; Pesch, E. Optimization approaches for civil applications of unmanned aerial vehicles (UAVs) or aerial drones: A survey. Networks 2018, 72, 411–458. [Google Scholar] [CrossRef]
- Chao, H.; Cao, Y.; Chen, Y. Autopilots for small unmanned aerial vehicles: A survey. Int. J. Control Autom. Syst. 2010, 8, 36–44. [Google Scholar] [CrossRef]
- Yang, Z.; Lin, F.; Chen, B.M. Survey of autopilot for multi-rotor unmanned aerial vehicles′. In Proceedings of the IECON 2016—42nd Annual Conference of the IEEE Industrial Electronics Society, Florence, Italy, 23–26 October 2016; pp. 6122–6127. [Google Scholar] [CrossRef]
- Kendoul, F.; Zhenyu, Y.; Nonami, K. Embedded autopilot for accurate waypoint navigation and trajectory tracking: Application to miniature rotorcraft UAVs. In Proceedings of the 2009 IEEE International Conference on Robotics and Automation, Kobe, Japan, 12–17 May 2009; pp. 2884–2890. [Google Scholar] [CrossRef]
- Kortunov, V.I.; Mazurenko, O.V.; Gorbenko, A.V.; Mohammed, W.; Hussein, A. Review and comparative analysis of mini- and micro-UAV autopilots. In Proceedings of the 2015 IEEE International Conference Actual Problems of Unmanned Aerial Vehicles Developments (APUAVD), Kyiv, Ukraine, 13–15 October 2015; pp. 284–289. [Google Scholar] [CrossRef]
- Brzozowski, B.; Kazmierczak, K. Magnetic field mapping as a support for UAV indoor navigation system. In Proceedings of the 2017 IEEE International Workshop on Metrology for AeroSpace (MetroAeroSpace), Padua, Italy, 21–23 June 2017; pp. 583–588. [Google Scholar] [CrossRef]
- Brzozowski, B.; Kaźmierczak, K.; Rochala, Z.; Wojda, M.; Wojtowicz, K. A concept of UAV indoor navigation system based on magnetic field measurements. In Proceedings of the 2016 IEEE Metrology for Aerospace (MetroAeroSpace), Florence, Italy, 22–23 June 2016; pp. 636–640. [Google Scholar] [CrossRef]
- Brewer, M. CubeSat Attitude Determination and Helmholtz Cage Design; Department of the Air Force Air University Air Force Institute of Technology: Dayton, OH, USA, 2012; Available online: https://scholar.afit.edu/cgi/viewcontent.cgi?article=2033&context=etd (accessed on 14 January 2022).
- Da Silva, R.C.; Ishioka, I.S.K.; Cappelletti, C.; Battistini, S.; Borges, R.A. Helmholtz Cage Design and Validation for Nanosatellites HWIL Testing. IEEE Trans. Aerosp. Electron. Syst. 2019, 55, 3050–3061. [Google Scholar] [CrossRef] [Green Version]
- Foley, J.D. Calibration and Characterization of Cubesat Magnetic Sensors Using a Helmholtz Cage; California Polytechnic State University: San Luis Obispo, CA, USA, 2012. [Google Scholar] [CrossRef] [Green Version]
- Wegner, S.; Majd, E.; Taylor, L.; Egziabher, D.G.; Thomas, R. Methodology for Software-in-the-Loop Testing of Low-Cost Attitude Determination Systems. In Proceedings of the 31st Annual AIAA/USU Conference on Small Satellites, Logan, UT, USA, 5–10 August 2017. [Google Scholar]
- Serviciencia, S.L.U. Two-Metres, Three-Axis (3D), Square Helmholtz Coils. 2018. Available online: http://www.serviciencia.es/folletos/BHC2000-3AB-Specifications-1.pdf (accessed on 22 February 2022).
- Dronecode, px4 Autopilot. In Pixhawk Series. 2020. Available online: https://docs.px4.io/master/en/flight_controller/pixhawk_series.html (accessed on 23 February 2022).
- Microelectronics, S.T. LSM303D Ultra-Compact High-Performance eCompass Module: 3D Accelerometer and 3D Magnetometer. 2013. Available online: https://www.st.com/en/mems-and-sensors/lsm303d.html (accessed on 17 February 2022).
- Invensense, T.D.K. MPU-9250 Product Specification. 2016. Available online: https://invensense.tdk.com/wp-content/uploads/2015/02/PS-MPU-9250A-01-v1.1.pdf (accessed on 17 February 2022).
- ArduPilot Development Team. ArduPilot. 2020. Available online: https://ardupilot.org/planner/index.html (accessed on 17 February 2022).
- National Oceanic and Atmospheric Administration. Magnetic Field Calculators. Available online: https://www.ngdc.noaa.gov/geomag/calculators/magcalc.shtml#igrfwmm (accessed on 17 February 2022).
- García, J.; Molina, J.M.; Trincado, J.; Sánchez, J. Analysis of sensor data and estimation output with configurable UAV platforms. In Proceedings of the 2017 Sensor Data Fusion: Trends, Solutions, Applications (SDF), Bonn, Germany, 10–12 October 2017; pp. 1–6. [Google Scholar] [CrossRef]
Figure 1.
Testing facility scheme with components.

Figure 2.
Relation between magnetic field in each axis and intensity applied. Linear fitting is shown for each power supply. I represents the current intensity, Bxx the magnetic field measured in the x direction, Byy in the y direction, and Bzz in the z direction.
Figure 2.
Relation between magnetic field in each axis and intensity applied. Linear fitting is shown for each power supply. I represents the current intensity, Bxx the magnetic field measured in the x direction, Byy in the y direction, and Bzz in the z direction.

Figure 3.
Mission Planner Pixhawk data display, highlighting some sensor data as magnetometer or gyroscope measurements.
Figure 3.
Mission Planner Pixhawk data display, highlighting some sensor data as magnetometer or gyroscope measurements.

Figure 4.
Power supply intensity values for the rotation test. The left side shows information for the test around the z-axis, whereas the right side shows information for the test around the y-axis. Ix represents intensity applied on the x-axis coil, Iy the intensity applied on the y-axis coil and Iz the intensity applied on z-axis coil. Orange arrows show the direction of tests.

Figure 5.
Pixhawk and HMR2300 gaussmeter placed in a 3D printed cage in the Helmholtz-based testing facility.
Figure 5.
Pixhawk and HMR2300 gaussmeter placed in a 3D printed cage in the Helmholtz-based testing facility.

Figure 6.
Left: Magnetic field rotation test around z-axis for X, Y and Z directions, showing mean value (solid lines) and error bars (vertical segments) for standard gaussmeter (blue) and for Pixhawk (orange). B represents magnetic field, with Bx being the x-axis magnetic field, By the y-axis magnetic field and Bz the z-axis magnetic field; t represents time. Right: Magnetic field rotation test around y-axis for X, Y and Z directions, showing mean value (solid lines) and error bars (vertical segments) for standard gaussmeter (blue) and for Pixhawk (orange). B represents magnetic field, with Bx being the x-axis magnetic field, By the y-axis magnetic field and Bz the z-axis magnetic field; t represents time.

Figure 7.
Magnetic field stability test results. B represents magnetic field, with Bx being the X-axis magnetic field, By the Y-axis magnetic field, and Bz the Z-axis magnetic field; t represents time.
Figure 7.
Magnetic field stability test results. B represents magnetic field, with Bx being the X-axis magnetic field, By the Y-axis magnetic field, and Bz the Z-axis magnetic field; t represents time.


Table 1.
Pixhawk and magnetometer sensor models. Pixhawks 1 to 4 are different units of the same model.
Table 1.
Pixhawk and magnetometer sensor models. Pixhawks 1 to 4 are different units of the same model.
| Pixhawk Reference | Model | Magnetic Measurement Range (G) | Magnetic Sensitivity (mG/LSB) | Magnetometer Model |
|---|---|---|---|---|
| Pixhawk 1 | 2.4.8 | 12 | 0.479 | ST Micro LSM303D 3 [18] |
| Pixhawk 2 | 2.4.8 | |||
| Pixhawk 3 | 2.4.8 | |||
| Pixhawk 4 | 2.4.8 | |||
| Pixhawk 5 | 1 | |||
| Pixhawk 6 | 2.1-CubeBlack | 12 | 0.479 | ST Micro LSM303D 3 [18] |
| 48 | 6 | MPU9250 [19] |
Table 2.
Helmholtz cage parameters, where B0 is the initial magnetic field at the Helmholtz cage centre, BOU is the magnetic field (NED coordinates) in Ourense (Spain) according to IGRF models, and Itest is the current intensity values used during the test.
Table 2.
Helmholtz cage parameters, where B0 is the initial magnetic field at the Helmholtz cage centre, BOU is the magnetic field (NED coordinates) in Ourense (Spain) according to IGRF models, and Itest is the current intensity values used during the test.
| Direction | B0 (mG) | BOU (mG) | Itest (A) |
|---|---|---|---|
| X | −382.47 | 246.63 | 2.205 |
| Y | 282.22 | −6.53 | −0.947 |
| Z | 95.73 | 382.32 | −1.666 |
Table 3.
Maximum peak-to-peak amplitude of magnetic field BPP considering the three axes.
| Magnetometer Test | Instrument | BPP (mG) |
|---|---|---|
| Pixhawk-1 | HMR2300 | 2.5 |
| Pixhawk | 40 | |
| Pixhawk-2 | HMR2300 | 5.3 |
| Pixhawk | 86 | |
| Pixhawk-3 | HMR2300 | 5.4 |
| Pixhawk | 65 | |
| Pixhawk-4 | HMR2300 | 2.2 |
| Pixhawk | 116 | |
| Pixhawk-5 | HMR2300 | 1.5 |
| Pixhawk | 42 | |
| Pixhawk-6 | HMR2300 | 1.3 |
| Pixhawk-mag2 | 25 | |
| Pixhawk-mag3 | 49 |
Publisher’s Note: MDPI stays neutral with regard to jurisdictional claims in published maps and institutional affiliations. |
© 2022 by the authors. Licensee MDPI, Basel, Switzerland. This article is an open access article distributed under the terms and conditions of the Creative Commons Attribution (CC BY) license (https://creativecommons.org/licenses/by/4.0/).
Share and Cite
MDPI and ACS Style
Fariñas-Álvarez, N.; Navarro-Medina, F.; González-Jorge, H. Metrological Validation of Pixhawk Autopilot Magnetometers in Helmholtz Cage. World Electr. Veh. J. 2022, 13, 85. https://doi.org/10.3390/wevj13050085
AMA Style
Fariñas-Álvarez N, Navarro-Medina F, González-Jorge H. Metrological Validation of Pixhawk Autopilot Magnetometers in Helmholtz Cage. World Electric Vehicle Journal. 2022; 13(5):85. https://doi.org/10.3390/wevj13050085
Chicago/Turabian StyleFariñas-Álvarez, Noelia, Fermín Navarro-Medina, and Higinio González-Jorge. 2022. "Metrological Validation of Pixhawk Autopilot Magnetometers in Helmholtz Cage" World Electric Vehicle Journal 13, no. 5: 85. https://doi.org/10.3390/wevj13050085