
Shoreline Changes on the Wave-Influenced Senegal River Delta, West Africa: The Roles of Natural Processes and Human Interventions

 and
and 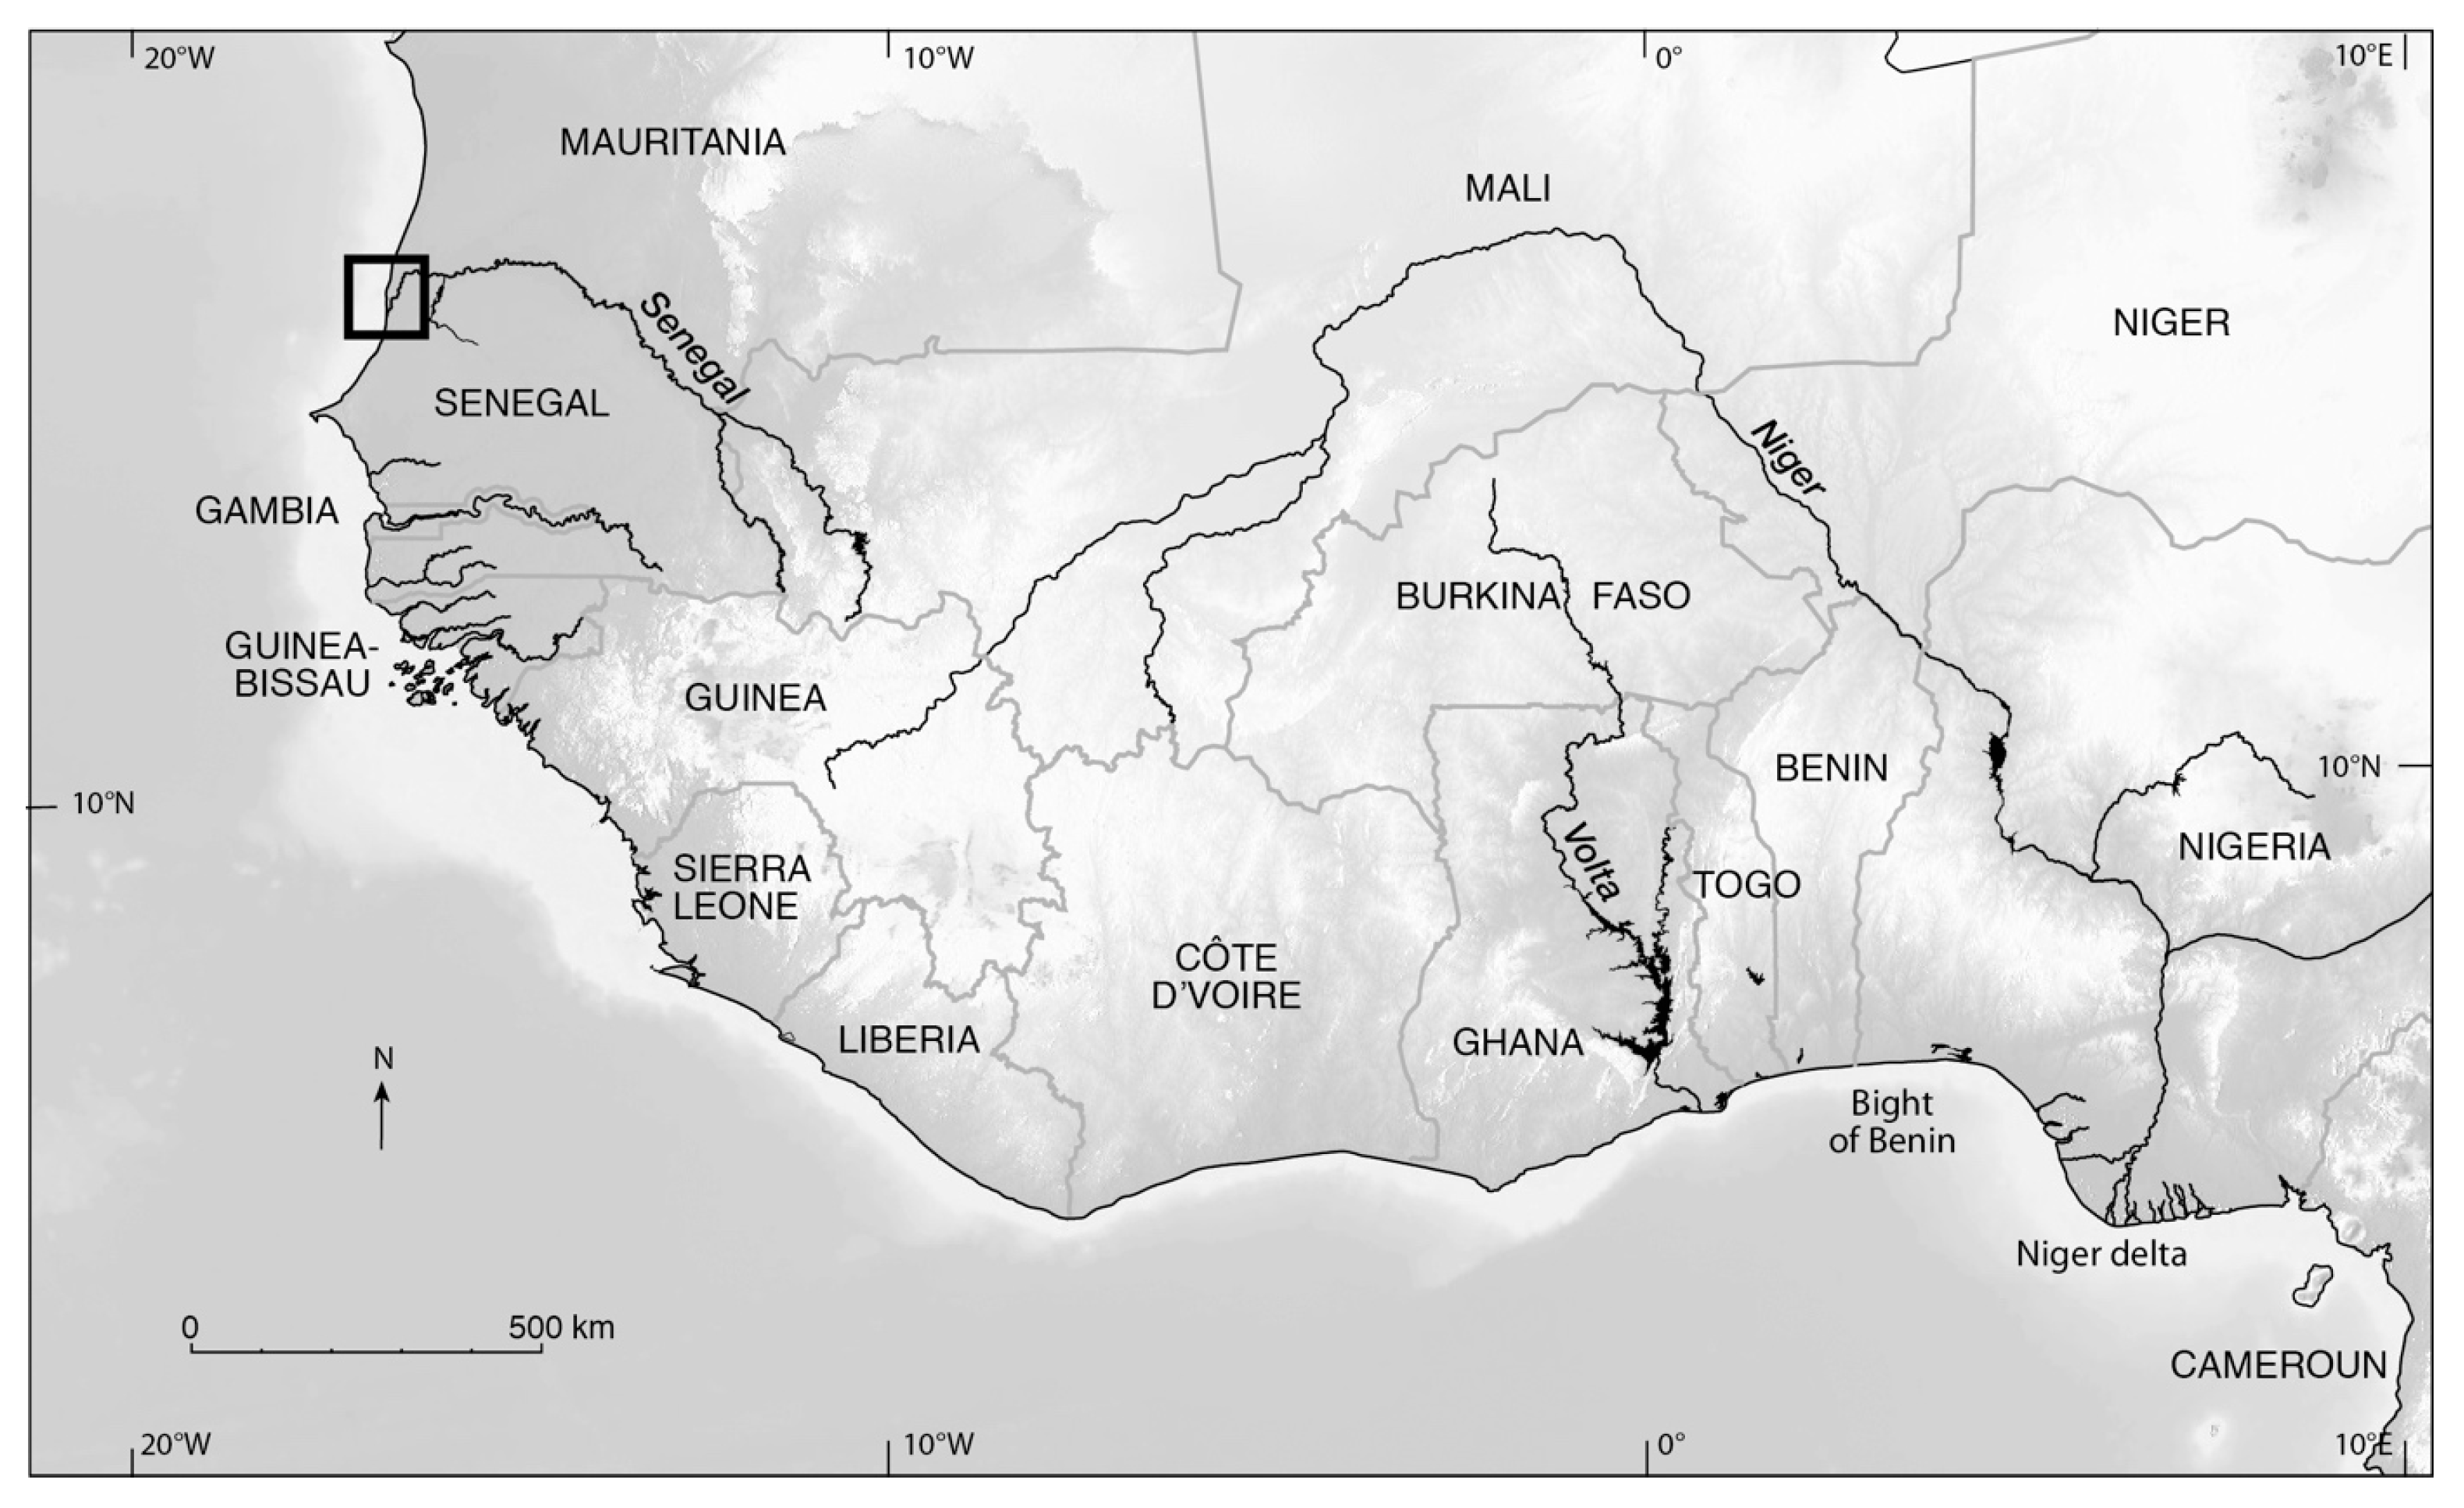
Abstract
:1. Introduction
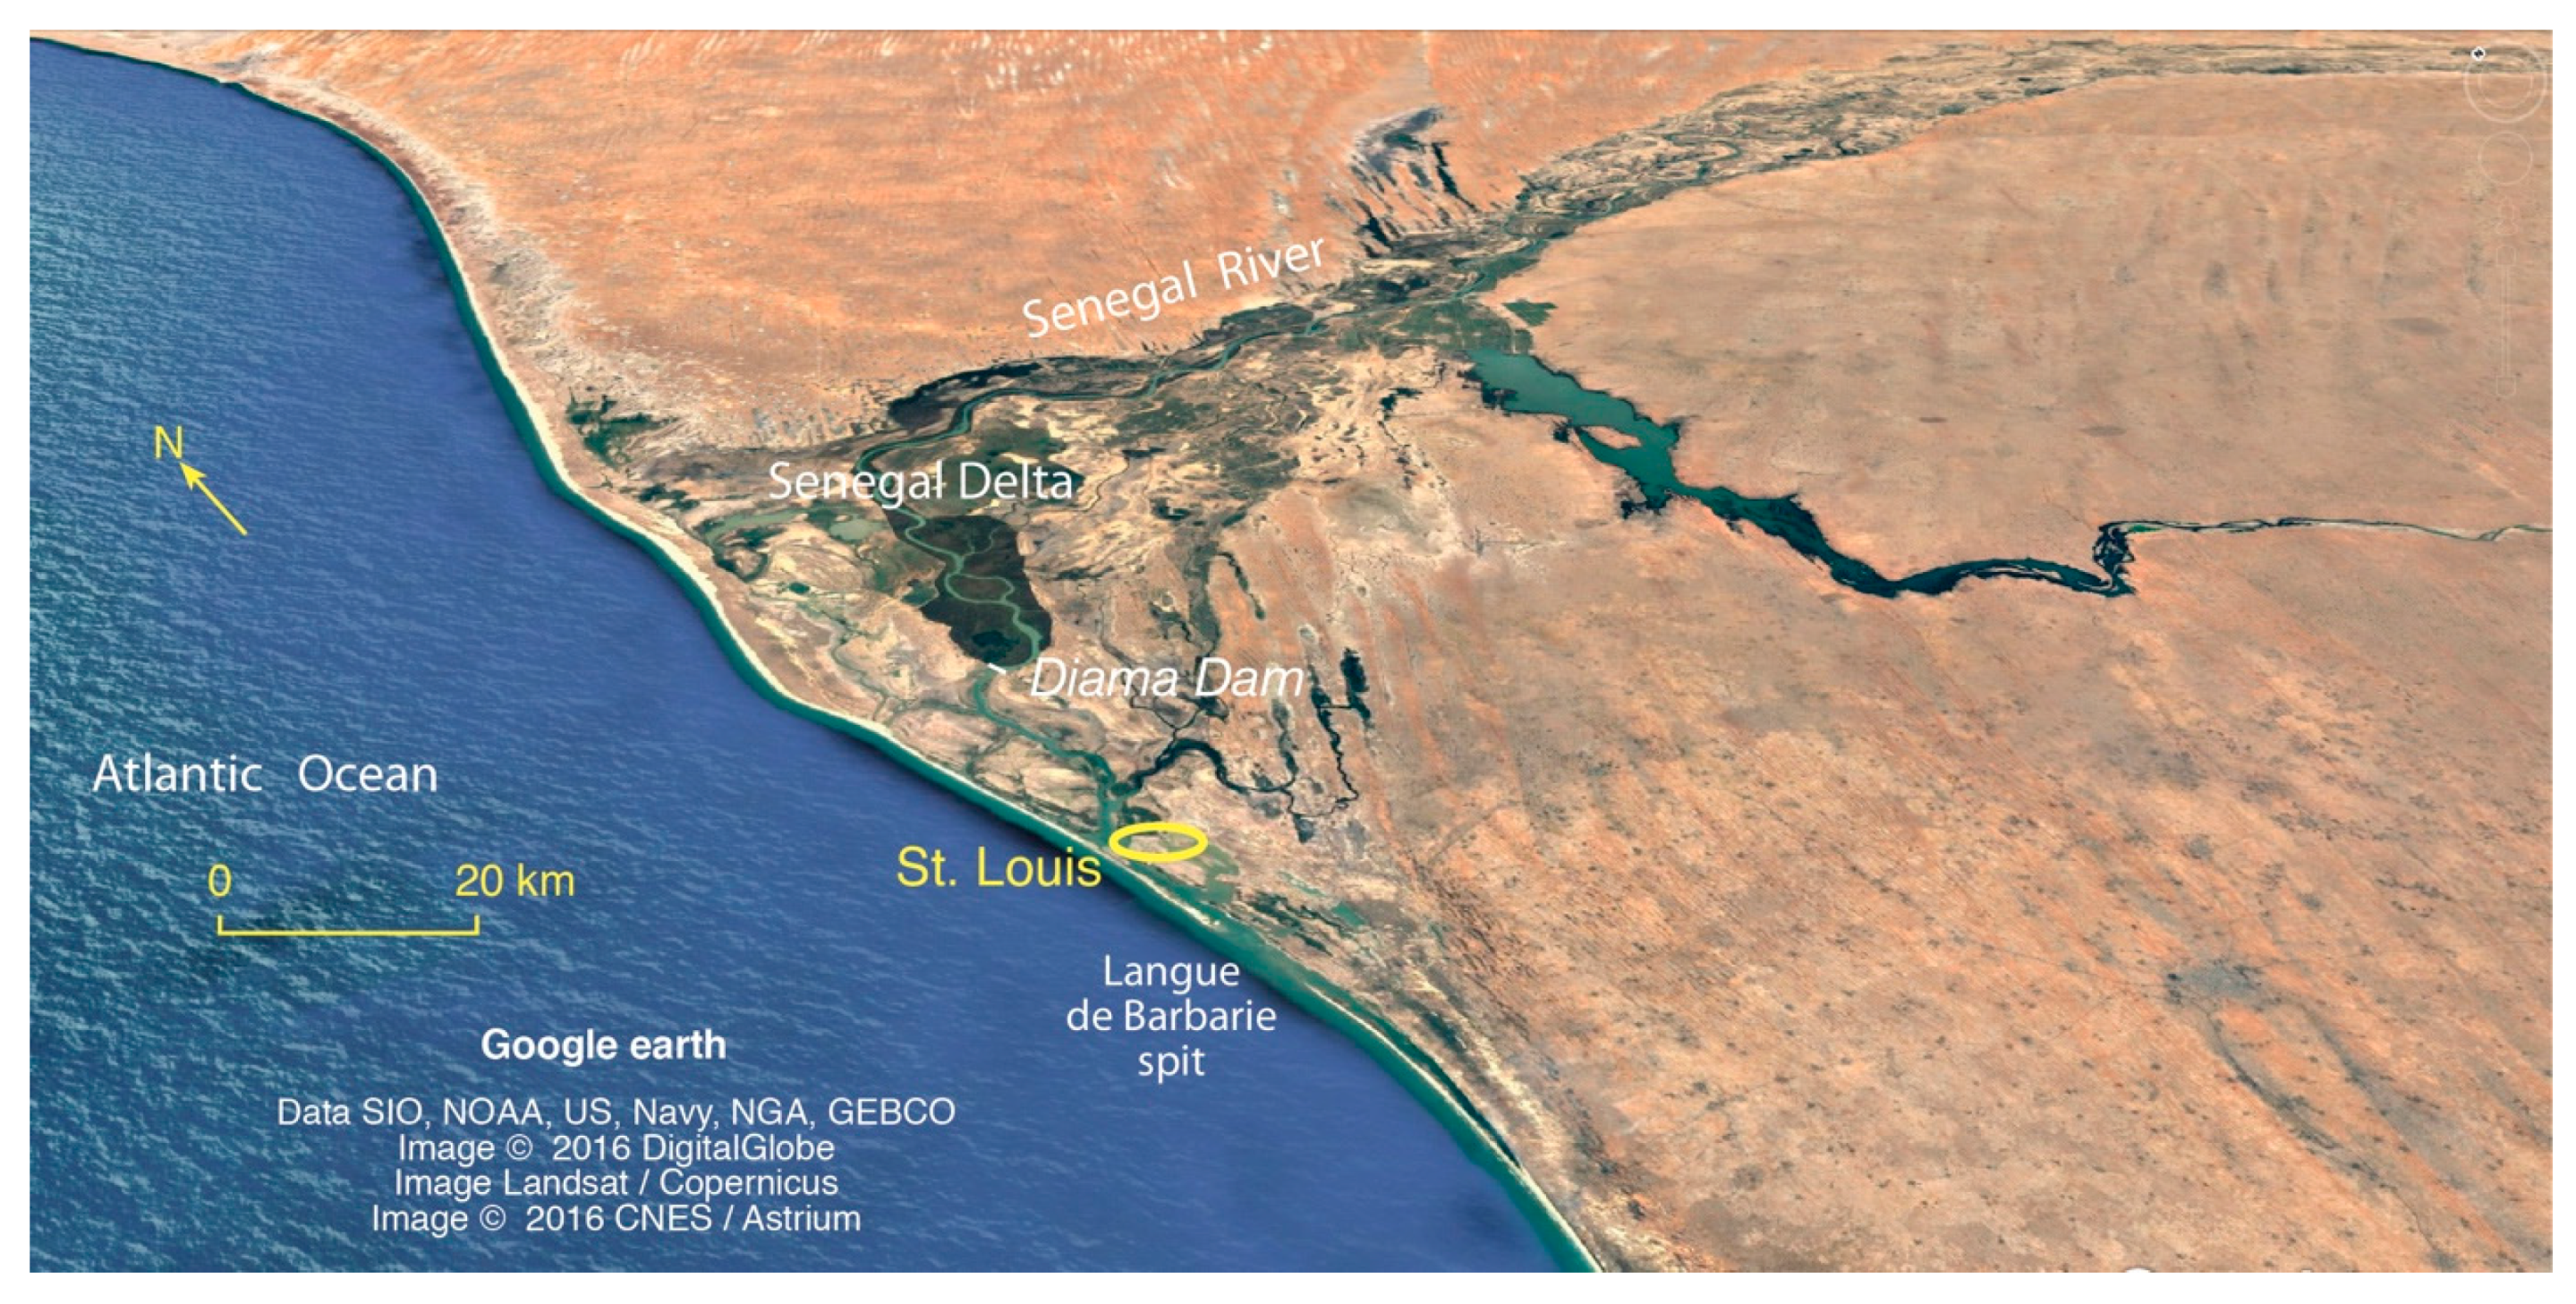
2. The Senegal River and Delta
3. Results
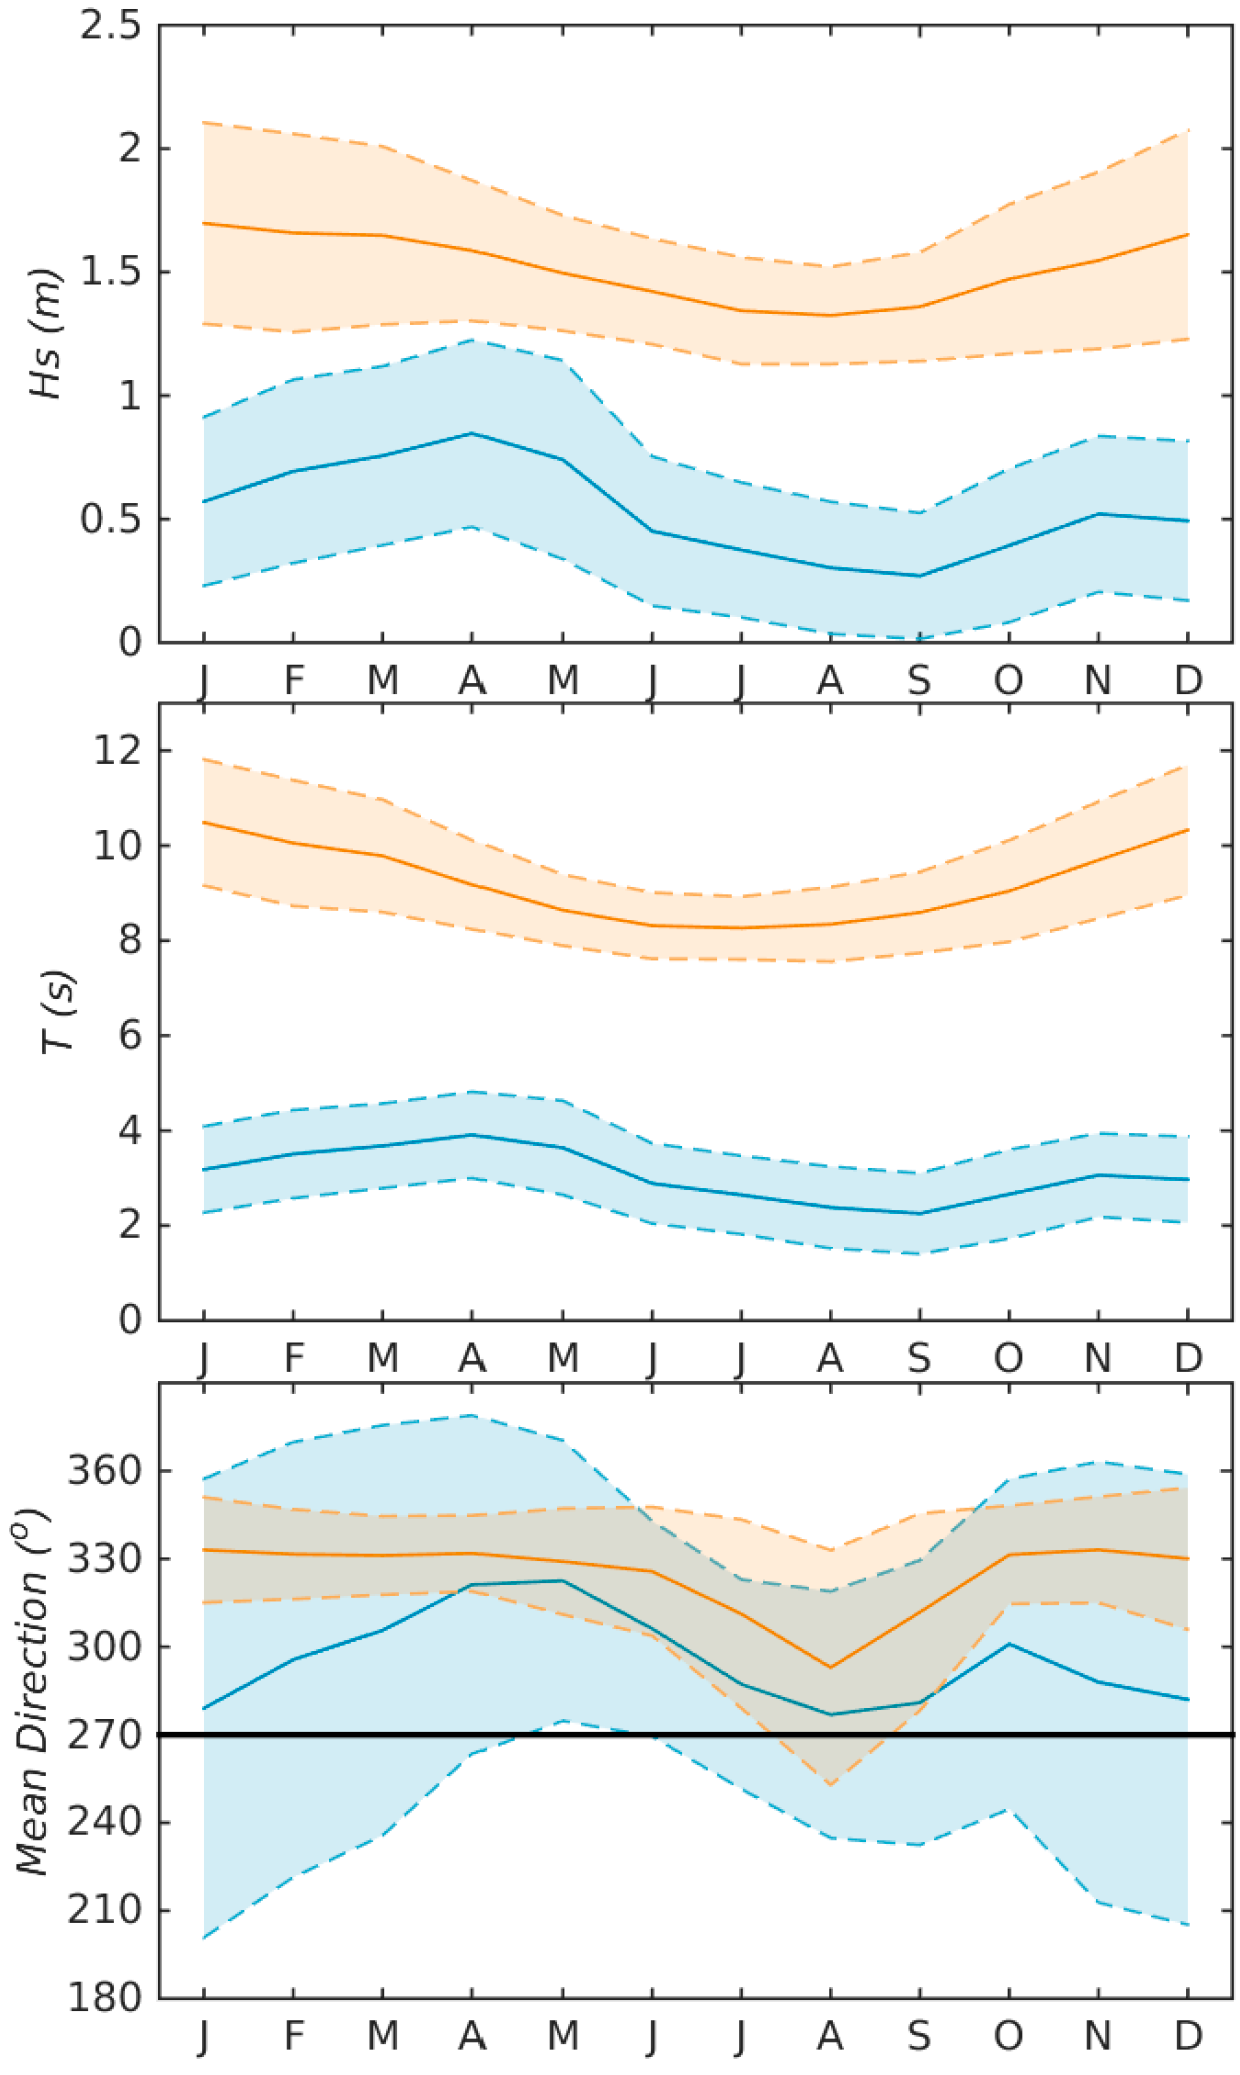
3.1. Wave Climate and Alongshore Sediment Transport
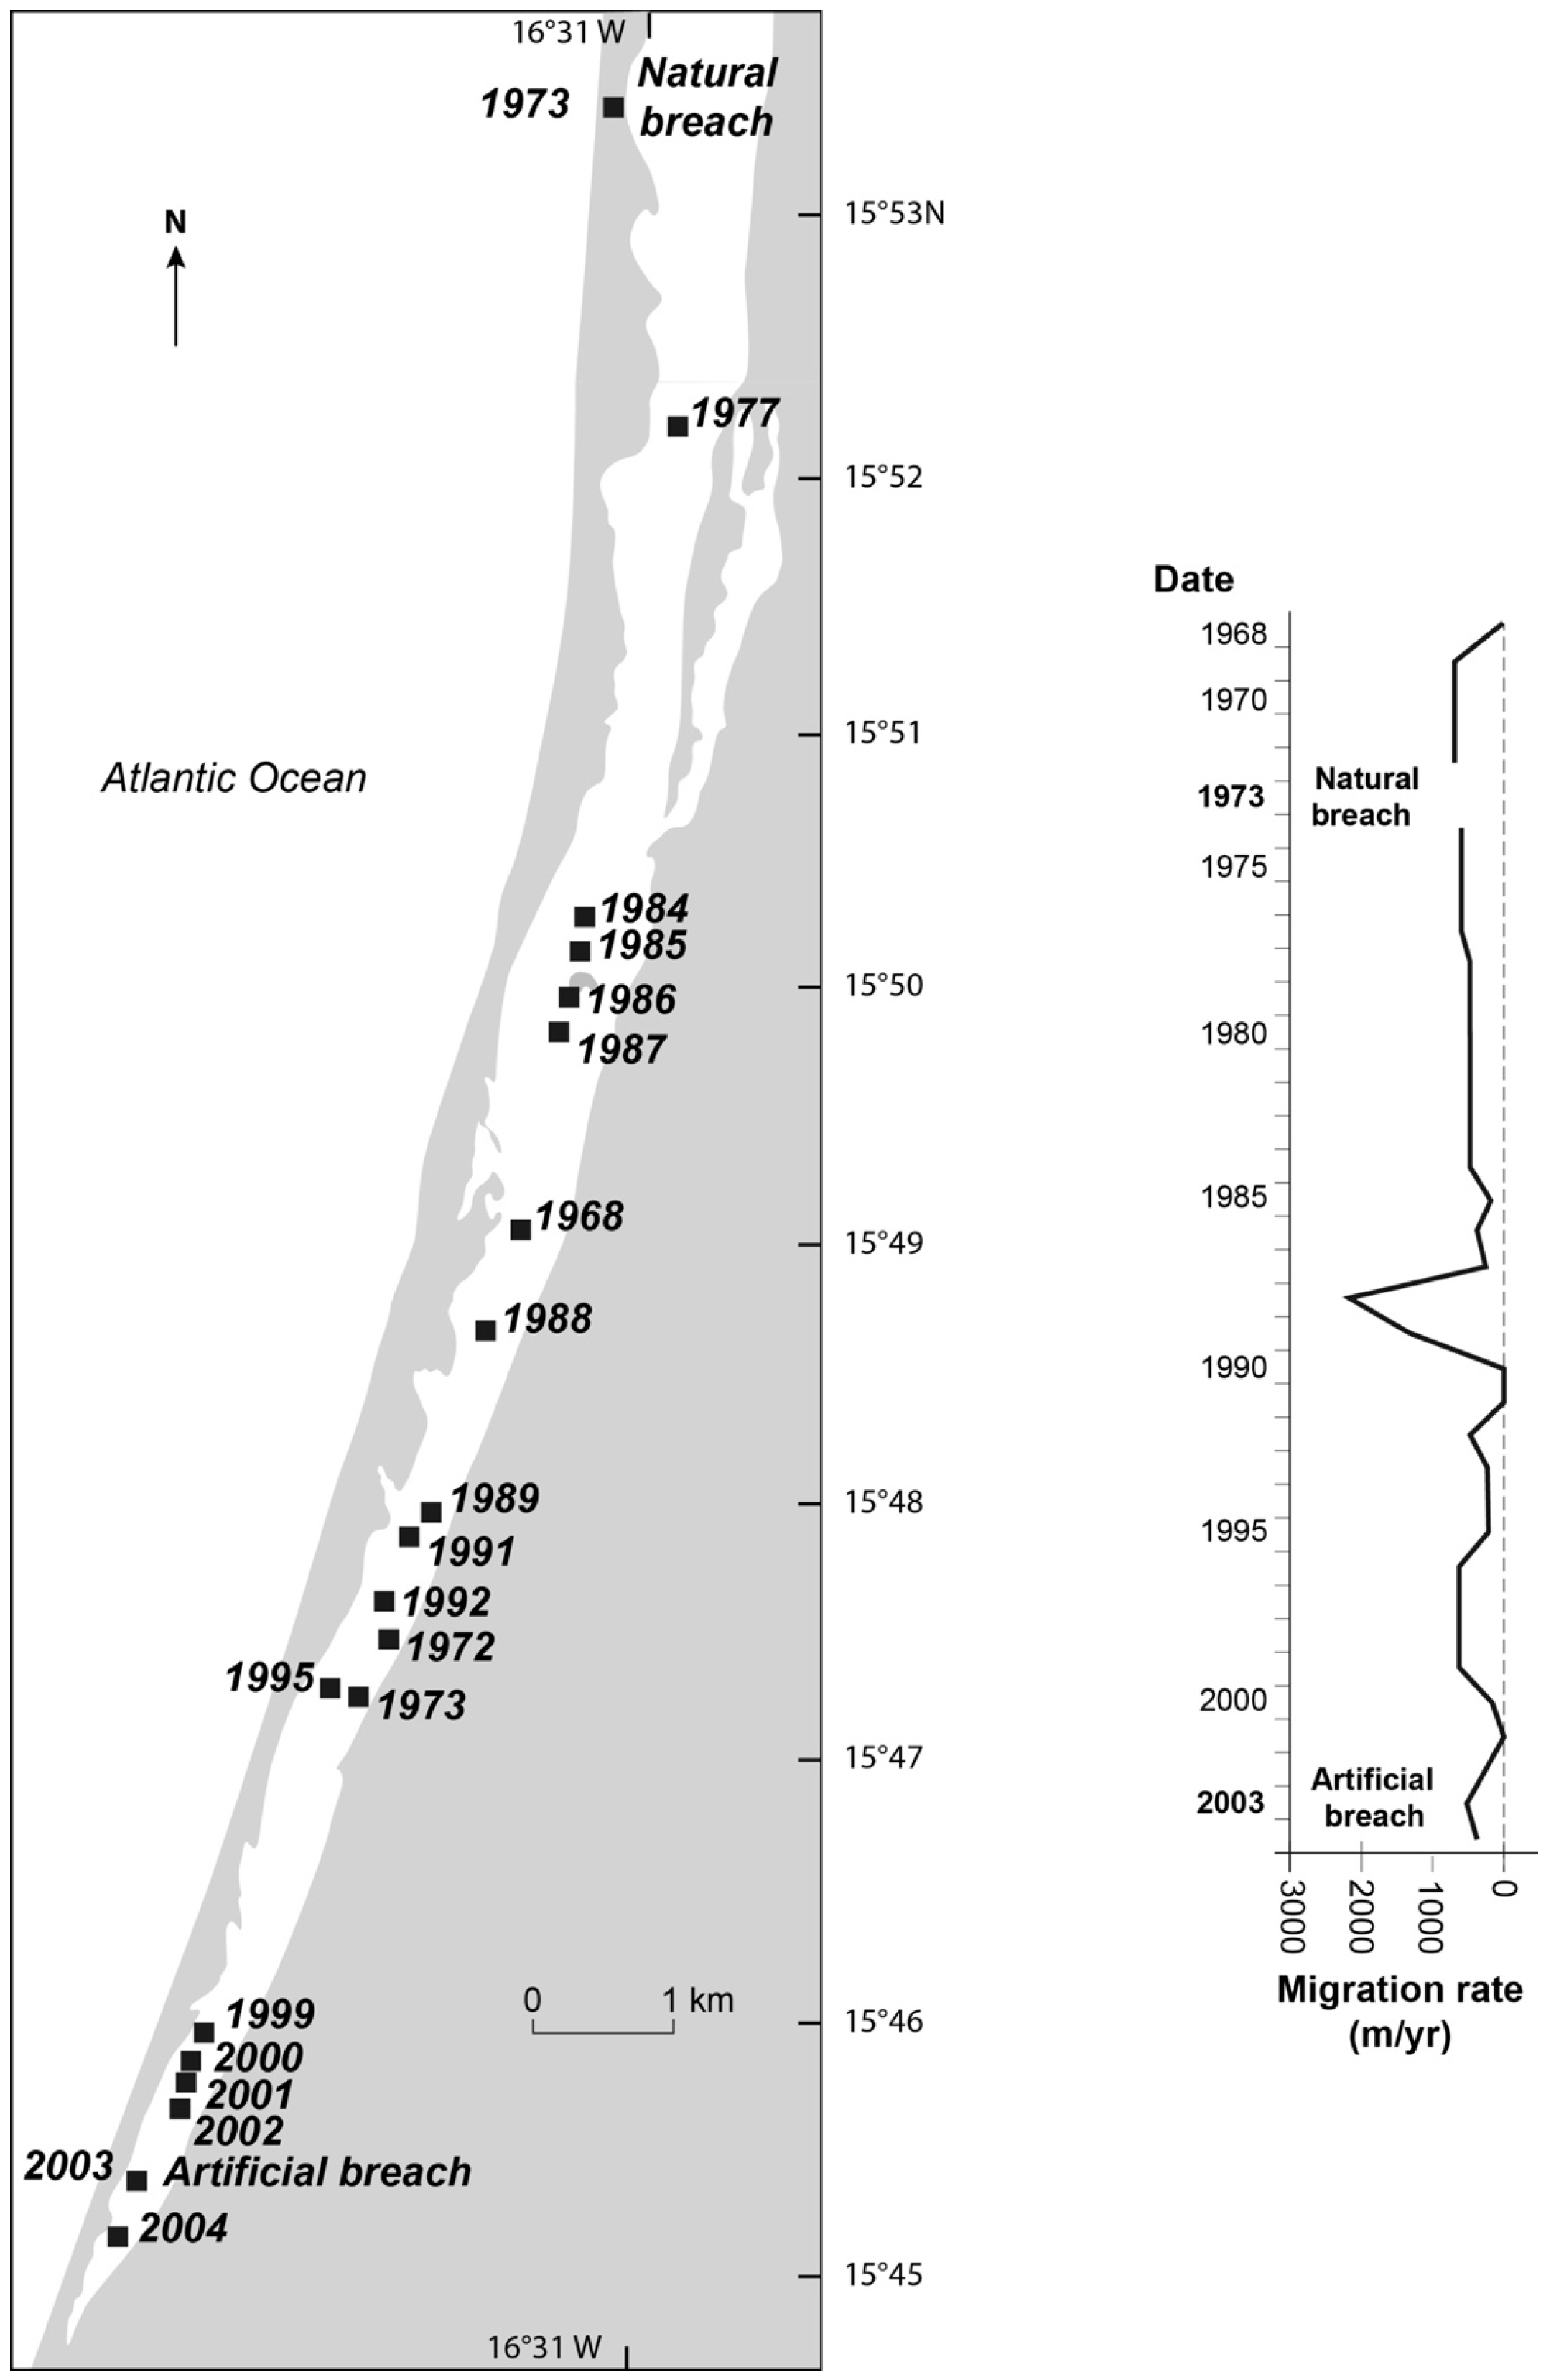
3.2. LST and Growth Dynamics of the Langue de Barbarie Spit
3.3. Historical and Recent Changes of the Langue de Barbarie Spit Prior to the 2003 Artificial Breach
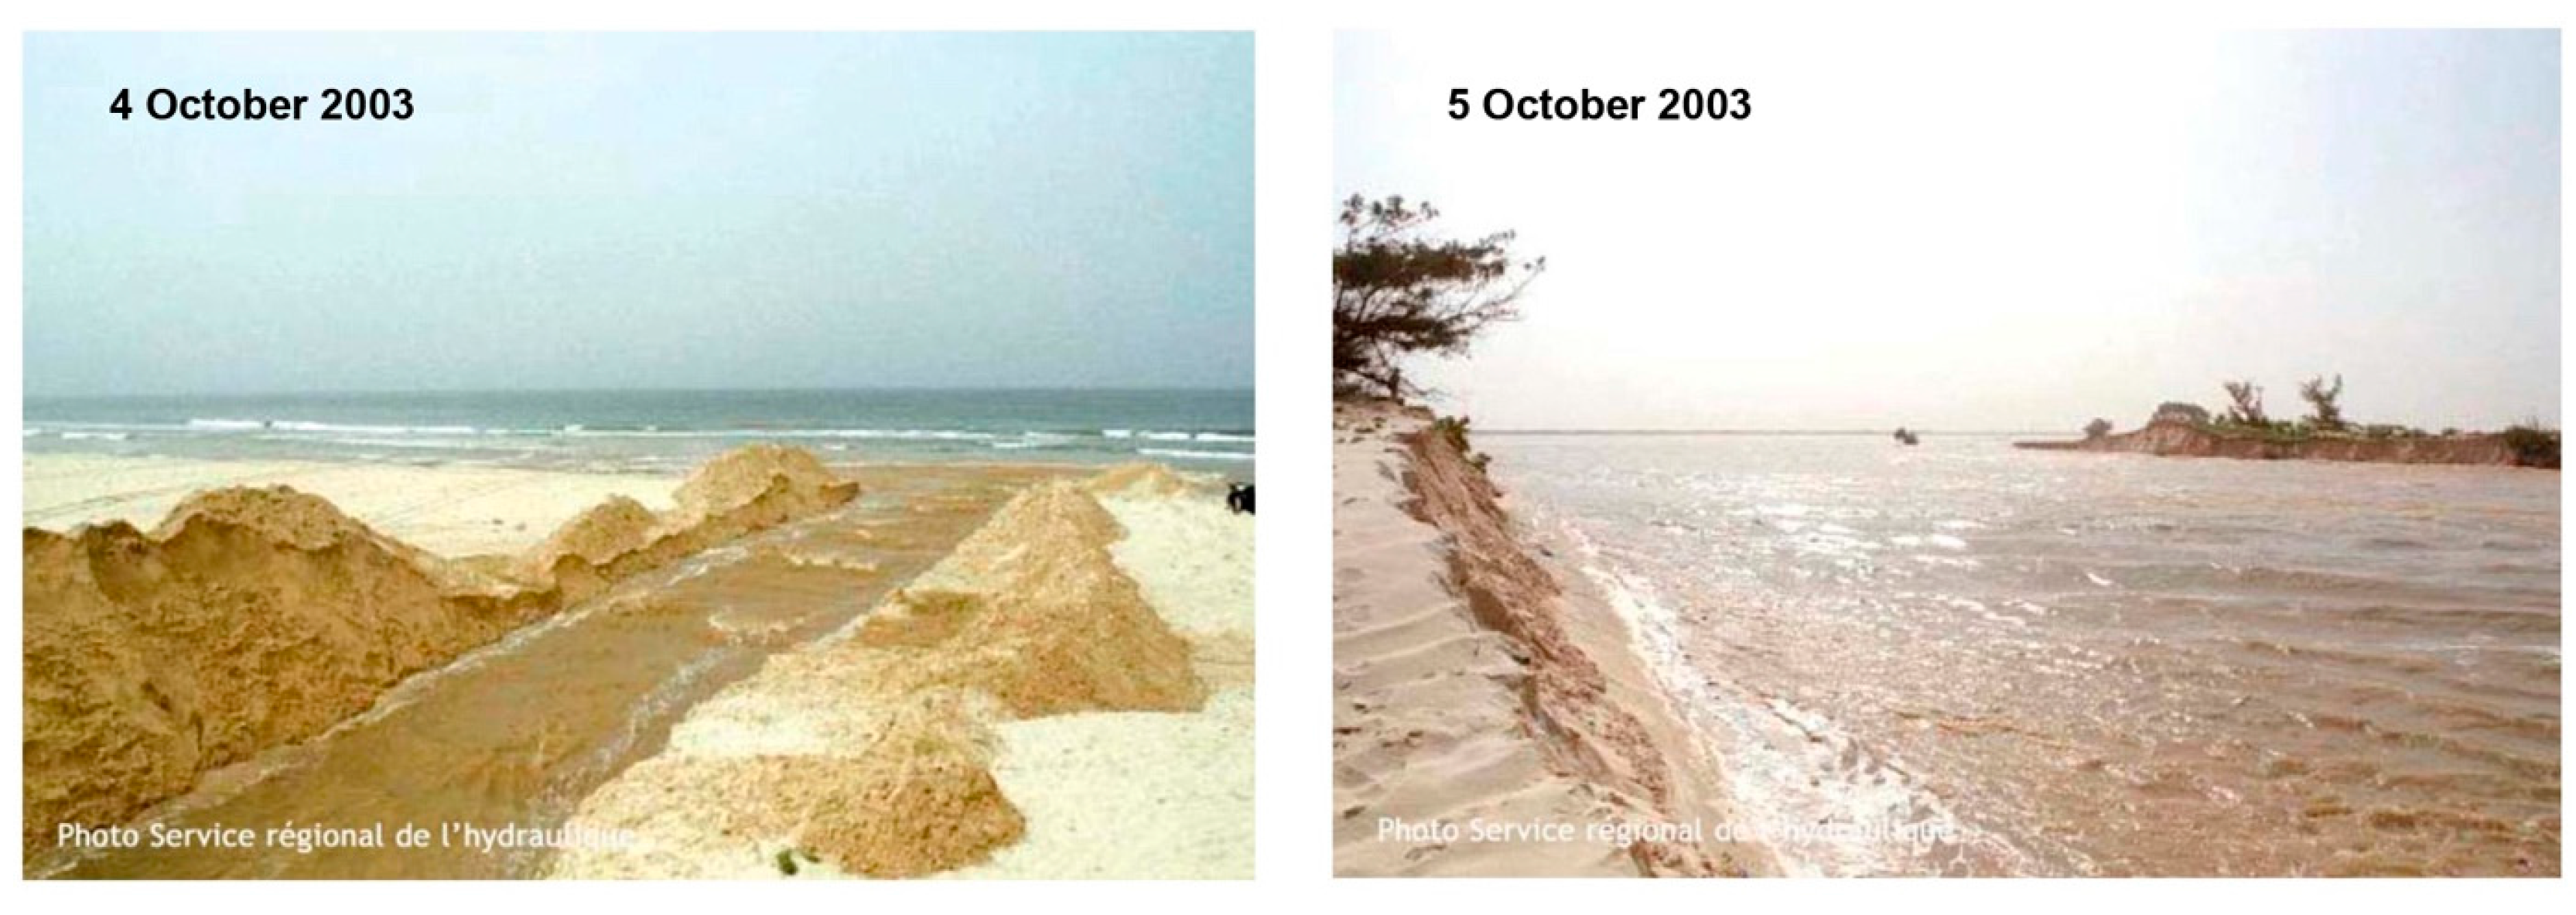
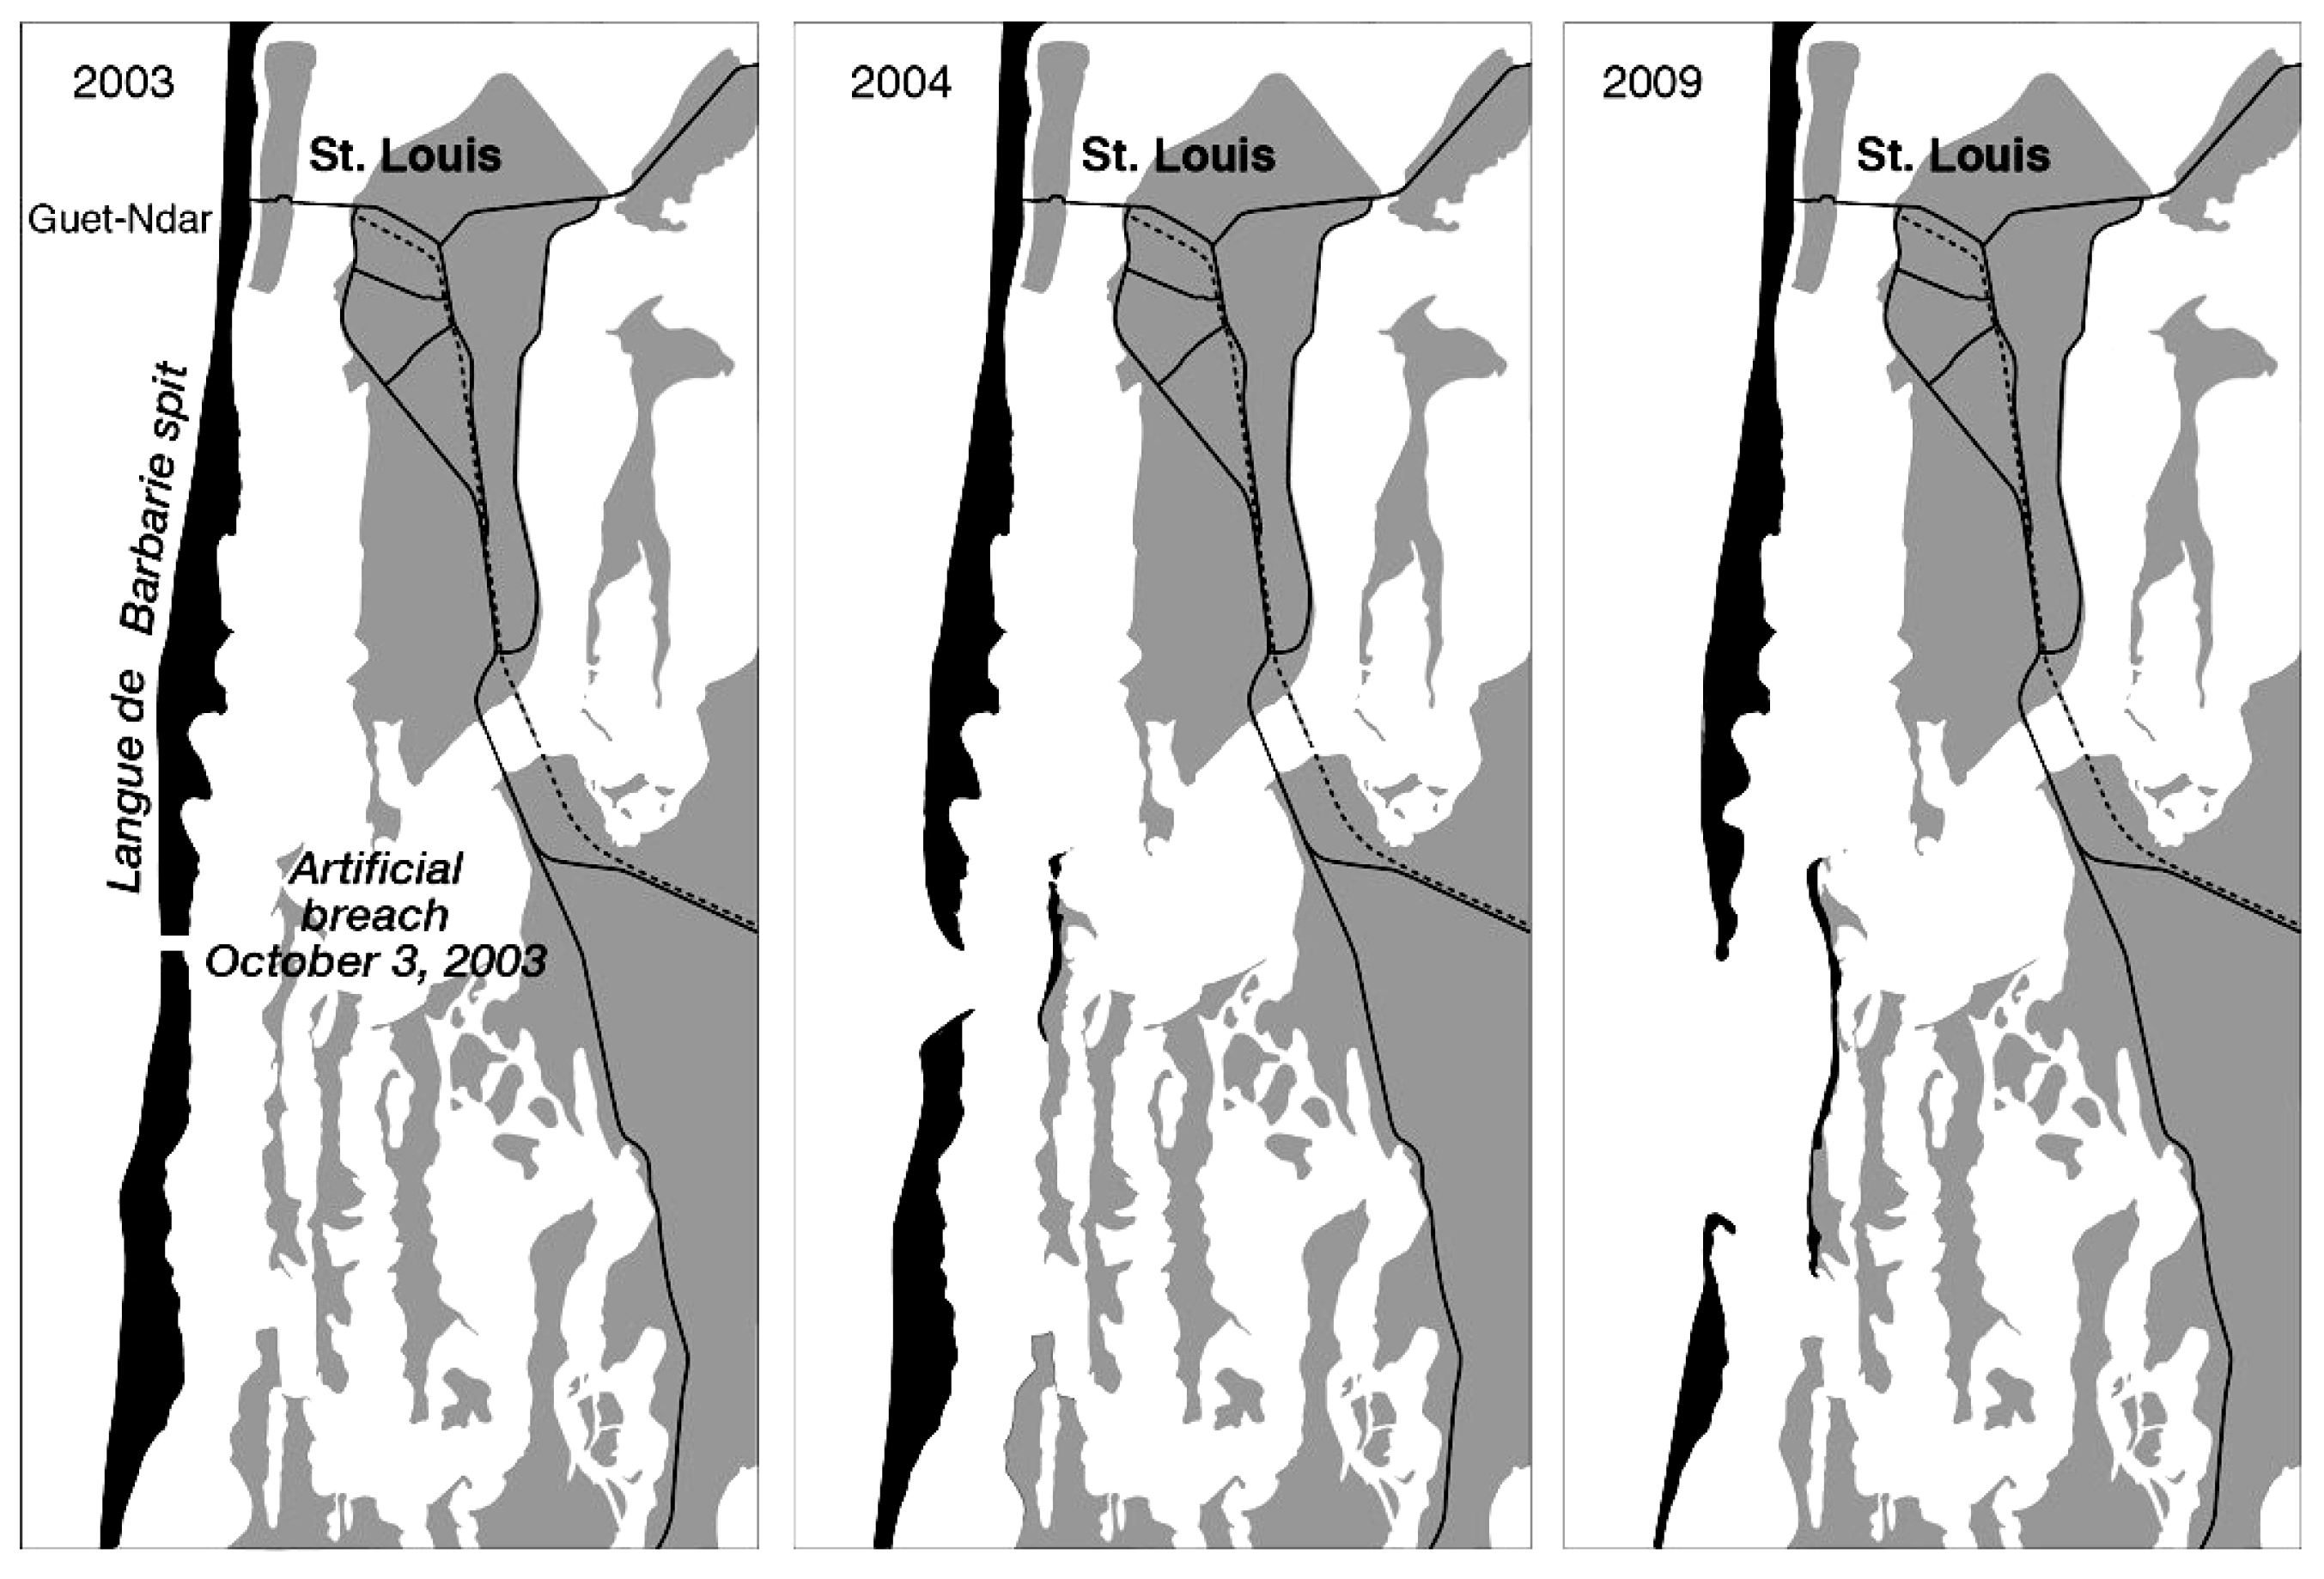
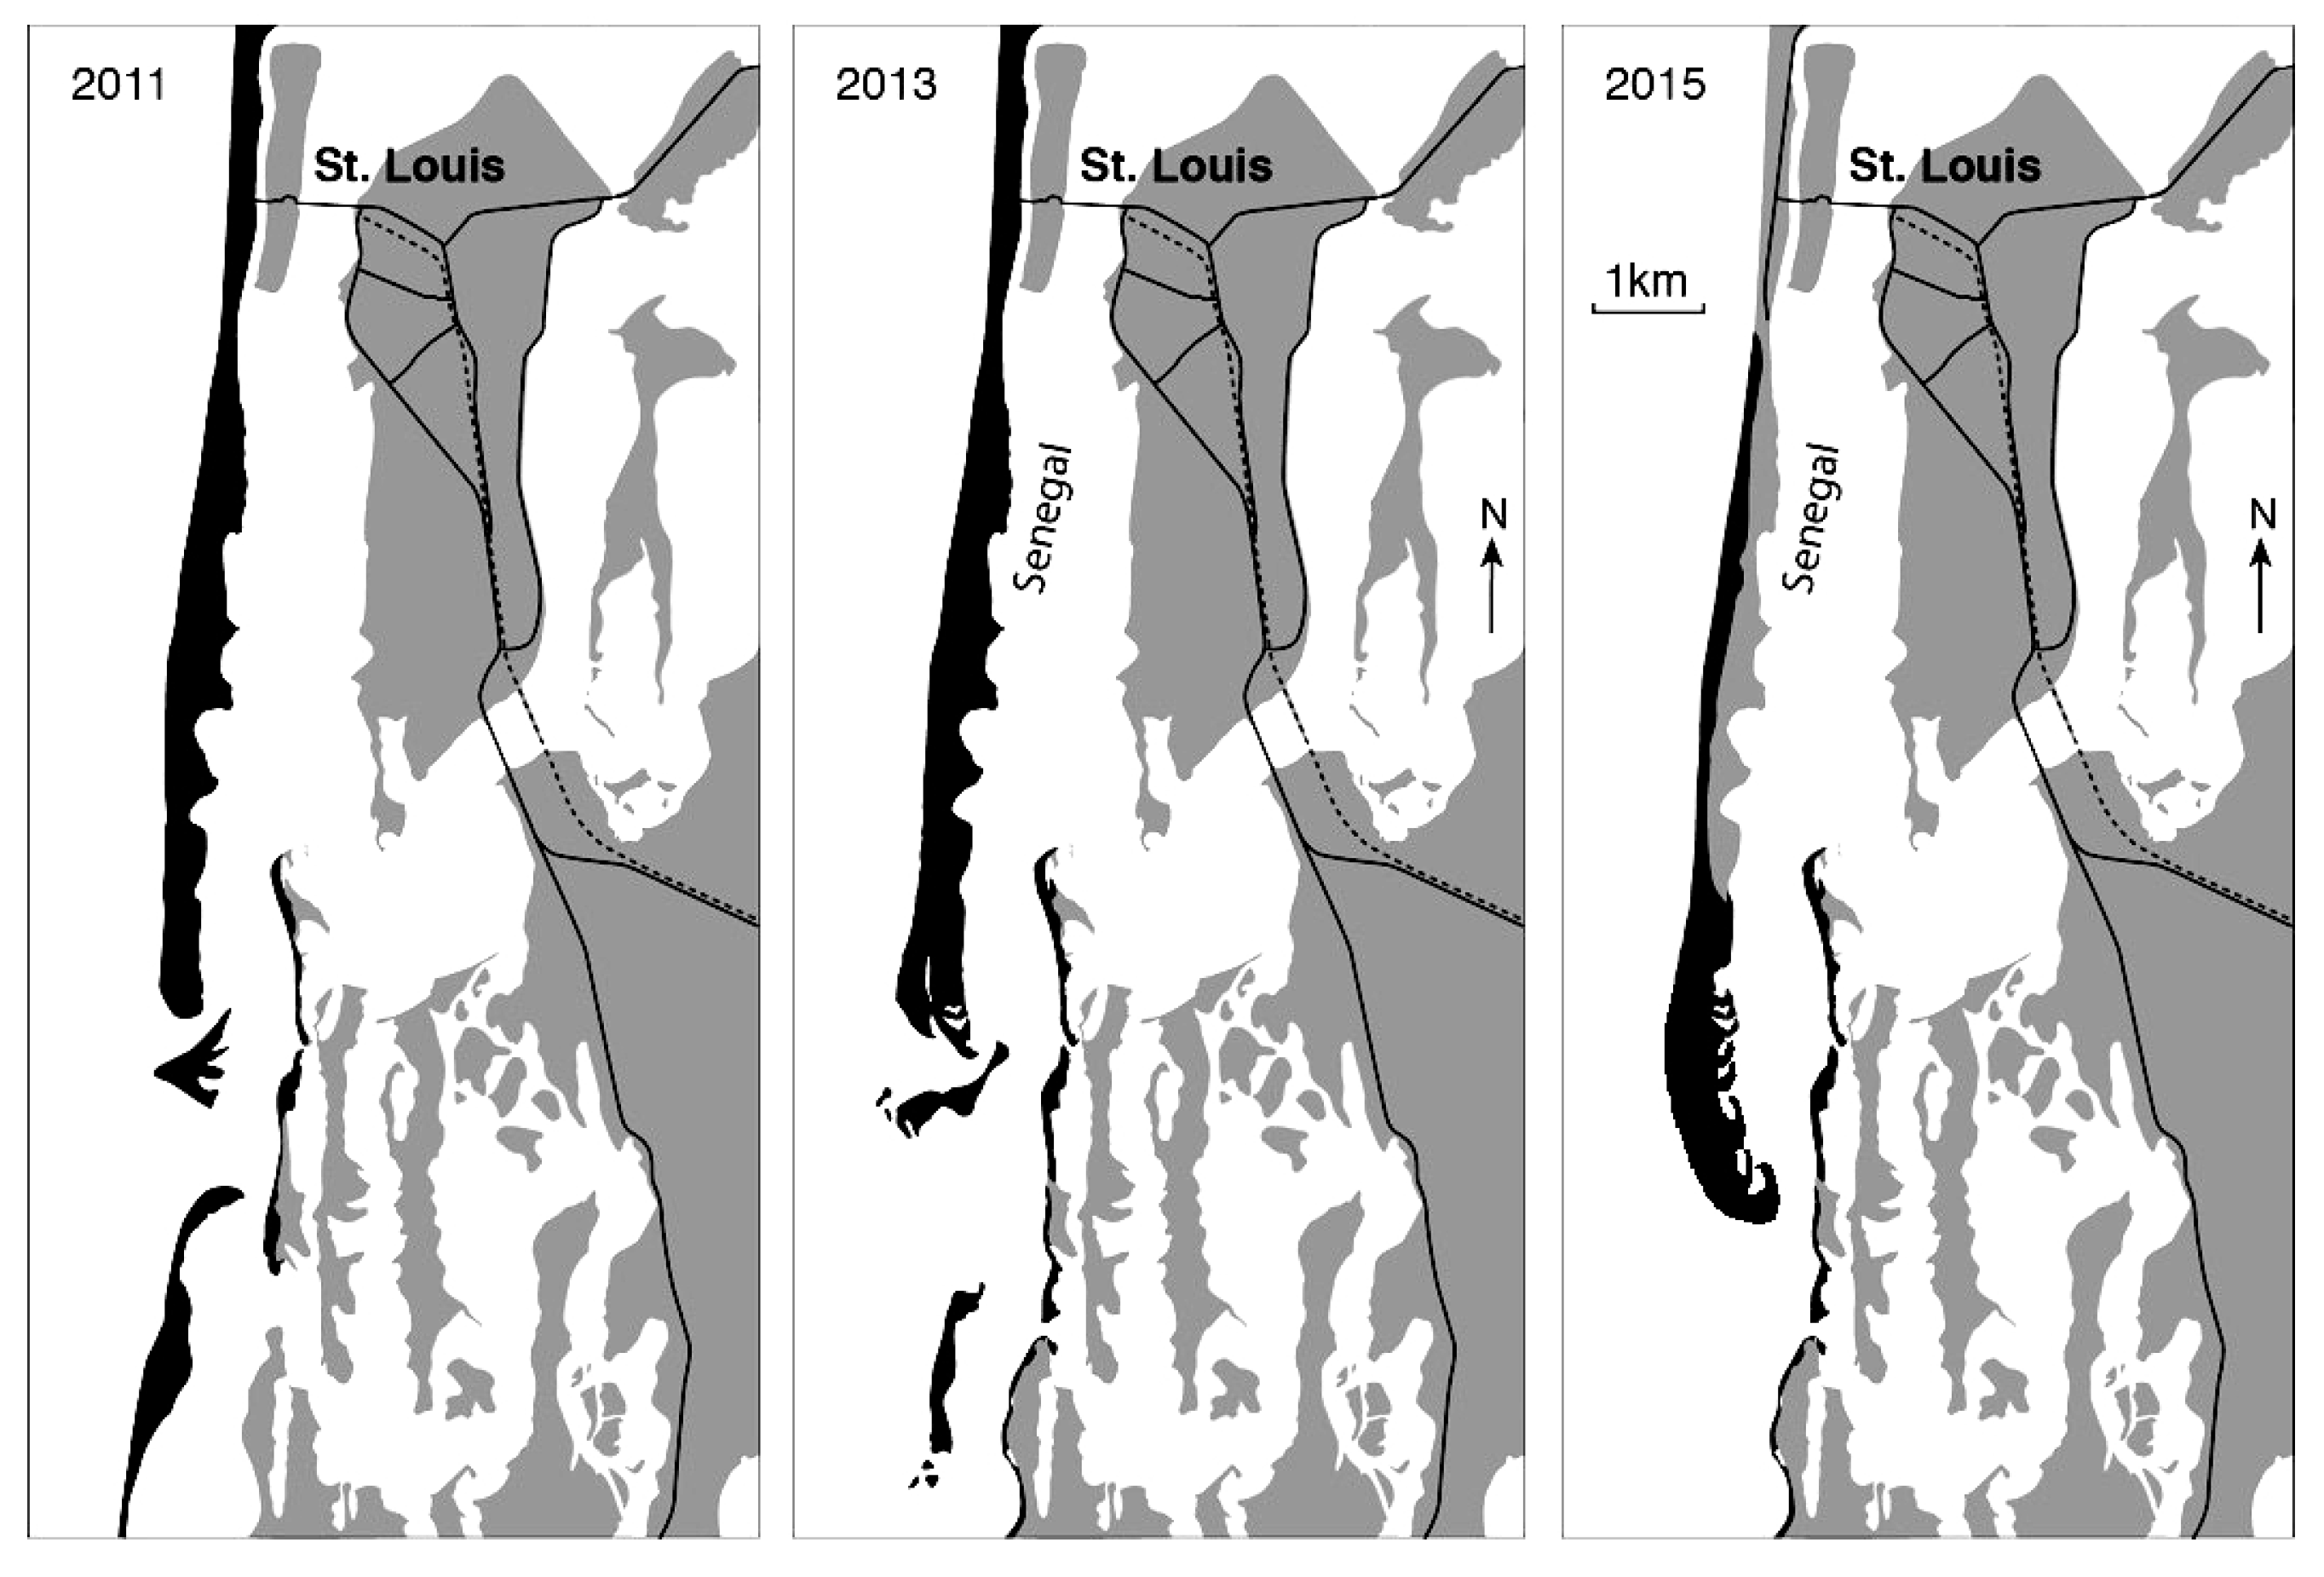
3.4. The Artificial Breach in 2003 and Post-Breach Spit and River-Mouth Evolution
4. Discussion
5. Materials and Methods
5.1. Waves and Wave-Induced Longshore Transport
5.2. Shoreline Change and Spit and River-Mouth Dynamics
Acknowledgments
Author Contributions
Conflicts of Interest
References
- Crossland, C.J.; Kremer, H.H.; Lindeboom, H.J.; Marshall Crossland, J.I.; Le Tissier, M.D.A. Coastal Fluxes in the Anthropocene; Springer: Berlin, Germany, 2007; p. 231. [Google Scholar]
- Van Rijn, L.C. Coastal erosion and control. Ocean Coast. Manag. 2011, 54, 867–887. [Google Scholar] [CrossRef]
- Davies, J.L. Geographical Variation in Coastal Development, 2nd ed.; Longman: London, UK, 1980; p. 212. [Google Scholar]
- Anthony, E.J. Coastal progradation in response to variations in sediment supply, wave energy and tidal range: Examples from Sierra Leone, West Africa. Géodynamique 1991, 6, 57–70. [Google Scholar]
- Anthony, E.J. The muddy tropical coast of West Africa from Sierra Leone to Guinea-Bissau: Geological heritage, geomorphology and sediment dynamics. Afr. Geosci. Rev. 2006, 13, 227–237. [Google Scholar]
- Diatta, I. L’ouverture d’une Brèche à Travers la Langue de Barbarie (Saint-Louis du Sénégal). Les Autorités Publiques et les Conséquences de la Rupture. Master’s Thesis, Université Gaston Berger, St Louis, Senegal, 2004; p. 116. (In French). [Google Scholar]
- Sy, B.A. L’ouverture de la brèche sur la Langue de Barbarie et ses conséquences. Approche géomorphologique. Revue de Géographie de Saint-Louis 2004, 4, 50–60. (In French) [Google Scholar]
- Bhattacharya, J.P.; Giosan, L. Wave-influenced deltas: Geomorphological implications for facies reconstruction. Sedimentology 2003, 50, 187–210. [Google Scholar] [CrossRef]
- Coleman, J.M.; Huh, O.K. Major Deltas of the World: A Perspective from Space; Coastal Studies Institute, Louisiana State University: Baton Rouge, LA, USA, 2004. [Google Scholar]
- Anthony, E.J. Patterns of sand spit development and their management implications on deltaic, drift-aligned coasts: The cases of the Senegal and Volta River delta spits, West Africa. In Sand and Gravel Spits; Randazzo, G., Cooper, J.A.G., Eds.; Springer: Berlin, Germany, 2015; Volume 12, pp. 21–36. [Google Scholar]
- Anthony, E.J. Wave influence in the construction, shaping and destruction of river deltas: A review. Mar. Geol. 2015, 361, 53–78. [Google Scholar] [CrossRef]
- Nienhuis, J.H.; Ashton, A.D.; Giosan, L. What makes a delta wave-dominated? Geology 2015, 43, 511–514. [Google Scholar] [CrossRef]
- Galloway, W.E. Process framework for describing the morphologic and stratigraphic evolution of delta depositional systems. In Deltas: Models for Exploration; Broussard, M.L., Ed.; Texas Geological Society: Houston, TX, USA, 1975; pp. 87–98. [Google Scholar]
- Sall, M. Crue et Elévation du Niveau Marin à Saint-Louis du Sénégal: Impacts Potentiels et Mesures D’adaptation. Ph.D. Thesis, Université du Maine, Le Mans, France, 2006. (In French). [Google Scholar]
- Kamara, S.; Martin, Ph.; Coly, A. Organisation traditionnelle du bas delta du Sénégal et nouvelles régulations hydrauliques. Dimension anthropospatiale d’un développement. Revue Espaces et Sociétés en Mutation 2015, 2015, 127–144. (In French) [Google Scholar]
- Mahé, G.; Olivry, J.C. Variations des précipitations et des écoulements en Afrique de l’Ouest et central de 1951 à 1989. Sécheresse 1995, 6, 109–117. (In French) [Google Scholar]
- Kane, A.; Niang-Fall, A. Hydrologie du Sénégal; Atlas Jeune Afrique: Dakar, Sénégal, 2007; p. 14. (In French) [Google Scholar]
- Ostenfeld, C.; Jonson, N. Etude de la Navigabilité et des Ports du Fleuve Sénégal; Études Portuaires à Saint-Louis, Kayes et Ambidebi. Vol. 1: Travaux Préliminaires; Vol. 2, Annexe 2: Rapport Sur les Enquêtes Hydrauliques; Surveyer-Nenninger et Chevenert Inc.: Montréal, QC, Canada, 1972. (In French) [Google Scholar]
- Gac, J.Y.; Kane, A. Le fleuve Sénégal. Bilan hydrique et flux continentaux de matières particulaires à l’embouchure. Sci. Geol. 1986, 39, 99–130 & 151–172. (In French) [Google Scholar]
- Food and Agriculture Organization of the United Nations (FAO). Caractérisation Des Systèmes de Production Agricole au Senegal; Document de Synthese; FAO: Rome, Italy, 2007. (In French) [Google Scholar]
- Michel, P. The southwestern Sahara margin: Sediments and climate change during the recent Quaternary. Palaeoecol. Afr. Surround. Isl. 1980, 12, 297–306. [Google Scholar]
- Monteillet, J. Environnements Sédimentaires et Paléohcologie du Delta du Sénégal au Quaternaire; Lmprimerie des Tilleuls: Millau, France, 1986; p. 267. (In French) [Google Scholar]
- Kaczmarek, L.M.; Ostrowski, R.; Pruszak, Z.; Rozynski, G. Selected problems of sediment transport and morphodynamics of a multi-bar nearshore zone. Estuar. Coast. Shelf Sci. 2005, 62, 415–425. [Google Scholar] [CrossRef]
- SOGREAH. Etudes de Faisabilité et D’avant Projet Sommaire de L’émissaire Delta; Rapport Final: Grenoble, France, 1994; p. 70. (In French) [Google Scholar]
- Barusseau, J.P.; Bâ, M.; Descamps, C.; Diop, E.S.; Diouf, B.; Kane, A.; Saos, J.L.; Soumaré, A. Morphological and sedimentological changes in the Senegal River estuary after the constuction of the Diama dam. J. Afr. Earth Sci. 1998, 26, 317–326. [Google Scholar] [CrossRef]
- Sall, M.M. Dynamique et Morphogenèse Actuelles au Sénégal Occidental. Ph.D. Thesis, Université Louis Pasteur-Strasbourg I, Strasbourg, France, 1982. (In French). [Google Scholar]
- Gac, J.Y.; Kane, A.; Monteillet, J. Migrations de l’embouchure du fleuve Sénégal depuis 1850. Cahiers ORSTOM Série Géologie 1982, 12, 73–76. (In French) [Google Scholar]
- Bâ, K.; Wade, S.; Niang, I.; Trébossen, H.; Rudant, J.P. Cartographie radar en zone côtière à l’aide d’images multidates RSO d’Ers-2: Application au suivi environnemental de la Langue de Barbarie et de l’estuaire du fleuve Sénégal. Télédétection 2007, 7, 129–141. (In French) [Google Scholar]
- Joiré, J. Amas de coquillages du littoral sénégalais dans la banlieu de Saint-Louis. Bulletin de l’Institut Français de l’Afrique Noire 1947, 9, 170–340. (In French) [Google Scholar]
- Tricart, J. Notice Explicative de la Carte Géomorphologique du Delta du Sénégal; Mémoires, B.R.G.M., Ed.; Bureau de Recherches Geologiques et Minieres: Orléans, France, 1961; Volume 8, p. 137. (In French) [Google Scholar]
- Nienhuis, J.H.; Ashton, A.D.; Nardin, W.; Fagherazzi, S.; Giosan, L. Alongshore sediment bypassing as a control on river mouth morphodynamics. J. Geophys. Res. Earth Surf. 2016, 121, 664–683. [Google Scholar] [CrossRef]
- Guilcher, A.; Nicholas, J.P. Observation sur la Langue de Barbarie et les bras du Sénégal aux environs de Saint-Louis. Bulletin d’Information du Comité Océanographique pour les Etudes Côtières 1954, 6, 227–242. (In French) [Google Scholar]
- Mietton, M.; Dumas, D.; Hamerlynck, O.; Kane, A.; Coly, A.; Duvail, S.; Baba, M.L.O.; Daddah, M. Le delta du fleuve Sénégal. Une gestion de l’eau dans l’incertitude chronique. In Incertitudes et Environnement—Mesures, Modèles, Gestion; d’Allard, P., Denis, F., Picon, B., Eds.; Ecologie Humaine/Edisud: Arles, France, 2006; pp. 321–336. (In French) [Google Scholar]
- Durand, P.; Anselme, B.; Thomas, Y.F. L’impact de l’ouverture de la brèche dans la langue de Barbarie à Saint-Louis du Sénégal en 2003: Un changement de nature de l’aléa inondation? Cybergeo 2010, 496. (In French) [Google Scholar] [CrossRef]
- Balouin, Y.; Ciavola, P.; Michel, D. Support of subtidal tracer studies to quantify the complex morphodynamics of a river outlet: The Bevano, NE Italy. J. Coast. Res. 2006, 39, 602–606. [Google Scholar]
- Cooper, J.A.G. Ephemeral stream-mouth bars at flood-breach river mouths on a wave dominated coast: Comparison with ebb-tidal deltas at barrier inlets. Mar. Geol. 1990, 95, 57–70. [Google Scholar]
- Niang, A.J. Les Processus Morphodynamiques, Indicateurs de L’état de la Désertification Dans le Sud-Ouest de la MAURITANIE. Approche Par Analyse Multisource. Ph.D. Thesis, Université de Liège, Liège, Belgium, 2008. (In French). [Google Scholar]
- The Wamdi Group. The WAM model—A third generation ocean wave prediction model. J. Phys. Oceanogr. 1988, 18, 1775–1810. [Google Scholar]
- Dee, D.P.; Uppala, S.M.; Simmons, A.J.; Berrisford, P.; Poli, P.; Kobayashi, S.; Andrae, U.; Balmaseda, M.A.; Balsamo, G.; Bauer, P.; et al. The ERA-interim reanalysis: Configuration and performance of the data assimilation system. Q. J. R. Meteorol. Soc. Bull. 2011, 137, 553–597. [Google Scholar] [CrossRef]
- Sterl, A.; Caires, S. Climatology, variability and extrema of ocean waves—The web-based KNMI/ERA-40 Wave Atlas. Int. J. Climatol. 2005, 25, 963–977. [Google Scholar] [CrossRef]
- Caires, S.; Swail, V.R.; Wang, X.L. Projection and analysis of extreme wave climate. J. Clim. 2006, 19, 5581–5605. [Google Scholar] [CrossRef]
- Pinto, L.; Fortunato, A.B.; Freire, P. Sensitivity analysis of non-cohesive sediment transport formulae. Cont. Shelf Res. 2006, 26, 1826–1839. [Google Scholar] [CrossRef]
- Bertin, X.; Castelle, B.; Chaumillon, E.; Butel, R.; Quique, R. Alongshore drift estimation and inter-annual variability at a high-energy dissipative beach: St. Trojan Beach, SW Oleron Island, France. Cont. Shelf Res. 2008, 28, 1316–1332. [Google Scholar] [CrossRef]
- Almar, R.; Kestenare, E.; Reyns, J.; Jouanno, J.; Anthony, E.J.; Laibi, R.; Hemer, M.; Du Penhoat, Y.; Ranasinghe, R. Part 1. Wave climate variability and trends in the Gulf of Guinea, West Africa, and consequences for longshore sediment transport. Cont. Shelf Res. 2015, 110, 48–59. [Google Scholar] [CrossRef]
- Longuet-Higgins, M.S. Alongshore currents generated by obliquely incident sea waves. J. Geophys. Res. 1970, 75, 6788–6801. [Google Scholar]
- Battjes, J.A.; Janssen, J.P.F.M. Energy loss and setup due to breaking of random waves. In Proceedings of the ASCE International Conference on Coastal Engineering, Hamburg, Germany, 27 August–3 September 1978; pp. 569–587. [Google Scholar]
- Larson, M.; Hoan, L.X.; Hanson, H. A direct formula to compute wave properties at incipient breaking. J. Waterw. Port Coast. Ocean Eng. 2010, 136, 119–122. [Google Scholar] [CrossRef]


© 2017 by the authors. Licensee MDPI, Basel, Switzerland. This article is an open access article distributed under the terms and conditions of the Creative Commons Attribution (CC BY) license (http://creativecommons.org/licenses/by/4.0/).
Share and Cite
Sadio, M.; Anthony, E.J.; Diaw, A.T.; Dussouillez, P.; Fleury, J.T.; Kane, A.; Almar, R.; Kestenare, E. Shoreline Changes on the Wave-Influenced Senegal River Delta, West Africa: The Roles of Natural Processes and Human Interventions. Water 2017, 9, 357. https://doi.org/10.3390/w9050357
Sadio M, Anthony EJ, Diaw AT, Dussouillez P, Fleury JT, Kane A, Almar R, Kestenare E. Shoreline Changes on the Wave-Influenced Senegal River Delta, West Africa: The Roles of Natural Processes and Human Interventions. Water. 2017; 9(5):357. https://doi.org/10.3390/w9050357
Chicago/Turabian StyleSadio, Mamadou, Edward J. Anthony, Amadou Tahirou Diaw, Philippe Dussouillez, Jules T. Fleury, Alioune Kane, Rafael Almar, and Elodie Kestenare. 2017. "Shoreline Changes on the Wave-Influenced Senegal River Delta, West Africa: The Roles of Natural Processes and Human Interventions" Water 9, no. 5: 357. https://doi.org/10.3390/w9050357