Article

Spatiotemporal Characterization of Chromophoric Dissolved Organic Matter (CDOM) and CDOM-DOC Relationships for Highly Polluted Rivers

1
Nature Disaster Research Institute, School of Environment, Northeast Normal University, Changchun 130024, China
2
Grassland Science Institute, School of Life Sciences, Northeast Normal University, Changchun 130024, China
3
Key Laboratory of Wetland Ecology and Environment, Northeast Institute of Geography and Agroecology, China Academic Science, Changchun 130102, China
*
Author to whom correspondence should be addressed.
Water 2016, 8(9), 399; https://doi.org/10.3390/w8090399
Submission received: 16 July 2016 / Revised: 3 September 2016 / Accepted: 7 September 2016 / Published: 13 September 2016

Abstract

:
Spectral characteristics of CDOM (Chromophoric dissolved organic matter) in water columns are a key parameter for bio-optical modeling. Knowledge of CDOM optical properties and spatial discrepancy based on the relationship between water quality and spectral parameters in the Yinma River watershed with in situ data collected from highly polluted waters are exhibited in this study. Based on the comprehensive index method, the riverine waters showed serious contamination; especially the chemical oxygen demand (COD), iron (Fe), manganese (Mn), mercury (Hg) and dissolved oxygen (DO) were out of range of the contamination warning. Dissolved organic carbon (DOC) and total suspended matter (TSM) with prominent non-homogenizing were significantly high in the riverine waters, but chlorophyll-a (Chl-a) was the opposite. The ternary phase diagram showed that non-algal particle absorption played an important role in total non-water light absorption (>50%) in most sampling locations, and mean contributions of CDOM were 13% and 22% in the summer and autumn, respectively. The analysis of the ratio of absorption at 250–365 nm (E250:365) and the spectral slope (S275–295) indicated that CDOM had higher aromaticity and molecular weight in autumn than in summer, which is consistent with the results of water quality and the CDOM relative contribution rate. Redundancy analysis (RDA) indicated that the environmental variables OSM (Organic suspended matter) had a strong correlation with CDOM absorption, followed by heavy metals, e.g., Mn, Hg and Cr6+. However, for the specific UV absorbance (SUVA254), the seasonal values showed opposite results compared with the reported literature. The potential reasons were that more UDOM (uncolored dissolved organic matter) from human sources (wastewater effluent) existed in the waters. Terrigenous inputs simultaneously are in relation to the aCDOM(440)-DOC relationship with the correlation coefficient of 0.90 in the summer (two-tailed, p < 0.01), and 0.58 in the autumn (two-tailed, p < 0.05). Spatial distribution of the CDOM parameters exhibited that the downstream regions focused on dry land have high CDOM molecular weight and aromatic hydrocarbon. Partial sampling locations around the cities or countries generally showed abnormal values due to terrigenous inputs. As a bio-optical model parameter, the spectral characteristic of CDOM is helpful in adjusting the derived algorithms in highly polluted environments. The study on organic carbon and pollutants in highly polluted waters had an important contribution to global carbon balance estimation and water environment protection.

1. Introduction

Chromophoric dissolved organic matter (CDOM) is the optically active fraction of dissolved organic matter (DOM) in natural waters [1,2,3,4,5]. The sources of CDOM in aquatic ecosystems include two parts: autochthonal (microbial and phytoplankton) and allochthonous sources (terrestrial and anthropogenic inputs) [1,6,7,8]. Simultaneously, the major sink of CDOM in natural waters is by photo-chemical degradation and microbial consumption processes, and they release nutrients to sustain the growth of phytoplankton and bacteria [9,10]. In these biogeochemical processes, CDOM could release biologically labile compounds (e.g., the hydroxyl sulfide) and greenhouse gases (CO2 and CH4), which could contribute to global warming [11,12,13,14]. The ability to quantify and differentiate sources of CDOM in aquatic environments is important for the understanding of biogeochemical carbon cycles, ecosystem integrity, and water quality management. In addition, many studies demonstrated that there exists a positively correlated relationship between the CDOM and dissolved organic carbon (DOC), and CDOM can be used as an inexpensive and rapid proxy for DOC in aquatic environments [15,16]. Above all, CDOM absorption characteristics in the visible band have been shown to interfere with satellite water color estimates of phytoplankton chlorophyll [17,18]. Conversely, CDOM is potentially estimated by remote sensing technology with the advantages of saving time and being low cost. Remotely sensed imagery, spatial technologies and computer processing have been increasingly useful in the monitoring of CDOM in recent decades [18,19]. Estimated CDOM values could be converted into the DOC concentration by using regression models [20]. Univariate linear regression is the most popular approach to using optical methods for DOC estimation. Optical measurements could constitute a potentially viable approach to detect anomalous changes in water quality [16,21]. Likewise, the CDOM optical characteristic (absorption coefficient at special bands) is the basis of the bio-optical model to derive CDOM. However, the CDOM optical characteristic and the CDOM-DOC relationship generally exhibit seasonal and spatial discrepancy. DOC concentrations in arctic rivers, e.g., Kolyma River, are markedly higher during the spring freshet, while being lower and more stable from July–October [22,23]. The DOM/CDOM composition changes rapidly in highly dynamic periods (storms and spring freshets), e.g., for the arctic waters. The DOC concentration during the spring freshet and summer discharge is markedly higher, but is lower in autumn [20,24]. In addition, Toming et al. found that CDOM did not appear to be a good predictor of the seasonality of the DOC concentration in large boreal lakes since the CDOM-DOC coupling varied seasonally [25]. Hestir et al. studied six manmade reservoirs in Australia along a temperate to tropical gradient and did not find a good correlation between the CDOM and DOC [26]. Owing to multiple sources, potentially some transformation of the DOM and regional differences of the organic carbon content in near-surface soils, the composition of DOM (CDOM) in aquatic environments is highly heterogeneous. There, additive exogenous inputs determine the relationship between CDOM and DOC is not constant based on field observations [27,28,29]. Particularly, the composition, properties and distribution of DOM/CDOM in riverine waters showed more uncertainties which are threatened by the changes of hydrology, geomorphology, land use/cover, soil types, and seasonality meteorology. The CDOM optical characteristic and CDOM-DOC relationship are influenced by changed physical, chemical and biological processes which contribute to formation, transformation and degradation. The photo-degradation of CDOM results indicate the loss of CDOM absorption and increases the spectral slope (S275–295) [30]. The study focuses on the CDOM optical characteristic and CDOM-DOC which is the basis and precondition for CDOM-estimation algorithms (e.g., the quasi-analytical algorithm). The allochthonous source is proposed as a critical factor to determine the spatio-temporal variations of CDOM in riverine waters.
Domestic and industrial sewage discharge has resulted in serious organic pollution in many riverine environments. Particularly, fecal substances may contain many pathogenic microorganisms which are hazardous to human health [16]. The CDOM absorption characteristic and fluorescence could serve as a good indicator of contamination and substitute for the DOC, biochemical oxygen demand (BOD), chemical oxygen demand (COD) and heavy metals [31,32,33]. DOM, specifically CDOM including humic-like and proteinous substances, may form water-soluble complexes with multiple organic and inorganic pollutants, thus enhancing their release from the sediments and their mobility. The volatility of pollutants, bio-availability, toxicity and photo-degradation may be affected by interactions with CDOM. Currently, many studies on CDOM characteristics have focused on the riverine waters, e.g., the Liaohe River and US rivers, etc. [34,35,36]. For the highly polluted waters, it needs to be better quantified to understand the potential impacts of the allochthonous source on the riverine carbon cycle in spatio-temporal scales and to supplement the water carbon cycle database. Specially, the optical parameters, i.e., the absorption coefficient and spectral slope (S275–295), could be regarded as the regional CDOM-derived references of highly polluted riverine waters.
Songhua River is the seventh biggest river in China, and the second Songhua River and Nenjiang River are the important tributaries. The first heavy industrial base in China was established in the Songhua watershed, the major grain producing area. The machine-building industry, the chemical industry, power and manufacturing, the logging industry, the metallurgical industry, the textile industry and the grain processing industry are widely dispersed in this watershed. The water consumption of agriculture, industry and daily living come from the main tributaries. In these processes, domestic and industrial sewage and the return water of farmland irrigation are discharged into the rivers. The accumulation of heavy metals in sediments and the bio-accumulation of benthic organisms were highlighted for the Songhua fluvial system recently. Previous studies showed that there are 480 pollutants in the Songhua River, and the main pollutants are COD, phenols, and ammonia nitrogen, etc. [37]. The government of Heilongjiang Province strengthened the pollution management, and the water quality pollution can be controlled. However, the water quality of several tributaries still showed the serious pollution, as the Yinma River and Yitong River supply large amounts of organic matter to the Songhua fluvial system. These rivers flow through the Shitoukoumen Reservoir and Xinlicheng Reservoir which are the drinking water sources of Changchun City. The safety of drinking water in the drinking water sources is a global problem [38]. Quantitative estimation and monitoring of CDOM in highly polluted riverine environments give an early warning of contamination of the drinking water supply [16]. It holds great potential to estimate the DOC concentration and organic pollutants via CDOM in the surface layer. In this study, water samples were collected in the Yinma River watershed in August and October 2015. The CDOM absorption spectrum, relative contribution, absorption coefficients and spectral slope are used to examine compositional distribution and sources, and build linkages to the DOC concentration in the Yinma River watershed. The environmental factors affecting the CDOM spectrum were selected to illustrate the potential spectroscopy as a monitoring tool for organic pollutants in highly polluted riverine waters. The CDOM optical characteristic is the base of the bio-optical models of CDOM algorithms and the derived CDOM (DOC). As in typical inland waters, the CDOM optical characteristic is representative of other regions affected by anthropogenic activities. A study of the optical-biochemistry correlation is helpful for the CDOM-related remote sensing data of polluted waters, and for evaluating the water quality. The study focused on the highly polluted waters could indirectly indicate the scope of the point source. In situ data sets could also be used for further improvement of the accuracy of the algorithms in highly polluted waters.

2. Materials and Methods
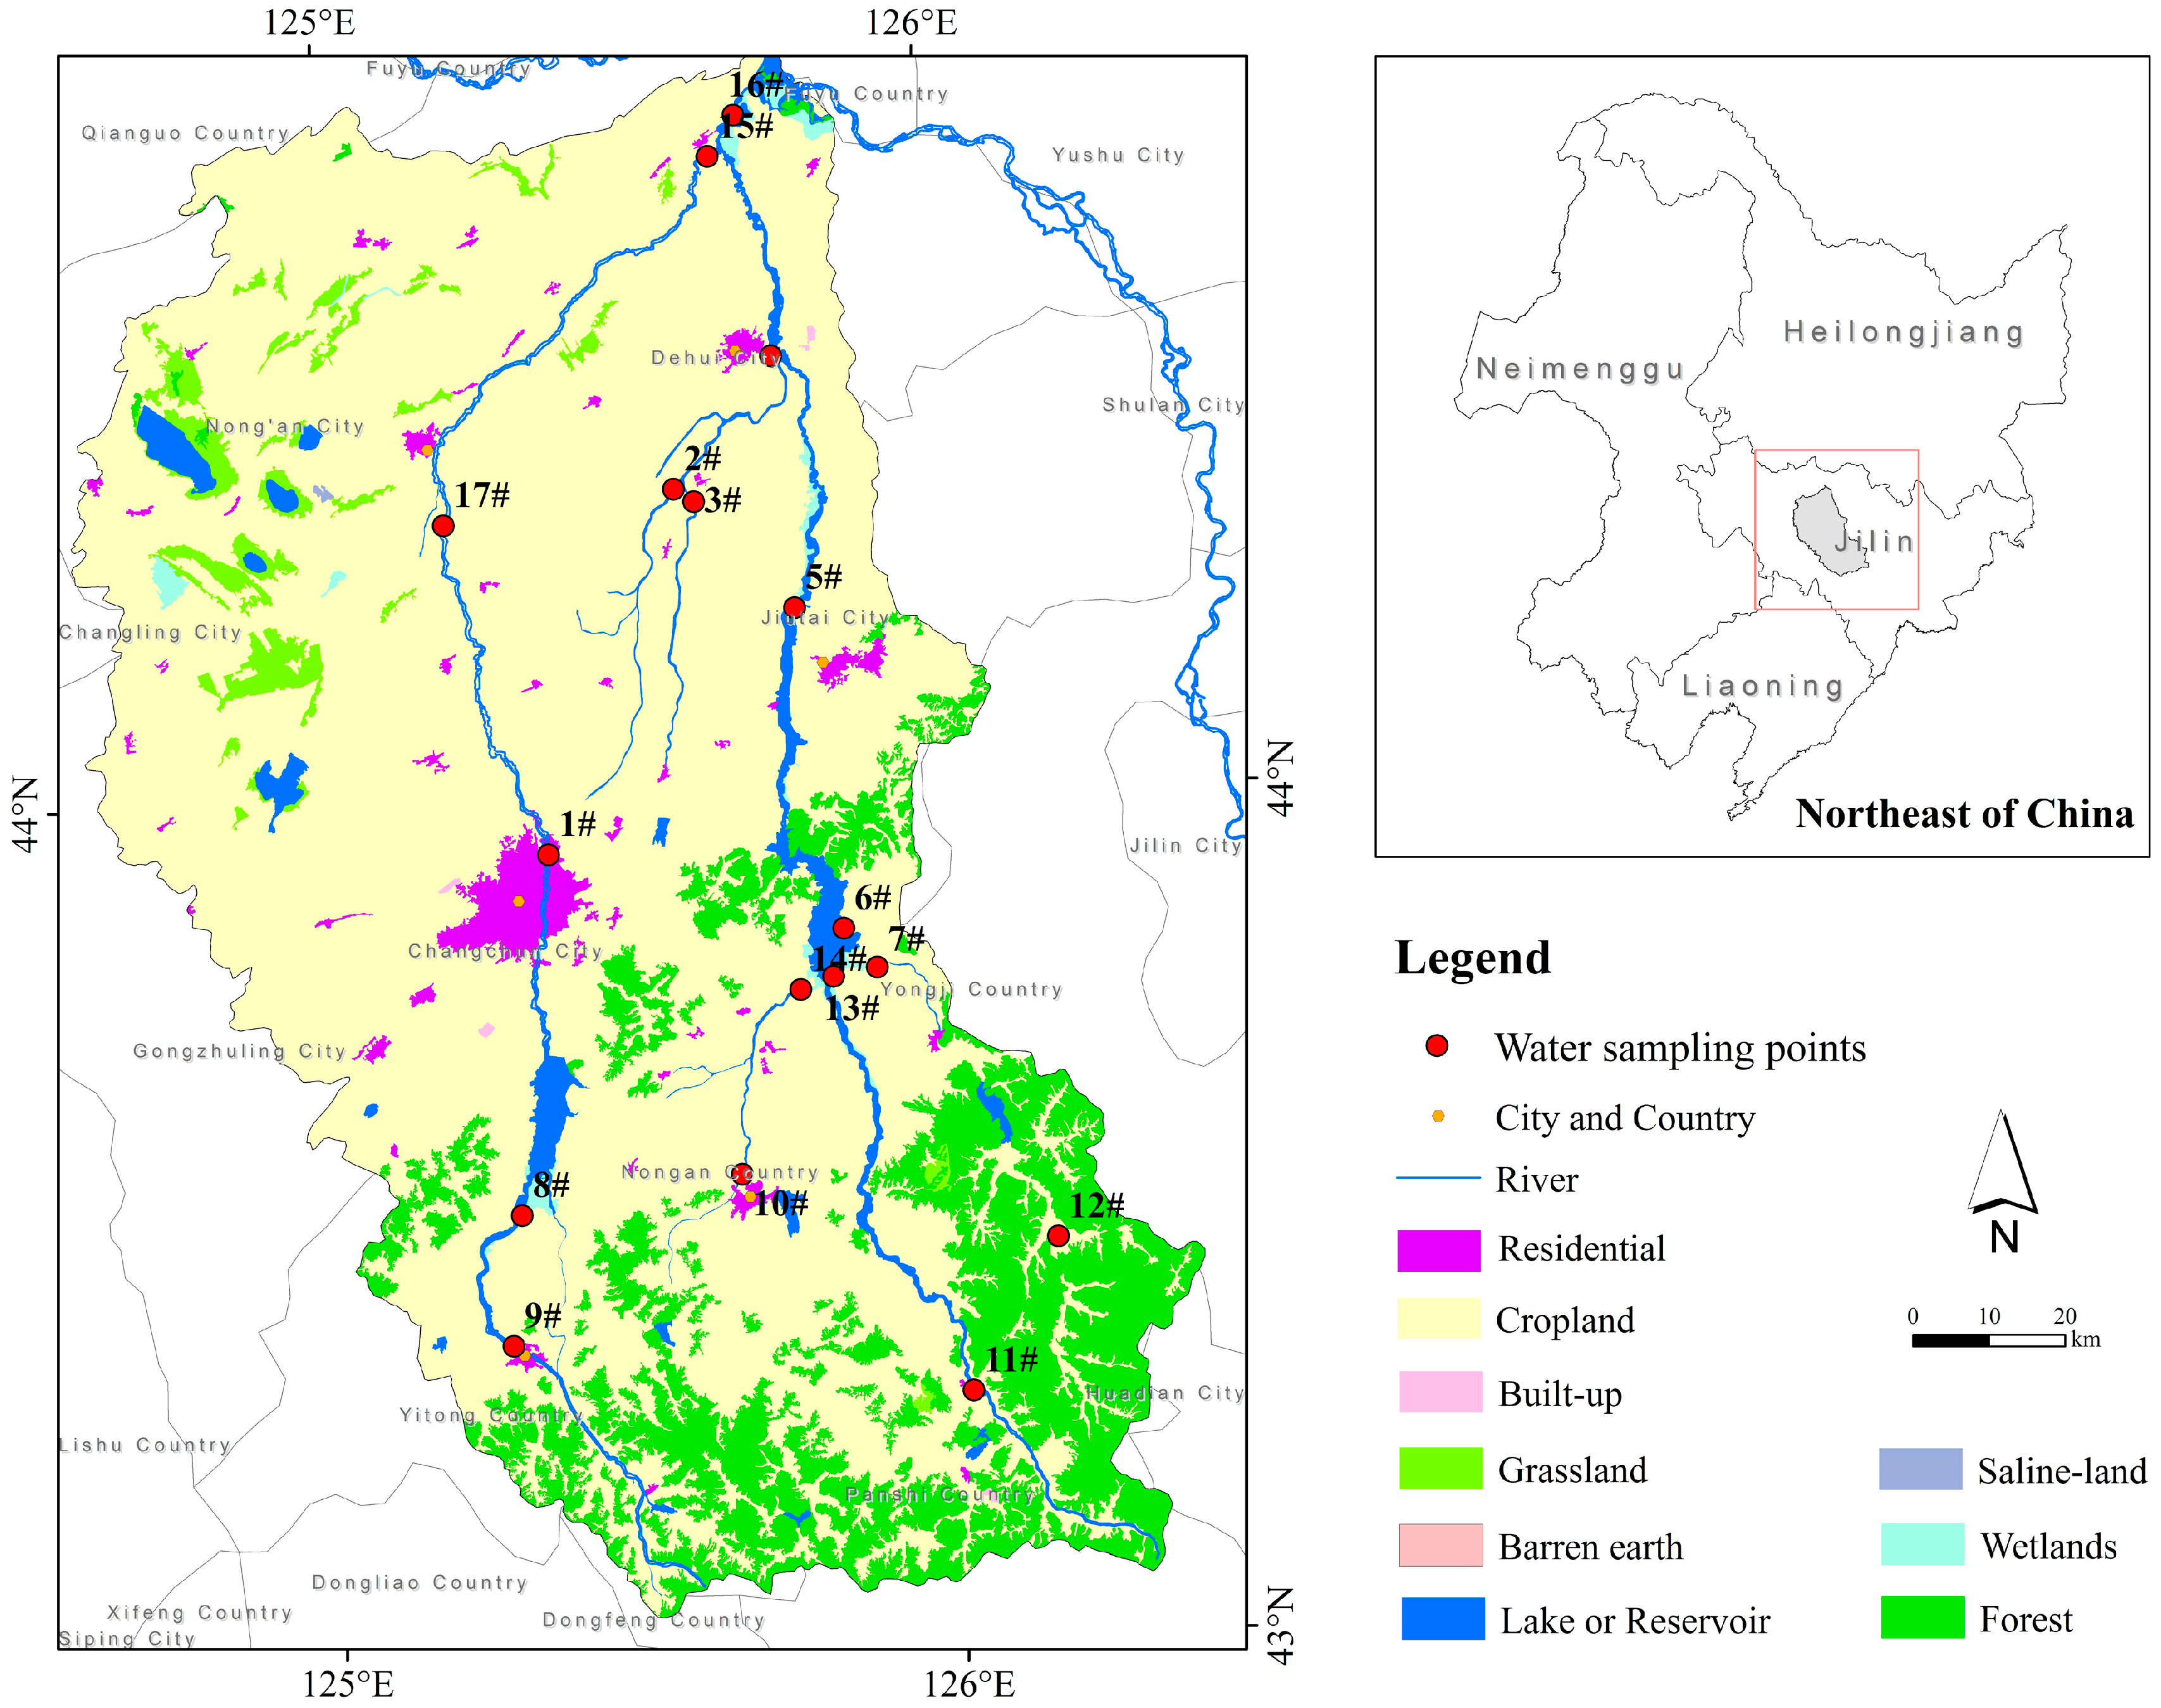
2.1. Study Area

The Yinma River watershed (124°58′ E–126°24′ E, 43°02′ N–44°53′ N), an important tributary of Songhua fluvial system, is located in central Jilin Province, China (Figure 1). The area of watershed is about 1.74 × 10⁴ km2, including two main rivers, Yinma River and Yitong River. The region is a typical North temperate zone continental monsoon climate, with a frozen period of about 150 days. It has distinct seasons with a windy spring, a hot and rainy summer, a large temperature difference autumn, and a cold dry winter. The mean annual temperature is 5.3 °C, yearly average precipitation ranges from 370 to 668 mm and evaporation is 1438.4 mm. Yinma River originates in the southeast of Yitong Country, and it merges with Yitong River in Nong’an Country and flows to the Second Songhua fluvial system. East of the watershed is the transition zone between mountain and Songliao Plain; south is a continuous foothill; northwest is Songliao Plain. The main tributaries of watershed include Wukai River, Chalu River and ShuangYang River. The plain areas accounted for 60%, and other 40% are the mountain.

2.2. In Situ Data Collection and Processing

River plume samples were collected from a sample grid developed for the National Major Program of Water Pollution Control and Treatment Technology of China. Water samples at 17 sites in the watershed were taken from the surface layer (0–0.2 m) during 19–22 August and 29–30 October 2015 (Figure 1). Coordinates for water sample sites were recorded using a global positional system (G350, UniSreong, China). It’s not able that the Perspex water sampler and Niskin bottles were rinsed before collecting by Milli-Q water, and then were rinsed by water samples. Each sample was collected approximately 2.5 L at each site and immediately analyzed on board or stored at 4 °C in the dark, in acid cleaned, pre-combusted amber bottles for laboratory analysis (which belongs to Environment Institute, Northeast Normal University). Physical and chemical parameters, e.g., Chlorophyll-a (Chl-a), DOC concentration, total suspended matter (TSM) as well as particulate and CDOM absorption were determined within 6 h. The pH was measured using a PHS-3C pH meter (China) at room temperature (20 ± 2 °C) in the laboratory.

2.3. Measurement of Absorbance and Processing

According to the quantitative filter technique (QFT, quantitative membrane filter technique), all the samples were filtered under low vacuum, first through a precombusted Whatman GF/F (1825-047, Whatman Company, Maidstone, UK) filter (0.7 μm), then through a prerinsed 25 mm Millipore membrane cellulose filter (0.22 μm) (Whatman Company, Maidstone, UK) into glass bottles. Absorbances of the filtrate was measured between 200 nm and 800 nm at 1 nm interval using a Shimadzu UV-2600 spectrophotometer (Shimadzu, UV-2006 PC, Kyoto, Japan) with Milli-Q water as a reference. Scan settings for the spectrophotometer are as follows: 4 nm slit width, 250–800 nm wavelength range, 1 nm data interval, and 100 nm−1 scan rate. The absorption coefficient (aCDOM) was calculated from the measured water optical density (OD) following the Equation (1).
a CDOM ( λ ' ) = 2.303 OD λ / L
where aCDOM(λ′) is the uncorrected CDOM absorption coefficient at given λ, ODλ is the optical density at the same wavelength, and L is the cuvette path length in meters. In order to eliminate the internal backscattering, the absorbance at 700 nm used to correct the absorption coefficients [39]. OD(null) is the average optical density over 740–750 nm where the absorbance of CDOM can be assumed to be zero [40].
To determine the absorbance of non-algal particles and phytoplankton were filtered under low vacuum through a precombusted Whatman GF/F (1825-047, Whatman Company, Maidstone, UK) filter (0.7 μm), and then measured between 400 nm and 700 nm using a Shimadzu UV-2600 spectrophotometer (Shimadzu, UV-2006 PC, Kyoto, Japan) with blank filter as a reference. The absorbances of non-algal particles were bleached by 0.1% sodium hypochlorite. The absorbances of phytoplankton were calculated from the total particulate subtract from non-algal particles (NAP). Absorbances were then converted to the absorption coefficient for total particulate, a(λ); non-algal particles, ad(λ); phytoplankton, aph(λ), and CDOM, aCDOM(λ). The total absorption coefficient is the sum of ad(λ), aph(λ), aCDOM(λ) and aw(λ), where aw(λ) represents a pure water absorption derived from Smiths et al. [41].

2.4. Water Quality Measurement and Evaluation

In order to prevent pigments denaturalization, water samples were immediately filtered under low vacuum. Water sampling locations for chlorophyll-a extraction passed through 0.45 μm fiber, after which chlorophyll-a extracted with 90% acetone for 48 h under subdued light conditions. The concentrations were determined with a UV spectrophotometer (Shimadzu, UV-2006 PC, Kyoto, Japan) by detailed in Song et al. [40]. TSM, inorganic suspended matter (ISM) and organic suspended matter (OSM) were determined by gravimetrical analysis; and more detailed descriptions of measuring absorption coefficients could be found in Song et al. [40]. It noted that the filters need to remove organic matter on muffle before these processes. Dissolved organic carbon (DOC) sampling locations were acidified with concentrated HCl (Hydrochloric acid, 100 μL of 2N) to a pH of 2 to remove inorganic carbon until analyzed on a total organic carbon analyzer (Shimadzu, TOC-VCPN, Kyoto, Japan) by high-temperature catalytic oxidation (680 °C). Potassium hydrogen phthalate was used as a reference. DOC concentration was calculated by subtracting dissolved inorganic carbon (DIC) from total dissolved carbon (TDC). More details can be found in Song et al. [40]. The reproducibility of the analytic procedure was within 2%–3% for the current study. Reference to environmental quality standards for surface water (GB3838-2002, China), dissolved oxygen (DO) measured by iodometry; chemical oxygen demand (COD) by dichromate; ammonia nitrogen (NH3-N) by Nessler’s reagent colorimetry; iron (Fe) by flame atomic absorption spectrometry; manganese (Mn) by Potassium periodate spectrophotometric; zinc (Zn) by atomic absorption spectrometry; mercury (Hg) by atomic absorption spectrophotometry; and Hexavalent chromium (Cr6+) by diphenylcarbohydrazide spectrophotometric. The comprehensive index method used to calculate the relative pollution index, and then evaluate pollution status. The formula is as follows:
P i = C i C 0
P = 1 m i = 1 m P i
where Ci is the concentration value of i contamination, and Ci is evaluation standard of i contamination. Pi is the contamination index. The environmental quality standards for surface water (GB3838-2002) were as reference. Results of comprehensive index was shown in Table 1.

2.5. Paramaterization and Statistical Analysis

The CDOM absorption generally shows negative exponential attenuation along with the increasing of wavelength, and composition of CDOM affects the absorption characteristic along wavelength [30,42,43]. The aCDOM(440) is related to the satellite borne sensor. It could retrieve CDOM absorption coefficient and DOC concentration, etc. Positive correlation could be found between the CDOM fluorescence and absorption coefficient at 335 nm and 375 nm [44,45]. Through the relationship, we can estimate, investigate the relative composition, content of CDOM. Hence, aCDOM(335), aCDOM(375) and aCDOM(440) represented the CDOM concentration [7,44]. Specific UV absorbance (SUVA) values of the sampling locations calculated by multiplying DOC concentration-normalized UV absorbance at 254 nm by a factor of 100 (i.e., 100 × aCDOM(254)/DOC) [46]. The SUVA254 values related to the content of aromatic hydrocarbon in DOM [46]. According to previous studies [36,46,47], low SUVA254 indicated that the autochthonous sources dominated the organic matter content, conversely high SUVA254 represent the allochthonous sources with more vascular plant inputs. E250:365, related to the content of aromatic hydrocarbon too, could trace the molecular size of DOM [48]. Humic acid (HA) makes up a high proportion of CDOM from terrestrial inputs, as well as fulvic acid (FA) of CDOM from phytoplankton degradation. CDOM spectral slope coefficient S further provided information on the type and source of CDOM. S275–295 was calculated using a nonlinear fit of an exponential function to absorption spectrum according to Equation (2) [39]:
a CDOM ( λ ) = a CDOM ( λ 0 ) e S ( λ 0 λ )
where aCDOM(λ) is the CDOM absorption at a given wavelength, aCDOM0) is the reference wavelength (440 nm). The effectiveness of S has been demonstrated with CDOM samples from various waters, ranging from DOC-rich wetlands to photo-bleached coastal waters and lakes over high-altitude plateaus [29,43,49]. The coefficient of variation (CV) is computed from the filtered mean and standard deviation of values.

3. Results

3.1. Pollution Status

Results of comprehensive polluted index shown in Table 2 with the environmental quality standards for surface water (GB3838-2002, China) as a reference. The comprehensive index p-values ranged from 8.11 to 9.03 with serious contamination in the summer and autumn, respectively (Table 2). Particularly, the COD, Fe, Mn, Hg and DO were out of range of the contamination warning. The waters in autumn indicated a higher level of pollution. Previous studies have exhibited the COD, NH3-N, TN, and TP accounted for 44.14%, 53.14%, 82.15% and 78% of the total pollutants, respectively [37]. A large number of farmland with remains of pesticide and fertilizer, household refuse and livestock dung existed in the Yinma River watershed.

3.2. Water Quality

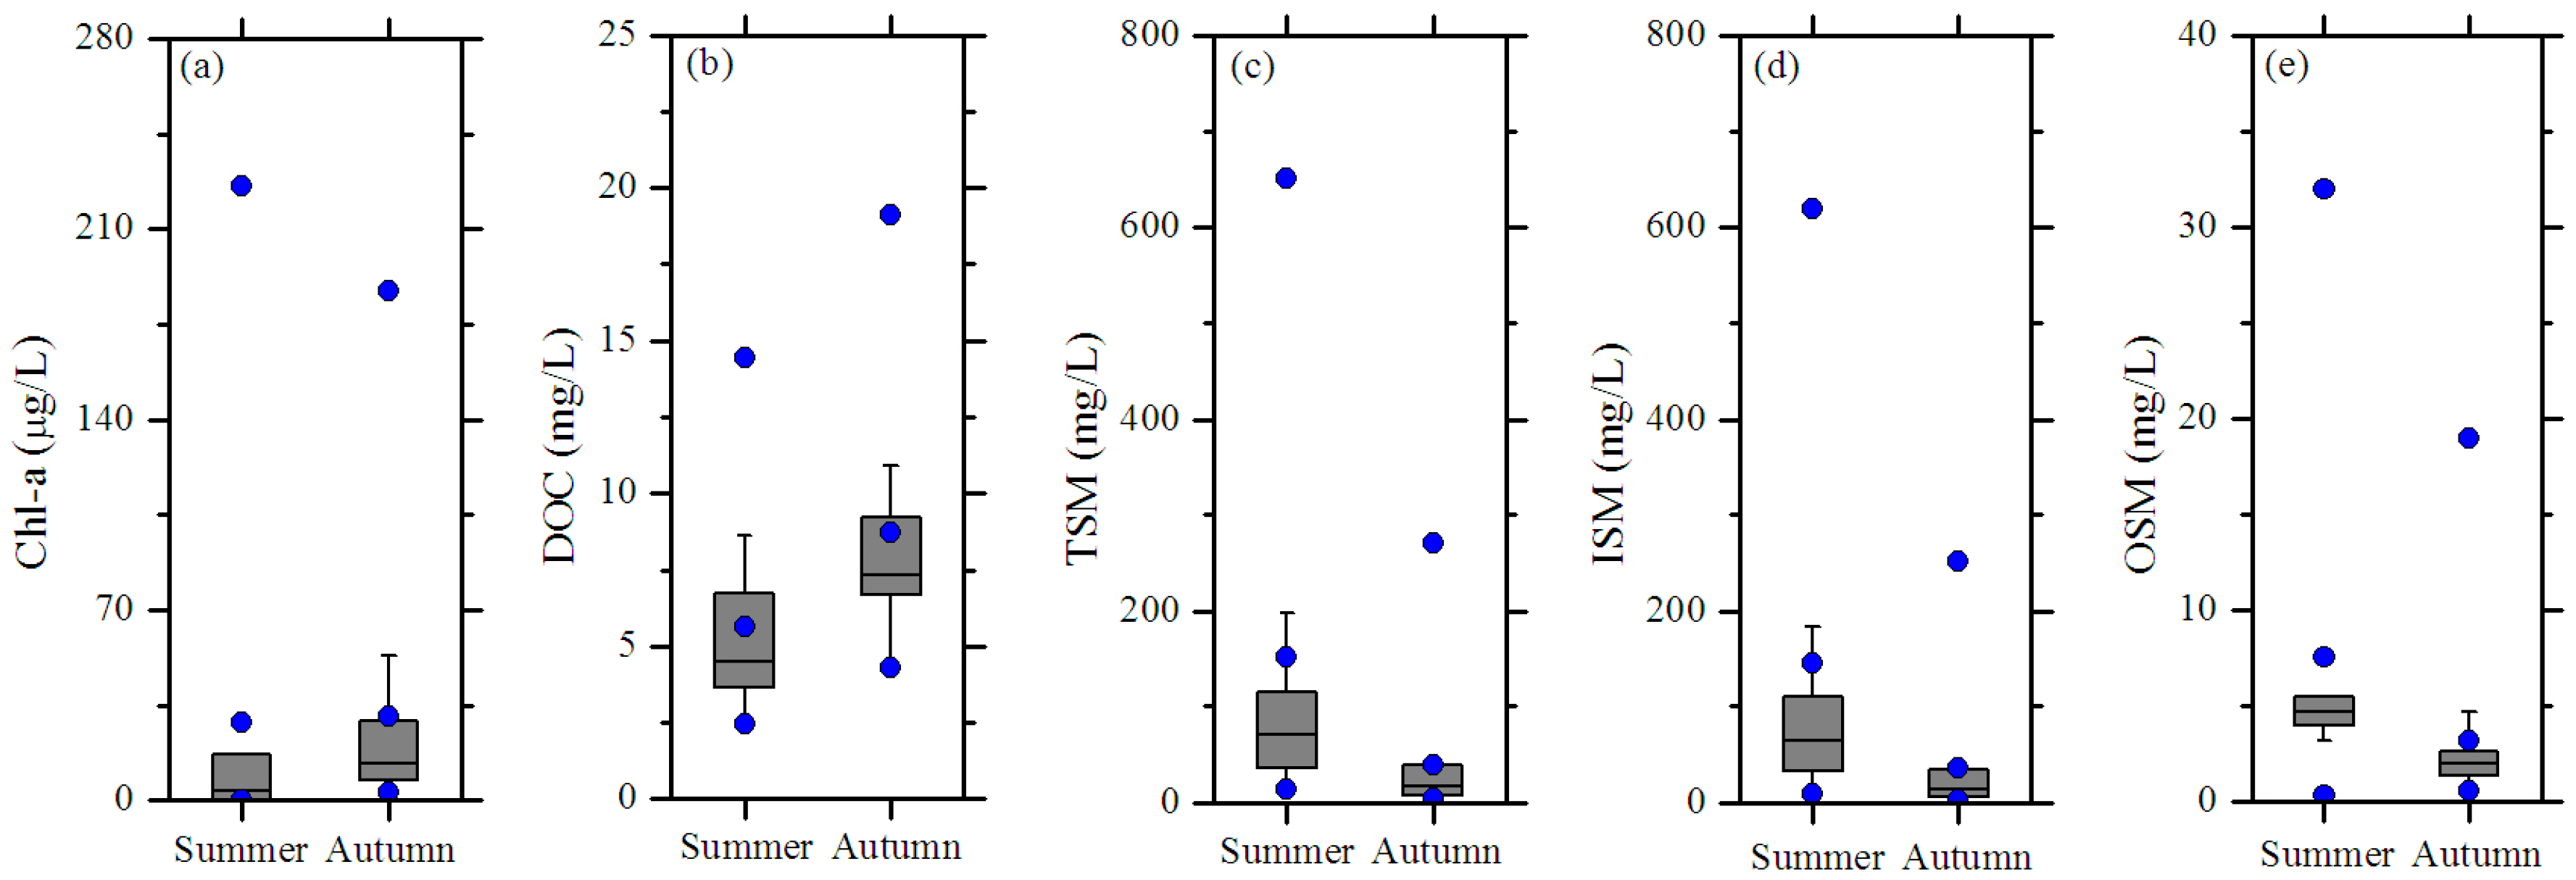
3.2.1. Seasonal Variation

The TSM, ISM, OSM, DOC and Chl-a concentrations with seasonal variability were observed in the Yinma River watershed (Figure 2). The average TSM concentration in summer (152.24 ± 189.9 mg·L−1) was higher than in autumn (38.5 ± 64.7 mg·L−1). Likewise, the average values of ISM and OSM were 144.7 mg·L−1 and 7.5 mg·L−1, respectively, in summer and 35.3 mg·L−1 and 3.2 mg·L−1 in autumn. The high TSM concentrations largely stemmed from allochthonous inputs [50], and they are probably associated with soil organic matter [28]. In total, the average Chl-a concentration in the summer (28.3 ± 57.2 μg·L−1) was lower than in autumn (30.5 ± 46.2 μg·L−1). In addition, the high loads of suspended matter prevent phytoplankton from growing due to light limitation and microbial activity. The high Chl-a concentration observed in the autumn indicated continuous inputs of the wastewater in the watershed, consistent with the results of the comprehensive polluted index. The inputs exceeded the self-purification ability of rivers, even in the concentrated rainfall period. The decrease of river discharges was one of the impact factors on the low Chl-a concentration in autumn. According to Tranvik et al. [13], 2.9 Pg·Cyr−1 carbons migrate, transform, and store via the inland water ecological system. The DOC represents an essential link between terrestrial and aquatic ecosystems [51]. The DOC concentration ranged from 2.4 to 14.4 mg·L−1 with the average value indicated as 5.6 mg·L−1 in summer, and a higher average value of 8.7 mg·L−1 in autumn (4.3–19.1 mg·L−1).
The positive relationships between DOC and NH3-N were established in summer and autumn (r = 0.78 and 0.81; two-tailed, p < 0.01). It is a pity that we have not measured the TN and TP in the surface waters in the summer. Regression analyses were also conducted, and a linear relationship between TN and the DOC concentration was found based on the collected data in autumn (Figure 3, r = 0.68; two-tailed, p < 0.01). Jiang et al. found a correlated relationship between TN and DOC during rainfall in agricultural and forested wetlands in the Shibetsu watershed, Japan [52]. The relationship between DOM and TN may be used to track the plant-derived source fraction [35].

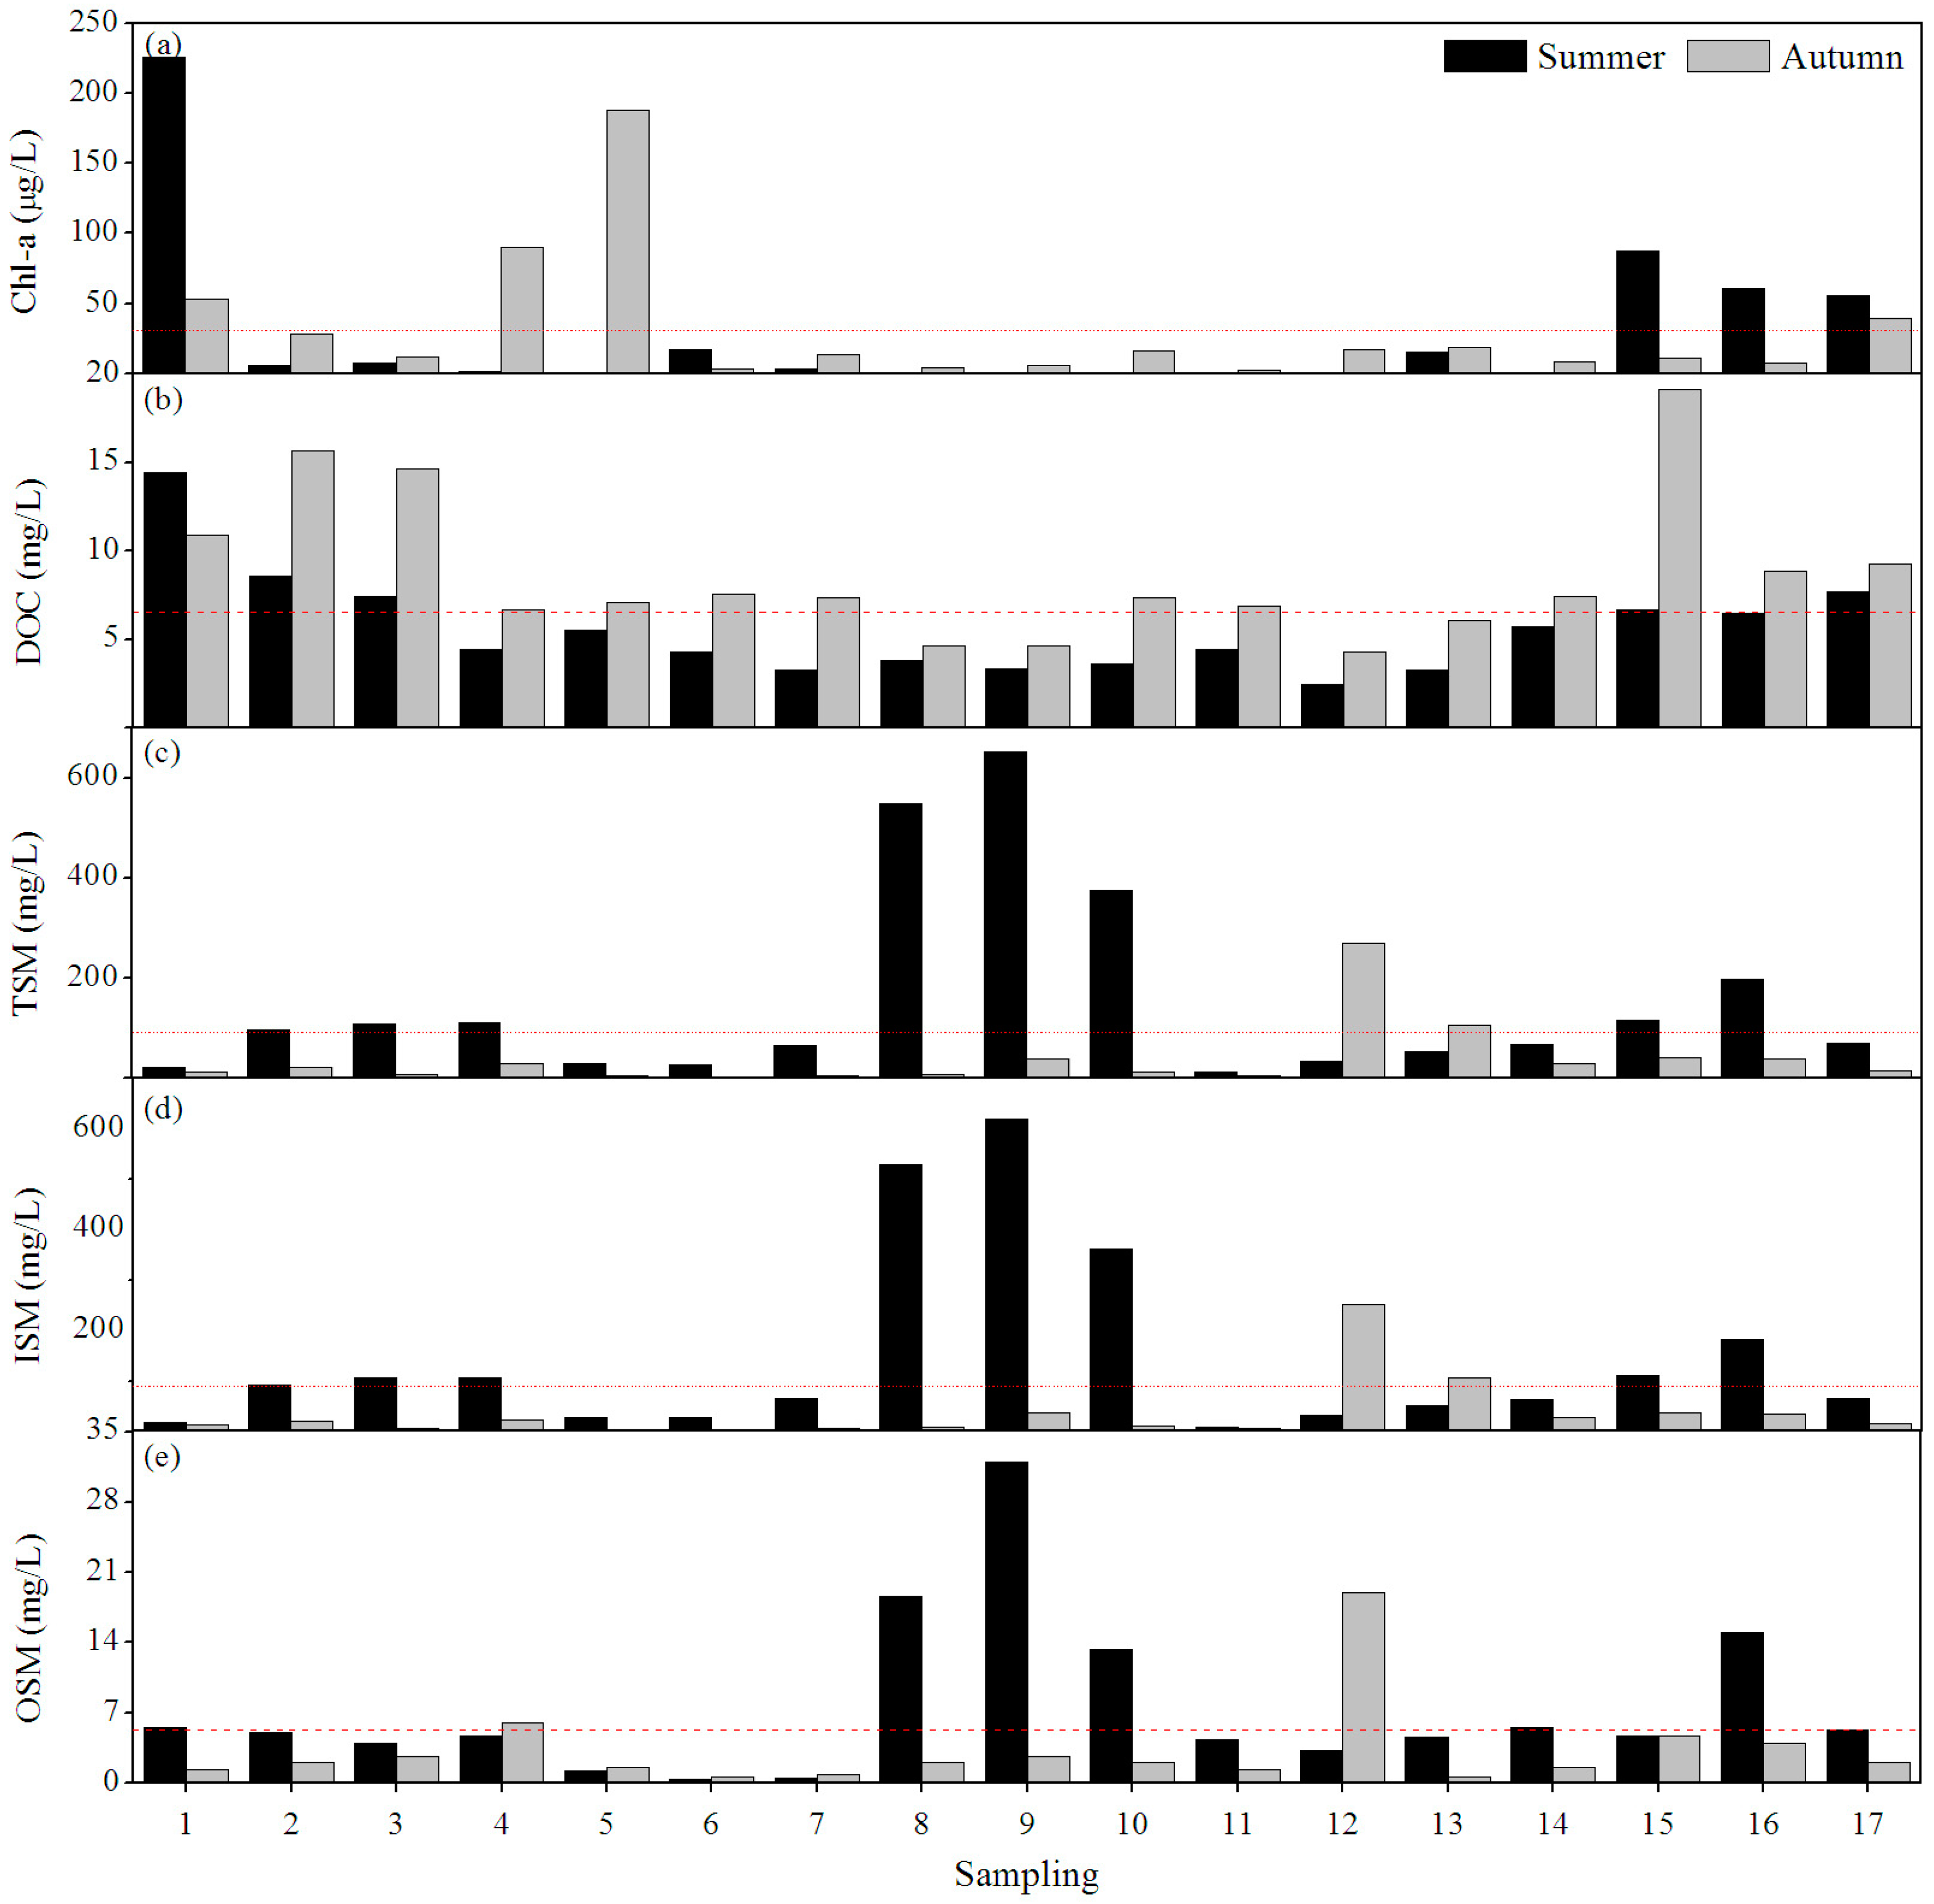
3.2.2. Spatial Variation

As shown in Figure 4a, the water quality parameters in most of the sampling locations were lower than the average values, indicating prominent spatial heterogeneity. NO.1 located in Changchun City possessed the highest Chl-a concentration (225.98 μg·L−1) in the summer. During the sampling period, a great deal of floating algae appeared, like green ribbons floating on the surface of the river. In the cropland, the high Chl-a concentration (e.g., NO.15 and NO.17 in the downstream region of the watershed) was exhibited due to the fertilizer pollution from the soil. The Chl-a concentration in NO.5 remained at zero in the summer, and in autumn it progressively increased to the highest value (187.58 μg·L−1) of Chl-a in NO.4 and NO.5 around Jiutai City and Dehui City (Figure 1). The Chl-a concentrations in NO.15, NO.16 and NO.17 were relatively high in the summer due to the accumulation of nutrients from these sampling locations in the downstream region.
The TSM, OSM and ISM concentrations showed a consistent trend in different sampling locations (Figure 4c–e). Likewise, the ISM concentration occupied the majority of the TSM concentration. NO.9 and NO.12 located in the upstream region exhibited high values of 651.3 mg·L−1 and 104.67 mg·L−1, respectively, in summer and autumn. The TSM concentration in NO.1, NO.8, NO.9 and NO.10 showed the opposite results with the DOC and Chl-a concentration (Figure 4c–e). This may be due to the high loads of suspended matter preventing phytoplankton from growing due to light limitation. Simultaneously, the surface runoff carried a lot of nutrients and TSM could promote the growth of phytoplankton and improve the standing stock of the suspended matter.
NO.1 in Yitong River presented the highest DOC (14.44 mg·L−1) in summer (Figure 4b). The DOC concentration in NO.15 was 19.1 mg·L−1 in autumn (Figure 4b). The seasonal variation of the DOC in NO.1, NO.2, NO.3, NO.15, NO.16 and NO.17 located in the downstream region were higher than the average value (7.17 mg·L−1). The DOM along with other nutrients mainly comes from urban and agriculture sewage. The possible reasons may be that these substances could accumulate due to the lower microbial activity. Jiang et al. [52] found that DOC levels in the rivers were linked to climate and watershed landscape characteristics.

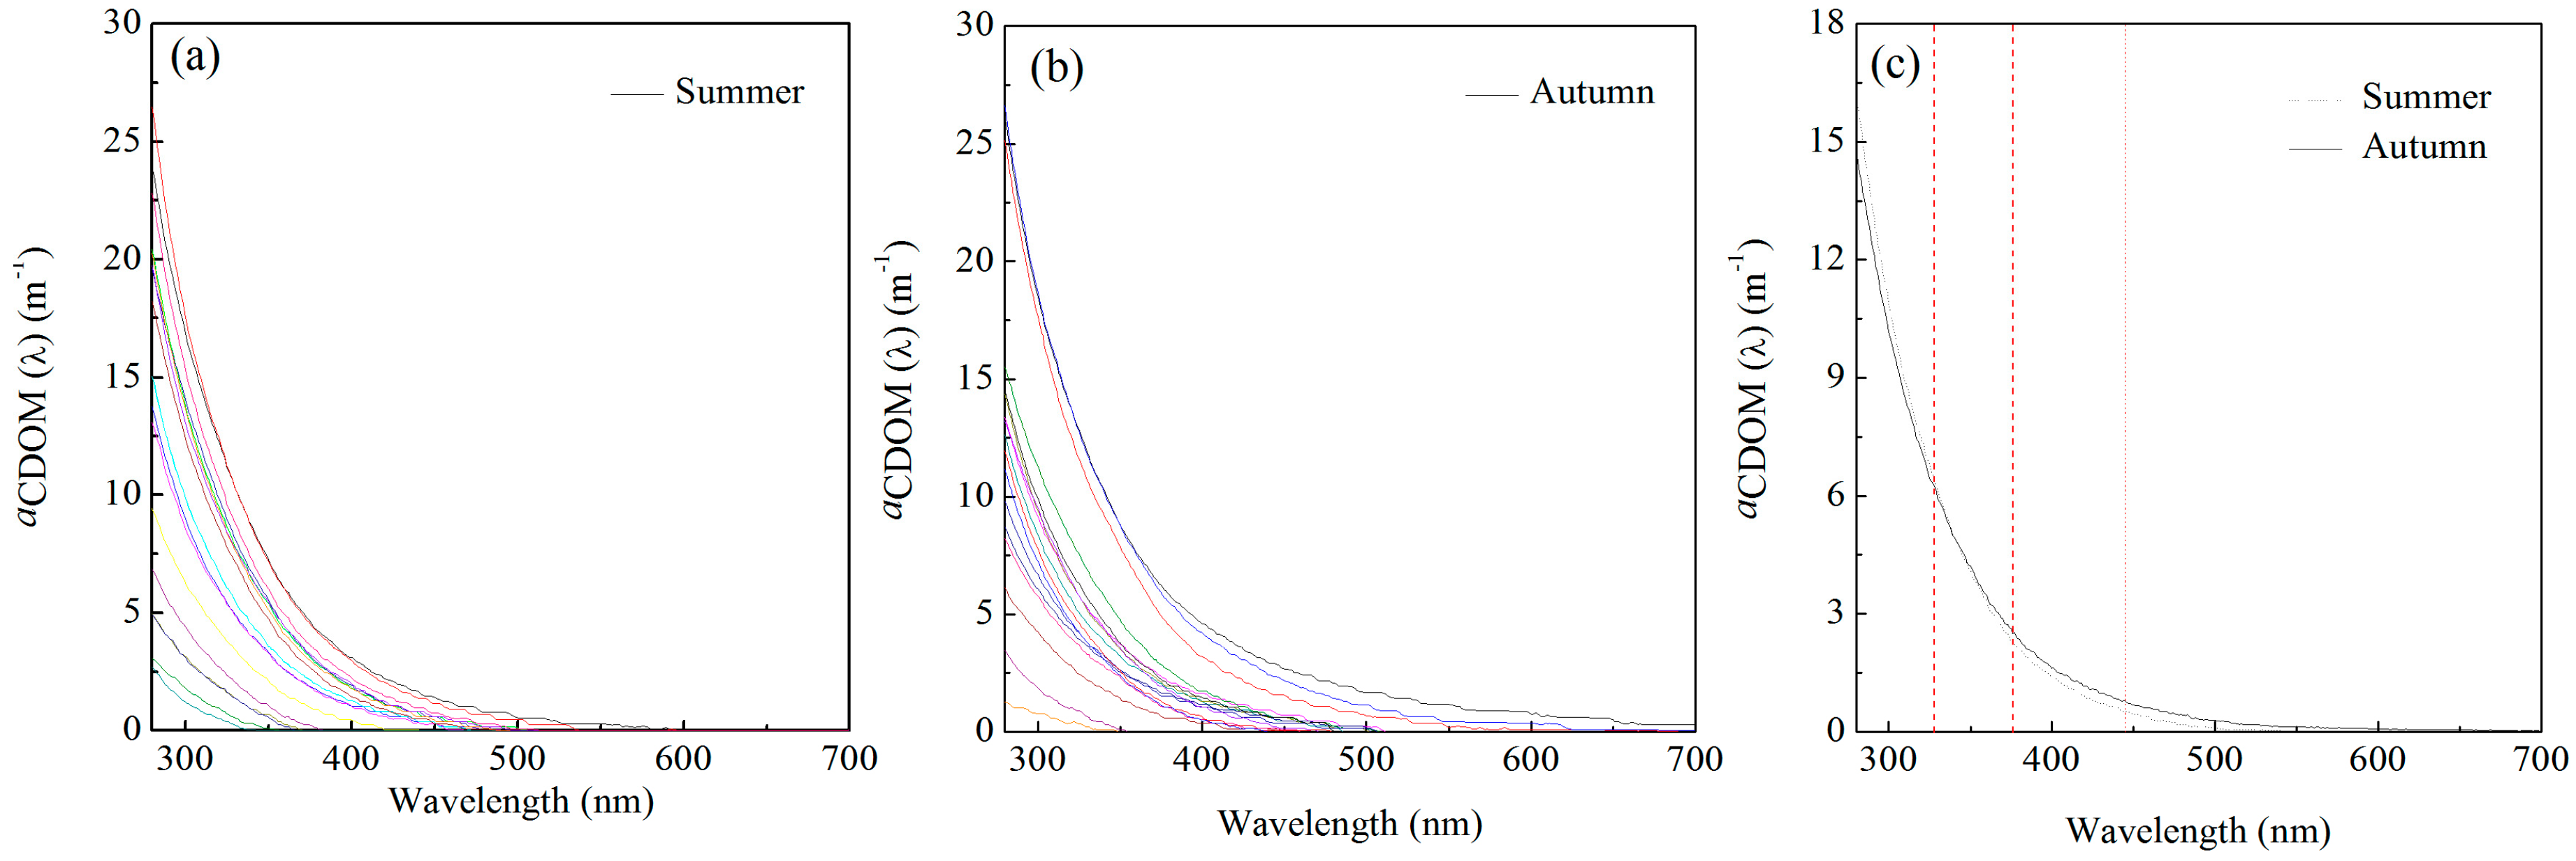
3.3. Spectral Characteristics of CDOM Absorption

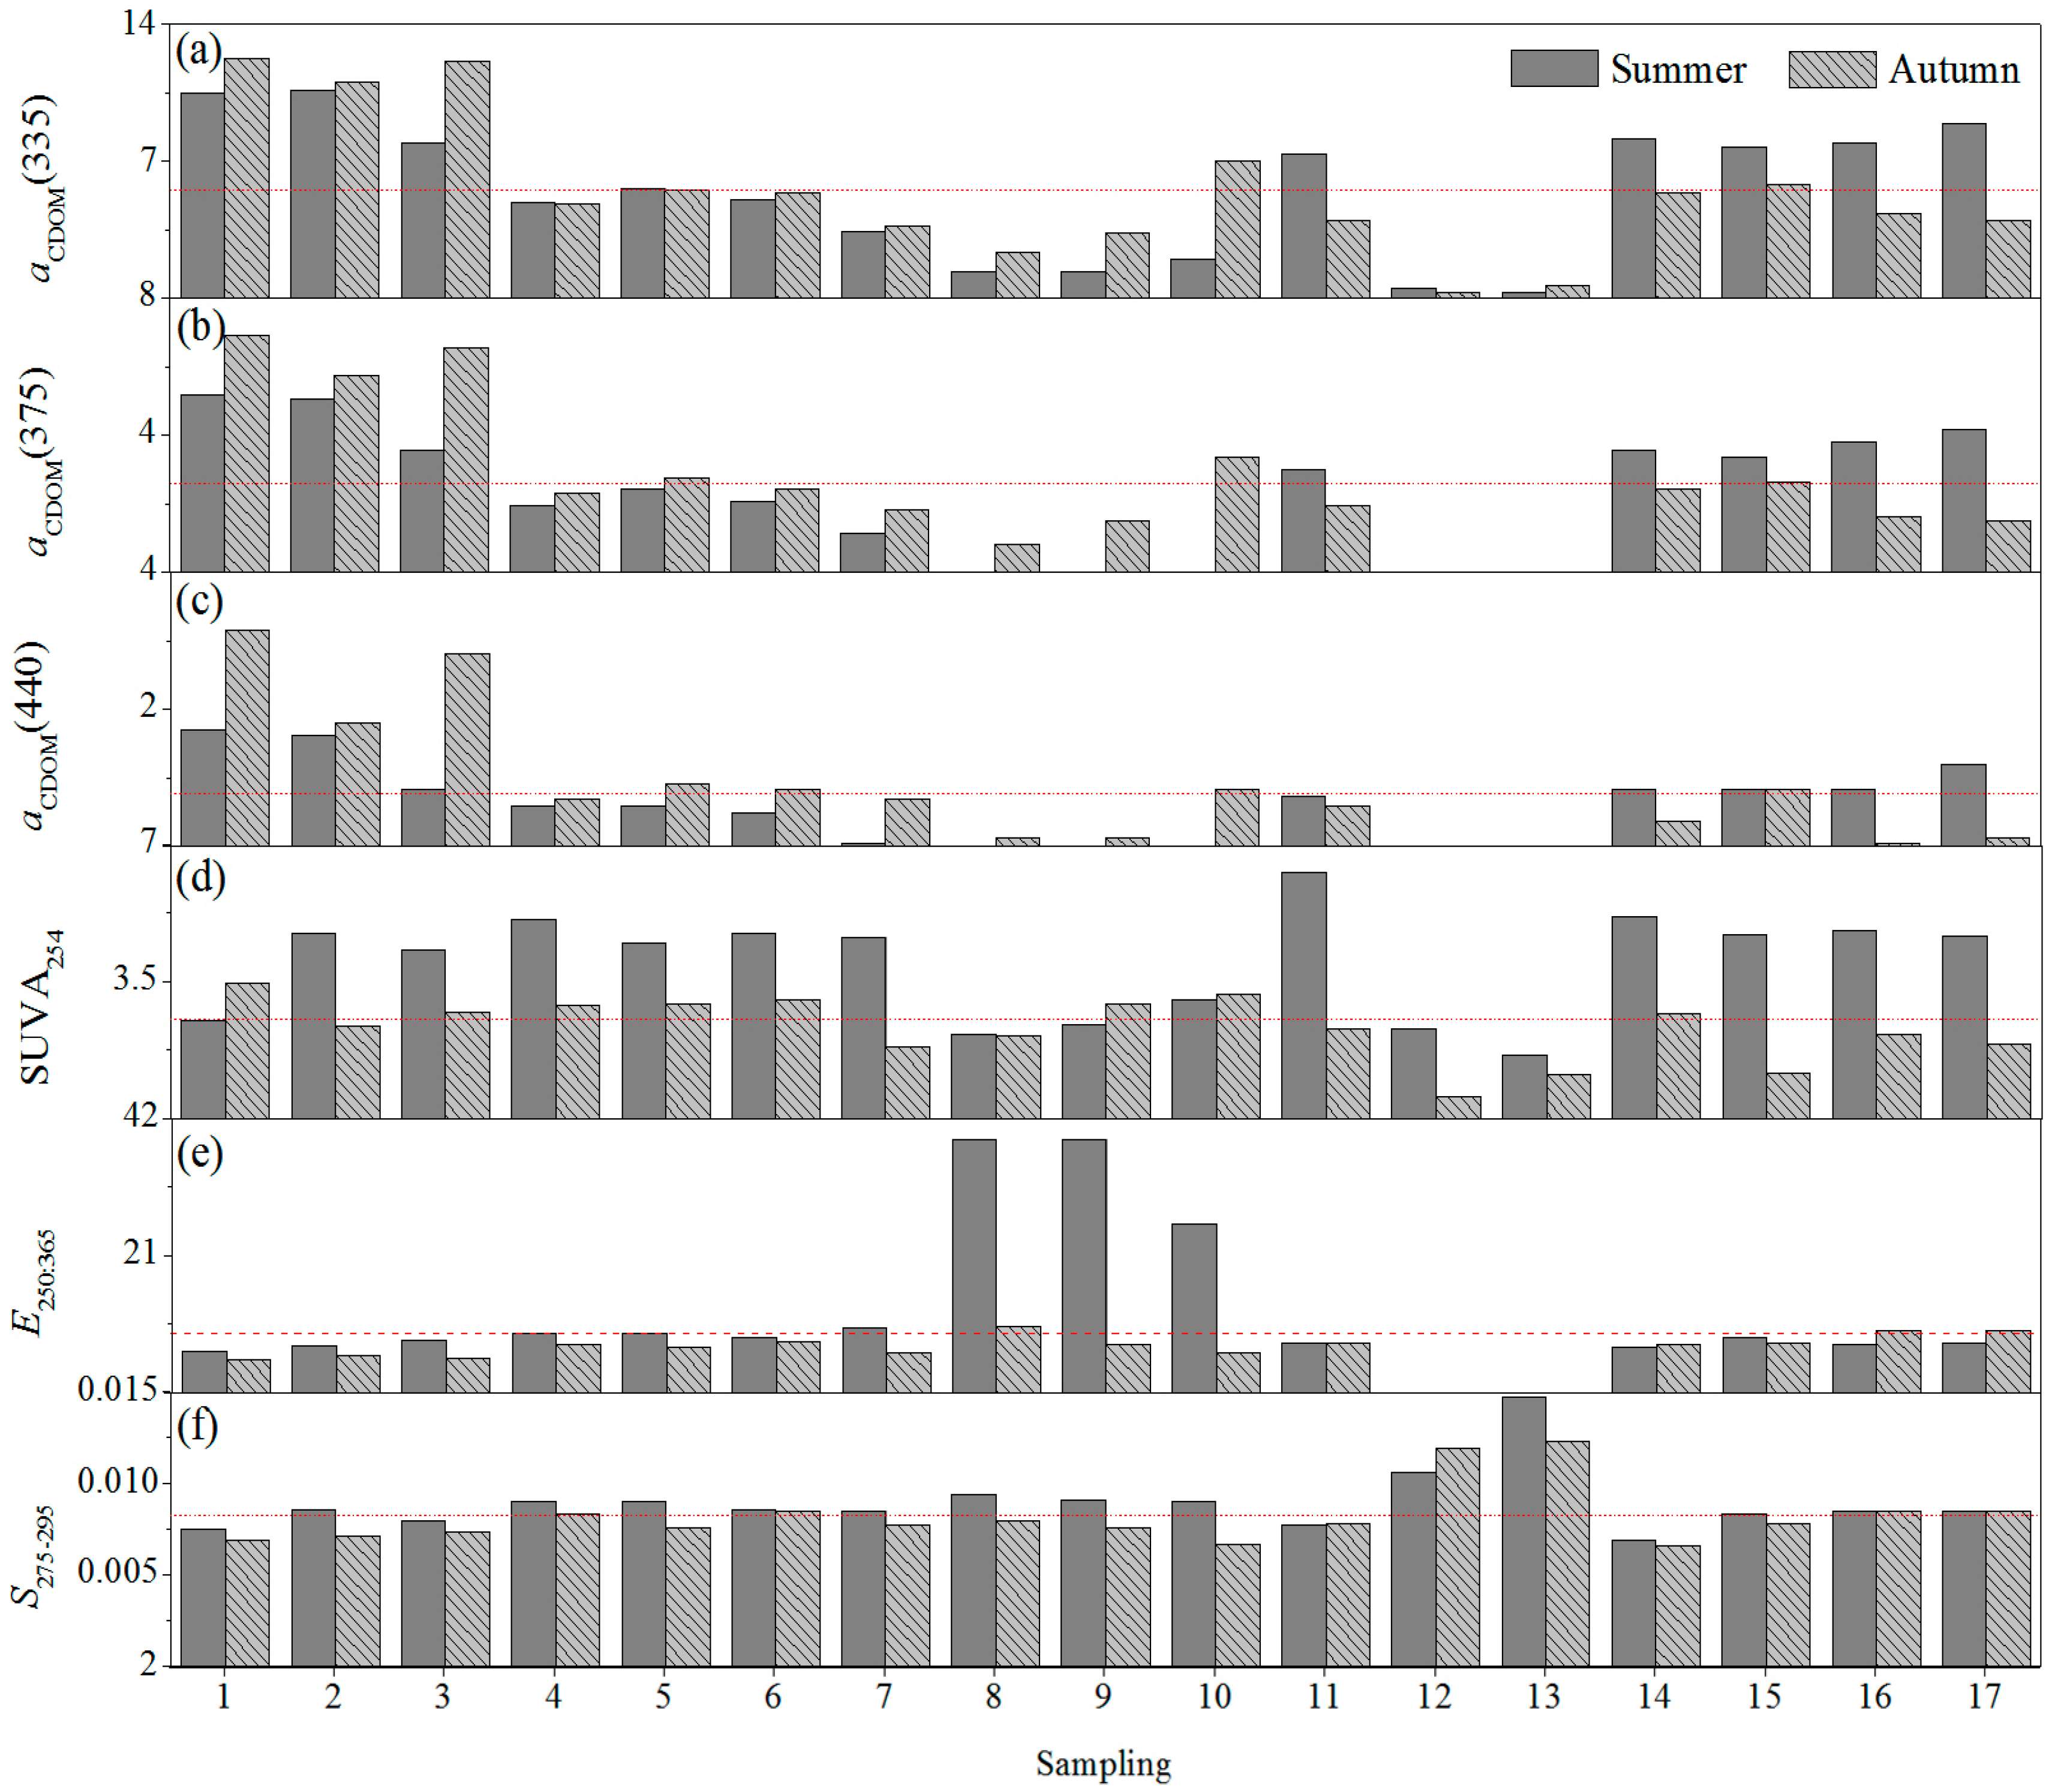
3.3.1. Seasonal Variation

The CDOM absorption spectrum typically decreases in an approximately exponential fashion with increasing from ultraviolet (UV) to visible wavelengths (Figure 5), similar to the CDOM samples from various natural environments [53]. Note that high standard deviations for these values reached ~50%, indicating high spatio-temporal variability in aCDOM (Figure 5). The CDOM absorption coefficient at specific wavelengths has often been used as a surrogate for colored DOM [54,55]. The average aCDOM(335), aCDOM(375) and aCDOM(440) in autumn exhibited significantly higher CDOM light absorption than in summer (Table 3). The CDOM absorption was consistent with the changes of the water quality (DOC and Chl-a). The use of spectral slopes (S275–295) and the absorption ratio (E250:365) for the tracking of changes in the CDOM molecule size has been practically conducted to be calculated as indicators [43]. As shown in Table 3, increasing E250:365 values indicated a decrease in the aromaticity and molecular weight of CDOM, and a higher average E250:365 (11.7 ± 11.5) was observed in summer than in autumn (6.4 ± 2.8). It demonstrated relatively high molecular weight CDOM and aromaticity in the rivers in autumn. Recently, a large number of field and laboratory studies have proved that S values are inversely proportional to the molecular weight of the CDOM, with a steeper spectral slope signifying a decreasing of the aromaticity, and a shallower spectral slope signifying an increasing aromatic content [56]. Concurrently, S275–295 could be used as an indicator for the terrigenous DOC percentage [57]. The S275–295 value was 0.0089 ± 0.0020 nm−1 in summer and 0.0082 ± 0.0016 nm−1 in autumn (Table 3). The riverine waters showed higher S275–295 than other riverine waters, as has been found in other studies undertaken in lakes [18,34,35]. Higher S275–295 values (0.0089 nm−1 ± 0.0020) in summer indicated that the decrease of the aromatic compounds and the percentage of low molecular weight fulvic acid in CDOM in summer were greater than in autumn.
As an effective index to characterize the DOC concentration, SUVA254 values have been proved to have a correlation with DOM aromaticity as determined by 13C-NMR [46]. The average SUVA254 measurements (2.3 ± 0.8 mg·C−1·m−1) in autumn were lower than in summer (4.0 ± 1.4 L·mg·C−1·m−1). From the conclusions and conjecture of some studies on SUVA254 and the hydrophobic organic acid fraction [46,47], higher SUVA254 values indicated that the aquatic systems had abundant vascular plant input, and the allochthonous sources dominated the organic matter content. Conversely, the lower values showed more autochthonous sources (algal and microbial). According to Figure 2 and Figure 5c, the smaller seasonal disparities at 254 nm of the CDOM absorption and the larger disparities in DOC concentration may result in higher SUVA254 in summer, in which the ratio of SUVA254 is aCDOM(254)/DOC. Although our study found the inverse results in highly polluted waters, the potential reason may be that more UDOM (uncolored dissolved organic matter, UDOM) was found in the riverine waters [58].

3.3.2. Spatial Variation

Sampling locations were collected at every station from NO.1 to NO.17 to achieve better resolution of the spatial variability (Figure 6). Seasonal aCDOM(335), aCDOM(375) and aCDOM(440) in NO.12 and NO.13 located in the upstream region were relatively lower than the sampling locations in the downstream region (Figure 6). Owing to the inputs of urban sewage, NO.10 located around Shuangyang County showed high CDOM. Many loads of sewage accumulated in the downstream region, resulting in the relatively high CDOM being found in NO.15, NO.16 and NO.17. Seasonal E250:365 showed a polarization phenomenon in different sampling locations (Figure 6). Following the recommendations of recent studies, the relatively high E250:365 values in NO.8, NO.9 and NO.10 with low contents of aromatic hydrocarbons and low molecular weight were remarkable in the summer. However, there were no significant spatial disparities in autumn (Figure 6). It could be attributed to the reduced run-off and precipitation. Due to the seasonal aCDOM(365) having zero values, low E250:365 values were observed in NO.12 and NO.13, which has the ratio of E250:365 is aCDOM(250)/aCDOM(365). However, high S275–295 values were observed in NO.12 and NO.13 (Figure 6), signifying a decrease in the aromaticity and molecular weight of CDOM.
Relatively lower SUVA254 measurements found in the upstream region (NO.8, NO.9, NO.10, NO.12, and NO.13) indicated that the aromatic moieties of CDOM were lower compared to the downstream region in summer. It revealed the greater contribution of vascular plant matter to DOM and the higher molecular weight DOM in the upstream than in the downstream. In summer, the highest SUVA254 measurement was found in NO.11, located in the low mountains and hills. The aCDOM(254) and DOC concentrations in NO.11 were 28.02 m−1 and 4.46 mg/L with the mean values of 22.71 m−1 and 5.62 mg/L, respectively, where the ratio of SUVA254 is aCDOM(254)/DOC. According to Brezonik et al. [59], NO.11 had a lower color DOC concentration resulting from algal-derived DOC in the waters. There was no significant spatial difference in autumn (Figure 6). SUVA254 in NO.1 showed the highest value in summer, and a higher aCDOM(254) 37.68 m−1 (mean value, 14.44 m−1) was also found in NO.1. It indicated the increased aromatic hydrocarbons.

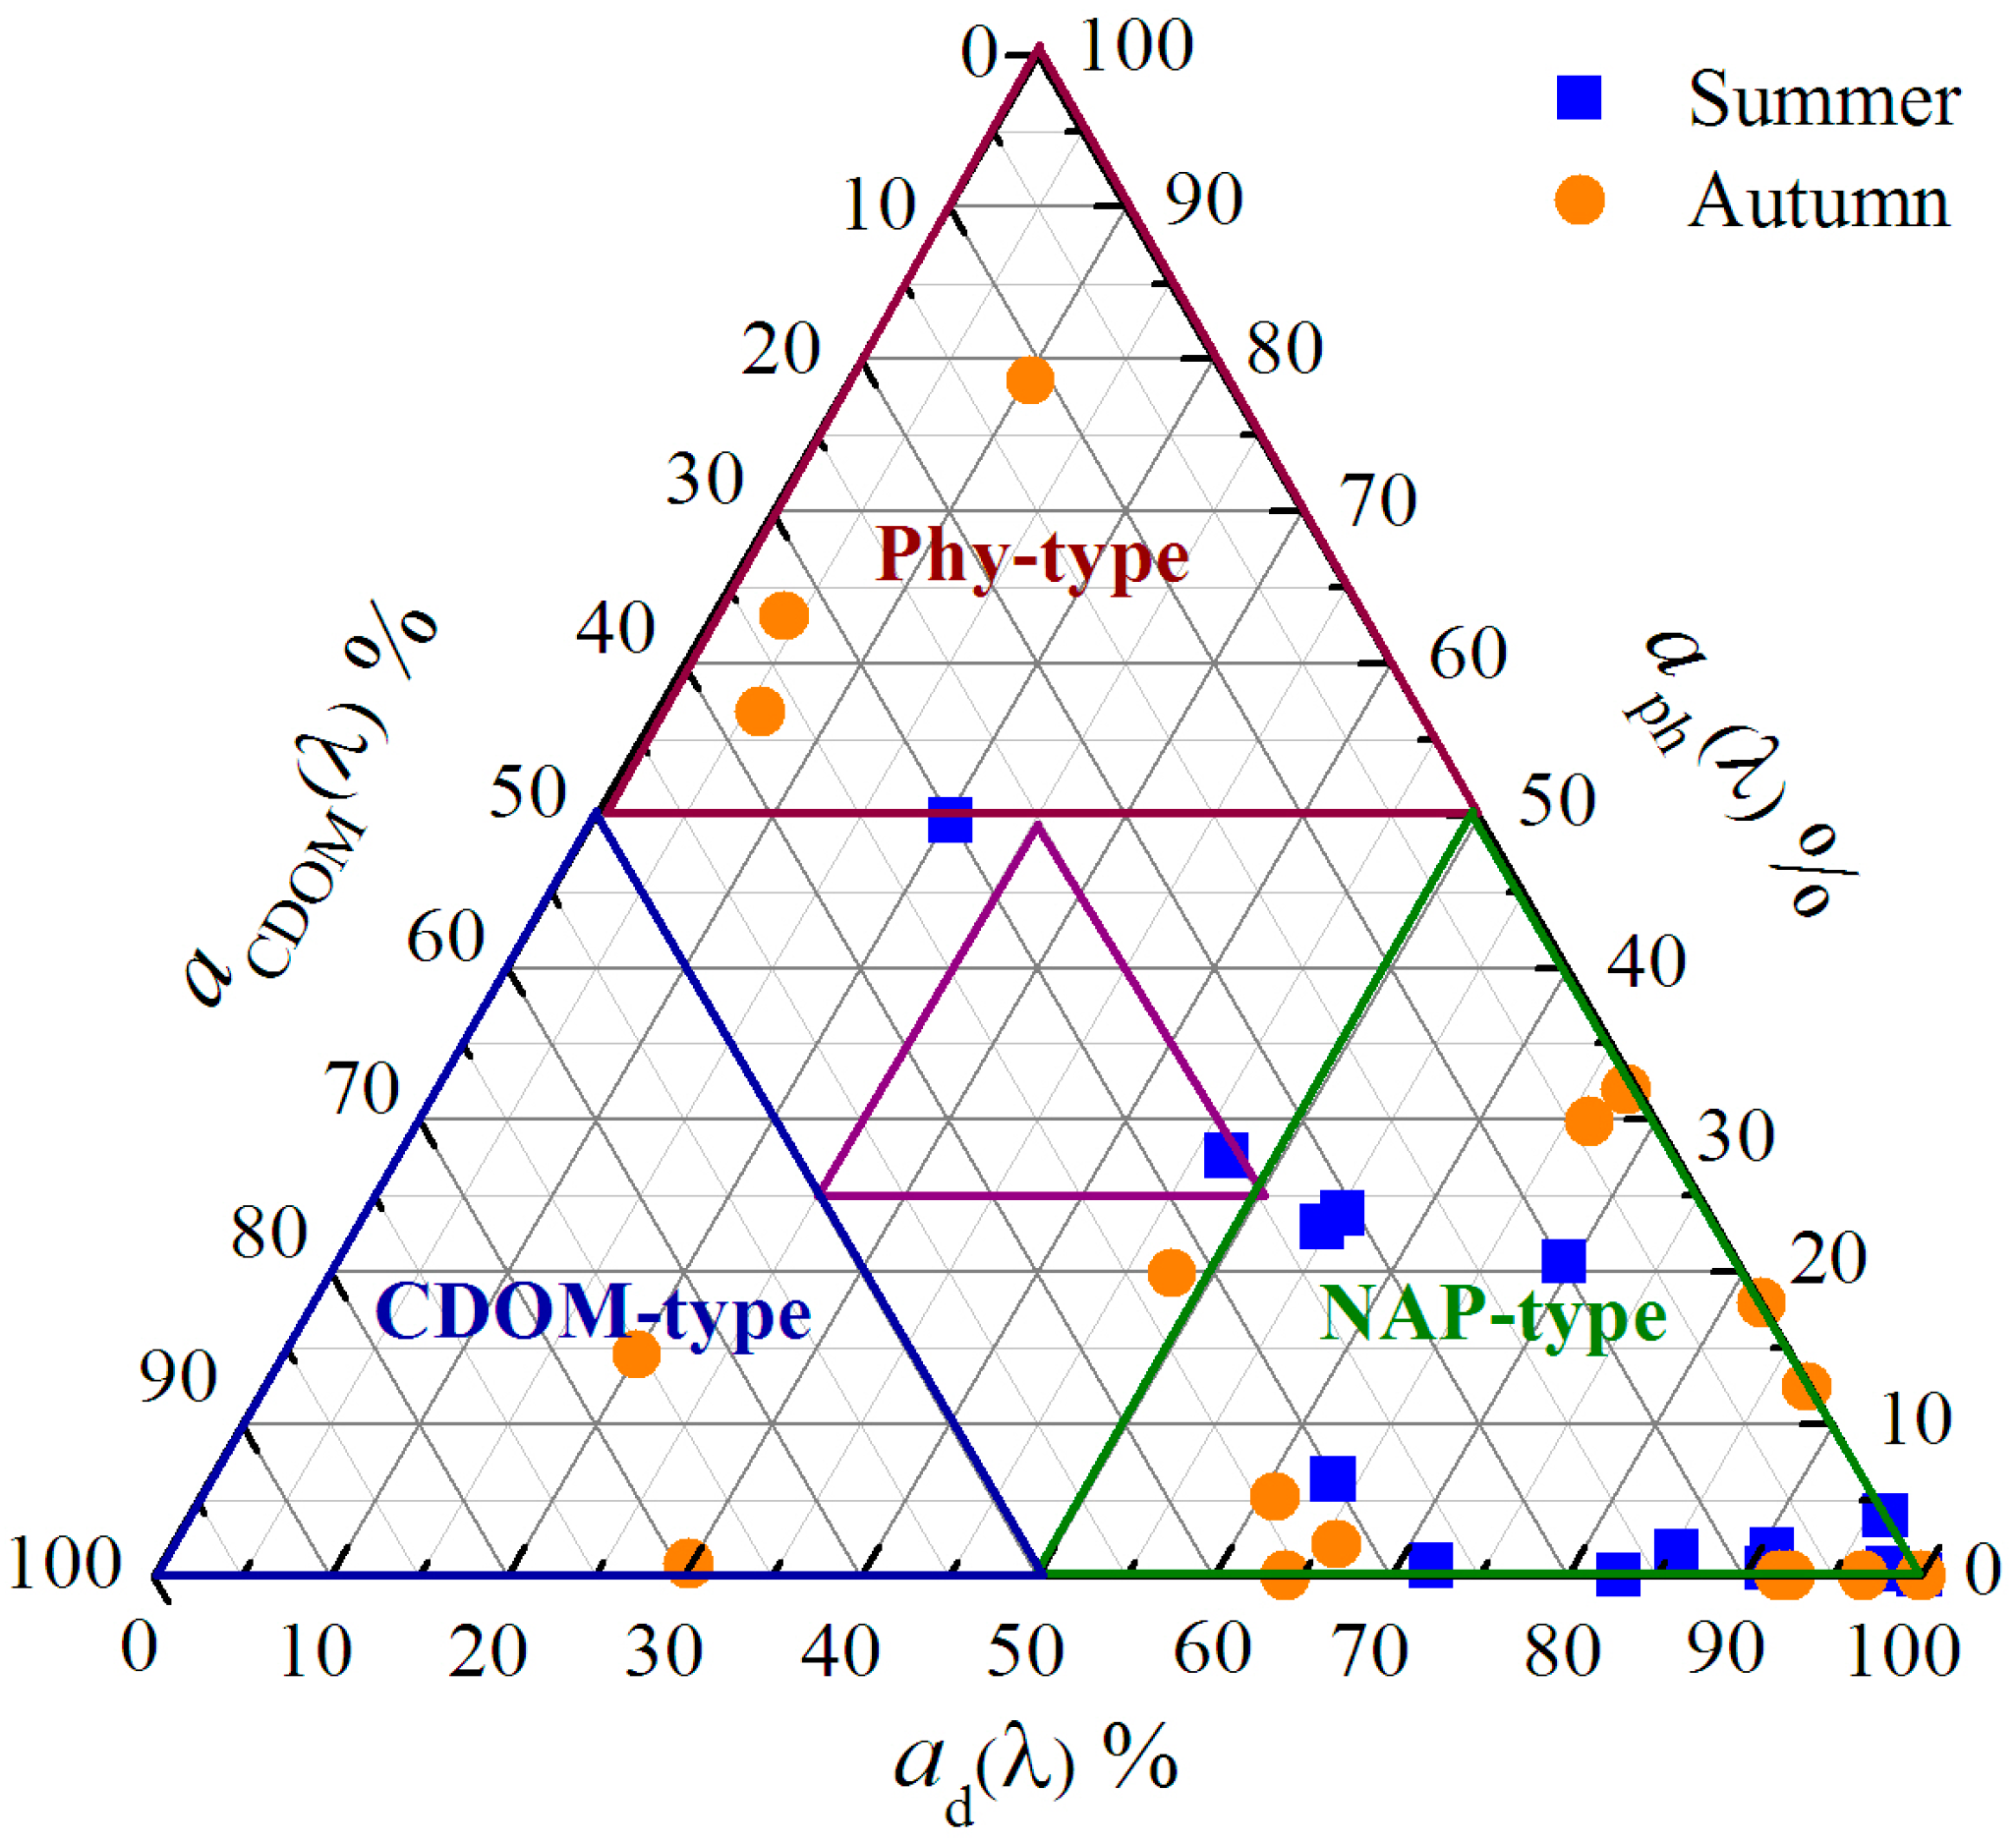
3.3.3. Relative Contributions of CDOM Absorption

The difference in the contributions of phytoplankton and CDOM to the total absorption could influence the maximum photosynthetic rate and determine the photo-chemical mineralization of DOC [29]. The relative contributions of optical substances at 440 nm are shown in Figure 7. There was an obvious seasonal difference in the relative contributions of CDOM, phytoplankton and non-algal particles. Non-algal particle absorption played a major role in total non-water light absorption in the riverine waters. Other reports and the earlier work have suggested that non-algal particle absorption often accounts for most of the total light absorption for most inland waters [42]. It is necessary to classify waters according to the variation in optical characteristics in different catchment properties. According to the optical classification of surface waters [60], the waters from the Yinma River watershed both in the summer and autumn could be classified as “NAP-type” (Non-algal particles). The mean contribution of CDOM to the total contributions was 13% (0%–30%) with comparatively minor importance in the summer, and 22% (0%–69%) in the autumn. The relative average contributions of non-algal particles and phytoplankton were 78% (20%–100%) and 9% (0%–49%) in the summer, and 58% (4%–100%), 20% (0%–79%) in the autumn, respectively.
The non-algal particles occupied a predominant position in the total non-water light absorption, consistent with the TSM concentration (Figure 7). In most rivers, there was usually a sufficient amount of kinetic energy to keep the predominant position of non-algal particle absorption in the total absorption. TSM concentrations were largely effected by the precipitation, land cover types and sediment suspension, etc. The second contribution constituent of light absorption was CDOM (Figure 7). As a constituent of DOM, the CDOM absorption characteristic was affected by solar radiation, phytoplankton, microbe activity, river discharge and terrestrial inputs due to the chemical photo-bleaching and microbial degradation, etc. In our opinion, pollutants from the terrestrial inputs were a main factor responsible for this relatively high CDOM contribution. For the highly polluted waters, the relative contributions of optical active constituents to total non-water light absorption showed the wide spatio-temporal variability of DOM loads in riverine ecosystems where numerous and complex physical and biogeochemical factors regulate the interaction between the diverse source and sink process. However, these changes were generally related to the local environmental factors and climate.

3.4. Relationship between DOC and CDOM

The presence of significant linear CDOM-DOC relationships has been documented in various coastal waters, estuaries, lakes and river domains in the recent years [36]. The Pearson correlation between the CDOM absorption coefficient (aCDOM(335), aCDOM(375), aCDOM(440)) and DOC concentration was conducted in this study (Figure 8). It showed that there is a positive correlation between the DOC and CDOM absorption coefficient, indicating the possibility to calculate the flux of the DOC based on CDOM absorption in riverine waters. The correlation coefficients are 0.82, 0.84 and 0.90 in the summer (two-tailed, p < 0.01), and 0.68, 0.65 and 0.58 in the autumn (two-tailed, p < 0.05) (Figure 8). These results are in relation to the changes of SUVA254 and aCDOM(λ) in different seasons.

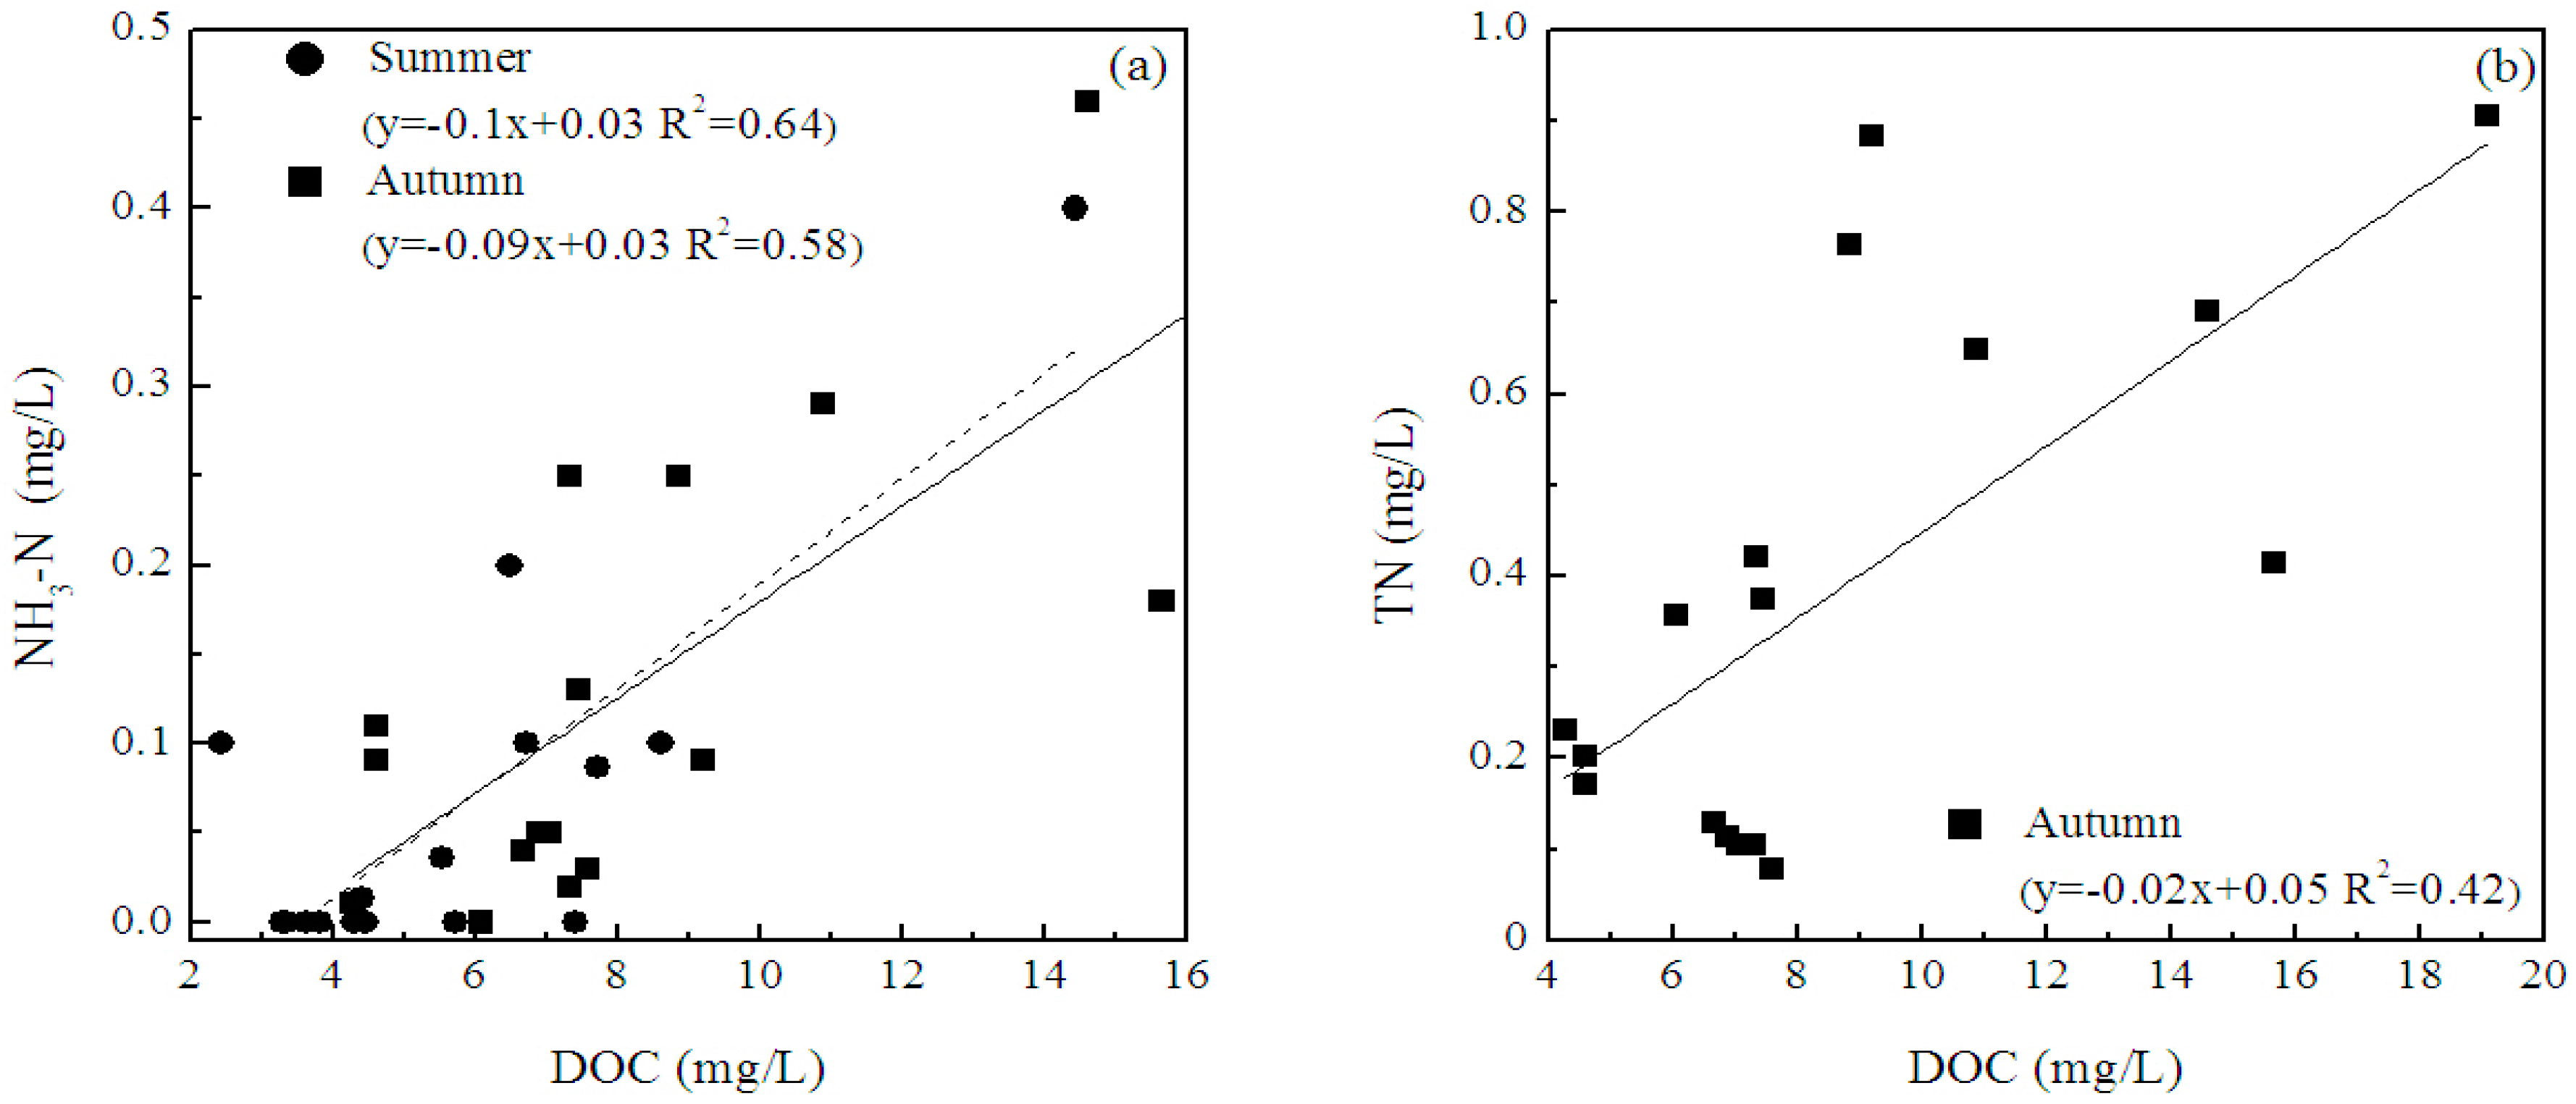
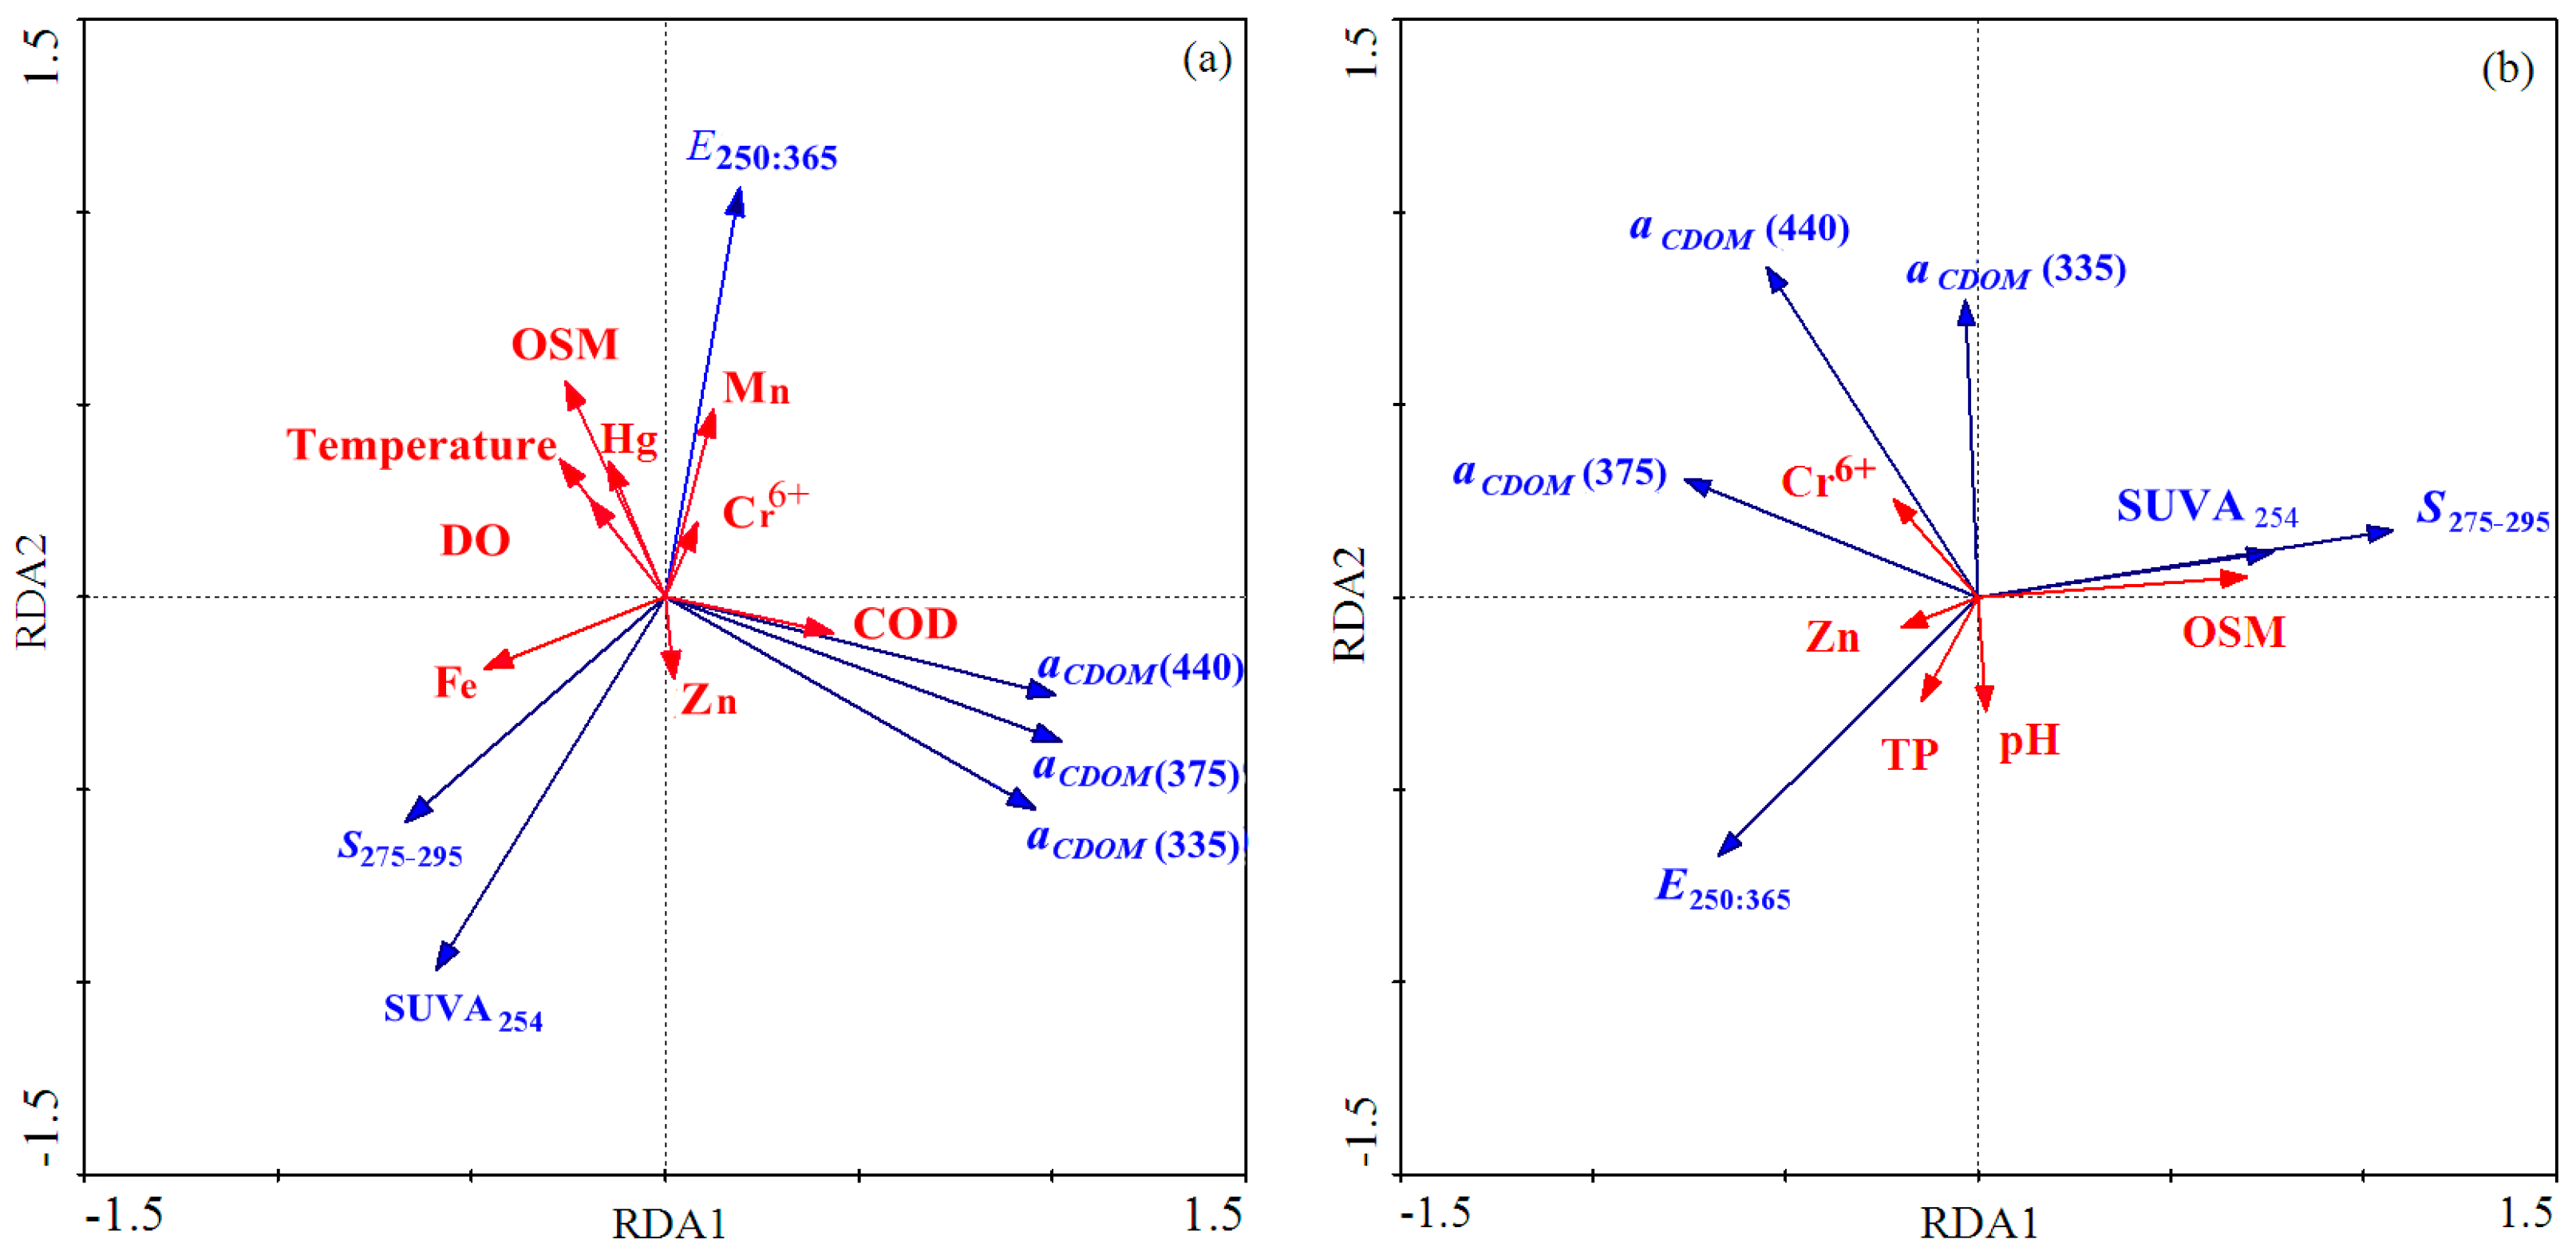
3.5. Correlations between Environmental Factors and CDOM Absorption

DCA was performed for the response variables in all the sampling locations, and we found that the lengths of the gradient were 0.996, 1.320, 1.191 and 1.193, respectively. It demonstrated that the linear relationship between species-environment variables (the optical parameters of the CDOM and the environmental factors) had values less than 3. In order to achieve the normal distribution data, the log-transformed process was performed for the original data before analysis. In addition, there may have been a higher correlation among the environmental variables with less contribution. It needs to use RDA to eliminate the invalid environmental variables, e.g., the partial correlation coefficient of factors greater than 0.8 and the variance inflation factors greater than 20. The summary of Monte Carlo permutation tests were used to testify and validate the variables. The deleted environmental variables mainly contained the TSM, ISM, DOC, Chl-a, pH and NH3-N for the summer sampling locations. Simultaneously, TSM, ISM, DOC, Chl-a, TN, DO, NH3-N, COD, Fe, Mn and temperature could be eliminated. These factors generally exhibited high autocorrelation with CDOM.
The relationships between environmental factors and the optical characteristic of CDOM have been shown Figure 9. The species-environment correlations ranged from 0.826 to 0.651 in the summer and autumn, respectively. In the summer, the first two axes of the RDA could explain 64.2% (axis 1, 40.4%; axis, 23.8%) of the total variables for the CDOM light absorption. It indicated that COD, Mn and OSM had a strong correlation with the CDOM absorption, followed by Hg and Cr6+. Likewise, 36.5% (axis 1, 26.3%; axis, 10.2%) was found in autumn. There existed a positive correlation between OSM and CDOM absorption, followed by Cr6+ and TP. The CDOM characteristic was affected by the absorption properties of DOM for iron. OSM and TP affected the CDOM absorption by the phytoplankton indirectly.

4. Discussion

4.1. Dissolved Organic Carbon in Riverine Waters

DOM, along with other nutrients, is derived from soil via runoff and leaching. The high DOC concentration observed in riverine waters indicated the organic-rich nature ecosystem. It was found that grassland and forest always have high nitrogen and organic matter export rates, and the types of land use around the sampling locations may be a crucial factor to determine the nutrient levels in the waters [52]. Along with the longer residence time, the DOC concentration decreases for inland waters in the humid region [36]. Most monitoring data sets indicate that elevated the DOC concentration in the semi-arid or arid environment could be related to salinity and attributed to evaporation, potentially due to prolonged water residence times and DOM accumulation [18,31]. These similar studies were also exhibited in terminal waters, e.g., Inner Mongolia Plateau and Hulun Lake [35]. For the heavily polluted waters (Table 1), rivers collected waters from many tributaries and streams. The streams flowed through many croplands and through chemical industry in the midstream and downstream regions. The landscape brings greater DOM, e.g., polycyclic aromatic hydrocarbons, antibiotics, pesticides and organic pollutants. Hence, anthropogenic inputs are the key factor in determining the DOC concentration. In NO.1, there were excessive nutrients when large quantities of domestic and industrial sewage were discharged into watercourses. Under the continuous inputs of the pollutants, concentrated precipitation could affect the DOC concentration. Raymond et al. [22] studied the seasonal DOC in high-latitude rivers and found that the DOC was characterized by increasing the concentration significantly with the increasing discharge of rivers. The Yinma River watershed is located in a semi-arid region, and the recharge sources of the rivers mainly come from rainfall. Recently, the Yinma River watershed has entered a dry year, and partial watercourses dried up due to the precipitation deficit. Particularly, for limited rainfall in the autumn, there was only wastewater joined in the rivers during the sampling period. Riverine waters could not purify sewage based on purification capacities themselves, including a reduced pollutant-carrying capacity. The DOC results in the Yinma River watershed showed a higher value (8.7 mg·L−1) in autumn than in summer (5.6 mg·L−1). Previous studies [18,61] showed that the riverine waters have shorter residence times due to the high flowability and quick exchange rates of flow water enhancing terrestrial DOC inputs. Generally, high molecular weight humic acid was examined. The positive correlation between the NH3-N and DOC could explain microbial activities and the oxidation process between dissolved organic matter and inorganic carbon (Figure 3). Simultaneously, nutritional conditions (TN and TP) had a pronounced influence on the conversion processes through the respiration and reproduction of microbes and phytoplankton [35]. The positive relationship between DOC, NH3-N and TN indicated that an empirical model might be established in polluted waters for estimating DOC storage, with calibration by a comprehensive data set.

4.2. Analysis of CDOM Spectral Characteristics

In the terminal waters (lakes or reservoirs), high molecular weight CDOM could be destroyed by photolysis with the prolongation of the hydraulic retention time and irradiation [18,35]. High molecular weight CDOM could transform to a low molecular weight pool by the bond cleavage [29]. The UV-photic zone for photo-bleaching in turbid water rarely exceeds 10 cm, so photo-bleaching in these waters is inefficient and mixing masks its effect [44]. In addition, riverine waters have shorter residence times due to the high flowability and quick exchange rates of flow water. A high TSM concentration was also found in the riverine waters. Non-algal particle absorption played a major role on total non-water light absorption (Figure 7). Hence, the synergistic effect of the photo-bleaching process is not significant. We suspected the possible conjecture for diverse results in highly polluted waters might be the input of polycyclic aromatic hydrocarbons, pesticides and organic pollutants. In the terrestrially dominated region, DOC generally varies seasonally in relation to the magnitude of freshwater inputs [62]. This phenomenon implied that the endogenous CDOM pool was probably small relative to the anthropogenic CDOM input in the rivers. In the South Atlantic Bight which is strongly influenced by riverine waters, the water optical properties are determined by high CDOM and sediment input as well as enhanced phytoplankton growth [44]. Precipitation could have a small impact on CDOM optical properties through the river flow indirectly [19,56]. During low precipitation conditions, E250:365 and S275–295 in autumn exhibited low values. It may be due to the fluctuations of river discharge. When the watershed is relatively small and the recharge sources of the river are mainly independent on precipitation, the CDOM characteristic is greatly affected by the precipitation indirectly. In a large watershed, the influence of precipitation is sporadic. There many studies on SUVA254 in riverine waters, e.g., 30 American rivers (1.31 to 4.56 L·mg·C−1·m−1), the tropical Epulu River (3.08 to 3.57 L·mg·C−1·m−1) and the Plateau River (1.08 to 4.79 L·mg·C−1·m−1) [36]. Although our study found the inverse results for highly polluted waters, the potential reason may be that more UDOM (uncolored dissolved organic matter, UDOM) existed in the riverine waters [58]. Further, algal-derived DOC had a lower color intensity than the DOC from the decomposition of woody vegetation (humic-derived DOC) [59]. The DOC from anthropogenic sources (e.g., wastewater effluent) is nearly uncolored [59]. This could explain the significant CDOM-DOC relationship in riverine waters in the summer (Figure 7).
The Kolyma River flow through the forest showed higher DOC (CDOM) than that on dry land [20]. However, the study on head water streams draining agricultural and near-pristine catchments (forested and wetland) in the North German plains showed a high DOC on dry land [20]. Compared to other land use types, soil organic matter from dry land is easier to accumulate in rivers. The use of organic fertilizer in agricultural production could increase the organic matter content in the soil. It demonstrated that the downstream waters (NO.15, NO.16 and NO.17) focused on dry land exhibited a relatively higher CDOM molecular weight and aromatic hydrocarbons. The adverse results of NO.12 and NO.13 were shown in the upstream region. The sampling locations of garbage and pollutants accumulated sporadically in the downstream were consistent with regions with concentrated residential areas. Partial sampling locations around the cities or countries generally were abnormal values due to the influence of anthropogenic activities, e.g., NO.1 and NO.10. Along with the continuous inputs of nutrients, the decrease of temperature and the low TSM concentration, the relative contributions of phytoplankton to total non-water light absorption generally increased in sporadic sampling locations (Figure 7). The persistent input of pollutants increased the CDOM contributions in autumn. Industrial proportion achieves 70% in the Songhua watershed. Agricultural productions also have an important influence, and the proportion achieves the 30%. The point source pollution is a control factor of pollution. In the Yinma River watershed, industrial sectors such as the Jilin Chemical Industry Corporation and Changchun First Motor Factory are the center of the chemical and machine industries. Spatial distribution of the CDOM around cities was inhomogeneous due to the influence of point source pollution. Conversely, this study focused on the polluted waters could indirectly indicate the scope of the point source. Zhou et al. [33] used the optimal wavelength derived from CDOM fluorescence as an indicator of point source contamination in drinking water, using a combination of field campaigns in Lake Qiandao and a laboratory wastewater addition experiment. Simultaneously, many sewage plants were only established in Jiutai City and Dehui City, and the sewage treatment capacity is insufficient.

4.3. CDOM-DOC Relationship and Environmental Factors

Closer CDOM-DOC analysis indicates that it could use CDOM values (whether measured or computed from remote sensing data) to predict DOC concentrations. Spencer et al. [36] concluded from a study of 30 rivers that CDOM could be used as a surrogate for DOC in most major rivers of North America. Previous studies have focused on the variability with different r2 values for CDOM-DOC relationships [62]. The best-fit relationships were linear and involved log transformations. In the Yinma River watershed, the significant correlation coefficients were found in summer rather than in autumn with the DOC concentration ranging from 2.4 to 19.1 mg/L (Figure 9). The major cause of this variability likely is hydrologic variations in the contributing watershed (e.g., variable input of runoff containing colored humic material from forests and wetlands). The fraction of easily degradable DOM that was not included in the CDOM was estimated to be between 8% and 26% of the overall DOC [63]. Stanely et al. [64] found that anthropogenic activities such as intensive agriculture or input of sewage could have large effects on the natural DOC in rivers and streams. These results are related to the changes of SUVA254 and aCDOM(λ) in different seasons. When the ratio of CDOM and UDOM or the CDOM to the DOC is constant, a better CDOM-DOC relationship can be found [58]. Brezonik et al. [59] reported that when data sets are restricted to exclude water bodies with heavy impacts from anthropogenic activities that yield a DOC with low color, tight CDOM-DOC relationships can be observed, although the nature and source of the less-colored DOC in waters are unknown. The sewage has higher EfOM (effluent organic matter), resulting in a lighter color per unit of DOC. DOC is the main member of EfOM, accounting for about 86% of COD [65]. In addition, the association of dissolved iron with DOC affects its color intensity, and spatial variations in iron concentrations thus can affect CDOM-DOC relationships [14,59]. According to Table 1, COD in riverine waters showed higher values (392.16 mg/L) in summer than in autumn (49.37 mg/L), and opposite results could be found in the Fe concentration. The variations in dissolved iron concentrations would likely lead to poor DOC-CDOM relationships [59].
Environmental factor analysis showed that COD, Mn and OSM had a strong correlation with CDOM absorption (Figure 9). CDOM levels in inland waters display a very broad range, influenced by terrestrial characteristics (e.g., vegetation type or quantity). The complexity of sources exhibited a challenge to the current CDOM-derived algorithm used to estimate the DOC, etc. Zhu et al. found that the best algorithms, e.g., QAA-CDOM, QAA-v5, Carder-2, Brando-2, Kutser, and Ficek, have larger RMSE (Root Mean Square Error) errors in freshwaters than in open-sea waters [19]. Particularly, semi-analytical algorithms (QAA-v4, QAA-v5 and QAA-CDOM) are advantageous for inland turbid waters [18]. Due to the interference from high sediments and Chl-a concentration, aCDOM(λ), the parameter of the bio-optical model, is sensitive to changes in the specific composition of water constituents and may not show a completely exponential function. High non-algal particles and Chl-a exhibit high back-scattering within the longer wavelengths. Additionally, it is difficult to separate the adg(λ) (the sum absorption coefficient of non-algal particles and CDOM). The empirical algorithms need large data sets spanning broad environmental conditions. For the highly polluted waters, empirical algorithms generally are local and may show more uncertainties. A CDOM-derived algorithm needs consecutive observations, improvement of arithmetic and high spectral resolution of sensors, particularly for such narrow riverine waters and streams. The European Space Agency launched Sentinel 2A and 2B in 2015. They carry a wide high-resolution multispectral imager with 13 spectral bands and 10 m spatial resolution. It will give researchers another potential tool to estimate CDOM (DOC) in riverine waters.

5. Conclusions

The Yinma River watershed is an important highly polluted tributary of the Songhua River. In terrigenous and riverine environments, the CDOM optical characteristic was also optically complex due to elevated amounts of particulate and dissolved constituents. Recently, waters in the Yinma River watershed have been seriously polluted based on the high comprehensive index P both in summer and autumn. COD, Fe, Mn, Hg and DO were out of range of the contamination warning. Diverse CDOM optical characteristics were obtained from spectral parameters, e.g., aCDOM (335, 375 and 440 nm), SUVA254, E250:365 and S275–290 in different seasons. The following conclusions were obtained.
(1) The higher E250:365 and S275–295 in summer indicated the decrease of aromatic compounds and the percentage of low molecular weight fulvic acid in CDOM compared to autumn. Opposite SUVA254 values could be found in comparison to other studies [18,36]. The potential reason may be the more uncolored and anthropogenic UDOM existing in the riverine waters [59]. The downstream waters focused on dry land exhibited a relatively higher CDOM molecular weight and more aromatic hydrocarbons than in the upstream region. Partial sampling locations around the cities or countries generally have abnormal values due to terrigenous inputs and high pollution levels. Low discharge and continuous inputs from tributaries and streams bring more DOM, e.g., polycyclic aromatic hydrocarbons, pesticides and organic pollutants in autumn.
(2) Environmental variables OSM had a strong correlation with CDOM absorption, followed by heavy metals, e.g., Mn, Hg and Cr6+, in the Yinma River watershed. TP and OSM could affect the CDOM absorption with phytoplankton in autumn.
(3) The positive linear CDOM-DOC relationship was exhibited in the summer with a low comprehensive index P, and these results are related to the changes of SUVA254 and aCDOM(λ). For the heavily polluted waters, the obvious correlations were found in shorter wavelengths. The high loading of complex CDOM inputs from anthropogenic activities constitutes a challenge for deriving CDOM and DOC flux. In addition, aCDOM(λ), as a parameter of the bio-optical model, is sensitive to changes in the specific composition of water constituents and may not show a completely exponential function. For the highly polluted waters, many algorithms may show more uncertainties [18]. The algorithm needs a high spectral resolution of sensors, consecutive observations and improvement of the arithmetic.

Acknowledgments

This study was financially supported by the National Major Program of Water Pollution Control and Treatment Technology of China under Grant No. 2014ZX07201-011-002. We thank the editor and the anonymous reviewers for their helpful comments. We thank Zhidan Wen from the Northeast Institute of Geography and Agroecology, China Academic Science, for statistical assistance.

Author Contributions

All authors contributed significantly to this manuscript. Jiquan Zhang was responsible for the original idea and the theoretical aspects of the paper. Sijia Li and Guangyi Mu were responsible for the data collection and preprocessing, Hanyu Ju and Rui Wang were responsible for the methodology design, and Danjun Li drafted the manuscript and all authors read and revised the final manuscript.

Conflicts of Interest

The authors declare no conflict of interest.

References

  1. Coble, P.G. Characterization of marine and terrestrial DOM in seawater using excitation-emission matrix spectroscopy. Mar. Chem. 1996, 51, 325–346. [Google Scholar] [CrossRef]
  2. Gao, J.; Yang, H.; Li, B. Investigating the Roles of Dissolved Organic Matter on Arsenic Mobilization and Speciation in Environmental Water. CLEAN Soil Air Water 2016, 44, 818–828. [Google Scholar] [CrossRef]
  3. Hosen, J.D.; McDonough, O.T.; Febria, C.M.; Palmer, M.A. Dissolved organic matter quality and bioavailability changes across an urbanization gradient in headwater streams. Environ. Sci. Technol. 2014, 48, 7817–7824. [Google Scholar] [CrossRef] [PubMed]
  4. Heinz, M.; Graeber, D.; Zak, D.; Zwirnmann, E.; Gelbrecht, J.; Pusch, M.T. Comparison of organic matter composition in agricultural versus forest affected headwaters with special emphasis on organic nitrogen. Environ. Sci. Technol. 2015, 49, 2081–2090. [Google Scholar] [CrossRef] [PubMed]
  5. Wetzel, R.G. Limnology: Lake and River Ecosystems; Academic Press: Cambridge, MA, USA, 2001. [Google Scholar]
  6. D’Sa, E.J.; Miller, R.L.; Del Castillo, C. Bio-optical properties and ocean color algorithms for coastal waters influenced by the Mississippi River during a cold front. Appl. Opt. 2006, 45, 7410–7428. [Google Scholar] [CrossRef] [PubMed]
  7. D’Sa, E.J.; Goes, J.I.; Gomes, H.; Mouw, C. Absorption and fluorescence properties of chromophoric dissolved organic matter of the eastern Bering Sea in the summer with special reference to the influence of a cold pool. Biogeosciences 2014, 11, 3225–3244. [Google Scholar] [CrossRef]
  8. Liang, Y.; Xiao, X.; Du, E.; Song, C.; Song, C.; Zhao, Y.; Liu, X. Chromophoric Dissolved Organic Matter Fluctuation Assessment in an Urban River. CLEAN Soil Air Water 2014, 43, 1128–1135. [Google Scholar] [CrossRef]
  9. Coble, P.G. Marine optical biogeochemistry: The chemistry of ocean color. Chem. Rev. 2007, 107, 402–418. [Google Scholar] [CrossRef] [PubMed]
  10. Moran, M.A.; Zepp, R.G. Invited Review Role of photoreactions in the formation of biologically labile compounds from dissolved organic matter. Oceanography 1997, 42, 523–524. [Google Scholar]
  11. Mopper, K.; Zhou, X.; Kieber, R.J.; Kieber, D.J.; Sikorski, R.J.; Jones, R.D. Photochemical degradation of dissolved organic carbon and its impact on the oceanic carbon cycle. Nature 1991, 353, 60–62. [Google Scholar] [CrossRef]
  12. Lapierre, J.F.; Giorgio, P.A. Geographical and environmental drivers of regional differences in the lake pCO2 versus DOC relationship across northern landscapes. J. Geophys. Res. Biogeosci. 2012, 117, 6841–6847. [Google Scholar] [CrossRef]
  13. Köhler, S.J.; Kothawala, D.; Futter, M.N.; Liungman, O.; Tranvik, L. In-lake processes offset increased terrestrial inputs of dissolved organic carbon and color to lakes. PLoS ONE 2013, 8. [Google Scholar] [CrossRef] [PubMed]
  14. Baker, A.; Bolton, L.; Newson, M.; Spencer, R.G. Spectrophotometric properties of surface water dissolved organic matter in an afforested upland peat catchment. Hydrol. Process. 2008, 22, 2325–2336. [Google Scholar] [CrossRef]
  15. Stedmon, C.A.; Thomas, D.N.; Papadimitriou, S.; Granskog, M.A.; Dieckmann, G.S. Using fluorescence to characterize dissolved organic matter in Antarctic sea ice brines. J. Geophys. Res. Biogeosci. 2011, 116, 752–767. [Google Scholar] [CrossRef]
  16. Siegel, D.A.; Maritorena, S.; Nelson, N.B.; Hansell, D.A.; Lorenzi-Kayser, M. Global distribution and dynamics of colored dissolved and detrital organic materials. J. Geophys. Res. Oceans 2002, 107. [Google Scholar] [CrossRef]
  17. Song, K.S.; Zang, S.Y.; Zhao, Y.; Li, L.; Du, J.; Zhang, N.N.; Liu, L. Spatiotemporal characterization of dissolved carbon for inland waters in semi-humid/semi-arid region, China. Hydrol. Earth Syst. Sci. 2013, 17, 4269–4281. [Google Scholar] [CrossRef]
  18. Zhu, W.; Yu, Q.; Tian, Y.Q.; Becker, B.L.; Zheng, T.; Carrick, H.J. An assessment of remote sensing algorithms for colored dissolved organic matter in complex freshwater environments. Remote Sens. Environ. 2014, 140, 766–778. [Google Scholar] [CrossRef]
  19. Griffin, C.G.; Frey, K.E.; Rogan, J.; Holmes, R.M. Spatial and inter-annual variability of dissolved organic matter in the Kolyma River, East Siberia, observed using satellite imagery. J. Geophys. Res. Biogeosci. 2011, 116, 165–176. [Google Scholar] [CrossRef]
  20. Bieroza, M.; Baker, A.; Bridgeman, J. Relating freshwater organic matter fluorescence to organic carbon removal efficiency in drinking water treatment. Sci. Total Environ. 2009, 407, 1765–1774. [Google Scholar] [CrossRef] [PubMed]
  21. Raymond, P.A.; McClelland, J.W.; Holmes, R.M.; Zhulidov, A.V.; Mull, K.; Peterson, B.J.; Striegl, R.G.; Aiken, G.R.; Gurtovaya, T.Y. Flux and age of dissolved organic carbon exported to the Arctic Ocean: A carbon isotopic study of the five largest arctic rivers. Glob. Biogeochem. Cycles 2007, 21, 89. [Google Scholar] [CrossRef]
  22. Holmes, R.M.; Bromiley, P.; Devers, C.E.; Holcomb, T.R.; McGuire, J.B. Management theory applications of prospect theory: Accomplishments, challenges, and opportunities. J. Manag. 2011, 37, 1069–1107. [Google Scholar] [CrossRef]
  23. Holmes, R.M.; McClelland, J.W.; Peterson, B.J.; Tank, S.E.; Bulygina, E.; Eglinton, T.I.; Gordeev, V.V.; Gurtovaya, T.Y.; Raymond, P.A.; Repeta, D.J.; et al. Seasonal and annual fluxes of nutrients and organic matter from large rivers to the Arctic Ocean and surrounding seas. Estuaries Coasts 2012, 35, 369–382. [Google Scholar] [CrossRef]
  24. Spencer, R.G.; Hernes, P.J.; Ruf, R.; Baker, A.; Dyda, R.Y.; Stubbins, A.; Six, J. Temporal controls on dissolved organic matter and lignin biogeochemistry in a pristine tropical river, Democratic Republic of Congo. J. Geophys. Res. Biogeosci. 2010, 115. [Google Scholar] [CrossRef]
  25. Toming, K.; Kutser, T.; Tuvikene, L.; Viik, M.; Nõges, T. Dissolved organic carbon and its potential predictors in eutrophic lakes. Water Res. 2016, 102, 32–40. [Google Scholar] [CrossRef] [PubMed]
  26. Hestir, E.L.; Brando, V.; Campbell, G.; Dekker, A.; Malthus, T. The relationship between dissolved organic matter absorption and dissolved organic carbon in reservoirs along a temperate to tropical gradient. Remote Sens. Environ. 2015, 156, 395–402. [Google Scholar] [CrossRef]
  27. Stedmon, C.A.; Markager, S. Resolving the variability in dissolved organic matter fluorescence in a temperate estuary and its catchment using PARAFAC analysis. Limnol. Oceanogr. 2005, 50, 686–697. [Google Scholar] [CrossRef]
  28. Zhang, Y.; Zhang, E.; Yin, Y.; Van Dijk, M.A.; Feng, L.; Shi, Z.; Qin, B. Characteristics and sources of chromophoric dissolved organic matter in lakes of the Yungui Plateau, China, differing in trophic state and altitude. Limnol. Oceanogr. 2010, 55, 2645–2659. [Google Scholar] [CrossRef]
  29. D’Sa, E.J.; DiMarco, S.F. Seasonal variability and controls on chromophoric dissolved organic matter in a large river-dominated coastal margin. Limnol. Oceanogr. 2009, 54, 2233–2242. [Google Scholar] [CrossRef]
  30. Curtis, P.J.; Adams, H.E. Dissolved organic matter quantity and quality from freshwater and saltwater lakes in east-central Alberta. Biogeochemistry 1995, 30, 59–76. [Google Scholar] [CrossRef]
  31. Kowalczuk, P.; Cooper, W.J.; Durako, M.J.; Kahn, A.E.; Gonsior, M.; Young, H. Characterization of dissolved organic matter fluorescence in the South Atlantic Bight with use of PARAFAC model: Relationships between fluorescence and its components, absorption coefficients and organic carbon concentrations. Mar. Chem. 2010, 118, 22–36. [Google Scholar] [CrossRef]
  32. Zhou, Y.; Jeppesen, E.; Zhang, Y.; Shi, K.; Liu, X.; Zhu, G. Dissolved organic matter fluorescence at wavelength 275/342 nm as a key indicator for detection of point-source contamination in a large Chinese drinking water lake. Chemosphere 2016, 144, 503–509. [Google Scholar] [CrossRef] [PubMed]
  33. Shao, T.; Song, K.; Du, J.; Zhao, Y.; Ding, Z.; Guan, Y.; Zhang, B. Seasonal Variations of CDOM Optical Properties in Rivers Across the Liaohe Delta. Wetlands 2015, 36, 181–192. [Google Scholar] [CrossRef]
  34. Wen, Z.D.; Song, K.S.; Zhao, Y.; Du, J.; Ma, J.H. Influence of environmental factors on spectral characteristic of chromophoric dissolved organic matter (CDOM) in Inner Mongolia Plateau, China. Hydrol. Earth Syst. Sci. 2016, 20, 787–801. [Google Scholar] [CrossRef]
  35. Spencer, R.G.; Butler, K.D.; Aiken, G.R. Dissolved organic carbon and chromophoric dissolved organic matter properties of rivers in the USA. J. Geophys. Res. Biogeosci. 2012, 117, 34–47. [Google Scholar] [CrossRef]
  36. Jiao, K.W.; Li, F.X.; Zhou, Q.X. Spatial distribution and pollution level evaluation of nutrients in the Songhua River Basin. J. Agro-Environ. Sci. 2015, 34, 769–775. [Google Scholar]
  37. Williamson, C.E.; Brentrup, J.A.; Zhang, J.; Renwick, W.H.; Hargreaves, B.R.; Knoll, L.B.; Overholt, E.P.; Rose, K.C. Lakes as sensors in the landscape: Optical metrics as scalable sentinel responses to climate change. Limnol. Oceanogr. 2014, 59, 840–850. [Google Scholar] [CrossRef]
  38. Bricaud, A.; Morel, A.; Prieur, L. Absorption by dissolved organic matter of the sea (yellow substance) in the UV and visible domains. Limnol. Oceanogr. 1981, 26, 43–53. [Google Scholar] [CrossRef]
  39. Song, K.; Li, L.; Wang, Z.; Liu, D.; Zhang, B.; Xu, J.; Wang, Y. Retrieval of total suspended matter (TSM) and chlorophyll-a (Chl-a) concentration from remote-sensing data for drinking water resources. Environ. Monit. Assess. 2012, 184, 1449–1470. [Google Scholar] [CrossRef] [PubMed]
  40. Smith, R.C.; Baker, K.S. Optical properties of the clearest natural waters (200–800 nm). Appl. Opt. 1981, 20, 177–184. [Google Scholar] [CrossRef] [PubMed]
  41. Carder, K.L.; Steward, R.G.; Harvey, G.R.; Ortner, P.B. Marine humic and fulvic acids: Their effects on remote sensing of ocean chlorophyll. Limnol. Oceanogr. 1989, 34, 68–81. [Google Scholar] [CrossRef]
  42. Helms, J.R.; Stubbins, A.; Ritchie, J.D.; Minor, E.C.; Kieber, D.J.; Mopper, K. Absorption spectral slopes and slope ratios as indicators of molecular weight, source, and photobleaching of chromophoric dissolved organic matter. Limnol. Oceanogr. 2008, 53, 955–969. [Google Scholar] [CrossRef]
  43. Kowalczuk, P.; Cooper, W.J.; Whitehead, R.F.; Durako, M.J.; Sheldon, W. Characterization of CDOM in an organic-rich river and surrounding coastal ocean in the South Atlantic Bight. Aquat. Sci. 2003, 65, 384–401. [Google Scholar] [CrossRef]
  44. Singh, S.; D’Sa, E.J.; Swenson, E.M. Chromophoric dissolved organic matter (CDOM) variability in Barataria Basin using excitation-emission matrix (EEM) fluorescence and parallel factor analysis (PARAFAC). Sci. Total Environ. 2010, 408, 3211–3222. [Google Scholar] [CrossRef] [PubMed]
  45. Weishaar, J.L.; Aiken, G.R.; Bergamaschi, B.A.; Fram, M.S.; Fujii, R.; Mopper, K. Evaluation of specific ultraviolet absorbance as an indicator of the chemical composition and reactivity of dissolved organic carbon. Environ. Sci. Technol. 2003, 37, 4702–4708. [Google Scholar] [CrossRef] [PubMed]
  46. Cory, R.M.; McKnight, D.M.; Chin, Y.P.; Miller, P.; Jaros, C.L. Chemical characteristics of fulvic acids from Arctic surface waters: Microbial contributions and photochemical transformations. J. Geophys. Res. Biogeosci. 2007, 112, 315–331. [Google Scholar] [CrossRef]
  47. Peuravuori, J.; Pihlaja, K. Molecular size distribution and spectroscopic properties of aquatic humic substances. Anal. Chim. Acta 1997, 337, 133–149. [Google Scholar] [CrossRef]
  48. Zhang, Y.; Qin, B.; Zhu, G.; Zhang, L.; Yang, L. Chromophoric dissolved organic matter (CDOM) absorption characteristics in relation to fluorescence in Lake Taihu, China, a large shallow subtropical lake. Hydrobiologia 2007, 581, 43–52. [Google Scholar] [CrossRef]
  49. Yu, H.; Qu, F.; Sun, L.; Liang, H.; Han, Z.; Chang, H.; Shao, S.; Li, G. Relationship between soluble microbial products (SMP) and effluent organic matter (EfOM): Characterized by fluorescence excitation emission matrix coupled with parallel factor analysis. Chemosphere 2015, 121, 101–109. [Google Scholar] [CrossRef] [PubMed]
  50. Cole, J.J.; Prairie, Y.T.; Caraco, N.F.; McDowell, W.H.; Tranvik, L.J.; Striegl, R.G.; Melack, J. Plumbing the global carbon cycle: Integrating inland waters into the terrestrial carbon budget. Ecosystems 2007, 10, 172–185. [Google Scholar] [CrossRef]
  51. Jiang, R.; Hatano, R.; Zhao, Y.; Kuramochi, K.; Hayakawa, A.; Woli, K.P.; Shimizu, M. Factors controlling nitrogen and dissolved organic carbon exports across timescales in two watersheds with different land uses. Hydrol. Process. 2014, 28, 5105–5121. [Google Scholar] [CrossRef]
  52. Baker, A.; Lamont-BIack, J. Fluorescence of dissolved organic matter as a natural tracer of ground water. Ground Water 2001, 39, 745–750. [Google Scholar] [CrossRef] [PubMed]
  53. Asmala, E.; Autio, R.; Kaartokallio, H.; Pitkänen, L.; Stedmon, C.; Thomas, D.N. Bioavailability of riverine dissolved organic matter in three Baltic Sea estuaries and the effect of catchment land use. Biogeosciences 2013, 10, 6969–6986. [Google Scholar] [CrossRef] [Green Version]
  54. Fichot, C.G.; Benner, R. The spectral slope coefficient of chromophoric dissolved organic matter (S275–295) as a tracer of terrigenous dissolved organic carbon in river-influenced ocean margins. Limnol. Oceanogr. 2012, 57, 1453–1466. [Google Scholar] [CrossRef]
  55. Del Castillo, C.E.; Gilbes, F.; Coble, P.G.; Müller-Karger, F.E. On the dispersal of riverine colored dissolved organic matter over the West Florida Shelf. Limnol. Oceanogr. 2000, 45, 1425–1432. [Google Scholar] [CrossRef]
  56. Gonnelli, M.; Vestri, S.; Santinelli, C. Chromophoric dissolved organic matter and microbial enzymatic activity. A biophysical approach to understand the marine carbon cycle. Biophys. Chem. 2013, 182, 79–85. [Google Scholar] [CrossRef] [PubMed]
  57. Chen, Z.; Li, Y.; Pan, J. Distributions of colored dissolved organic matter and dissolved organic carbon in the Pearl River Estuary, China. Cont. Shelf Res. 2004, 24, 1845–1856. [Google Scholar] [CrossRef]
  58. Brezonik, P.L.; Olmanson, L.G.; Finlay, J.C.; Bauer, M.E. Factors affecting the measurement of CDOM by remote sensing of optically complex inland waters. Remote Sens. Environ. 2015, 157, 199–215. [Google Scholar] [CrossRef]
  59. Prieur, L.; Sathyendranath, S. An optical classification of coastal and oceanic waters based on the specific spectral absorption curves of phytoplankton pigments, dissolved organic matter, and other particulate materials. Limnol. Oceanogr. 1981, 26, 671–689. [Google Scholar] [CrossRef]
  60. Organelli, E.; Bricaud, A.; Antoine, D.; Matsuoka, A. Seasonal dynamics of light absorption by chromophoric dissolved organic matter (CDOM) in the NW Mediterranean Sea (BOUSSOLE site). Deep Sea Res. I Oceanogr. Res. Pap. 2014, 91, 72–85. [Google Scholar] [CrossRef]
  61. Müller, R.A.; Futter, M.N.; Sobek, S.; Nisell, J.; Bishop, K.; Weyhenmeyer, G.A. Water renewal along the aquatic continuum offsets cumulative retention by lakes: Implications for the character of organic carbon in boreal lakes. Aquat. Sci. 2013, 75, 535–545. [Google Scholar] [CrossRef]
  62. Borisover, M.; Bukhanovsky, N.; Lapides, I.; Yariv, S. Thermal treatment of organoclays: Effect on the aqueous sorption of nitrobenzene on n-hexadecyltrimethyl ammonium montmorillonite. Appl. Surf. Sci. 2010, 256, 5539–5544. [Google Scholar] [CrossRef]
  63. Stanley, E.H.; Powers, S.M.; Lottig, N.R.; Buffam, I.; Crawford, J.T. Contemporary changes in dissolved organic carbon (DOC) in human-dominated rivers: Is there a role for DOC management? Freshw. Biol. 2012, 57, 26–42. [Google Scholar] [CrossRef]
  64. Shon, H.K.; Vigneswaran, S.; Kim, I.S.; Cho, J.; Ngo, H.H. Fouling of ultrafiltration membrane by effluent organic matter: A detailed characterization using different organic fractions in wastewater. J. Membr. Sci. 2008, 278, 232–238. [Google Scholar] [CrossRef]
  65. Joshi, I.; D’Sa, E.J. Seasonal Variation of Colored Dissolved Organic Matter in Barataria Bay, Louisiana, Using Combined Landsat and Field Data. Remote Sens. 2015, 7, 12478–12502. [Google Scholar] [CrossRef]
Figure 1. Location and sampling locations of study area, including Yitong River (YT, five sampling locations), Yinma River (YM, 11 sampling locations) and 16# in the confluence of the Yinma and Yitong Rivers. The spatial distribution of sampling locations and CDOM-related parameters were determined with ArcGIS 10.1.
Water 08 00399 g001
Figure 2. Box plots of dissolved carbon, total suspended matter and chlorophyll-a in the watershed, Yitong River, Yinma River and STKM Reservoir: (a) Chlorophyll-a concentration (μg/L) (F = 0.015, p > 0.05); (b) DOC concentration (mg/L) (F = 6.4, p < 0.05); (c) Total suspended matter (mg/L) (F = 5.4, p < 0.05); (d) Inorganic suspended matter (mg/L) (F = 5.5, p < 0.05); and (e) Organic suspended matter (F = 3.7, p > 0.05). The horizontal edges of the boxes denote the 25th and 75th percentiles; the whiskers denote the 10th and 90th percentiles, and the blue circles represent outliers.
Water 08 00399 g002
Figure 3. Regression correlation of NH3-N, TN and DOC for the riverine waters: (a) DOC and NH3-N in summer and autumn; (b) DOC and TN in autumn.
Water 08 00399 g003
Figure 4. The histogram of DOC, Chl-a, TSM, ISM and OSM concentrations in different sampling locations: (a) Chl-a; (b) DOC; (c) TSM; (d) ISM; and (e) OSM. The red dash dot lines represent the average values in all the sampling locations.
Water 08 00399 g004
Figure 5. Absorption characteristics of sampling locations from the Yinma watershed: (a) absorption spectrums of CDOM (aCDOM) in summer; (b) absorption spectrums of CDOM (aCDOM) in autumn; and (c) average absorption spectrums of CDOM (aCDOM). The red line marks at 335, 375 and 440 nm.
Water 08 00399 g005
Figure 6. The histogram of aCDOM(335), aCDOM(375), aCDOM(440), SUV254, E250:365 and S275–295 in different sampling locations: (a) aCDOM(335); (b) aCDOM(375); (c) aCDOM(440); (d) SUVA254; (e) E250:365; (f) S275–295. Units of the absorption coefficients of CDOM are m−1, and the unit of SUVA254 is L·mg·C−1·m−1.
Water 08 00399 g006
Figure 7. Relative contributions of CDOM, phytoplankton and non-algal particles to total non-water light absorption at 440 nm. According to the optical classification of surface waters (Prieur and Sathyendranath, 1981), the relative contribution of collected water sampling locations could be classified as “CDOM-type”, “non-algal particles type (NAP-type)" and “phytoplankton-type (Phy-type)” due to the variation of water quality parameters.
Water 08 00399 g007
Figure 8. Correlations between aCDOM(λ) and DOC: (a) in summer; and (b) in autumn.
Water 08 00399 g008
Figure 9. RDA of CDOM absorption and environmental factors: (a) in summer; and (b) in autumn.
Water 08 00399 g009
Table 1. Water quality classification based on comprehensive pollution index.
PLevel
P < 0.8Qualification
0.8 ≤ P ≤ 1.0Basic qualification
1.0 < P ≤ 2Contamination
P ≥ 2Serious contamination
Table 2. The concentration of water quality parameters and comprehensive indexes for riverine waters.
AveragepHDO (mg/L)NH3-N (mg/L)COD (mg/L)Fe (mg/L)Mn (mg/L)Zn (mg/L)Hg (mg/L)Cr6+ (mg/L)p
Standards6–922.0400.30.12.00.0010.1-
Summer6.792.930.07392.160.620.280.060.340.0128.11
Autumn6.089.470.1549.372.830.540.1300.0029.03
Note: Standard p was determine by the pH.
Table 3. CDOM absorption parameters of water sampling locations collected in the watershed.
SummerAutumn
Avg ± SD.Min–MaxAvg ± SD.Min–Max
aCDOM(335)5.5 ± 3.50.3–10.65.4 ± 3.50.3–12.3
aCDOM(375)2.3 ± 1.80–5.22.6 ± 2.00–6.9
aCDOM(440)0.6 ± 0.60–1.70.8 ± 0.90–3.1
SUVA2544.0 ± 1.41.6–6.32.3 ± 0.80.6–3.5
E250:36511.7 ± 11.50–38.76.4 ± 2.80–10.1
S275–2950.0089 ± 0.00200.0069–0.01470.0082 ± 0.00160.0066–0.0123
Notes: Units of the absorption coefficients of CDOM are m−1, S275–295 is nm−1 and the unit SUVA254 is L·mg·C−1·m−1.

