Article

Comparative Analysis of Water Quality between the Runoff Entrance and Middle of Recycling Irrigation Reservoirs

1
Hampton Roads Agricultural Research and Extension Center, Virginia Polytechnic Institute and State University, 1444 Diamond Springs Roads, Virginia Beach, VA 23455, USA
2
Department of Plant Science and Landscape Architecture, University of Maryland, College Park, MD 20742, USA
3
Wye Research and Education Center, University of Maryland Extension, Queenstown, MD 21658, USA
4
United States Department of Agriculture, Agricultural Research Service, Thad Cochran Southern Horticultural Laboratory, Poplarville, MS 39470, USA
5
Department of Plant Pathology, The Pennsylvania State University, University Park, PA 16802, USA
*
Author to whom correspondence should be addressed.
Water 2015, 7(7), 3861-3877; https://doi.org/10.3390/w7073861
Submission received: 12 May 2015 / Revised: 1 July 2015 / Accepted: 6 July 2015 / Published: 14 July 2015

Abstract

:
Recycling irrigation reservoirs (RIRs) are an emerging aquatic ecosystem of critical importance, for conserving and protecting increasingly scarce water resources. Here, we compare water quality between runoff entrance and middle of four RIRs in nurseries in Virginia (VA) and Maryland (MD). Surface water temperature (T) and oxidation-reduction potential (ORP) were lower in the middle than at the entrance, while the trend was opposite for dissolved oxygen (DO), pH and chlorophyll a (Chla). The magnitude of these differences between the entrance and middle decreased with increasing depth. These differences were magnified by water stratification from April to October. Minimum differences were observed for electrical conductivity (EC), total dissolved solids (TDS) and turbidity (TUR). Cluster analyses were performed on water quality difference data to evaluate whether the differences vary with respect to reservoirs. Two clusters were formed with one consisting primarily of VA reservoirs, and the other consisting mostly of MD reservoirs in both years. Water quality in the middle and at the entrance of RIRs was expected to vary greatly because of runoff inflow. The two-point water quality differences observed here, although statistically significant, are not large enough to cause significant impact on crop health and productivity for most water quality parameters except pH. Additional analysis of outlet data shows that the range and magnitude of water quality difference between the middle and the outlet are comparable to those between the middle and entrance of RIRs. These results indicate that monitoring at a single point is sufficient to obtain reliable water quality estimates for most water quality parameters in RIRs except pH. This is important when considering the cost of labor and equipment necessary for documenting water quality in agricultural production systems. However, additional pH measurements are still necessary to make practical water quality management decisions.

1. Introduction

Recycling irrigation reservoirs (RIRs) have been adopted in production nurseries to conserve increasingly scarce and costly fresh water resources. Such practices help ensure the availability of water for plants during periods of limited rainfall or at critical times during plant development. The quality of the recycled irrigation water is a significant issue for this conservation practice, as it could impact pathogen survival, water treatment efficacy and other agricultural practices.
A number of recycled irrigation water quality parameters must be considered because of their impacts on plant quality and productivity. Increased electrical conductivity (EC) decreases the growth of Ranunculus asiaticus [1] and other crop plants, such as beans, onion, corn and potato [2]. Water pH affects nutrient solubility and availability to container grown plants. For example, the solubility of phosphorus, iron, manganese, zinc, and boron decreases dramatically with increasing pH from 5.0 to 7.0 and becomes very limited in alkaline water [3]. Phosphorous becomes less available to the plants when pH is above 7.2 [3]. Water temperature (T) [4,5,6,7,8,9], pH [10], dissolved oxygen (DO) [11], EC [12] and oxidation-reduction potential (ORP) [13] also affect the survival and growth of plant pathogens in the same reservoirs.
In light of the importance of water quality to crop health and productivity, it is desirable to monitor water quality parameters, and define trends in RIRs. Such information is important to decision-making on water treatment such as acidification, aeration to bring individual parameter to ranges suitable for crop health and production. Water quality monitoring programs have been carried out in natural lakes, reservoirs and rivers to document the spatial and temporal variations in the hydrochemistry of surface waters [14,15,16]. The surface water quality can change daily, monthly, seasonally, or annually resulting from agricultural activities, land use types and rain events [17,18] as well as due to biogeochemical processes, atmospheric deposition, and hydrological changes. Researchers have evaluated freshwater quality spatial variation using multivariate techniques including cluster analysis (CA), principal component analysis (PCA), and discriminant analysis (DA) [16,19,20].
Water quality in RIRs and its spatial variation has not yet been extensively studied. Hong et al. [21] conducted continuous water quality monitoring in RIRs in the Mid-Atlantic region of the U.S. since 2006, documenting water quality fluctuation in RIRs. However, the continuous data was collected at a single point and depth in each RIR. Zhang et al. [22] reported that RIR water quality varies vertically in the water column due to thermal stratification. Whether and how water quality in RIRs may vary between points within the same reservoirs is unknown.
The goals of this study are: (1) to determine water quality variation with respect to spatially separated sampling points in RIRs and determine whether the variation is significant; (2) to document the pattern of spatial variation of water quality across different seasons and nurseries; and (3) evaluate the potential impact of the variations on water quality monitoring in RIRs.

2. Materials and Methods

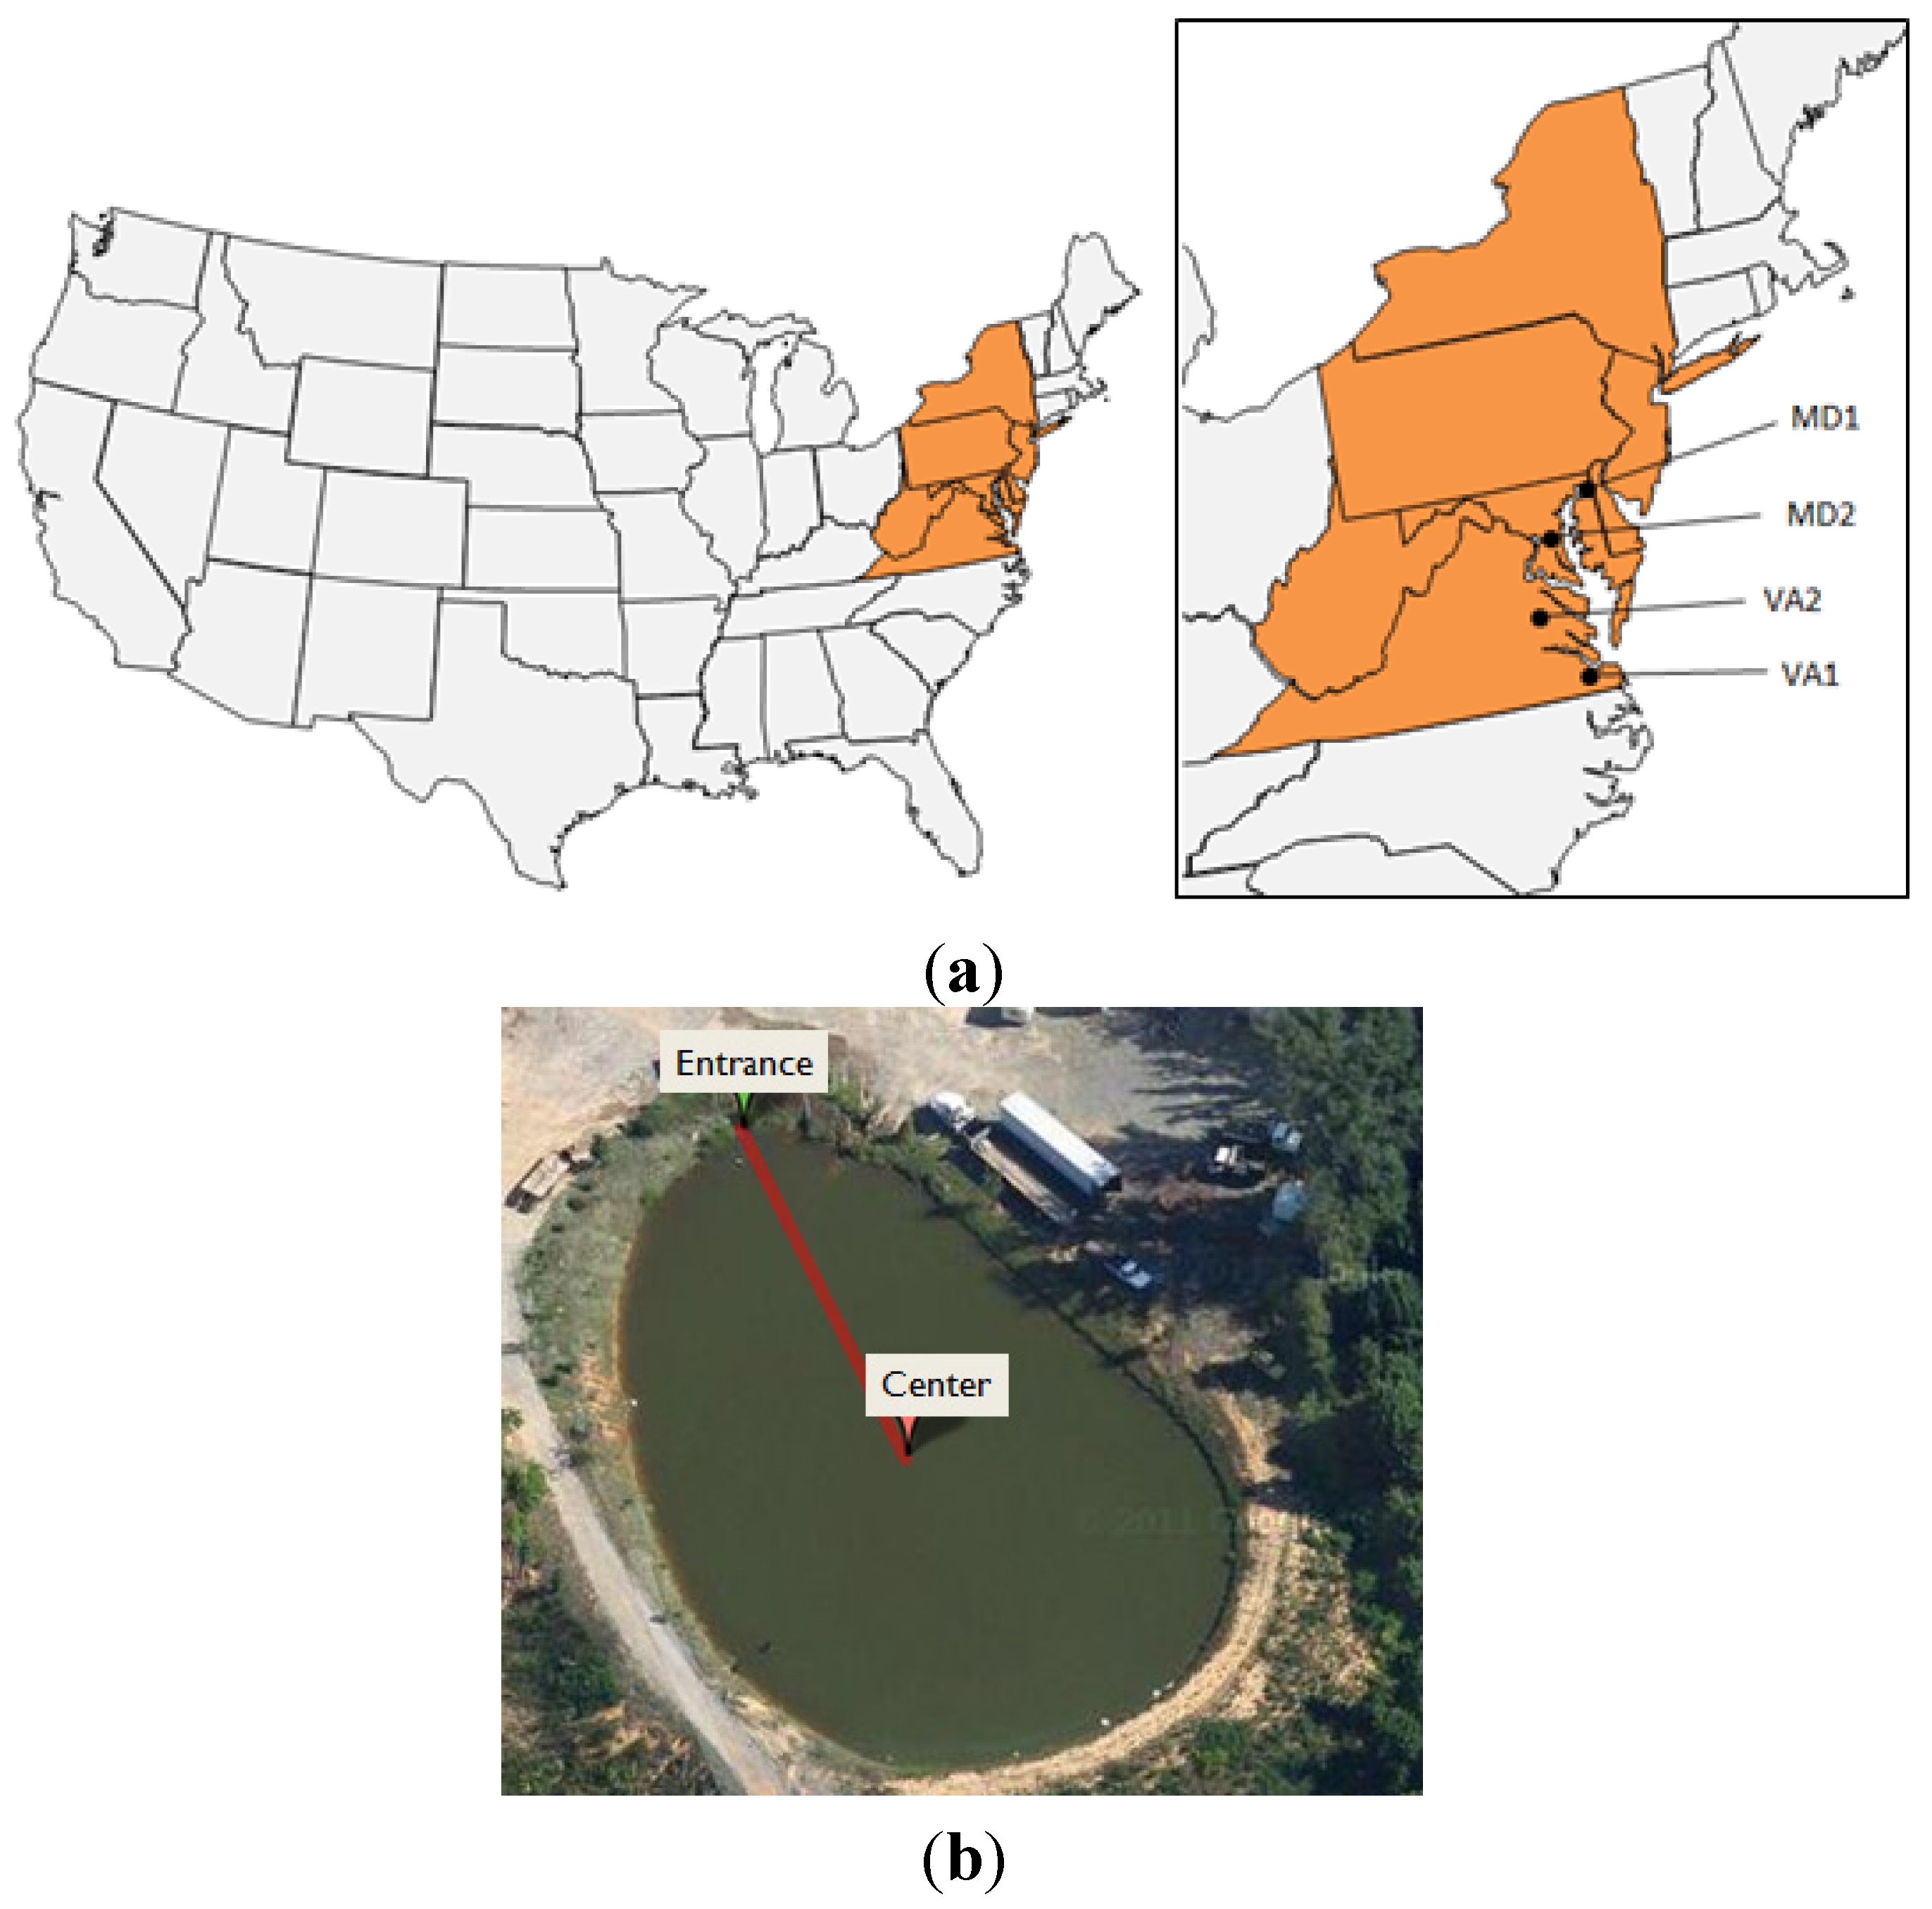
2.1. Site Description

Four plant container-production nurseries, VA1 and VA2 in Virginia and MD1 and MD2 in Maryland were included in this study (Figure 1). One reservoir was selected from each nursery and the major characteristics of these four reservoirs are summarized in Table 1. All four reservoirs receive runoff from the production areas and the stored water is used for irrigation except VA21.
Reservoir VA21 is described in detail as an example. Located in Nursery VA2, Reservoir VA21 is elliptical and has a surface area of approximately 8100 m2 and an average depth of 3.78 m in the middle. VA21 receives stormwater and irrigation runoff from the nursery production area and the water overflows into the next reservoir when VA21 reaches 90% to 95% capacity. Mature trees and natural shrubbery surround the earthen-walled reservoir.
Table 1. Characteristics of recycling irrigation reservoirs studied.
NurseryLocationReservoirSurface Area, m2Average Depth *, mDistance between the Middle and the Entrance, m
VA1Eastern VA (36°46′03.2″ N, 76°38′21.3″ W)VA1281002.2851
VA2Central VA (37°46′52.3″ N, 77°27′28.9″ W)VA2181003.7842
MD1Northern MD (39°29′28.9″ N, 75°47′18.0″ W)MD1117,0001.8070
MD2Central MD (38°57′05.4″ N, 76°39′04.1″ W)MD2161002.3676
Note: * Depth was measured at the middle of each reservoir.
Figure 1. (a) Location of all four nurseries studied in Mid-Atlantic region in USA and (b) layout of reservoir VA21 at Nursery VA2.
Water 07 03861 g001

2.2. Data Collection

To investigate water quality variation in different locations in RIRs, monthly measurements were recorded from August 2011 to October 2014 at two sampling points within each reservoir: the entrance and middle of the reservoir. At each sampling point, nine water quality parameters were measured in triplicate, vertically at every 0.50 m interval from the surface to 1.50 m below, using a Water Quality Multiprobe (YSI Inc., Yellow Springs, OH, USA). Those parameters include T, pH, dissolved oxygen (DO), chlorophyll a (Chla), oxidation reduction potential (ORP), EC, salinity, total dissolved solids (TDS) and turbidity (TUR). The YSI multiprobe was cleaned (probe surfaces washed with soap and water) and recalibrated before taking each measurement. All the field measurements were done generally at the same time of the day. In order to observe water quality variation from the middle to the outlet of RIRs, additional water quality data were collected at the outlet of reservoir VA12 in 2014. Meteorological data including air temperature, photosynthetically-active radiation (PAR), precipitation, wind speed and direction were recorded every five minutes via onsite weather stations.

2.3. Data Analysis

2.3.1. Water Quality Range in RIRs

The mean and standard deviation of the nine water quality parameters at each location were summarized at all depths to illustrate the ranges of water quality parameters in RIRs during 2011 to 2014.

2.3.2. Water Quality Difference and Analysis of Variance (ANOVA)

Water quality differences (WQ.Diff) between the middle and the entrance for each RIR were calculated at depths of 0.2 m (approximately 20 cm below the water surface), then 0.5 m, 1.0 m and 1.5 m below for each sampling date following Equation (1):
WQ.Diff = WQCenter − WQEntrance
Boxplots were created on WQ.Diff at different depths and nurseries to show the pattern of spatial variation within each RIR. An one-way ANOVA was conducted in R (version 2.15.2) to determine if the WQ.Diff at each depth were statistically significant (p < 0.05) for each nursery on each sampling date. The percentage of observations (dates) with statistically significant WQ.Diff was then summarized. The same procedures were used to evaluate the differences between entrance, middle and outlet of reservoir VA12.
To further reveal seasonal variation of water quality difference between the middle and the entrance in RIRs, WQ.Diff data were plotted against time in scatterplots. The significance of correlation were determined between water quality differences and environmental variables including air temperature, daily light integral (DLI), wind speed and precipitation to determine if water quality differences vary significantly with respect to seasons. DLI is the total amount of PAR received each day and calculated by integrating PAR.

2.3.3. Cluster Analysis

Cluster analysis was performed to identify groups of RIRs according to their water quality differences data. WQ.Diff data from each RIR were standardized through scale function (this function centers and scales the column of numeric matrix) in R (version 2.15.2) to avoid misclassification due to wide differences in data dimensionality. Cluster analysis was then applied to the standardized WQ.Diff data to classify the reservoirs into clusters based on their similarity, resulting in spatial dendrograms. Cluster analysis was performed separately on yearly data in 2012 and 2013. The variables included in cluster analysis are T, pH, DO, Chla, ORP, EC and TUR. Salinity and TDS are highly correlated with EC, and therefore were not included in cluster analysis.

3. Results

3.1. Water Quality Ranges in RIRs

Over the three-year study period, no dramatic differences in water quality ranges were observed between the middle and the entrance in RIRs, even though some water quality parameters exhibited various degrees of differences with distance (42 to 76 m between the middle and entrance in these four RIRs). The range for all nine water quality parameters at all depths in RIRs is summarized in Table 2.
Table 2. The range of water quality parameters measured at two sampling points and at all depths in four RIRs during the 2011 to 2014 sampling period.
ReservoirsSampling PointsDepthsT °CDO mg/LpHChla µg/LORP mvEC dS/mSalinity pptTDS g/LTurbidity NTU
VA12EntranceSurface19.4 ± 9.010.8 ± 2.67.4 ± 1.153.3 ± 46.9307.5 ± 84.20.19 ± 0.080.09 ± 0.040.12 ± 0.0548.5 ± 160.5
0.5 m18.1 ± 8.310.8 ± 2.97.2 ± 1.257.9 ± 52.7326.8 ± 87.10.18 ± 0.080.09 ± 0.040.12 ± 0.0541.4 ± 143.2
1.0 m14.9 ± 7.411.5 ± 2.17.6 ± 0.982.7 ± 77.9298.9 ± 64.70.15 ± 0.060.07 ± 0.030.10 ± 0.04124.4 ± 309.4
1.5 m10.6 ± 2.111.6 ± 1.57.2 ± 0.690.1 ± 96.9283.7 ± 65.20.12 ± 0.040.05 ± 0.020.08 ± 0.02308.2 ± 467.2
MiddleSurface19.4 ± 8.710.9 ± 2.27.7 ± 0.961.3 ± 57.2302.6 ± 53.80.18 ± 0.080.09 ± 0.040.12 ± 0.0546.1 ± 162.1
0.5 m18.2 ± 8.210.7 ± 2.77.5 ± 1.159.4 ± 45.0318.0 ± 66.90.18 ± 0.080.09 ± 0.040.12 ± 0.0552.2 ± 192.2
1.0 m15.1 ± 7.412.0 ± 2.18.0 ± 1.189.2 ± 86.1293.8 ± 67.00.15 ± 0.060.07 ± 0.030.10 ± 0.0485.4 ± 261.1
1.5 m10.3 ± 2.111.9 ± 1.27.5 ± 0.5118.0 ± 128.3318.0 ± 21.20.11 ± 0.040.05 ± 0.020.07 ± 0.02209.4 ± 368.7
VA21EntranceSurface21.8 ± 9.210.9 ± 3.17.9 ± 1.315.0 ± 10.9248.5 ± 57.80.14 ± 0.030.07 ± 0.010.09 ± 0.0262.7 ± 186.1
0.5 m19.7 ± 8.210.1 ± 2.87.4 ± 1.217.1 ± 13.8271.0 ± 60.00.14 ± 0.030.06 ± 0.010.09 ± 0.0228.5 ± 47.9
1.0 m16.9 ± 8.98.5 ± 3.36.9 ± 1.220.1 ± 13.8240.8 ± 83.40.13 ± 0.030.06 ± 0.010.08 ± 0.02113.5 ± 244.5
MiddleSurface21.5 ± 9.010.7 ± 2.88.1 ± 1.315.3 ± 8.9191.1 ± 94.60.14 ± 0.030.07 ± 0.010.09 ± 0.0257.0 ± 189.0
0.5 m19.3 ± 8.310.4 ± 2.77.8 ± 1.217.5 ± 13.3214.4 ± 81.30.14 ± 0.020.06 ± 0.010.09 ± 0.0228.6 ± 47.1
1.0 m17.2 ± 9.09.3 ± 3.27.4 ± 1.217.5 ± 12.3238.1 ± 77.50.13 ± 0.030.06 ± 0.010.08 ± 0.0234.4 ± 64.0
MD11EntranceSurface23.6 ± 4.014.2 ± 3.98.6 ± 1.016.2 ± 14.3408.6 ± 184.70.17 ± 0.020.07 ± 0.010.11 ± 0.0188.5 ± 63.5
0.5 m21.0 ± 5.213.0 ± 2.38.3 ± 0.814.5 ± 9.5415.1 ± 184.80.16 ± 0.020.07 ± 0.010.10 ± 0.01115.9 ± 123.4
1.0 m16.5 ± 7.110.9 ± 2.67.8 ± 0.614.9 ± 10.1465.3 ± 176.60.15 ± 0.020.07 ± 0.010.10 ± 0.01107.1 ± 113.7
MiddleSurface23.3 ± 4.014.7 ± 4.68.7 ± 1.020.3 ± 20.6379.3 ± 190.80.17 ± 0.020.08 ± 0.010.11 ± 0.0165.5 ± 75.6
0.5 m21.6 ± 3.212.7 ± 2.78.4 ± 0.915.8 ± 12.9388.3 ± 186.60.16 ± 0.020.07 ± 0.010.11 ± 0.0177.4 ± 51.9
1.0 m17.4 ± 6.611.2 ± 2.98.0 ± 0.715.3 ± 10.8442.6 ± 181.30.15 ± 0.020.07 ± 0.010.10 ± 0.0173.2 ± 50.1
MD21EntranceSurface16.9 ± 10.18.7 ± 6.88.0 ± 1.325.4 ± 17.9275.8 ± 77.40.29 ± 0.060.14 ± 0.030.19 ± 0.04141.1 ± 360.1
0.5 m17.2 ± 9.513.8 ± 4.97.9 ± 1.230.5 ± 36.0280.1 ± 77.10.28 ± 0.060.14 ± 0.030.18 ± 0.0442.2 ± 65.5
1.0 m18.5 ± 8.812.5 ± 3.98.0 ± 1.131.7 ± 33.5295.3 ± 85.90.29 ± 0.050.14 ± 0.030.19 ± 0.0335.1 ± 65.4
MiddleSurface16.9 ± 9.812.6 ± 6.68.3 ± 1.329.8 ± 31.7293.9 ± 79.20.28 ± 0.050.14 ± 0.030.18 ± 0.0314.5 ± 11.4
0.5 m16.9 ± 9.114.1 ± 4.68.3 ± 1.332.2 ± 30.6289.1 ± 78.80.27 ± 0.060.13 ± 0.030.18 ± 0.0421.6 ± 27.1
1.0 m17.4 ± 8.112.8 ± 3.68.3 ± 1.233.1 ± 34.4293.4 ± 77.70.27 ± 0.050.13 ± 0.030.18 ± 0.0324.0 ± 37.9
Notes: T: Temperature; DO: dissolved oxygen; Chla: chlorophyll a; ORP: oxidation reduction potential; EC: electrical conductivity; TDS: total dissolved solid; TUR: turbidity.

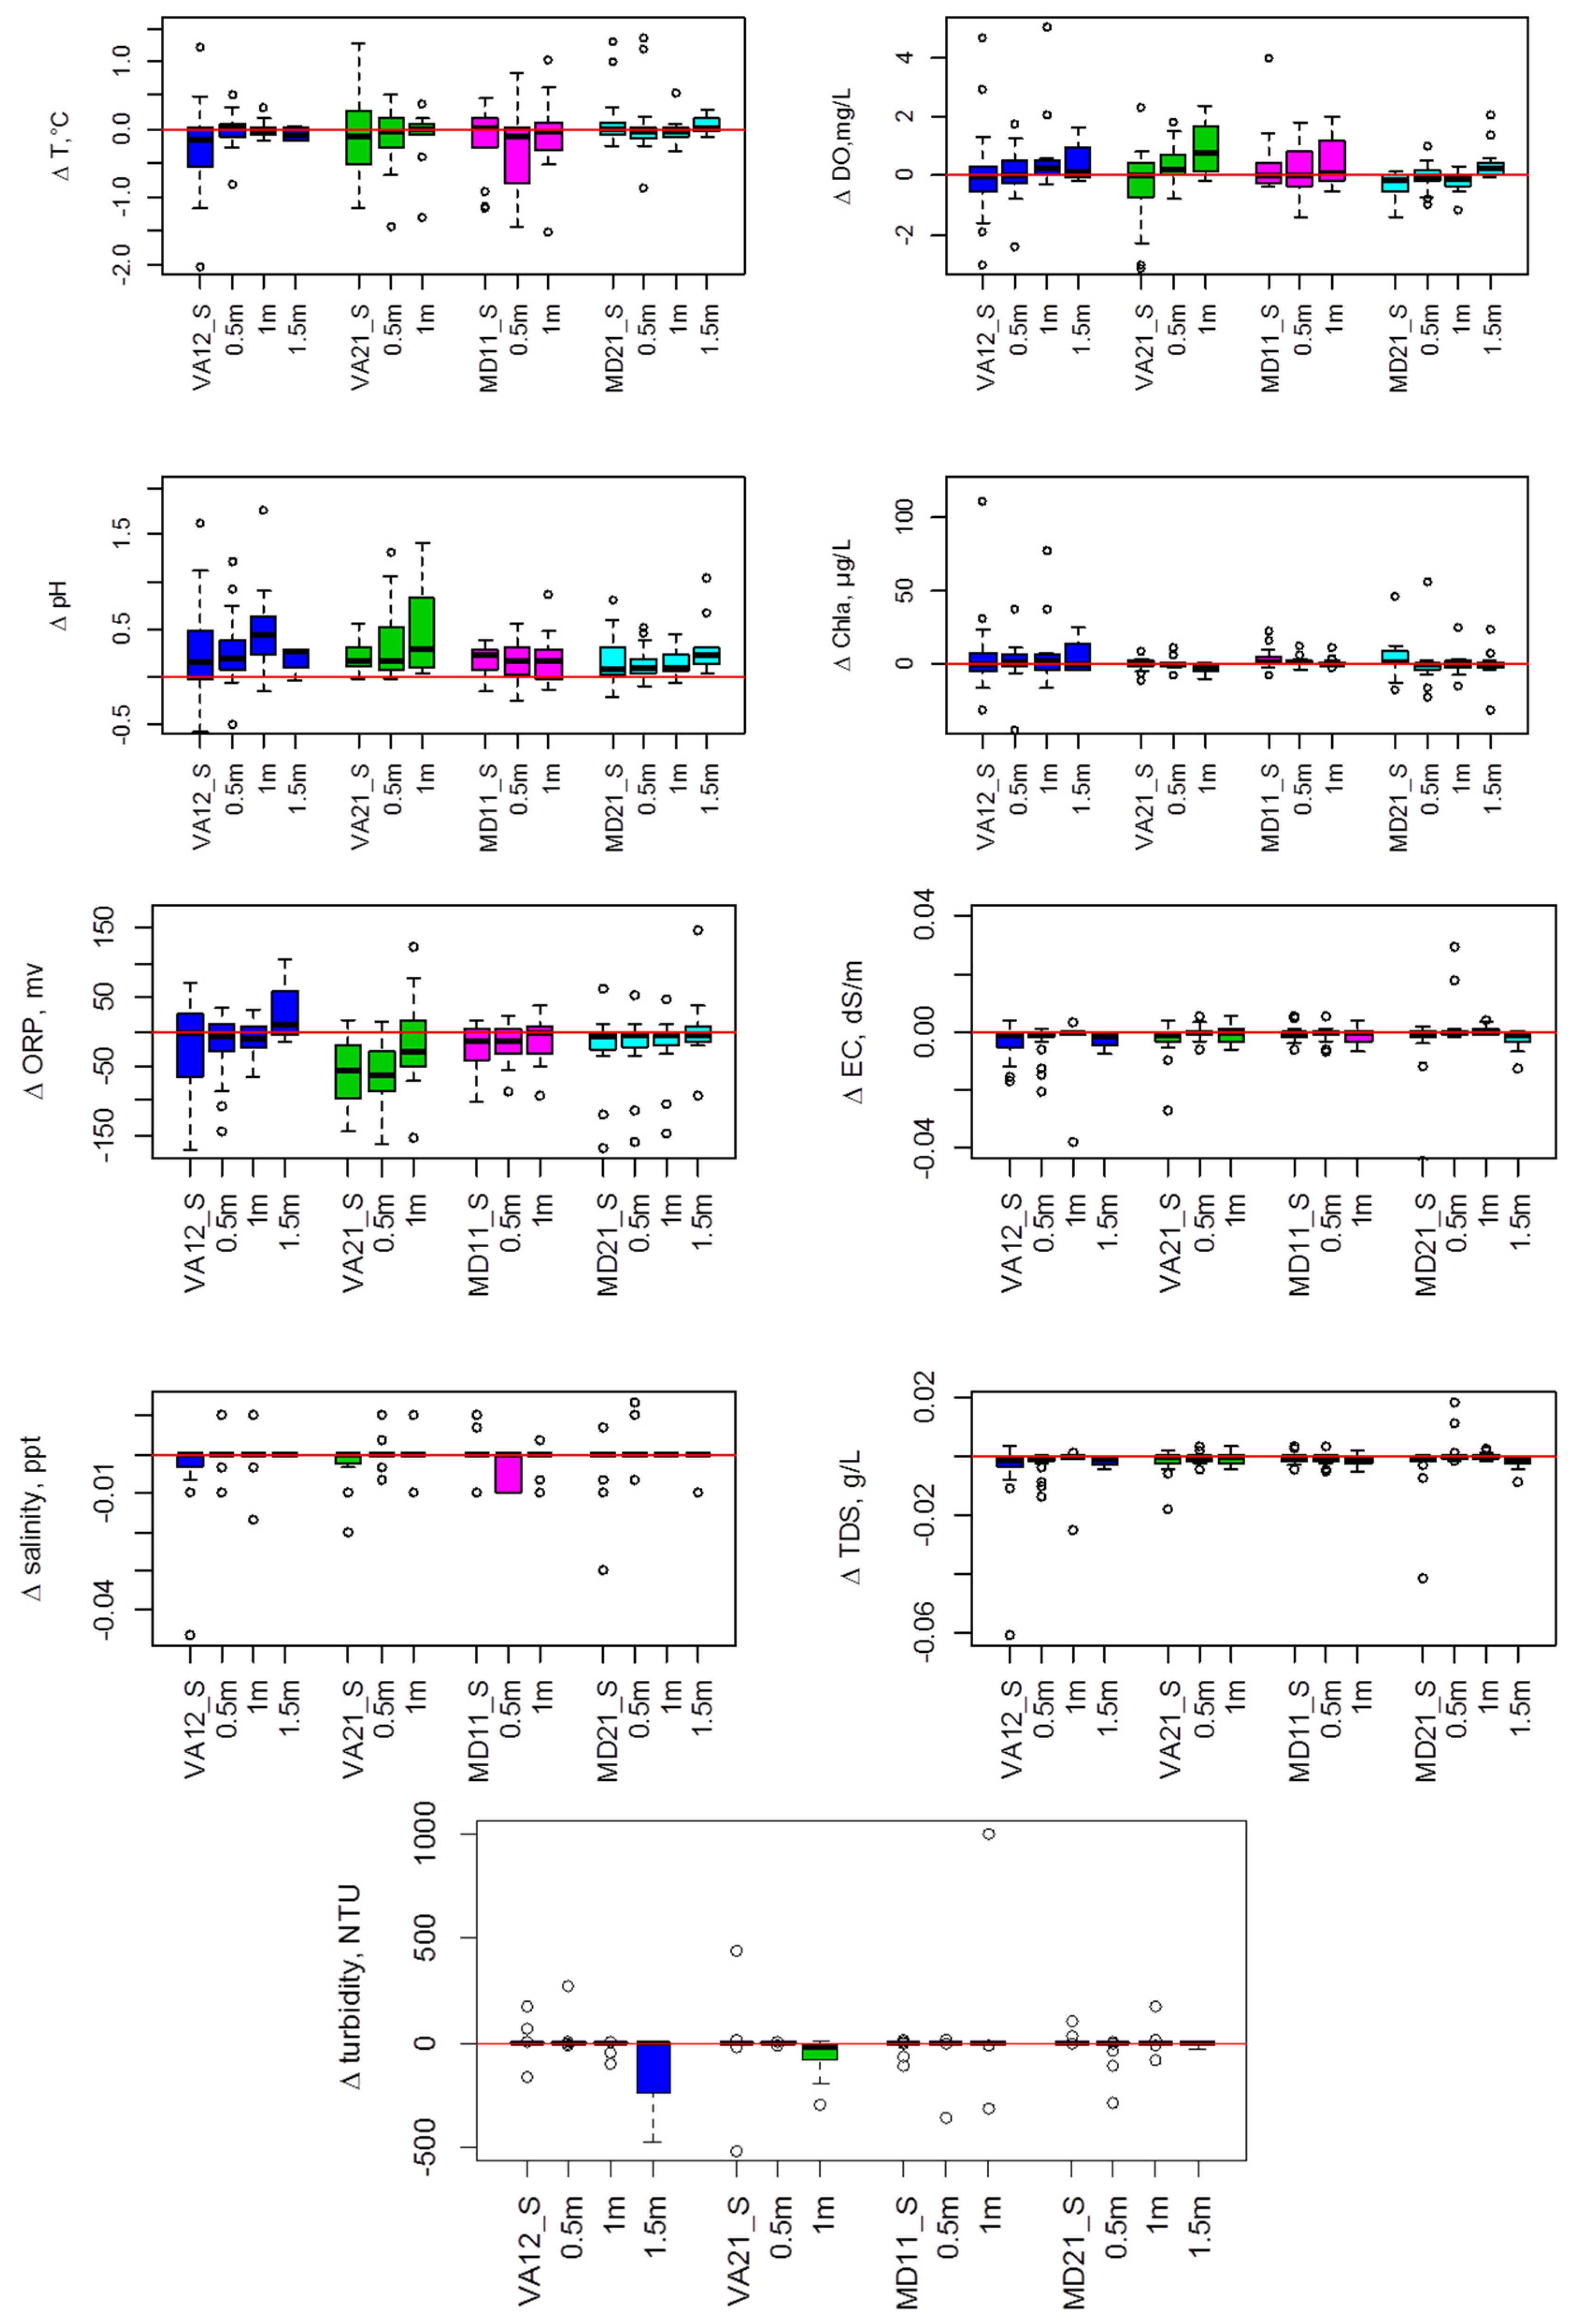
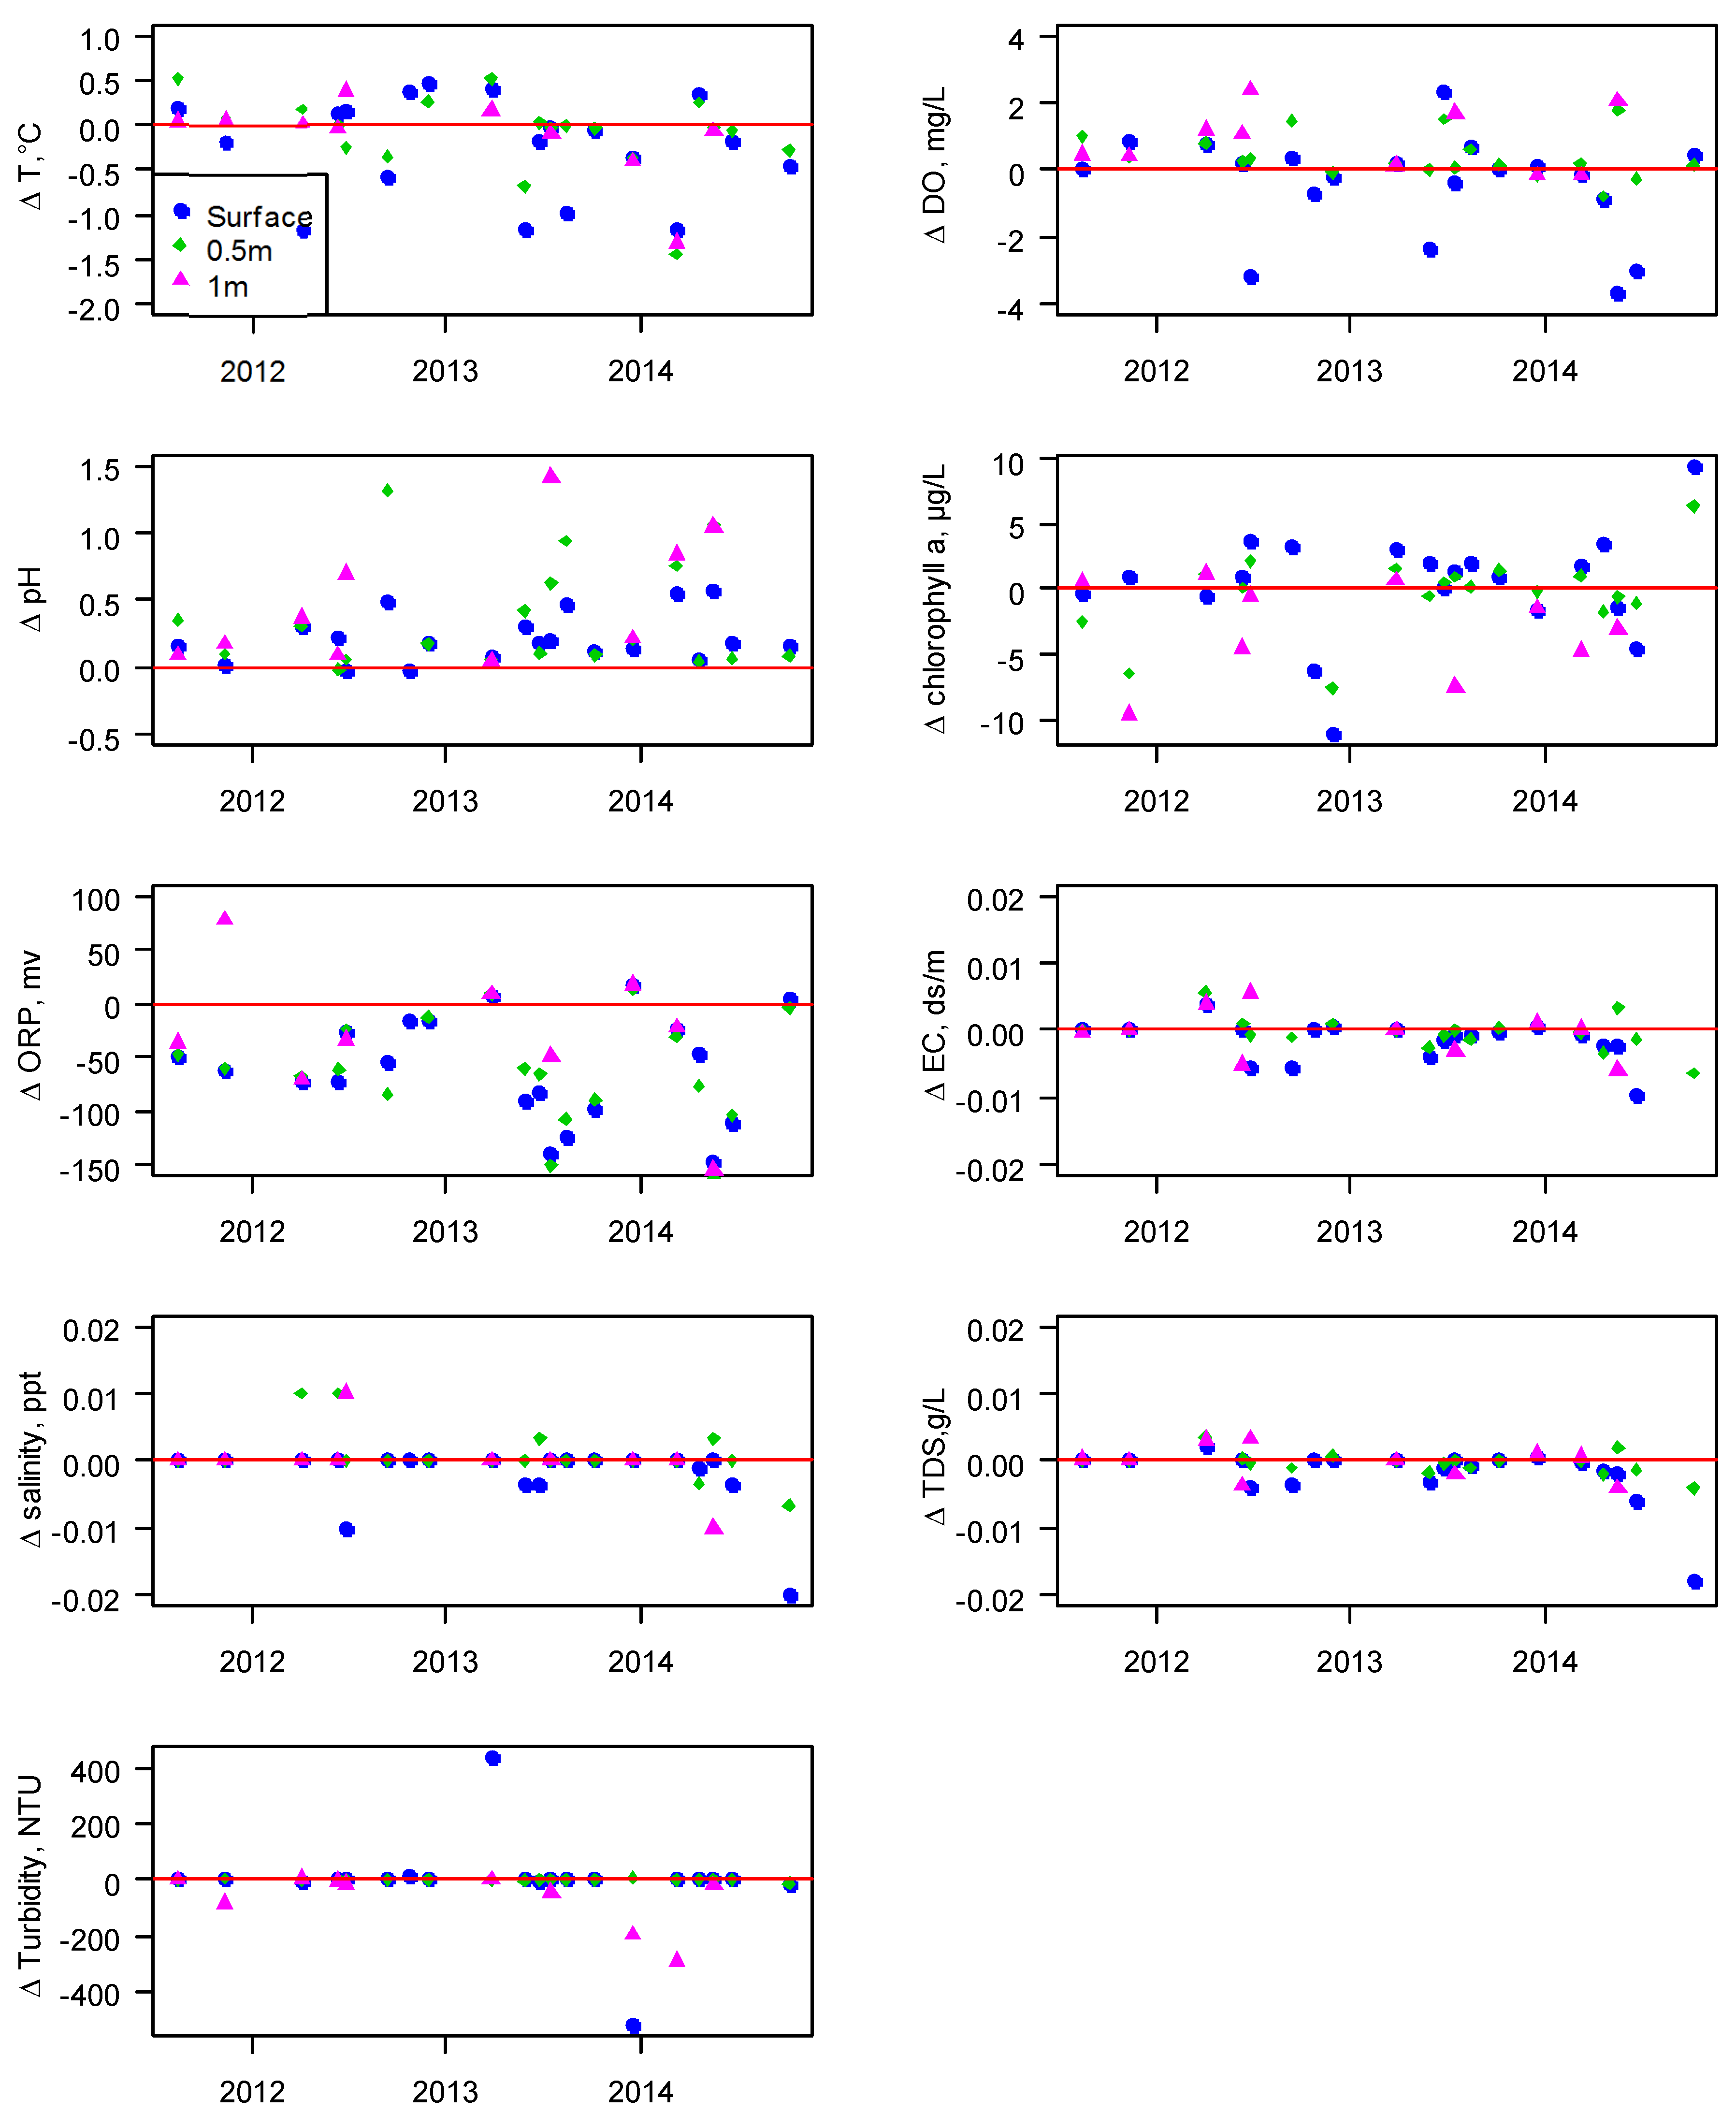
3.2. Water Quality Differences

Water quality differences between the middle and the entrance of each RIR were calculated following Equation (1) for each sampling date. Figure 2 shows the variation of water quality differences for each water layer in Reservoir VA12, VA21, MD11 and MD21, in terms of median, 25th, 75th, 10th and 90th percentiles. Higher water quality differences can be seen for T, DO, pH and ORP, while Chla, EC, salinity, TDS and TUR exhibit relatively few differences. When comparing reservoirs, VA12, VA21 and MD11 showed higher levels of variation in water quality difference than MD21. When comparing water depths within the same reservoir, water quality differences have greater variation at the surface (0.2 m) than at 0.5 m, 1.0 m and 1.5 m, with few exceptions.
T and ORP were lower at the middle than at the entrance, while DO, pH and Chla were higher at the middle than at the entrance. Taking VA21 surface water as an example, the median and maximum differences were 0.11 and 1.44 °C for T, 0.04 and 3.69 mg/L for DO, 0.17 and 1.41 for pH, 0.97 and 11.25 μg/L for Chla, and 57.50 and 163.33 mv for ORP, respectively. The differences for EC, salinity, TDS and TUR, however, are small with most data points (close to the red solid line which represents zero difference (Figure 2). In reservoir VA21, the maximum difference is 0.03 dS/m for EC, 0.02 ppt for salinity and 0.02 g/L for TDS. Although the maximum difference in TUR is 522.30 NTU, the majority of the TUR differences are between 4.14 and 6.74 NTU.
ANOVA was conducted to determine the significance of water quality differences between two sampling points in each reservoir for each sampling date. The percentages of observations (dates) with significant location differences are summarized in Table 3. It is evident that T, pH, DO and ORP have statistically significant differences in the majority of observations with the percentage values mostly above 60% in all four RIRs. In comparison, the majority of percentages that were significant for EC, TDS and TUR were between 40% and 60%. The percentage values for Chla and salinity were less than 30%.
The water quality differences of all water quality parameters, except ORP and turbidity are statistically significant (p < 0.05) among the entrance, middle and outlet in VA12 as shown in Figure 3. The entrance has higher T followed by the middle and then the outlet. The median and maximum differences between middle and outlet are 1.6 and 2.2 °C. The pH levels are highest in the middle followed by the entrance and then the outlet. The median and maximum differences between middle and outlet are 1.2 and 1.5. The concentrations of DO and Chla are the lowest at the outlet. The median and maximum differences between the middle and outlet are 2.5 and 4.4 mg/L for DO, 6.5 and 24.0 μg/L for Chla. No ascending or descending trends were observed for EC along the three sampling points, although the differences were significant. The median and maximum EC differences between the middle and outlet are 0.01 dS/m and 0.03 dS/m.
Figure 2. Boxplots of water quality difference between the middle and the entrance of reservoir VA12, VA21, MD11 and MD21 at various water depths. Each boxplot represents the median (solid line), 25th and 75th percentile (box) and 10th and 90th percentile (error bar) for water quality differences at each depth in RIRs investigated during 2011 to 2014. Data above the red solid line indicate higher water quality parameter values in the middle than at the entrance, and vice versa otherwise.
Water 07 03861 g002
Table 3. Percentage of observations (sampling dates) with statistically significant water quality differences between the middle and entrance in each RIR studied (p < 0.05 considered as statistically significant).
Water Quality ParametersReservoirsSurface0.5 m below1.0 m below1.5 m below
TVA1261%74%64%67%
VA2160%53%30%
MD1179%79%77%
MD2192%65%81%64%
DOVA1257%79%82%67%
VA2130%37%80%
MD1157%79%62%
MD2158%82%50%36%
pHVA1278%89%82%100%
VA2175%63%90%
MD1193%93%85%
MD2175%88%100%100%
ChlaVA1248%58%82%67%
VA2150%37%40%
MD1150%57%62%
MD2158%53%44%36%
ORPVA1257%84%82%100%
VA2150%53%60%
MD1179%93%92%
MD21100%71%75%73%
ECVA1257%58%36%67%
VA2120%42%60%
MD1150%57%62%
MD2167%53%56%55%
SalinityVA1213%11%18%0%
VA2110%11%20%
MD1129%29%15%
MD210%12%0%18%
TDSVA1252%47%18%33%
VA2120%26%60%
MD1143%57%46%
MD2150%47%44%64%
TURVA1226%58%45%33%
VA2130%42%40%
MD1114%43%46%
MD2158%65%56%64%
Figure 3. Surface water quality at the entrance, middle and outlet of reservoir VA12 in 2014.
Water 07 03861 g003

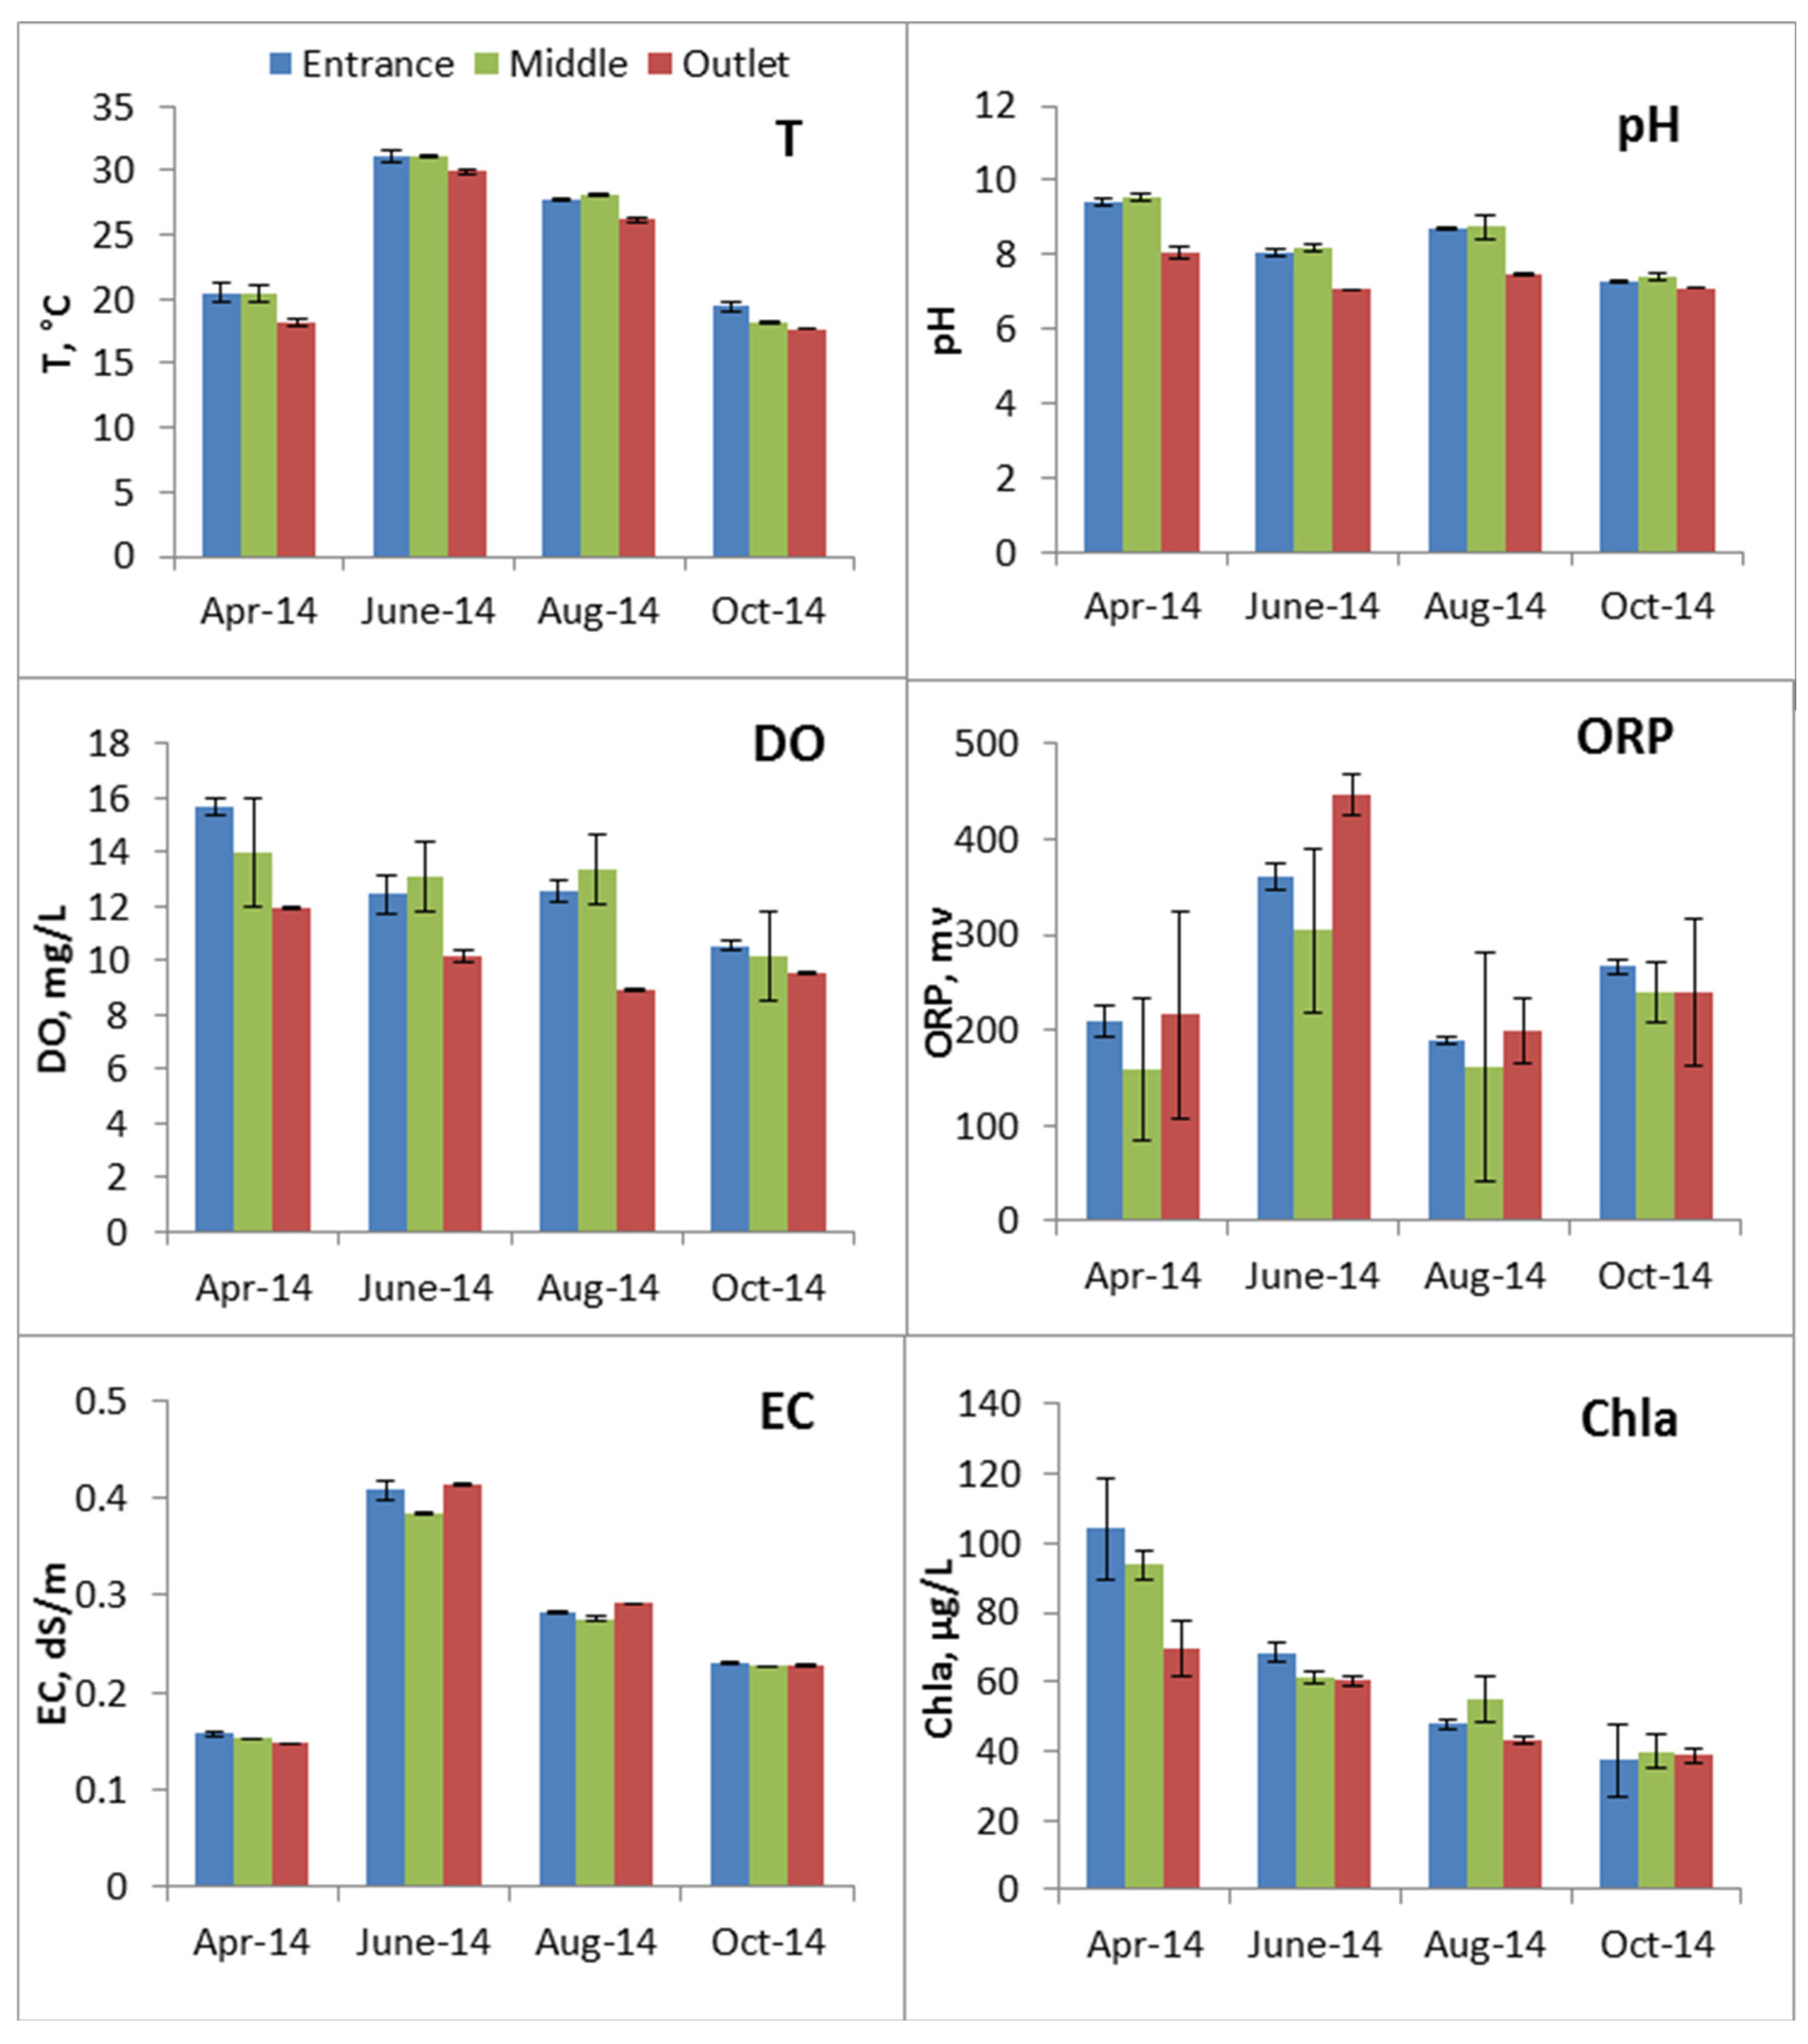
3.3. Seasonal Impact on Water Quality Differences

Several water quality differences vary with season, however, the correlations are not significant. Figure 4 displays the water quality differences between the entrance and middle over time in VA21 at three depths. Statistically significant water quality parameter differences (T, pH, DO and ORP) are most prominent during the stratification period (from April to October) compared to the non-stratification period (from November to March). The trend is clearly demonstrated by pH variation. At both water surface level and 0.5 m below surface, the peaks of pH differences occurred in September 2012, August 2013 and May 2014. At 1 m below water surface, the peaks of pH differences took place in June 2012, July 2013 and May 2014. Similar to pH, the peaks of DO differences were present within the time of stratification. T and ORP were lower in the middle than at the entrance, therefore, similar trends but negative peak values were expected for these differences. More noise is present in the scatterplot of T and ORP, compared to pH and DO. For EC, salinity, TDS and TUR, there is little difference between the stratification period and the non-stratification period and the differences between the middle and entrance are minimal throughout the year. Chla differences do not show consistent pattern with respect to seasons based on data collected in this study.
Figure 4. Water quality differences between the middle and the entrance at various water depths in reservoir VA21 during the 2011 to 2014 sampling period. The highlighted area marks the stratification period.
Water 07 03861 g004
The seasonal variation of meteorological variables in VA reservoirs and MD reservoirs is present in Figure 5. The air temperature and DLI rise during the stratification periods from April to October and decrease during the non-stratification periods from November to March. Wind speed and precipitation are highly variable. Temperature differences were found significantly correlated to DLI, wind speed and precipitation for two reservoirs (p < 0.05). The pH differences were significantly correlated with wind speed for one reservoir (p < 0.05). The remaining water quality differences, however, were not significantly correlated with meteorological variables.
Figure 5. The daily average of air temperature, daily light integral (DLI), total precipitation and wind speed in VA reservoirs and MD reservoirs during the 2011 to 2014 study period.
Water 07 03861 g005
A cluster analysis was performed to determine if water quality differences between sampling points vary geographically (VA reservoirs versus MD reservoirs) and temporally (stratification period versus non-stratification periods). The cluster analyses were conducted on water quality difference data in 2012 and 2013 separately (Figure 6). Two clusters were formed in each dendrogram and each cluster contains all four RIRs from VA and MD across non-stratified and stratified periods. In 2012, the left clusters from the 1st branch consist of measurements predominately from stratified periods (71%) while MD and VA RIRs were in similar proportion. All data from the right side of the 1st branch to the left side of the 6th branch forms a cluster that consists of measurements predominately from VA RIRs (64%) while non-stratified and stratified periods were in similar proportion. The data forming a cluster from the right 6th branch consist predominately of measurements from MD RIRs (80%) while non-stratified and stratified periods were in similar proportion. In 2013, the data forming a cluster from the right-side of 1st branch consist of measurements predominately from stratified periods (82%) and from VA RIRs (82%). From the left-side of the 1st branch most of non-stratified and stratified periods and MD and VA RIRs are distributed in similar proportion. However, tracking down the left clusters from the 1st branch, the data from the right-side of the 4th branch consist of measurements predominately from MD RIRs (83%).
Figure 6. Dendrograms showing hierarchical clustering of water quality differences at surface level in four reservoirs (a) in 2012 and (b) in 2013. Each label represents the reservoir name (VA12, VA21, MD11 and MD21) and the sampling date.
Water 07 03861 g006

4. Discussion

This study examined the spatial variation of nine water quality parameters in recycling irrigation reservoirs, an aquatic environment of great importance to agricultural production and water resource conservation. Water quality differences exist between the entrance and middle of RIRs for several parameters. T and ORP were mostly lower at the middle than at the entrance, while DO, pH and chlorophyll a were mostly higher at the middle than at entrance. EC, salinity, TDS and TUR had very small differences between sampling points. Generally, the two-point differences were small in magnitude for all parameters, even though they were statistically significant. It should be noted that water quality samples from the entrance were taken at times when no runoff was flowing into the RIRs. The chemical gradients between the entrance and the middle of the RIRs may be diminished due to physical mixing. Additional analysis of outlet data shows that the range and magnitude of water quality difference between the middle and the outlet are comparable to those between the middle and entrance of RIRs.
The water quality differences between the middle and entrance varied with seasons and geographic location. The water quality differences were greater from April to October when water column was stratified than the non-stratification periods from November to March [22]. The differences also varied with geographical location and time of year as indicated by cluster analysis. Significant clustering due to geographical locations and time of year was evident yet not consistently distributed in hierarchical placement. High similarity was observed between MD11 and MD21 and also between VA12 and VA21 in 2013. Temperature differences between sampling points among different reservoirs are significantly correlated with DLI, wind speed and precipitation (p < 0.05), and pH differences are significantly correlated with precipitation, while other parameters are not, which indicate weather conditions have limited contribution to grouping of VA reservoirs and MD reservoirs. The scattered aggregation of the grouping indicates other covariate factors not identified in this study may still need to be elucidated. The clustering of reservoirs may also be due to the irrigation activities in each nursery which has not been documented in this study.
Water quality differences between the entrance and middle of RIRs, although statistically significant, are not large enough in magnitude to cause significant impacts on plant pathogen survival. A variety of plant pathogens including bacteria, fungi and oomycetes are present in the RIRs [23], among which Phytophthora species are the most economically important to nursery production. Phytophthora species, such as P. gonapodyides and P. pini have been reported to survive best at temperature 20–25 °C [9,24] and a few high-temperature tolerant species, such as P. aquimorbida, P. hydrogena, P. hydropathica, P. insolita, P. irrigata, and P. virginiana have an optimal growth temperature of 35 °C [4,5,6,7,8]. Temperature differences between these two sampling points of within 1 °C would not alter the temperature biome for pathogen activities. Zoospores of several Phytophthora species including P. megasperma, P. nicotianae, P. pini and P. tropicalis were found to survive best at DO concentrations in a very narrow range between 5.3 and 5.6 mg/L [11] and the majority of DO concentrations in RIRs are outside this range. DO differences were within 2 mg/L for most sampling dates, which may not change DO conditions in RIRs from being unfavorable for pathogen survival. Survival rates for zoospores of seven Phytophthora species were pH dependent [10]. Most pH differences were within 1.0 unit in RIRs and would likely to have little effect on pathogen survival. Three high-impact quarantine pathogens P. ramorum, P. alni and P. kernoviae survive better at EC levels greater than 1.89 dS/m than at EC levels below 0.41 dS/m [12]. The EC levels and differences were primarily less than 0.41 and within 0.01 dS/m, respectively. Such small variations would not alter the negative influence on zoospore survival. ORP values above 650 mv can inactivate human pathogens [13]. Although the ORP variation is mostly within 100 mv, the ORP ranges in RIRs are still less than 650 mv, which would have a limited impact on pathogen inactivation. Compared to the ranges of each water quality parameter that affect pathogen survival, the absolute water quality differences between two sampling points were relatively small, which may not alter water environment conditions and pathogen survival.
Water quality differences between sampling points in RIRs could impact chlorination efficacy. Chlorination, widely used to disinfect water, performs best at pH 5.0 to 6.5 [25], and increasing pH would diminish the performance of chlorine. The efficacy of chlorination is approximately 100% at pH 5, 96% at pH 6, 75% at pH 7, 26% at pH 8, 10% at pH 9 and 6% at pH 10. The pH differences, even though it was within 1.0 unit, could greatly affect the performance of chlorination. Thus, it is important to take pH measurements at the point where water is treated.
The spatial variation of some water quality parameters could affect plant growth and productivity. The solubility of some micro- and macronutrients decreases dramatically within 2.0 unit of pH [3]. The desirable pH level for some plants is between 4.5 and 6.5 [26]. The pH differences observed in this study could change the availability of nutrients to plants, depending on the buffer capacity. The recommended substrate EC levels for most landscape plants are between 0.5 and 1.0 dS/m or 0.8 and 1.5 dS/m depending on the type of fertilizer applied [26]. The EC differences within 0.01 dS/m are unlikely to affect plant growth due to the scale.
Single point monitoring in RIRs is sufficient for most water quality parameters except pH; and such monitoring scheme could save growers substantial cost and time compared to multi-point monitoring. Water quality data are essential for grower to make an informed decision on water treatment before water is delivered to crops. Water quality monitoring equipment can be expensive and taking measurements is time consuming. Our results demonstrate that two-point differences of most water quality parameters except for pH do not have significant impacts on pathogen survival, water disinfection and nutrient availability.
The outputs of this study also could be utilized in RIR water quality dynamics modeling that is important to horticultural industry. The modeling is essential to identify kinetic processes controlling water quality fluctuations in RIRs and project water quality changes temporally and spatially. This study provides the spatial variations of water quality parameters, which is important in determining the spatial resolution of water quality modeling and data inputs.
Overall, this study characterized the spatial variations of nine water quality parameters in RIRs, an emerging aquatic environment. These data provide a basis for considering the computer simulation of water quality dynamics and plant disease management in RIRs. The two-point water quality differences of most water quality parameters except pH, although statistically significant, are not large enough to cause significant impacts on crop health and productivity. This study suggests that single-point monitoring in RIRs is sufficient for most water quality parameters except pH. Additional pH measurements are necessary to made decisions on water treatments before water is delivered to crops. More studies on temporal variations of water quality, reservoir mixing (i.e., aeration) and reservoir geometry (i.e., size and depth) are warranted to develop further recommendations on management of water withdrawal, water disinfection, fertigation, and algal blooms.

Acknowledgments

The data for this paper can be accessed from VTechWorks at Virginia Polytechnic Institute and State University. This research was supported in part by Virginia Agricultural Experiment Station, the United States Department of Agriculture National Institute of Food and Agriculture Specialty Crop Research Initiative (Agreement number 2010-51181-21140) and Hatch Program. We thank collaborating growers for providing access to the study reservoirs and on-site assistances.

Author Contributions

Haibo Zhang and Chuanxue Hong contributed on study’s conception, data analysis, manuscript drafting and revising. Patricia A. Richardson performed data acquisition in reservoirs in Virginia and edited the manuscript. Bruk E. Belayneh and Andrew Ristvey collected data in reservoirs in Maryland and edited the manuscript. John Lea-Cox, Warren E. Copes and Gary W. Moorman contributed to manuscript reviewing and editing.

Conflicts of Interest

The authors declare no conflict of interest.

References

  1. Valdez-Aguilar, L.A.; Grieve, C.M.; Poss, J.; Mellano, M.A. Hypersensitivity of ranunculus asiaticus to salinity and alkaline pH in irrigation water in sand cultures. HortScience 2009, 44, 138–144. [Google Scholar]
  2. Bauder, T.A.; Waskom, R.M.; Sutherland, P.L; Davis, J.G. Irrigation Water Quality Criteria; Colorado State University Extension: Fort Collins, CO, USA, 2011. [Google Scholar]
  3. Argo, W.R.; Fisher, P.R. Understanding pH Management for Container-grown Crops; Meister Publishing: Willoughby, OH, USA, 2002. [Google Scholar]
  4. Yang, X.; Gallegly, M.E.; Hong, C. A high-temperature tolerant species in clade 9 of the genus phytophthora: P. hydrogena sp. Nov. Mycologia 2014, 106, 57–65. [Google Scholar] [CrossRef] [PubMed]
  5. Yang, X.; Hong, C. Phytophthora virginiana sp. Nov., a high-temperature tolerant species from irrigation water in virginia. Mycotaxon 2014, 126, 167–176. [Google Scholar] [CrossRef]
  6. Hong, C.; Gallegly, M.E.; Richardson, P.A.; Kong, P.; Moorman, G.W. Phytophthora irrigata, a new species isolated from irrigation reservoirs and rivers in eastern united states of america. FEMS Microbiol. Lett. 2008, 285, 203–211. [Google Scholar] [CrossRef] [PubMed]
  7. Hong, C.; Gallegly, M.E.; Richardson, P.A.; Kong, P.; Moorman, G.W.; Lea-Cox, J.D.; Ross, D.S. Phytophthora hydropathica, a new pathogen identified from irrigation water, rhododendron catawbiense and kalmia latifolia. Plant Pathol. 2010, 59, 913–921. [Google Scholar] [CrossRef]
  8. Hong, C.; Richardson, P.A.; Hao, W.; Ghimire, S.R.; Kong, P.; Moorman, G.W.; Lea-Cox, J.D.; Ross, D.S. Phytophthora aquimorbida sp. Nov. and phytophthora taxon “aquatilis” recovered from irrigation reservoirs and a stream in virginia, USA. Mycologia 2012, 104, 1097–1108. [Google Scholar] [CrossRef] [PubMed]
  9. Hong, C.; Gallegly, M.E.; Richardson, P.A.; Kong, P. Phytophthora pini leonian resurrected to distinct species status. Mycologia 2011, 103, 351–360. [Google Scholar] [CrossRef] [PubMed]
  10. Kong, P.; Moorman, G.W.; Lea-Cox, J.D.; Ross, D.S.; Richardson, P.A.; Hong, C. Zoosporic tolerance to pH stress and its implications for phytophthora species in aquatic ecosystems. Appl. Environ. Microb. 2009, 75, 4307–4314. [Google Scholar] [CrossRef] [PubMed]
  11. Kong, P.; Hong, C. Oxygen stress reduces zoospore survival of phytophthora species in a simulated aquatic system. BMC Microbiol. 2014, 14. [Google Scholar] [CrossRef] [PubMed]
  12. Kong, P.; Lea-Cox, J.D.; Hong, C.X. Effect of electrical conductivity on survival of phytophthora alni, P. kernoviae and P. ramorum in a simulated aquatic environment. Plant Pathol. 2012, 61, 1179–1186. [Google Scholar] [CrossRef]
  13. Suslow, T.V. Using Oxidation-Reduction Potential (ORP) for Water Disinfection Monitoring, Control, and Documentation; University of California: Davis, CA, USA, 2004. [Google Scholar]
  14. Singh, K.P.; Malik, A.; Mohan, D.; Sinha, S. Multivariate statistical techniques for the evaluation of spatial and temporal variations in water quality of Gomti river (India)—A case study. Water Res. 2004, 38, 3980–3992. [Google Scholar] [CrossRef] [PubMed]
  15. Singh, K.P.; Malik, A.; Sinha, S. Water quality assessment and apportionment of pollution sources of Romti river (Rndia) using multivariate statistical techniques—R case study. Anal. Chim. Acta 2005, 538, 355–374. [Google Scholar] [CrossRef]
  16. Varol, M.; Gökot, B.; Bekleyen, A.; Şen, B. Spatial and temporal variations in surface water quality of the dam reservoirs in the Tigris river basin, Turkey. Catena 2012, 92, 11–21. [Google Scholar] [CrossRef]
  17. Bennett, H.H.; Mullen, M.W.; Stewart, P.M.; Sawyer, J.A.; Webber, E.C. Development of an invertebrate community index for an Alabama coastal plain watershed1. JAWRA J. Am. Water Resour. Assoc. 2004, 40, 43–51. [Google Scholar] [CrossRef]
  18. Sridhar, V.; Sansone, A.L.; LaMarche, J.; Dubin, T.; Lettenmaier, D.P. Prediction of stream temperature in forested watersheds. JAWRA J. Am. Water Resour. Assoc. 2004, 40, 197–213. [Google Scholar] [CrossRef]
  19. Alkarkhi, A.F.; Ahmad, A.; Ismail, N.; Mat Easa, A.; Omar, K. Assessment of surface water through multivariate analysis. J. Sustain. dev. 2009, 1. [Google Scholar] [CrossRef]
  20. Poudel, D.D.; Lee, T.; Srinivasan, R.; Abbaspour, K.; Jeong, C.Y. Assessment of seasonal and spatial variation of surface water quality, identification of factors associated with water quality variability, and the modeling of critical nonpoint source pollution areas in an agricultural watershed. J. Soil Water Conserv. 2013, 68, 155–171. [Google Scholar] [CrossRef]
  21. Hong, C.; Lea-Cox, J.; Ross, D.; Moorman, G.; Richardson, P.; Ghimire, S.; Kong, P. Containment basin water quality fluctuation and implications for crop health management. Irrigation Sci. 2009, 27, 485–496. [Google Scholar] [CrossRef]
  22. Zhang, H.; Richardson, P.A.; Belayneh, B.E.; Ristvey, A.; Lea-Cox, J.D.; Copes, W.E.; Moorman, G.W.; Hong, C. Recycling irrigation reservoir stratification and implications for crop health and production. J. Am. Water Resour. Assoc. 2015. Submitted. [Google Scholar]
  23. Hong, C.; Moorman, G.W. Plant pathogens in irrigation water: Challenges and opportunities. Crit. Rev. Plant Sci. 2005, 24, 189–208. [Google Scholar] [CrossRef]
  24. Buisman, C.J. Root Rots Caused by Phycomycetes. Ph.D. Thesis, Rijksuniversiteit te Utrecht, Utrecht, The Netherlands, April 1927. [Google Scholar]
  25. Wolfe, N.L.; Zepp, R.G.; Doster, J.C.; Hollis, R.C. Captan hydrolysis. J. Agric. Food Chem. 1976, 24, 1041–1045. [Google Scholar] [CrossRef] [PubMed]
  26. Yeager, T.H.; Bilderback, T.; Fare, D.; Gilliam, C.; Lea-Cox, J.D.; Niemiera, A.; Ruter, J.; Tilt, K.; Warren, S.; Whitwell, T. Best Management Practices Guide: Guide for Producing Nursery Crops, 3rd ed.; Southern Nursery Association: Atlanta, GA, USA, 2013. [Google Scholar]

