
Addressing the Spatiotemporal Patterns of Heatwaves in Portugal with a Validated ERA5-Land Dataset (1980–2021)
by
 , , and
Luis Angel Espinosa
1,* ,
,
Maria Manuela Portela
2 ,
,
Laryssa Mariana Moreira Freitas
3 and
Salem Gharbia
4
1
Associação do Instituto Superior Técnico para a Investigação e Desenvolvimento (IST-ID), Civil Engineering Research and Innovation for Sustainability (CERIS), Avenida António José de Almeida, No. 12, 1000-043 Lisbon, Portugal
2
Instituto Superior Técnico (IST), Civil Engineering Research and Innovation for Sustainability (CERIS), 1049-001 Lisbon, Portugal
3
Instituto Superior Técnico (IST), 1049-001 Lisbon, Portugal
4
Department of Environmental Science, Atlantic Technological University (ATU), F91 YW50 Sligo, Ireland
*
Author to whom correspondence should be addressed.
Water 2023, 15(17), 3102; https://doi.org/10.3390/w15173102
Submission received: 28 July 2023
/
Revised: 16 August 2023
/
Accepted: 25 August 2023
/
Published: 29 August 2023
(This article belongs to the Special Issue Rainfall-Runoff and Extreme Event Modelling. Novel Database Systems)
Abstract
:This study presents a comprehensive analysis of heatwaves in mainland Portugal from 1 October 1980 to 30 September 2021 (41 hydrological years). It addresses a research gap by providing an updated assessment using high-resolution reanalysis daily minimum and maximum temperature data (Tmin and Tmax) from the gridded ERA5-Land dataset, overcoming the lack of publicly available daily temperature records. To assess the representation of the previous dataset, nine different grid-point locations across the country were considered. By comparing monthly ERA5-Land temperature data to ground-based records from the Portuguese Met Office, a monthly validation of the data was conducted for the longest common period, demonstrating good agreement between the two datasets. The heatwave magnitude index (HWMI) was employed to establish the temperature thresholds and thus identify heatwaves (defined as three or more consecutive days above the threshold). With over 640 Tmin heatwave days recorded at each of the nine ERA5-Land grid-points, data analysis revealed a discernible upward trend in Tmin heatwaves. The grid-point situated in the capital city’s urban area, i.e., Lisbon, exhibited the highest number of Tmin heatwave days. With an average of more than 800 Tmax heatwave days over the 41-year period, the northern and interior regions of Portugal had the greatest number of occurrences, reaching up to 916. A kernel rate estimation method was applied to further investigate the annual frequency of Tmin and Tmax heatwave occurrences. Results exhibited clear temperature changes, with a widespread increase in the number of heatwave days over the past two decades, particularly for Tmax. In summary, the occurrence of this phenomenon displayed significant spatial variations, with the southern interior and coastal grid-points experiencing a greater increase in annual Tmax heatwave days, rising from 10 to 30 between 2018 and 2019.
1. Introduction
Heatwaves are periods of extreme weather characterised by unusually hot temperatures that typically last two or more days, and, in some regions, by high humidity and little to no wind [1]. These occurrences may have a significant impact on infrastructure, ecosystems, human health, and socioeconomic activities. Due to climate change, heatwaves have been occurring more frequently, most recently in many parts of the world [2,3]. Some studies even claim that such extreme events are getting longer and more intense. Portugal has had numerous severe heatwaves in the last ten years, including the historic heatwave of August 2018, which was one of the nation’s most intense and prolonged high-temperature periods on record [4,5,6]. Heatwaves have had significant negative impacts on public health, agriculture, energy consumption, and ecosystem functioning, highlighting the need for effective adaptation and mitigation strategies to reduce such impacts [7,8,9].
Portugal has a limited network with long-term temperature records, which makes it challenging to analyse the country’s historical climate trends, including heatwaves [10]. However, the use of reanalysis data—such as ERA5 and ERA5-Land reanalysis datasets, the latter containing finer-scale information of land surface component over several decades [11,12]—can provide valuable information for climate analysis and modelling. Recent studies have demonstrated the potential of the ERA5-Land dataset for heatwave analysis and monitoring in Europe, highlighting its ability to capture the spatial and temporal patterns of extreme hot temperatures with high accuracy and reliability [13,14]. Moreover, the ERA5-Land dataset has been used to assess the impacts of heatwaves on various sectors such as agriculture [15], human health [16], and energy demand [17], among others.
By using the ERA5-Land dataset for temperature analysis in Portugal, it is possible to overcome shortcomings present in conventional ground-based datasets, including limited spatial coverage and potential missing records. For instance, Pires et al. [18] found that the ERA5-Land dataset provided more spatially precise and in-depth information on temperature variability than standard datasets when they used it to evaluate heatwaves in Portugal. Similarly to this, ERA5-Land data were utilised in a study by Vieira et al. [19] to examine the geographical and temporal patterns of heatwaves in Portugal, and discovered that the dataset offered a more full picture of heatwave variability throughout the nation. Another study by Teixeira et al. [20] examined the spatiotemporal patterns of heatwaves and their effects on energy consumption in Portugal using ERA5-Land data. They discovered that the dataset offered an accurate picture of temperature variability across the country.
In addition, the understanding of the mechanisms causing heatwaves in Portugal can be improved with the use of reanalysis datasets such as ERA5-Land. For instance, a study by Barriopedro et al. [21] used ERA-Interim data to examine the atmospheric circulation patterns related to the 2003 heatwave in Europe and discovered that the event was primarily caused by anomalous atmospheric blocking over the area. Similar to this study, Sousa et al. [22] examined the mechanisms causing heatwaves in Portugal using ERA5-Land data and found that these occurrences are frequently linked to persistent high-pressure systems over the Iberian Peninsula. In general, the use of reanalysis datasets, including ERA5-Land, can offer insightful knowledge about the spatiotemporal patterns and probable causes of heatwaves in Portugal. Most research on heatwaves in Portugal to date has been based on gridded temperature datasets such as E-OBS [6] and WorldClim [23], as well as traditional temperature datasets including ground-based observations [9,24]. Particularly in regions with complex topography, as is the case in Portugal, these databases have limitations in terms of spatial and temporal resolution, as well as data quality and availability. The ERA5-Land dataset, in contrast, provides a number of benefits, including high spatiotemporal resolution and broad spatial coverage, which makes it an appealing substitute for analysing temperature variability and extreme occurrences [11,25,26].
Despite the potential advantages of the ERA5-Land dataset, Portugal’s use of it for heatwave studies is still limited. The ERA5-Land dataset has been utilised in a few studies to analyse temperature variability and trends over Portugal, as mentioned, but its application to the research and monitoring of heatwaves has not been thoroughly investigated. Therefore, it is necessary to evaluate the suitability of the ERA5-Land dataset for heatwave analysis in Portugal, particularly with regard to its capacity to capture the spatial and temporal patterns of periods with sustained extremely hot temperatures and to provide, in turn, accurate information to develop practical adaptation and mitigation strategies. This paper aims to fill this knowledge gap by providing a comprehensive analysis of heatwaves in Portugal and encouraging the use of an alternative high-resolution temperature dataset, namely, the ERA5-Land dataset.
Given the context briefly outlined, this study offers a thorough analysis of heatwaves in mainland Portugal, employing high-resolution daily temperature data from the ERA5-Land reanalysis dataset. The accuracy of ERA5-Land temperature estimates is validated through a comparison with traditional temperature datasets. The specific objectives are twofold: (i) to validate ERA5-Land estimates by comparing them with ground-based temperature records from the Portuguese Institute for Sea and Atmosphere (IPMA), known for its stringent data quality standards and reputation as the most reliable source of Portuguese hydrological and hydrometeorological data; and (ii) to characterise the spatiotemporal patterns of extremely high temperatures, focusing on heatwaves involving both daily minimum and maximum temperatures (Tmin and Tmax, respectively) in Portugal. These heatwaves are characterised using the ERA5-Land data.
2. Study Area
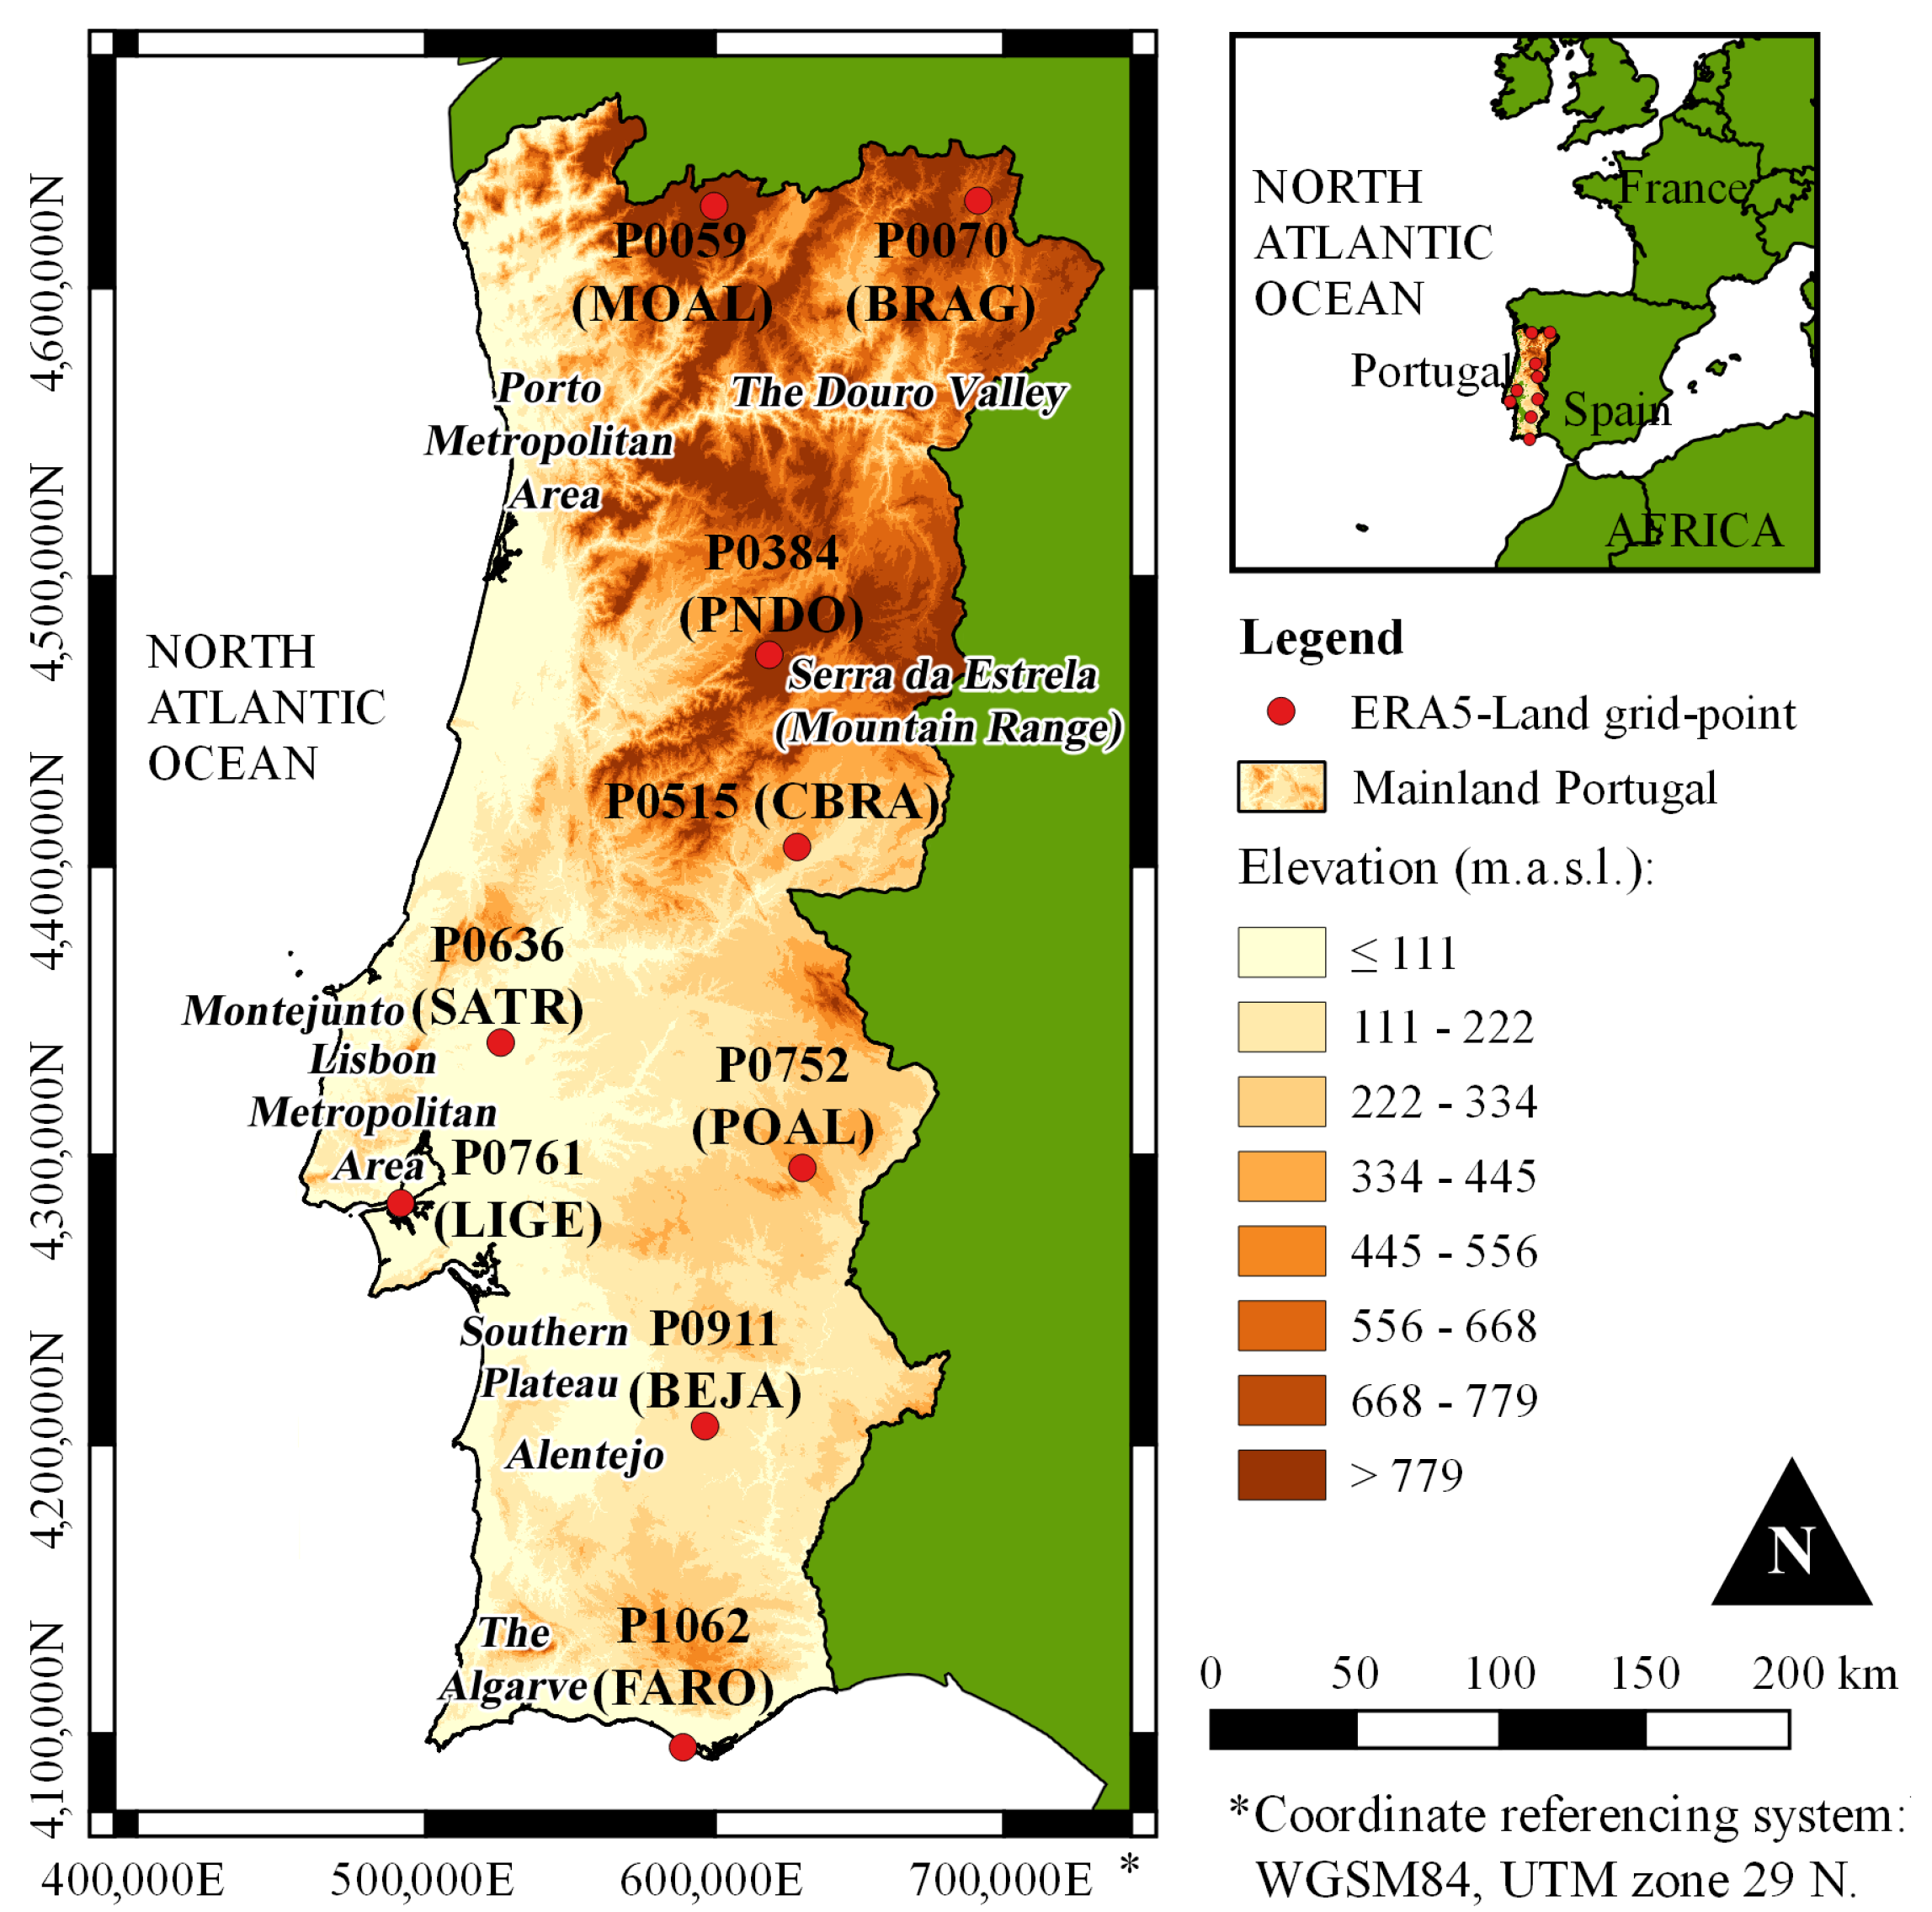
Mainland Portugal covers an area of approximately 92,000 km2 and is located in the southwest of Europe, sharing borders with Spain to the north and east and bordered by the North Atlantic Ocean to the west and south. Notably, Portugal is home to rivers such as the Vouga, Sado, Zêzere, and Mondego, with the latter two originating in the Serra da Estrela. This mountain range harbours mainland Portugal’s highest peak, the Torre, reaching an altitude of 1993 m above sea level (m.a.s.l.), as depicted in Figure 1. The country has a population of around 10.37 million people [27]. Portugal’s climate is broadly classified as Mediterranean, characterised by hot and dry summers, as well as moderate and rainy winters [28]. Furthermore, in accordance with an updated Köppen–Geiger classification for Portugal throughout the period from 1980 to 2016 [29], the majority of the mainland territory exhibits a temperate continental climate classified as Type C, as illustrated in Figure 2. This classification encompasses two main varieties: Csa, which represents a temperate climate with warm summers and arid conditions in interior regions such as the Douro Valley, as well as in areas to the south of the Montejunto-Estrela mountain range; and Csb, indicating a temperate climate with dry and mild summers, prevalent across nearly all regions of the northern Montejunto-Estrela mountain system and the western coastal areas of the Algarve. Note that the climate classification map featured in Figure 2 has been extracted for mainland Portugal. This process involved using global Köppen–Geiger maps, available in the European Environmental Agency portal [30], derived by Beck et al. [29] from distinct climatic datasets for air temperature and precipitation (e.g., WorldClim V1).
High seasonality is a characteristic feature of Portugal. The mean annual temperature ranges between 12.00 °C and 18.00 °C, with the southern coastal areas experiencing the highest values while the northern highland regions exhibit the lowest temperatures. The study area encounters high summertime temperatures—a crucial aspect in understanding heatwaves. These phenomena frequently occur in Portugal during the summer due to high-pressure systems that draw in hot, dry air masses from North Africa. These events can have a substantial impact on ecosystems, agriculture, and human health, and are common in the interior regions of the country, where temperatures can reach up to 45.00 °C [19].
Portugal’s annual rainfall varies greatly from region to region, with notable differences between the north and south of the country. The southern regions are dryer, with some locations receiving less than 500 mm of rainfall, while the northern parts are typically wetter, with mean annual precipitation surpassing 2500 mm in some areas [28]. Typically, July and August are the driest months, while November and January are the wettest. Due to Portugal’s high relief and temporal rainfall variability, there are frequent droughts, especially in the southern regions, which may have a negative influence on ecosystems, agriculture, and water resources [31]. Mountains, plateaus, and coastal plains are among the several types of landscapes that define Portugal’s landscape. The topography of the country has a significant impact on the climate and weather patterns, with coastal lowlands experiencing more moderate temperatures and greater exposure to marine air masses, while mountains and plateaus in some regions have higher levels of rainfall [32].
3. Materials and Methods
In this research, high-resolution ERA5-Land daily temperature data were analysed to study heatwaves in Portugal over a 41-hydrological-year period from 1 October 1980 to 30 September 2021. The new ERA5-Land reanalysis, widely acknowledged as a reliable proxy for replicating mean and extreme temperatures across Europe, and created by incorporating the land component of ERA5 [33], is freely provided by the Copernicus Climate Change Service (C3S). With a higher spatial resolution of 0.1 × 0.1 degrees, this dataset enabled the estimation of various meteorological variables, such as temperature and rainfall [34]. For the analysis, daily minimum and maximum temperature data from ERA5-Land at nine climatological locations in Portugal were fetched, namely, the grid-points: P0059, P0070, P0384, P0515, P0636, P0752, P0761, P0911, and P1062—as depicted in Figure 1. The selection of locations aimed to enhance the comprehensive understanding of heatwave occurrences in Portugal by considering diverse topographical areas and climate patterns. However, this was constrained by the limited availability of conventional ground-based daily records. Prior to using the reanalysis data for analysing heatwaves, it was necessary to validate or cross-reference the reanalysis with temperature records to a certain extent.
A comparison between this reanalysis dataset and the records from the Portuguese Institute for Sea and Atmosphere (IPMA), the country’s main meteorological institute, was carried out to validate the accuracy of the ERA5-Land temperature data at the prior grid-points. For that purpose, the nearest IPMA meteorological stations to the nine ERA5-Land locations were identified and selected, namely, from north to south, as shown in Figure 1 and Figure 2 (for each station, name, acronym, and, in brackets, the distance to the closest grid-point):
- Montalegre, MOAL (2.37 km from P0059);
- Bragança, BRAG (2.78 km from P0070);
- Penhas Douradas, PNDO (4.61 km from P0384);
- Castelo Branco, CBRA (4.67 km from P0515);
- Santarém, SATR (2.84 km from P0636);
- Portalegre, POAL (3.07 km from P0752);
- Lisboa Geofísico, LIGE (2.65 km from P0761);
- Beja, BEJA (3.53 km from P0911);
- Faro, FARO (3.49 km from P1062).
The currently available IPMA temperature records extend only up to December 2018, with only one station having daily records in the Lisbon area. To assess the accuracy of the ERA5-Land data, a monthly-level comparison of the two datasets was conducted. This comparison included the creation of boxplot graphs, the calculation of Pearson’s linear correlation coefficient (r), and the identification of the centroids of long-term monthly descriptor plots, all spanning a common 39-year period from January 1980 to December 2018. Consequently, these techniques were employed to provide a comprehensive evaluation of the accuracy of ERA5-Land temperature data.
3.1. Heatwave Magnitude Index
Considering the available temperature data, the heatwave magnitude index (HWMI) was employed to address heatwaves. The HWMI, as proposed by Russo et al. [35], is characterised by the maximum magnitude of heatwaves within a year. In this context, a heatwave is defined as a period of three or more consecutive days with temperatures exceeding a threshold. This temperature threshold, denoted as , is determined as the 90th percentile of daily maximum temperatures, calculated over a 31-day window. Therefore, for any given day d, the threshold series within the dataset is expressed by Equation (1):
where ⋃ denotes the union of sets and is the daily temperature of day i in year y. The analysis was conducted for a 41-hydrological-year period from 1 October 1980 to 30 September 2021, using the Tmin and Tmax data from the ERA5-Land data. However, to obtain , the daily temperature ERA5-Land data in the 15-day period before 1 October 1980 and after 30 September 2021 were used. The days with temperatures above meeting the aforementioned criteria were considered as heatwave days.
3.2. Frequency Analysis of Heatwave Days during a Year
To further investigate the frequency of Tmin and Tmax heatwave occurrences, a kernel rate estimation method, namely, the Kernel Occurrence Rate Estimator (KORE) nonparametric method presented in Silva [36] and Silva et al. Silva et al. [37] was used. The KORE is a nonparametric method for smoothing point process and has also been used for the occurrence of other extreme hydrological events—e.g., droughts and heavy rainfall [38,39]. In this application, the KORE was used on the dates of occurrence of the heatwave days along the analysed 41-year period, providing time-dependent estimated occurrence rate curves, . The bandwidth considered when computing the KORE followed Silverman’s rule of thumb [40]. To eliminate the boundary bias due to the nonexistence of Tmin and Tmax data outside the analysed period, pseudodata covering an amplitude of 3 times the bandwidth before and after that period was generated by the straightforward method of reflection before estimating . To quantify the uncertainties associated with the frequency estimate, a pointwise confidence band was constructed around by means of bootstrap resampling [41]. Numerous hydroclimatic phenomena, including floods, droughts, and heatwaves, have been studied using this methodology. The analysis of non-stationary data, as is frequently the case for hydroclimatic events, suits itself particularly well to the KORE approach. Non-stationarity in heatwaves can be caused by a number of things, including shifts in land use, urbanisation, and climate change.
3.3. Methodology in a Snapshot
In summary, this study involved retrieving high-resolution daily temperature data from ERA5-Land. Nine ERA5-Land locations, also referred to as grid-points, were selected based on their representation of Portugal’s climate diversity, taking into consideration the available IPMA records. The analysis then unfolded in the two main parts described next.
- Firstly, ERA5-Land temperature data were validated against IPMA ground-based records at a monthly scale over a common 39-year period from January 1980 to December 2018. This validation process involved:
- –
- Utilising monthly boxplot graphs, Pearson’s linear correlation coefficient, and long-term mean and standard deviation line plots.
- –
- Calculating the root mean square error (RMSE) for the long-term line plots.
- Secondly, the identification and analysis of heatwave frequency were based on ERA5-Land daily data from 1 October 1980 to 30 September 2021. This was achieved by:
- –
- Employing the Heatwave Magnitude Index (HWMI) to establish temperature thresholds and identify heatwaves for the daily Tmin and Tmax data.
- –
- Using the Kernel Occurrence Rate Estimator (KORE) method to examine the frequencies of Tmin and Tmax heatwaves, along with confidence bands.
4. Results
In this study, the ERA5-Land reanalysis data were utilised to assess daily climatological anomalies, namely temperature, and to subsequently evaluate heatwave events across Portugal from 1 October 1980 to 30 September 2021. However, the reliability of reanalysis data across temporal and spatial scales required prior assessment for adjusting ground-based data.
4.1. Validation of ERA5-Land Temperature Data
To ensure the accuracy of the ERA5-Land temperature data, a comprehensive descriptive analysis was initially performed at the monthly level. This analysis involved comparing the ERA5-Land reanalysis data with the temperature records obtained from IPMA. The accuracy of the ERA5-Land data was evaluated in the longest common period of 39 years, spanning from January 1980 to December 2018. The comparison was performed using temperature data from the nine coupled IPMA meteorological stations and ERA5-Land grid-points: Montalegre, MOAL–P0059; Bragança, BRAG–P0070; Penhas Douradas, PNDO–P0384; Castelo Branco, CBRA–P0515; Santarém, SATR–P0636; Portalegre, POAL–P0752; Lisboa Geofísico, LIGE–P0761; Beja, BEJA–P0911; and Faro, FARO–P1062. The reliability and robustness of the ERA5-Land temperature data were comprehensively assessed by the metrics mentioned in Section 3, providing a complete understanding of the suitability and accuracy of the ERA5-Land temperature data for further heatwave analysis.
Boxplots of monthly values (1980–2018) for both minimum and maximum temperatures (Tmin and Tmax) are depicted in Figure 3 and Figure 4, respectively, with distinction made for five Portuguese major administrative regions [28]. Each boxplot in the figures consists of various components that provide insights into the distribution and variation of the monthly temperature values. The central box within the plot represents the interquartile range (IQR), which spans the middle 50% of the data. It gives information about the dispersion of the data and is a measure of the data’s spread around the median. The median, indicated by a notch within the box, represents the middle value of the dataset, which is a useful measure to understand the central tendency of the temperatures. The whiskers extending from the box represent the maximum and minimum non-remote values. These values show the range within which the majority of the data falls, excluding outliers. However, no outliers (data points outside the whiskers in this case) were detected with the adopted approach.
Based on the previous boxplot graphs, each location had a different IQR for Tmin and Tmax. In terms of Tmin, the coupled BRAG–P0070, PNDO–P0384, CBRA–P0515, and POAL–P0752 displayed a broader IQR, indicating a wider temperature range and greater variability. A narrower IQR was seen in SATR–P0636, P0761–LIGE, and P1062–FARO, indicating a more consistent temperature distribution. The mean monthly values between January 1980 and December 2018 differed slightly depending on the source. For instance, the average Tmin monthly values ranged from 5.85 °C to 13.74 °C for the IPMA records, while, for the ERA5-Land data, the range was higher, ranging from 6.05 °C to 15.14 °C. Some differences were also observed in the average Tmax monthly values. However, the IPMA records were able to capture higher temperatures, ranging from 13.58 °C to 23.02 °C, while the ERA5-Land mean was 14.65 °C to 22.60 °C. The results indicate a spatial “smoothing” effect of ERA5-Land gridded data compared to IPMA point data. When transitioning between datasets, this effect often leads to slightly higher Tmin values and somewhat lower Tmax values, particularly visible in coastal grid-points (e.g., LIGE-P0761 and FARO-P1062, see Figure 1). In any case, the mean was higher than the median, which is typical of positively skewed distributions. In the case of Penhas Douradas (PNDO–P0384), the mean was up to 1.42 °C higher. Montalegre (P0059–MOAL) exhibited the largest temperature range for both Tmin and Tmax, as indicated by the whiskers in the graphs, suggesting the presence of extremely high temperature values.
Figure 5 shows scatter plots of monthly temperature between IPMA records and reanalysis data. Both for Tmin and Tmax, all of the meteorological stations exhibit a highly positive Pearson’s linear correlation coefficient (r, ) with ERA5-Land data—ranging from 97.8% (POAL–P0752) to 99.4% (CBRA–O0515) for Tmin and from 98.3% (MOAL–P0059) to 99.7% (CBRA–O0515) for Tmax. In this regard, ERA5-Land effectively reproduces the temporal variability in monthly temperature. However, the correlations between the variables appear relatively weaker when considering the annual means. For example, the correlation coefficient (r) for the annual Tmin (in calendar years from January to December) ranged from 69.5% (PNDO–P0384) to 88.3% (CBRA–P00515). In the case of annual Tmax, the correlation coefficients ranged from 38.0% (PNDO–P00384) to 94.0% (BGCA–P0070). These variations in correlation coefficients indicate a more pronounced decrease in the annual temperature relationship, particularly for Tmax. Despite these results, due to the presence of some missing data for some months in the IPMA records, it was not possible to establish a clear relationship between the temperature datasets at the annual level. For example, in the year 2014, the PNDO station only had Tmax monthly records in August, September, and October. This limitation in observational data availability during that particular year could have potentially disrupted the relationship between PNDO and its corresponding grid-point.
The long-term mean line plots depicted in Figure 6 and Figure 7 provide further validation. These line plots were generated by averaging the 39 monthly values in each respective time series, excluding entries with missing data. Additionally, centroids, or centres of mass, were calculated both vertically and horizontally to summarise the temporal and temperature alignments between the datasets. It is important to note that, although the heatwave analysis was conducted based on hydrological years, the figures were constructed using calendar years, emphasising this distinction. The lines in Figure 6 indicate that the long-term pattern of the mean monthly Tmin is consistent regardless of the dataset, with the lowest Tmin occurring in January and the highest in August. However, in Figure 6i, the mean monthly Tmin at P1062 (ERA5-Land) is approximately 2.00 °C higher than FARO (IPMA) during the winter period (from October of one year to March of the next). The centroids for Tmin are located between July and August, with some time lag in P0761 and P1062, presumably as a result of the spatial “smoothing” effect previously described.
For the mean monthly Tmax (Figure 7), some discrepancies exist among the baseline data, except for the paired CBRA–P0515 line plots, which show almost identical patterns. The IPMA records consistently display higher temperatures than the ERA5-Land dataset, particularly in LIGE and FARO. The IPMA records are on average around 2.40 °C higher than their corresponding grid-point values during the dry period. Overall, the centroids for the coupled time series of Tmin and Tmax indicate that, despite temperature discrepancies (vertical axis), the monthly ERA5-Land data and IPMA records exhibit good agreement in terms of temporal patterns (horizontal axis), indicating a close temporal association.
Analogously, the long-term standard deviation ratio (SDR) of monthly Tmin and Tmax was calculated as shown in Figure 8 and Figure 9, respectively. The linear correlation between standard deviations of monthly observational data and reanalysis data was considered to assess the consistency of their interannual variability. For Tmin (Figure 8), the lowest SDR correlations were identified for the pairs PNDO-P0384 (r of −21.8%) and CBRA-P0515 (r of 33.8%), while the highest SDR correlations were found for LIGE-P0761 (r of 85.1%) and SATR-P0636 (r of 95.4%). The r values for the long-term Tmax SDR (Figure 8) were highly positive, ranging from 89.6% at PNDO-P0384 to 98.5% at CBRA-P0515, with other pairs showing very high correlation, such as POAL-P0752 and LIGE-P0761 with . These results, along with the comparison of long-term mean monthly temperatures, provide further evidence that the ERA5-Land data successfully captures the monthly deviation from the average for both Tmin and Tmax, with better performance observed for Tmax.
The characterisation of uncertainty for ERA5-Land using the Ensemble of Data Assimilations (EDA) system differs from the conventional notion of error in relation to the ERA5-Land reanalysis product [12]. Nevertheless, the root mean square error (RMSE) for the long-term monthly mean and SDR were computed. In terms of Tmin (Figure 7), the lowest RMSE value was 0.33 °C for the PNDO–P0384 pair, while the highest, 1.58 °C, was observed at the coastal location FARO–1062. For Tmax (Figure 8), FARO–1062 displayed the highest RMSE (2.22 °C) and the pair CBRA–P0515 had the lowest value (0.34 °C). When considering the Tmin STD (Figure 9), the minimum RMSE was recorded for MOAL–P0059 (0.10 °C), whereas the highest (0.43 °C) was observed for the interior location POAL–P0752.
For Tmax STD (Figure 9), central location CBRA–P0515 exhibited the lowest RMSE (0.09 °C), while the Alentejo location SATR–P0636 had the highest RMSE (0.37 °C). These calculations offered a quantitative assessment of the generally low discrepancies between IPMA records and ERA5-Land estimates for various temperature metrics and locations, further validating the ERA5-Land dataset for use in heatwave analysis.
4.2. Heatwave Magnitude Index (HWMI) Calculation
Following the validation of the ERA5-Land dataset, this study investigates heatwaves using the heatwave magnitude index (HWMI) applied to the daily temperature dataset at each of the nine grid-point locations. Equation (1) determines the daily temperature thresholds, , for the 41-year reference period spanning from 1 October 1980 to 30 September 2021 (Figure 10). The daily Tmin thresholds (Figure 10a) reveal three distinct patterns across the grid-points. Lower temperature thresholds are observed in the northern and parts of the central regions (P0059, P0070, and P0384), intermediate thresholds in parts of Central Portugal and Alentejo (P0515, P0636, P0752, and P0911), and higher thresholds closer to the coastal areas of the Lisbon area and the Algarve (P0761 and P1062). Similarly, for the Tmax thresholds (Figure 10b), lower temperature thresholds are found in the northern and central grid-points (P0059, P0070, and P0384), higher thresholds in the grid-points in Central Portugal and Alentejo (P0515, P0636, P0752, and P0911), and intermediate Tmax thresholds for coastal locations P0761 and P1062.
4.3. Analysis of Heatwave Frequency for Tmin and Tmax
For each of the nine grid-points, an average of 1400 hot days and 680 heatwave days were detected for Tmin during the 14,965 days from 1 October 1980 to 30 September 2021 (excluding leap year days). Similarly, for Tmax, 1354 hot days and 807 heatwave days were identified. It is important to note that hot days are not necessarily heatwave days. A hot day is defined as any day with a temperature higher than the threshold , regardless of whether it occurs consecutively or sporadically. Out of the analysed days, hot days represent 9.4% for Tmin and 9.0% for Tmax, whereas the heatwave days account for 4.5% and 5.4% for Tmin and Tmax, respectively. The frequency analysis results, depicted in Figure 11 and Figure 12, include vertical ticks on the horizontal axis indicating the dates of occurrence of heatwave days.
Among the grid-points, P0752 (near Portalegre, POAL) recorded the lowest number of hot days for Tmin, with 1361 days, while P0636 (in the vicinity of Santarém station, SATR) had the highest number, with 1441 days. For Tmax, the lowest number of hot days was observed at the grid-point P1062 (near Faro station, FARO), with 644 days, and the highest number was recorded at P0636 (SATR), with 916 days. Similarly, the occurrence of heatwave days showed spatial variability. The grid-point P1062 (FARO) had the lowest number of heatwave days for both Tmin (642 days) and Tmax (1304 days). On the other hand, the grid-points P0761 (close to Lisboa Geofísico station, LIGE) and P0636 (SATR) had the highest number of heatwave days, with 716 for Tmin and 1401 for Tmax, respectively. These variations in the number of hot days and heatwave days across different grid-points demonstrate the spatial heterogeneity of temperature extremes.
The results obtained from the Kernel Occurrence Rate Estimator (KORE), applied to the validated daily ERA5-Land temperature data—shown in Figure 11 and Figure 12—reveal temporal variations in the frequency of heatwave days over the 41-year period considered in this study. In the figures, the vertical black ticks positioned above the horizontal axis represent the dates when three or more consecutive days with Tmin or Tmax surpass the threshold from Figure 10, signifying the occurrence of heatwave days. These ticks serve as the main input for the KORE estimations, which analyse the frequency of heatwave occurrences.
The understanding of the spatiotemporal distribution of heatwave days is facilitated by the application of KORE. Insights into the occurrence patterns across different grid-points can be obtained through the analysis of values for Tmin. Amongst the grid-points, the highest number of Tmin heatwave days occurred at P0384 (Figure 11c) during the hydrological years 2019/2020 and 2020/2021, with an average of approximately 30 occurrences per year. This grid-point experienced a notable increase in heatwave days during this period. P0515 and P0384 exhibited a considerable frequency of 27 Tmin heatwave days per year, closely following behind the grid-point with the highest occurrence. An upward trend in the occurrence of Tmin heatwave days was observed as we moved towards the central grid-points (e.g., P0636, P0752, and P0761). However, the increase in heatwave events was relatively less pronounced for P0761 (LIGE), where an average of approximately 20 occurrences per year was observed (Figure 11g). This suggests that, while there was an increase in heatwave events in central regions, the magnitude of this change was relatively moderate compared to other grid-points. At P0911 (Figure 11h), the value of remained relatively low during the first few years, with fewer than 15 heatwave days per year. However, starting from the year 2000/2001, there was a steady increase, with the frequency of heatwave occurrences more than doubling. Similarly, at P1062 (Figure 11i), the value of remained low throughout the 1980/1981 to 1990/1991 period, with fewer than nine heatwave days per year. In recent years, there has been a significant increase, with the frequency surpassing 20 occurrences annually, indicating a notable change in the heatwave frequency at this southern grid-point.
Regarding Tmax, the analysis of ERA5-Land temperature data via the coupled HWMI and KORE revealed a significant increase in the frequency of heatwave days. In general, the results shown in Figure 12 indicate a steady increase in the number of heatwave days over time, with an apparent positive trend observed in the most recent decade. Yet, the nine series in the figure exhibit distinct patterns of development, providing evidence of spatiotemporal variability in the occurrence of Tmax heatwaves across Portugal. The maximum in heatwave days per year was ca. 28, 32, and 31 at the most northern grid-points P0059, P0070, and P0384, respectively. The maximum in the rest of the locations ranged from 24 (P0761 in the Lisbon area) to 30 (P0752 in the Portalegre municipality) yearly occurrences. Notably, at all the reanalysis locations, the peak of occurred between 2017/2018 and 2018/2019, coinciding with the historic heatwave that struck Portugal in August 2018 [42]. This finding highlights the significant impact of this extreme weather event on the frequency of heatwaves in the ERA5-Land locations.
5. Discussion
Valuable insights into the frequency and spatial patterns of heatwave events in Portugal are provided by the findings of this study, utilising the ERA5-Land reanalysis daily data from 1 October 1980 to 30 September 2021. A reasonably good agreement between the datasets, both in terms of their central tendency and interannual variability, was demonstrated through the validation of the ERA5-Land temperature data (carried out from January 1980 to December 2018) using the ground-based temperature observations from the Portuguese Institute for Sea and Atmosphere (IPMA). This agreement provides confidence in the use of the ERA5-Land data for analysing heatwave events in Portugal.
The analysis of yearly heatwave frequency revealed a clear increasing trend in the annual occurrence of heatwaves across Portugal over the past four decades. This trend suggests a potential impact of climate change on heatwave occurrences in the country. Additionally, substantial interannual variability in the frequency of heatwave events indicates the influence of short-term climate variability on heatwave occurrences. The examination of spatial patterns demonstrated a geographically heterogeneous distribution of heatwave events in Portugal. Particularly, the central and southern regions of the country, such as P0752 (Portalegre) and P0911 (Beja), exhibited a significant increase in the average frequency of heatwave days. These findings emphasise the need for location-specific analyses and consideration of regional climatic differences when studying heatwave events.
5.1. The Use of Reanalysis Data over Temperature Records
The good agreement between ERA5-Land temperature data and the IPMA records is consistent with previous studies that have assessed the quality of reanalysis datasets. For example, the evaluation of a downscaled ERA5 surface temperature dataset over another country in Mediterranean Europe by Adinolfi et al. [43] revealed a high level of agreement with several independent observational datasets and reanalysis products. This agreement between different studies supports the reliability of the ERA5-Land data and its utilisation in the analysis of heatwave events in Portugal.
The understanding of the performance of reanalysis data in capturing temperature patterns and the potential influence of climate change on heatwave occurrences is enhanced by comparing the results of the study with other research. A similar analysis of heatwave events in Spain using the ERA-Interim reanalysis dataset was conducted by Johnson et al. [44]. A consistent increase in the frequency of heatwaves was observed, which aligns with the findings in Portugal (e.g., Figure 11 and Figure 12). This correspondence suggests a common regional climate trend and highlights the potential influence of climate change on heatwave occurrences in the Iberian Peninsula. Furthermore, the examination of spatial patterns revealed a heterogeneous distribution of heatwave events across Portugal, which is consistent with the findings of Garcia et al. [45]. Heatwaves in southern Europe were analysed using the ERA-Interim reanalysis data, and pronounced regional variations in heatwave frequencies were observed. The study provides similar evidence for Portugal, emphasising the importance of location-specific analyses and considering regional climatic differences when studying heatwave events [45]. To further validate the results obtained using the ERA5-Land data, comparing them with independent datasets and methodologies is valuable. Heatwave events in Europe were analysed by Chen et al. [46] using satellite-derived land surface temperatures and a consistent increasing trend in heatwave occurrences was found. By comparing the findings with the results based on reanalysis data, the robustness of the observed increasing trend in heatwaves and its potential association with climate change can be confirmed.
The implications of using reanalysis data for climate change adaptation and mitigation strategies are significant. The increasing trend in heatwave occurrences identified in the study emphasises the urgency of implementing measures to protect vulnerable populations and enhance the resilience of infrastructure and ecosystems to extreme heat events. The spatial patterns of heatwave events can inform targeted interventions and planning efforts at the regional level, enabling the allocation of resources and adaptive strategies in areas most affected by the phenomena. However, it is important to acknowledge the limitations associated with using reanalysis data in place of direct meteorological observations. Reanalysis products are generated through data assimilation techniques, which combine various observations with numerical models to create a comprehensive representation of the climate system. Uncertainties can arise from the assimilation process, model biases, and the spatial and temporal resolution of the data [33]. Efforts have been made to improve the accuracy and reliability of reanalysis datasets. The transition from ERA-Interim to ERA5-Land represents a significant advancement in data quality and resolution. The improvements in ERA5-Land compared to its predecessor, including enhanced representation of land surface processes, improved handling of precipitation, and higher spatial and temporal resolution, have been discussed by Hersbach et al. [33]. These advancements contribute to increased confidence in the ERA5-Land data and its suitability for climate analysis.
5.2. Comparing Heatwaves in Portugal and Other Parts of Europe
The analysis based on the nine ERA5-Land grid-points in Portugal offers important insights into the spatial distribution and frequency of heatwave days, despite its pure statistical approach to temperature data series. According to Parente et al. [47], additional elements, including regional climate, land use, and the effects of urbanisation, must be taken into account in order to have a complete understanding of the country’s heatwave occurrences. When comparing the data from Portugal’s nine ERA5-Land grid-points to those from other European regions, it is important to take local characteristics, geographic variances, and climate changes into account. Due to local climate patterns and geographic impacts, the frequency and characteristics of heatwave events may vary between different regions [48].
Numerous studies have looked into recent heatwaves in various parts of Europe, giving insights into their traits and patterns. For instance, Sanderson and Ford. [49] analysed the frequency and length of heatwave events in the United Kingdom and discovered an increasing trend. This research implies that heatwaves are becoming more frequent and lasting longer in the UK. In a similar manner, Fischer et al. [50] studied heatwave occurrences in Central Europe and found an upward trend in heatwave intensity and duration over the previous few decades. Their findings demonstrate how significantly climate change has affected this region’s heatwave characteristics. Even though the results for Portugal based on the nine ERA5-Land grid-points are localised, looking at heatwave occurrences in other European regions may assist in gaining a better understanding of heatwave dynamics and the implications for strategies for adapting to climate change [51].
5.3. Frequency of Heatwave Days Versus Hot Days
Evaluation of the influence of heatwave occurrences on regional extremes was achieved by applying the KORE technique to the HWMI at the different Portuguese locations. A better understanding of regional patterns during heatwave episodes was made possible by the KORE. This study uses the KORE to break down the regional differences and characteristics of heatwave occurrences. Making the distinction between hot days and heatwave days, as described by Russo et al. [35], is a crucial factor to take into account while analysing heatwaves. Days that meet particular temperature thresholds and length requirements are referred to as “heatwave days”, which include the highest temperature occurrences. However, hot days include a wider spectrum of high temperature events, including both heatwave days and sporadic increases in temperature.
Figure 13 demonstrates the application of the KORE method to illustrate its use with hot Tmax days as an example. Important differences can be seen when contrasting the results of applying the KORE to merely hot days versus Tmax heatwave days (Figure 12). The analysis focuses specifically on heatwave days, which represent the most extreme and prolonged heat events, making the scope of the present investigation more relevant. In fact, analysing heatwaves provides a more targeted assessment of the intensity and spatial patterns of heatwaves, as carried out in this research study. On the other hand, considering hot days, or all occurrences above a threshold such as the “tropical nights” [52,53,54], includes a broader range of high temperature events, which may dilute the focus on the most extreme and prolonged temperature hot events and thus higher values of as can be seen from the comparison of the two figures. Understanding the potential impacts of climate change on extreme temperature occurrences involves recognising the distinction between days belonging to heatwaves and hot days. The most severe heat events, which pose significant risks to ecosystems, infrastructure, and public health, are categorised as heatwave days [16,17].
In many parts of the world, including Portugal, the study of heatwaves is an emerging area of investigation within the field of climate change research [55]. Within this context, this study employed ERA5-Land reanalysis data to analyse heatwaves, overcoming the scarcity or near absence of publicly accessible and long-enough series of daily temperature records. The results indicate the dependable applicability of ERA5-Land reanalysis for temperature evaluations in Portugal, even though potential underestimations in Tmax when compared to IPMA records were discerned—particularly at the coastal sites P0761 and P1062, situated in the Lisbon Metropolitan Area and the Algarve, respectively. Consequently, when utilising this reanalysis dataset for extreme temperature events such as heatwaves, caution is advised due to the potential underestimation of Tmax, which could lead to an underestimated severity of such events. Similarly, remarks regarding the Tmax accuracy of reanalysis data have been documented in other contexts, such as an analysis of drought in an Ethiopian river basin [56]. In contrast, a study on drought and water budget analysis in India found a good performance of reanalysis-derived Tmax, with Tmin being the variable susceptible to underestimation [57]. Therefore, prior to using ERA5-Land data, regardless of the region, it is advisable to perform validation or at least compare the data with temperature records from other sources, such as climatological stations, when feasible.
By utilising alternative datasets rather than relying solely on ground-based records, the findings presented in this study enhance comprehension of potential shifts in the frequency, intensity, and distribution of heatwaves in Portugal. While this research pertains to a wider regional perspective, it specifically centres on the chosen Portuguese locations. Moving forward, a promising avenue for future research lies in exploring a regional case study within a more confined area than the mainland. This endeavour, once models are calibrated, holds the potential to offer valuable insights that can enrich the existing understanding of heatwave development.
6. Conclusions
The analysis of heatwave frequency for both Tmin and Tmax at the nine ERA5-Land grid-points in Portugal has yielded valuable insights into the spatiotemporal distribution of heatwave events spanning the 41-year period from 1 October 1980 to 30 September 2021. It is important to emphasise that the data from ERA5-Land holds significant potential for contributing to a deeper understanding of weather patterns, climate trends, and environmental shifts within Portugal. The findings reveal a consistent and overall increasing trend in the frequency of heatwaves, defined as periods of three or more consecutive days with temperatures surpassing the calculated threshold. This observation raises the possibility that climate change could be influencing the occurrence of heatwaves in Portugal. Concurrently, the analysis conducted across various locations illustrates substantial spatial heterogeneity in the occurrences of both hot days and heatwave days among the different grid-points. This heterogeneity underscores the impact of regional climatic disparities. Additionally, it is important to note that heatwave days and hot days do not always coincide, as a day exceeding the threshold does not necessarily qualify as a heatwave day.
In conclusion, this study provides important insights into the frequency and spatial patterns of heatwave events in Portugal, contributing to the understanding of climate change impacts and the probable development of adaptation and mitigation strategies. Further development in the study of heatwaves can be enhanced, among other ways, by exploring potential teleconnections to atmospheric patterns. Investigating how heatwave occurrences may be influenced by large-scale atmospheric circulation patterns, such as the North Atlantic Oscillation (NAO), can provide valuable insights into the drivers and variability of heatwaves in Portugal. These teleconnections may impact the frequency, duration, and intensity of heatwaves, offering a broader understanding of the mechanisms behind their spatiotemporal patterns [58]. Moreover, considering the influence of these atmospheric patterns can aid in predicting future heatwave events under a changing climate scenario, helping policymakers and local authorities develop more effective adaptation and mitigation strategies to address the growing challenges posed by extreme heat. By incorporating teleconnection analysis, researchers can establish a comprehensive framework to link local heatwave occurrences to larger-scale climate drivers, fostering a deeper comprehension of the factors influencing heatwaves in the region.
Author Contributions
Conceptualisation, L.A.E. and M.M.P.; methodology, L.A.E. and M.M.P.; software, L.A.E.; validation, L.A.E.; formal analysis, L.A.E. and L.M.M.F.; investigation, L.A.E.; resources, L.A.E. and M.M.P.; data curation, L.A.E. and L.M.M.F.; writing—original draft preparation, L.A.E.; writing—review and editing, L.A.E., M.M.P. and S.G.; visualisation, L.A.E.; supervision, M.M.P. All authors have read and agreed to the published version of the manuscript.
Funding
This research received no external funding.
Data Availability Statement
The datasets generated or analysed during the current study are available from the corresponding author L.A.E. on reasonable request.
Acknowledgments
This research was supported by the Foundation for Science and Technology (FCT) through funding UIDB/04625/2020 from the research unit CERIS and by the European Union’s Horizon 2020 research and innovation programme SCORE under grant agreement No 101003534.
Conflicts of Interest
The authors declare no conflict of interest.
References
- Robinson, P.J. On the definition of a heat wave. J. Appl. Meteorol. Climatol. 2001, 40, 762–775. [Google Scholar] [CrossRef]
- Perkins, S.; Alexander, L.; Nairn, J. Increasing frequency, intensity and duration of observed global heatwaves and warm spells. Geophys. Res. Lett. 2012, 39, L20714. [Google Scholar] [CrossRef]
- IPCC. Global Warming of 1.5 °C. An IPCC Special Report on the Impacts of Global Warming of 1.5 °C above Pre-Industrial Levels and Related Global Greenhouse Gas Emission Pathways, in the Context of Strengthening the Global Response to the Threat of Climate CHANGE, Sustainable Development, and Efforts to Eradicate Poverty; IPCC: Geneva, Switzerland, 2018. [Google Scholar]
- AA News. Extreme Heatwave in Portugal Caused 1063 Deaths; Anadolu Agency: Ankara, Türkiye, 2022. [Google Scholar]
- Wunderground. Heat Wave Smashes All-Time Heat Records in Portugal and Spain; Wunderground: Ann Arbor, MI, USA, 2018. [Google Scholar]
- Barriopedro, D.; Sousa, P.; Trigo, R.; García-Herrera, R.; Ramos, A. The exceptional Iberian heatwave of summer 2018. Bull. Am. Meteorol. Soc. 2020, 101, S29–S34. [Google Scholar] [CrossRef]
- Gouveia, C.M.; Liberato, M.L.; DaCamara, C.C.; Trigo, R.M. Assessing the impacts of extreme temperatures on population mortality in Lisbon during the heatwaves of 2004 and 2005. Environ. Sci. Pollut. Res. 2016, 23, 10159–10170. [Google Scholar]
- European Environment Agency. Europe’s Changing Climate Hazards—An Index-Based Interactive EEA Report; European Environment Agency: Copenhagen, Denmark, 2021.
- Ramos, A.M.; Russo, A.; DaCamara, C.C.; Nunes, S.; Sousa, P.; Soares, P.M.M.; Lima, M.M.; Hurduc, A.; Trigo, R.M. The compound event that triggered the destructive fires of October 2017 in Portugal. Iscience 2023, 26. [Google Scholar] [CrossRef] [PubMed]
- Barriopedro, D.; Fischer, E.M.; Luterbacher, J.; Trigo, R.M.; García-Herrera, R. The hot summer of 2003: A perspective from objective data. Clim. Chang. 2009, 102, 29–53. [Google Scholar]
- Hersbach, H.; Bell, B.; Berrisford, P.; Biavati, G.; Hor’anyi, A.; Mu noz Sabater, J.; Dee, D. ERA5-Land: A state-of-the-art global reanalysis dataset for land applications. Hydrol. Earth Syst. Sci. 2020, 24, 6483–6505. [Google Scholar]
- Yilmaz, M. Accuracy assessment of temperature trends from ERA5 and ERA5-Land. Sci. Total Environ. 2023, 856, 159182. [Google Scholar] [CrossRef]
- Bissolli, P.; Stepanek, P.; Fink, A.H.; Brönnimann, S.; Dobrovolný, P.; Liniger, M.A.; Seneviratne, S.I. Heatwaves over Central Europe in ERA5 and their links to large-scale circulation patterns. Weather Clim. Dyn. 2021, 2, 377–394. [Google Scholar]
- Dom’ınguez-Navarro, J.A.; Garcia-Herrera, R.; Barriopedro, D.; Trigo, R.M. An objective method for identifying heatwaves and cold spells in the ERA5 reanalysis. Weather Clim. Extrem. 2020, 30, 100293. [Google Scholar] [CrossRef]
- Ceglar, A.; Dentener, F.; Kurnik, B.; Butler, T.M. Assessment of the impact of extreme temperature and precipitation events on crop yields in Europe. J. Clim. 2020, 33, 4293–4313. [Google Scholar]
- Cuculeanu, V.; Kurnik, B.; Bissolli, P.; Dobrovolný, P.; Dentener, F.; Butler, T.M. Heatwaves and human health in Europe: A review. Sci. Total Environ. 2021, 757, 143811. [Google Scholar]
- Cuculeanu, V.; Kurnik, B.; Bissolli, P.; Dobrovolný, P.; Dentener, F.; Butler, T.M. Assessing the impacts of climate change on energy demand in Europe. Energies 2020, 13, 1275. [Google Scholar]
- Pires, C.A.; de Lima, M.I.P.; Miranda, P.M.A.; Cordeiro, C.F. Extreme hot temperature analysis in mainland Portugal: A case study using ERA5 data. Atmosphere 2020, 11, 590. [Google Scholar] [CrossRef]
- Vieira, V.B.; Russo, A.; Trigo, R.M. A new climatology of heatwaves in Portugal based on ERA5 data. Int. J. Climatol. 2021, 41, 1753–1765. [Google Scholar] [CrossRef]
- Teixeira, R.F.; Alcoforado, M.J.; Amraoui, M. Spatiotemporal analysis of heatwaves and their impacts on energy consumption in Portugal. Energy Build. 2022, 251, 111190. [Google Scholar] [CrossRef]
- Barriopedro, D.; Fischer, E.M.; Luterbacher, J.; Trigo, R.M.; García-Herrera, R. The hot summer of 2010: Redrawing the temperature record map of Europe. Science 2011, 332, 220–224. [Google Scholar] [CrossRef] [PubMed]
- Sousa, P.M.; Trigo, R.M.; Barriopedro, D.; Ramos, A.M.; Santo, F.E.; Pinto, J.G. Heatwaves in Portugal: Drivers, historical evolution and future projections. Reg. Environ. Chang. 2021, 21, 10. [Google Scholar]
- Fick, S.E.; Hijmans, R.J. WorldClim 2: New 1-km spatial resolution climate surfaces for global land areas. Int. J. Climatol. 2017, 37, 4302–4315. [Google Scholar] [CrossRef]
- Gouveia, C.M.; Bastos, A.; Trigo, R.M. Drought impacts on vegetation in the pre- and post-fire events over Portugal. Nat. Hazards Earth Syst. Sci. 2012, 12, 3123–3137. [Google Scholar] [CrossRef]
- Muñoz Sabater, J.; Hersbach, H.; Bell, B.; Berrisford, P.; Horányi, A.; Renshaw, R.; Dee, D. The ERA5-Land validation system. Hydrol. Earth Syst. Sci. 2021, 25, 469–482. [Google Scholar]
- Stepanek, P.; Miksovsky, J.; Mueller-Westermeier, G.; Haimberger, L. The ERA5-Land dataset: Version 1. A dataset of harmonized surface reanalysis products for land climate applications. Earth Syst. Sci. Data 2021, 13, 4349–4395. [Google Scholar] [CrossRef]
- The World Bank. The World Bank—Population, Total—Portugal Portugal. 2022. Available online: https://data.worldbank.org/country/PT (accessed on 1 May 2023).
- IPMA. The Portuguese Institute for Sea and Atmosphere, I. P. (IPMA, IP). 2023. Available online: https://www.ipma.pt/en/index.html (accessed on 1 February 2023).
- Beck, H.E.; Zimmermann, N.E.; McVicar, T.R.; Vergopolan, N.; Berg, A.; Wood, E.F. Present and future Köppen-Geiger climate classification maps at 1-km resolution. Sci. Data 2018, 5, 1–12. [Google Scholar] [CrossRef] [PubMed]
- EEA. The European Environment Agency: Present and Future Köppen-Geiger Climate Classification Maps at 1-km Resolution. 2021. Available online: https://www.eea.europa.eu/data-and-maps/data/external/koppen-geiger-climate-classification (accessed on 8 August 2023).
- Gouveia, C.M.; Russo, A.; Trigo, R.M.; DaCamara, C.C. The impacts of droughts in Portugal: A spatiotemporal perspective. Climate 2020, 8, 6. [Google Scholar] [CrossRef]
- Britannica. “Portugal”. Encyclopedia Britannica. 2023. Available online: https://www.britannica.com/place/Portugal (accessed on 28 April 2023).
- Hersbach, H.; Bell, B.; Berrisford, P.; Hirahara, S.; Horányi, A.; Muñoz-Sabater, J.; Nicolas, J.; Peubey, C.; Radu, R.; Schepers, D. The ERA5 global reanalysis. Q. J. R. Meteorol. Soc. 2020, 146, 1999–2049. [Google Scholar] [CrossRef]
- Muñoz-Sabater, J.; Dutra, E.; Agustí-Panareda, A.; Albergel, C.; Arduini, G.; Balsamo, G.; Boussetta, S.; Choulga, M.; Harrigan, S.; Hersbach, H. ERA5-Land: A state-of-the-art global reanalysis dataset for land applications. Earth Syst. Sci. Data 2021, 13, 4349–4383. [Google Scholar] [CrossRef]
- Russo, S.; Dosio, A.; Graversen, R.G.; Sillmann, J.; Carrao, H.; Dunbar, M.B.; Singleton, A.; Montagna, P.; Barbola, P.; Vogt, J.V. Magnitude of extreme heat waves in present climate and their projection in a warming world. J. Geophys. Res. Atmos. 2014, 119, 12–500. [Google Scholar] [CrossRef]
- Silva, A. Nonstationarity and Uncertainty of Extreme Hydrological Events. Ph.D. Dissertation, IST/UTL, Lisbon, Portugal, 2017. [Google Scholar]
- Silva, A.T.; Portela, M.; Naghettini, M. Nonstationarities in the occurrence rates of flood events in Portuguese watersheds. Hydrol. Earth Syst. Sci. 2012, 16, 241–254. [Google Scholar] [CrossRef]
- Espinosa, L.A.; Portela, M.M.; Rodrigues, R. Spatio-temporal variability of droughts over past 80 years in Madeira Island. J. Hydrol. Reg. Stud. 2019, 25, 100623. [Google Scholar] [CrossRef]
- Espinosa, L.A.; Portela, M.M.; Matos, J.P.; Gharbia, S. Climate Change Trends in a European Coastal Metropolitan Area: Rainfall, Temperature, and Extreme Events (1864–2021). Atmosphere 2022, 13, 1995. [Google Scholar] [CrossRef]
- Silverman, B.W. Monographs on statistics and applied probability. In Density Estimation for Statistics and Data Analysis; Chapman and Hall: London, UK, 1986; Volume 26. [Google Scholar]
- Mudelsee, M. The bootstrap in climate risk analysis. In Extremis; Springer: Berlin/Heidelberg, Germany, 2011; pp. 44–58. [Google Scholar]
- Sousa, P.M.; Barriopedro, D.; Ramos, A.M.; García-Herrera, R.; Espírito-Santo, F.; Trigo, R.M. Saharan air intrusions as a relevant mechanism for Iberian heatwaves: The record breaking events of August 2018 and June 2019. Weather Clim. Extrem. 2019, 26, 100224. [Google Scholar] [CrossRef]
- Adinolfi, M.; Raffa, M.; Reder, A.; Mercogliano, P. Investigation on potential and limitations of ERA5 Reanalysis downscaled on Italy by a convection-permitting model. Clim. Dyn. 2023, 1–24. [Google Scholar] [CrossRef]
- Johnson, R.; McGregor, G.; Pitman, A. Are anthropogenic heat emissions a significant influence on the spatial structure of heatwaves? Geophys. Res. Lett. 2017, 44, 12021–12029. [Google Scholar]
- Garcia, S.; Naranjo-Barrera, C.; Polo, J. Heatwaves in southern Europe: Synoptic patterns, climatology and trends in the second half of the 20th century. Int. J. Climatol. 2020, 40, 2136–2152. [Google Scholar]
- Chen, X.; Chen, D.; Xu, Y. Spatiotemporal patterns of heatwaves over China and their associations with large-scale atmospheric circulation and sea surface temperatures. Int. J. Climatol. 2021, 41, 3215–3229. [Google Scholar]
- Parente, J.; Pereira, M.G.; Amraoui, M.; Fischer, E.M. Heat waves in Portugal: Current regime, changes in future climate and impacts on extreme wildfires. Sci. Total Environ. 2018, 631–632, 534–549. [Google Scholar] [CrossRef] [PubMed]
- Horton, R.M.; Hall, J.; Hochrainer-Stigler, S.; Dadson, S. Changing risks of simultaneous global breadbasket failure. Nat. Clim. Chang. 2020, 10, 54–57. [Google Scholar]
- Sanderson, M.G.; Ford, G.P. Projections of severe heat waves in the United Kingdom. Clim. Res. 2016, 71, 63–73. [Google Scholar] [CrossRef]
- Fischer, E.M.; Knutti, R.; Schär, C. European heat waves in a changing climate. Clim. Chang. 2015, 132, 221–233. [Google Scholar]
- Schär, C.; Vidale, P.L.; Lüthi, D.; Frei, C.; Häberli, C.; Liniger, M.A.; Appenzeller, C. The role of increasing temperature variability in European summer heatwaves. Nature 2004, 427, 332–336. [Google Scholar] [CrossRef]
- Vincent, L.A.; Peterson, T.; Barros, V.; Marino, M.; Rusticucci, M.; Carrasco, G.; Ramirez, E.; Alves, L.; Ambrizzi, T.; Berlato, M.; et al. Observed trends in indices of daily temperature extremes in South America 1960–2000. J. Clim. 2005, 18, 5011–5023. [Google Scholar] [CrossRef]
- Data, C. Guidelines on Analysis of Extremes in a Changing Climate in Support of Informed Decisions for Adaptation; World Meteorological Organization: Geneva, Switzerland, 2009. [Google Scholar]
- Royé, D.; Ezpeleta, A.M. Analysis of tropical nights on the Atlantic coast of the Iberian peninsula. A proposed methodology. In Boletín de la Asociación de Geógrafos Españoles; Departamento de Geografía, Fundación DIALNET, Universidad de La Rioja (DIALNET Foundation from the University of La Rioja): Logroño, Spain, 2015; Volume 69, pp. 569–572. [Google Scholar]
- Marx, W.; Haunschild, R.; Bornmann, L. Heat waves: A hot topic in climate change research. Theor. Appl. Climatol. 2021, 146, 781–800. [Google Scholar] [CrossRef]
- Reda, K.W.; Liu, X.; Tang, Q.; Gebremicael, T.G. Evaluation of global gridded precipitation and temperature datasets against gauged observations over the Upper Tekeze River Basin, Ethiopia. J. Meteorol. Res. 2021, 35, 673–689. [Google Scholar] [CrossRef]
- Mahto, S.S.; Mishra, V. Does ERA-5 outperform other reanalysis products for hydrologic applications in India? J. Geophys. Res. Atmos. 2019, 124, 9423–9441. [Google Scholar] [CrossRef]
- Miloshevich, G.; Rouby-Poizat, P.; Ragone, F.; Bouchet, F. Robust intra-model teleconnection patterns for extreme heatwaves. arXiv 2023, arXiv:2306.11769. [Google Scholar] [CrossRef]
Figure 1.
Terrain map of mainland Portugal in metres above sea level (m.a.s.l.). Location of the nine ERA5-Land grid-points utilised for the analysis of heatwaves (from north to south, P0059–P1062). The nearest IPMA ground-based meteorological station to each of the nine grid-points is identified between brackets: Montalegre (MOAL), Bragança (BRAG), Penhas Douradas (PNDO), Castelo Branco (CBRA), Santarém (SATR), Portalegre (POAL), Lisboa Geofísico (LIGE), Beja (BEJA), and Faro (FARO).

Figure 2.
Köppen–Geiger classification for Portugal (1980–2016) at a 1 km resolution [29]. Location of the nine ERA5-Land grid-points utilised (from north to south, P0059–P1062) for the analysis of heatwaves and their nearest IPMA ground-based meteorological stations identified between brackets: Montalegre (MOAL), Bragança (BRAG), Penhas Douradas (PNDO), Castelo Branco (CBRA), Santarém (SATR), Portalegre (POAL), Lisboa Geofísico (LIGE), Beja (BEJA), and Faro (FARO).

Figure 3.
Boxplots of monthly Tmin between January 1980 and December 2018 at the coupled IPMA meteorological stations and ERA5-Land grid points, namely, from north to south: MOAL–P0059, BRAG–P0070, PNDO–P0384, CBRA–P0515, SATR–P0636, POAL–P0752, LIGE–P0761, BEJA–P0911, and FARO–P1062. Coastal locations are denoted with an asterisk (*).

Figure 4.
Boxplots of monthly Tmax between January 1980 and December 2018 at the coupled IPMA meteorological stations and ERA5-Land grid points, namely, from north to south: MOAL–P0059, BRAG–P0070, PNDO–P0384, CBRA–P0515, SATR–P0636, POAL–P0752, LIGE–P0761, BEJA–P0911, and FARO–P1062. Coastal locations are denoted with an asterisk (*).

Figure 5.
Scatter plots of monthly temperature data from January 1980 to December 2018 at the paired locations—IPMA (horizontal axis) and ERA-5 Land (vertical axis). A thick dashed line is placed at a 45° angle (aspect ratio of 13:7) for reference. Coastal locations are indicated with an asterisk (*).

Figure 6.
Line plots, from north to south, of the long-term mean monthly Tmin (continuous lines) and their centroids (bullets) in the 39-year period from January 1980 to December 2018 for the record–reanalysis pairs.
Figure 6.
Line plots, from north to south, of the long-term mean monthly Tmin (continuous lines) and their centroids (bullets) in the 39-year period from January 1980 to December 2018 for the record–reanalysis pairs.

Figure 7.
Line plots, from north to south, of the long-term mean monthly Tmax (continuous lines) and their centroids (bullets) in the 39-year period from January 1980 to December 2018 for the record–reanalysis pairs.
Figure 7.
Line plots, from north to south, of the long-term mean monthly Tmax (continuous lines) and their centroids (bullets) in the 39-year period from January 1980 to December 2018 for the record–reanalysis pairs.

Figure 8.
Line plots, from north to south, of the long-term standard deviation ratio (SDR) of monthly Tmin (continuous lines) in the 39-year period from January 1980 to December 2018 for the record–reanalysis pairs.
Figure 8.
Line plots, from north to south, of the long-term standard deviation ratio (SDR) of monthly Tmin (continuous lines) in the 39-year period from January 1980 to December 2018 for the record–reanalysis pairs.

Figure 9.
Line plots, from north to south, of the long-term standard deviation ratio (SDR) of monthly Tmax (continuous lines) in the 39-year period from January 1980 to December 2018 for the record–reanalysis pairs.
Figure 9.
Line plots, from north to south, of the long-term standard deviation ratio (SDR) of monthly Tmax (continuous lines) in the 39-year period from January 1980 to December 2018 for the record–reanalysis pairs.

Figure 10.
Daily temperature thresholds (dashed lines different to vertical ones), , for a given year throughout the period from 1 October 1980 to 30 September 2021 for (a) Tmin and (b) Tmax—at the nine ERA5-Land grid-point locations from Figure 1 and Figure 2.

Figure 11.
Time-dependent occurrence rates of Tmin heatwave days (1980–2021) at the nine ERA5-Land grid-points (between brackets, the closest meteorological station). Left y-axis: ERA5-Land daily Tmin values in dark blue. Right y-axis: the number of heatwave days per year, , in cyan blue; confidence band represented by the grey area around . Vertical ticks: the dates of heatwave days.

Figure 12.
Time-dependent occurrence rates of Tmax heatwave days (1980–2021) at the nine ERA5-Land grid-points (between brackets, the closest meteorological station). Left y-axis: ERA5-Land daily Tmax values in dark blue. Right y-axis: the number of heatwave days per year, , in red; confidence band represented by the grey area around . Vertical ticks: the dates of heatwave days.

Figure 13.
Time-dependent occurrence rates of Tmax hot days (1980–2021) at the nine ERA5-Land grid-points (between brackets, the closest meteorological station). Left y-axis: ERA5-Land daily Tmax values in dark blue. Right y-axis: the number of hot days per year, , in orange; confidence band represented by the grey area around . Vertical ticks: the dates of hot days.

Disclaimer/Publisher’s Note: The statements, opinions and data contained in all publications are solely those of the individual author(s) and contributor(s) and not of MDPI and/or the editor(s). MDPI and/or the editor(s) disclaim responsibility for any injury to people or property resulting from any ideas, methods, instructions or products referred to in the content. |
© 2023 by the authors. Licensee MDPI, Basel, Switzerland. This article is an open access article distributed under the terms and conditions of the Creative Commons Attribution (CC BY) license (https://creativecommons.org/licenses/by/4.0/).
Share and Cite
MDPI and ACS Style
Espinosa, L.A.; Portela, M.M.; Moreira Freitas, L.M.; Gharbia, S. Addressing the Spatiotemporal Patterns of Heatwaves in Portugal with a Validated ERA5-Land Dataset (1980–2021). Water 2023, 15, 3102. https://doi.org/10.3390/w15173102
AMA Style
Espinosa LA, Portela MM, Moreira Freitas LM, Gharbia S. Addressing the Spatiotemporal Patterns of Heatwaves in Portugal with a Validated ERA5-Land Dataset (1980–2021). Water. 2023; 15(17):3102. https://doi.org/10.3390/w15173102
Chicago/Turabian StyleEspinosa, Luis Angel, Maria Manuela Portela, Laryssa Mariana Moreira Freitas, and Salem Gharbia. 2023. "Addressing the Spatiotemporal Patterns of Heatwaves in Portugal with a Validated ERA5-Land Dataset (1980–2021)" Water 15, no. 17: 3102. https://doi.org/10.3390/w15173102
Note that from the first issue of 2016, this journal uses article numbers instead of page numbers. See further details here.