
Reservoir Operation Management with New Multi-Objective (MOEPO) and Metaheuristic (EPO) Algorithms


1
Department of Water Engineering, University of Birjand, Birjand 9717434765, Iran
2
Department of Environmental Engineering, Faculty of Engineering, University of Tehran, Enghelab Sq., Tehran 1417935840, Iran
3
Departamento de Economía Financiera y Contabilidad, Instituto Universitario de Investigación para el Desarrollo Territorial Sostenible (INTERRA), Universidad de Extremadura, 10071 Cáceres, Spain
*
Author to whom correspondence should be addressed.
Water 2022, 14(15), 2329; https://doi.org/10.3390/w14152329
Submission received: 25 June 2022
/
Revised: 21 July 2022
/
Accepted: 26 July 2022
/
Published: 27 July 2022
(This article belongs to the Special Issue Integrated Water Resources Management (IWRM), a Holistic Approach to Sustainable Water Management)
Abstract
:Dam reservoir operation plays a fundamental role in water management studies and planning. This study examined three policies to improve the performance of reservoirs: Standard Operation Policy (SOP), Hedging Rule (HR) and Multi-Objective Optimization (MOO). The objective functions were to minimize the LSR (Long-term Shortage Ratio) for HR and to minimize MAE (Mean Absolute Errors of released water) for SOP. MOO’s objective function was to reduce vulnerability and maximize reliability indexes. The research was conducted in two time periods (1985–2005 and 2025–2045). Combining EPO (Empire Penguin Optimization) algorithm and Gene Expression Programming (GEP) with elementary arithmetic (EOPba) and logical operators (EPOad) modified HR and SOP policies. Multi-Objective EPO (MPOEPO) and GEP with trigonometric functions were used to create a multi-objective policies formula. The results showed that the generation of the operation rules with EPOad increased the dam reservoir Performance Indexes (Vulnerability and Reliability Indexes) compared to EPOba. Moreover, HR application compared to SOP improves the mean dam reservoir’s Performance Indexes by about 12 and 33% in the baseline and 12 and 21% in the future period (climate change conditions), respectively. The MOO method (MOEPO) improved the Vulnerability and Reliability Indexes by about 36 and 25% in the baseline and by 31 and 26% in the future, respectively, compared to SOP.
1. Introduction
Global warming and consequent climate change have caused irreparable damage to various sectors, especially water resources. It is necessary to apply adaptation strategies to deal with the destructive consequences of climate change and increase the resilience of regions to the effects of this phenomenon. There are several methods to manage water resources allocation; one of the most widely used is the SOP method studied in [1,2]. HR methods are used to manage water resources by considering limitations to allocation. Several studies applied HR to manage water resources, including [3,4].
In many studies, reservoir allocation using SOP and HR rules has been done with simulation tools [5,6,7]. However, the result of the studies in [6,8,9] showed that more powerful tools are needed to cope with the continuously increasing complexity of optimization problems and the poor performance of conventional analytical-based methods. To overcome difficulties related to the possibility of convergence to a local minimum as well as the requirement of a differentiable model, metaheuristic algorithms have been developed. Metaheuristic algorithms have been applied as a solution approach in several different domains, including online learning [10,11], supply chain networks [12,13], vehicle routing POxd-0psproblems [14,15,16], and data classification [17,18]. This study investigated the application of a Metaheustric algorithm in a decision problem (Simulation of SOP and HR rules), which can be referred to studies of [19,20]. Evolutionary algorithms and other metaheuristics for optimizing are used by different researchers in several areas of water resources like water distribution systems [21,22,23], groundwater management [24,25,26], river-basin planning and management [27,28,29], water supply [30,31,32].
Another solution for managing the operation of the dam reservoir is multi-objective optimization. In this regard, we can refer to the [33,34,35,36,37] studies. For the optimal use of a reservoir, the objective function should be optimized to meet the desired demands. Dam reservoirs are usually used for several purposes: drinking, agriculture, industry, electric energy production, flood control, and recreation. These purposes can be consistent or inconsistent. Therefore, to simultaneously consider all the above objectives, the defined system is considered multi-objective to exploit the reservoir optimally. Due to the complexities of water resources issues, finding an optimal solution to multi-objective problems can be challenging. Consequently, the use of multi-objective evolutionary algorithms has been expanded. In the last two decades, several Multi-Objective Optimization methods, such as MOPSO [38], CMOPSO [39], NSGA-II [40], CGAMO [41], Multi-Objective FA (MOFA) [42], multi-objective teaching-learning-based optimization (MOTLBO) [43], multi-objective gravitational search algorithm (MOGSA) [44] and Multi-Objective Differential Evolution (MODE) algorithms [45] were presented. These methods have proven effective in solving MOO problems in water reservoir management [46,47,48]. Although all of the above algorithms are sufficiently competent in solving a particular task, they cannot solve all optimization problems with different features [49]. Hence, there is always a place for a new method that can solve a problem that cannot be solved with existing methods. Optimization algorithms help achieve the primary purpose of this study, which is to reduce deficits and improve vulnerability and reliability indexes through optimal allocation. Another goal of this research is to generate the formulaic representation of the output of the algorithms (create and modify policies). A data-driven approach, such as GEP, is required to formulate these outputs [38,50,51]. Therefore, coupling MOEPO and EPO algorithms with the GEP was considered for this end.
The main prerequisite for reservoir management under climate change effects is to simulate climate variables in the future. This study examined the Karaj dam reservoir as a source for domestic, irrigation, hydropower, and industrial purposes. In this regard, the data of [52]’s study was used for this part. The mentioned study indicated that the discharge and demand in the future period compared to the baseline period (1985–2005) decreased by 55 percent and 4 percent increases, respectively. As a result, climate change causes an increase in demand and a decrease in flow entering the Karaj dam reservoir. The dam operation instructions must be revised to address deficiencies and minimize vulnerabilities. This research aimed to optimize the Karaj dam reservoir allocations by applying SOP, HR and multi-objective optimization policies over the baseline (1985–2005) and future (2025–2045) periods. Proper managing released water from the dam is essential for minimizing deficits. The input variables included temperature, rainfall, inflow volume, and demands for the baseline and future periods. Algorithm outputs comprised the storage volume, deficiencies and released water from the reservoir. Problems with a multi-conditional and multi-discipline nature, such as the generating SOP and HR policies, will be formulated differently depending on the conditions. There are, however, ways in which it can be extended to provide better results for specific problems. This research also included developing and integrating the GEP with elementary arithmetic and logical operators and MOEPO and EPO algorithms.
A review of the research showed that Although SOP and HR methods and multi-objective optimization have been used in several studies so far, a comprehensive study has not compared these three methods. In addition, the study of the metaheuristic and multi-objective algorithms application in the optimization of dam reservoir allocation indicated that these algorithms were not used in any of the issues related to water resources.
In summary, the purpose of this research is to answer the following issues:
- Investigating the reservoir Performance Indexes through the change of operation policies (HR, SOP, and multi-objective optimization)
- Comparing operation policies generated by GEP logical and arithmetic operators
- Developing appropriate policies for the future period.
2. Materials and Methods
2.1. Study Area and Input Data
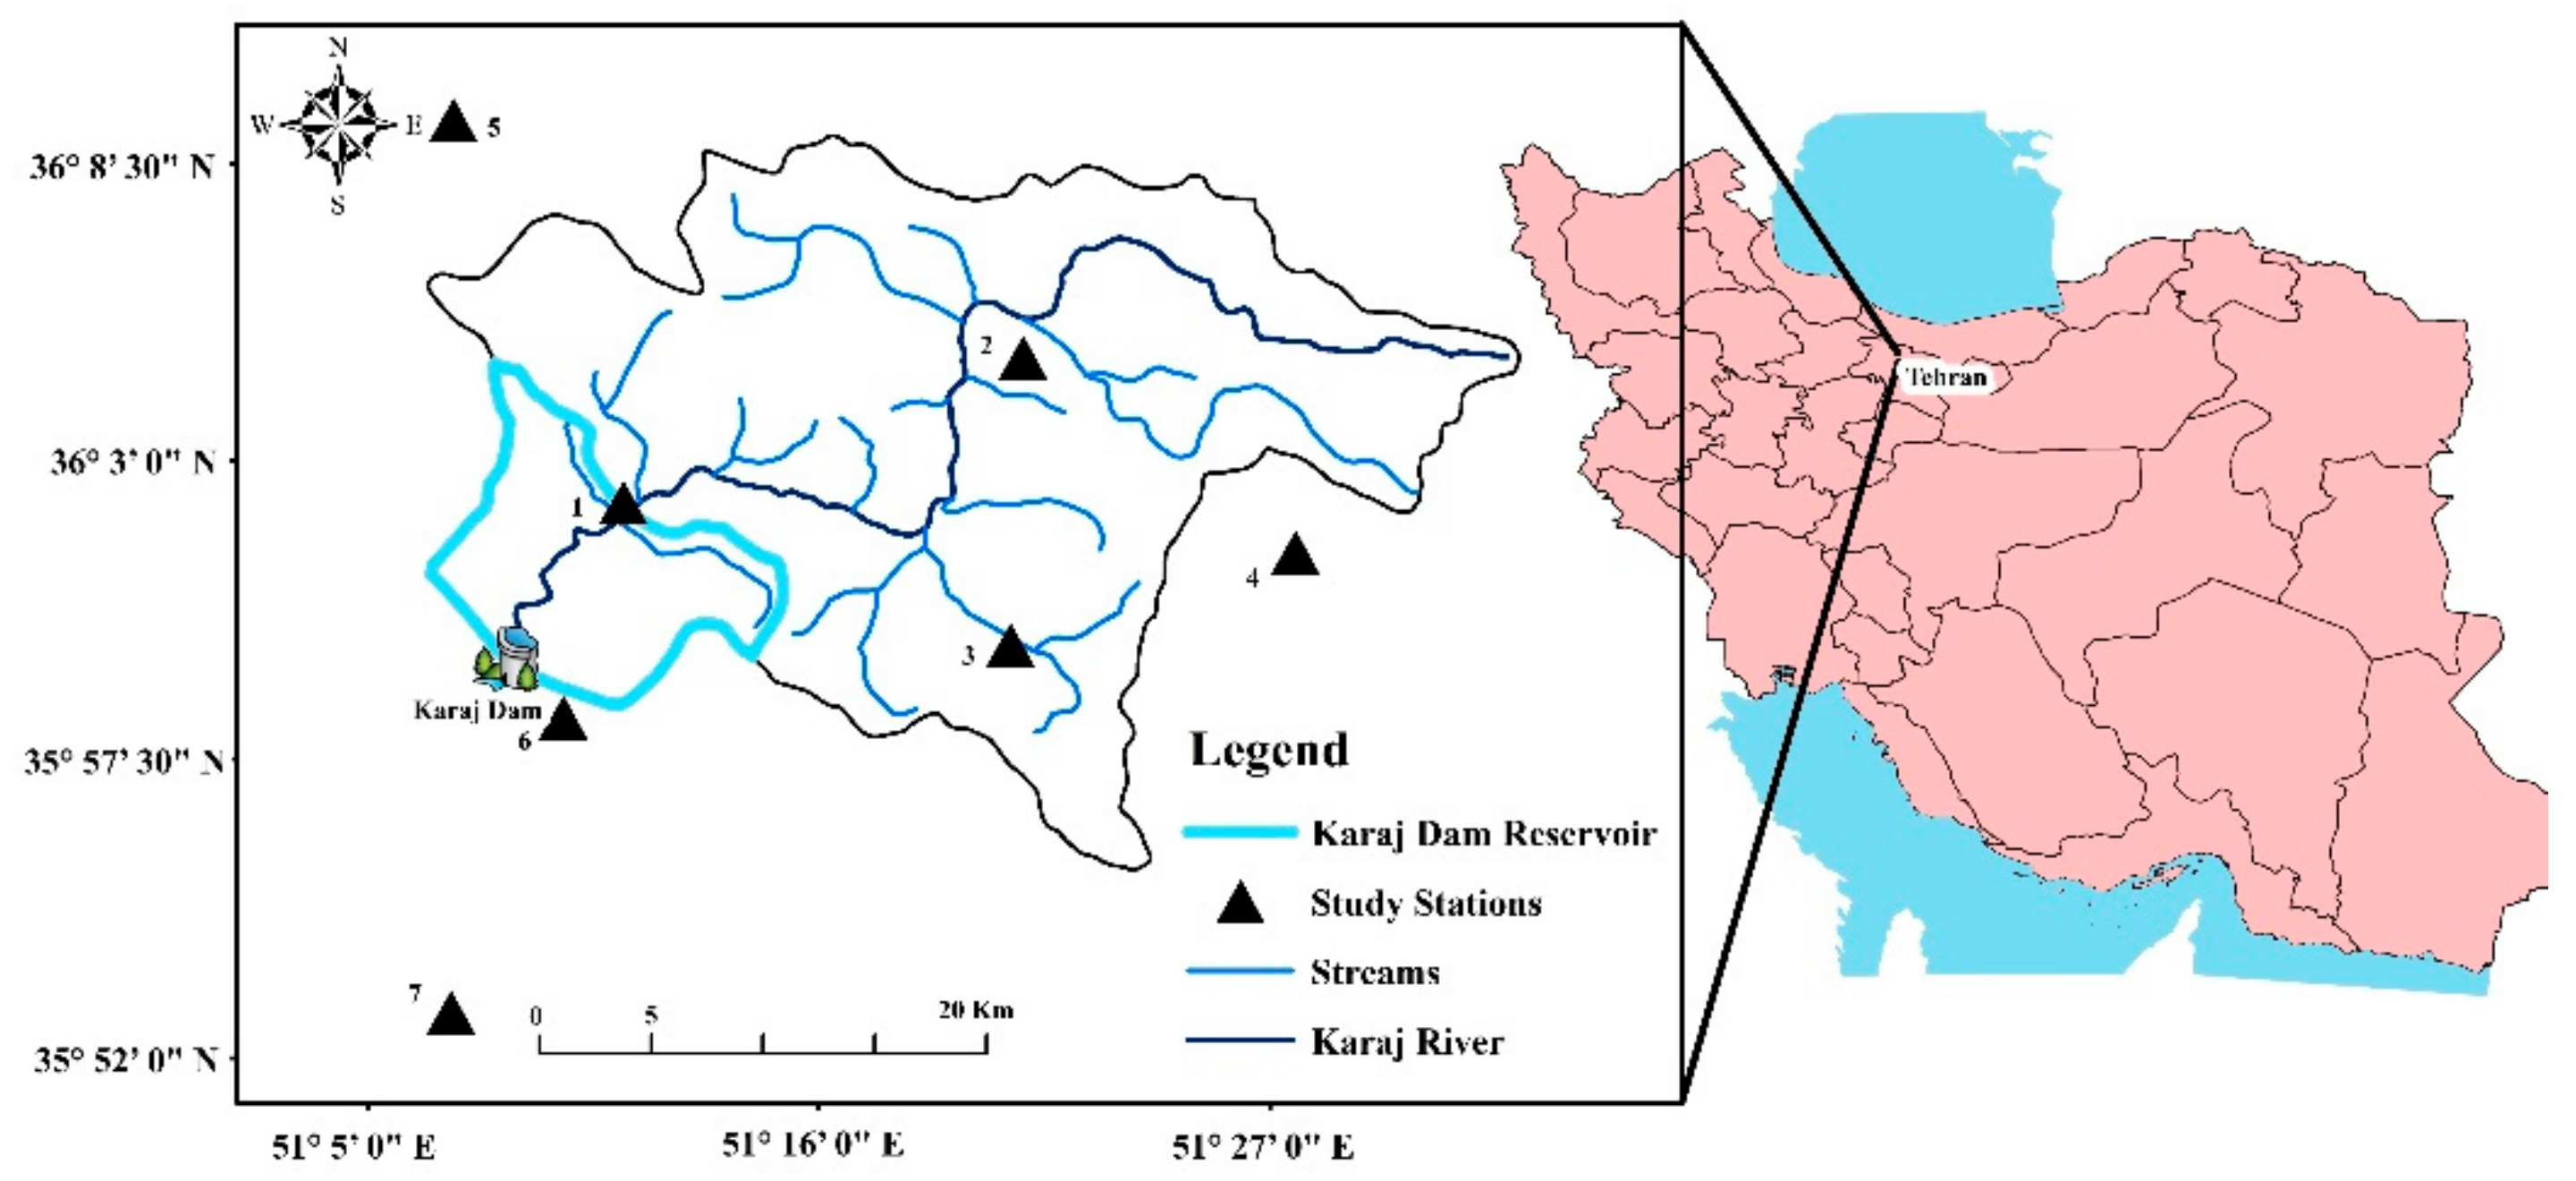
The case study is the Karaj River basin, located in the Central Alborz Mountains of northern Iran. The Karaj Dam Reservoir is a multipurpose water reservoir it provides water for various water uses (irrigation, hydropower, drinking water, industrial use and recreational activities). The total capacity of the reservoir and its dead volume are equal to 206 MCM and 16 MCM, respectively. Due to the main objective of this study, which is to find the best operation rule for a dam reservoir under climate change, the input data were prepared as part of it. The following section provides more information about this matter.
2.1.1. Baseline and Future Temperature and Precipitation
Daily precipitation, temperature, and river flow data were collected from the rain gauge, synoptic, and hydrometric stations (the locations of stations are presented in Figure 1). The data with no missing values for the period of 1985–2005 were selected for this study. The basin-wide daily precipitation time series were generated using the Thiessen polygon method from the available data of seven rain gauges. The daily time series of inflow to the Karaj dam reservoir was obtained from the hydrometric station located close to the dam. Daily time series of mean, maximum, and minimum temperature data were gathered from Karaj synoptic station.
The Fifth Assessment Report (AR5) and Representative Concentration Pathway (RCP8.5) provided by the IPCC were used in this study. The Statistical Downscaling Model (SDSM) was used to downscale the AR5 output data to a regional scale.
2.1.2. Simulate Inflow to Dam Reservoir
The Support Vector Machine (SVM) was applied to predict the inflow to the Karaj dam reservoir in the baseline period and under climatic change conditions. The selection of model input parameters using the M and Gamma tests (see [53] and [54], respectively for more details) showed that the combination of average temperature, maximum temperature and minimum temperature, evapotranspiration and runoff in the baseline period was the best parametric combination to predict runoff in the future. More information can be found in [52].
2.1.3. Future Agriculture and Domestic Demands
The method proposed in FAO Irrigation and Drainage Paper 24 [55], 56 [56], Penman-Monteith and [57] methods were used to calculate crop yield, evaporation and transpiration potential, irrigation demand and water consumption in agriculture section for baseline and future periods. In this study, per capita domestic water consumption, according to the Tehran Regional Water Authority announcement, is considered 240 L per day. Regarding population forecast in the coming years, according to the characteristics of the study area, the exponential growth model was selected as the most appropriate method for the present study by considering the average growth rate and population forecast based on the current situation. Maximum demand in the baseline and under climate change conditions equals 126.75 MCM and 194.79 MCM, respectively. Figure 2 shows the mean monthly inflow volume to the reservoir, the average monthly evaporation depth, and demand corresponding to the baseline and climate change conditions. The inflow volume to reservoir and demand under climatic change will decrease by approximately 55% and increase by approximately 4%, respectively, relative to the baseline condition.
2.2. Research Models
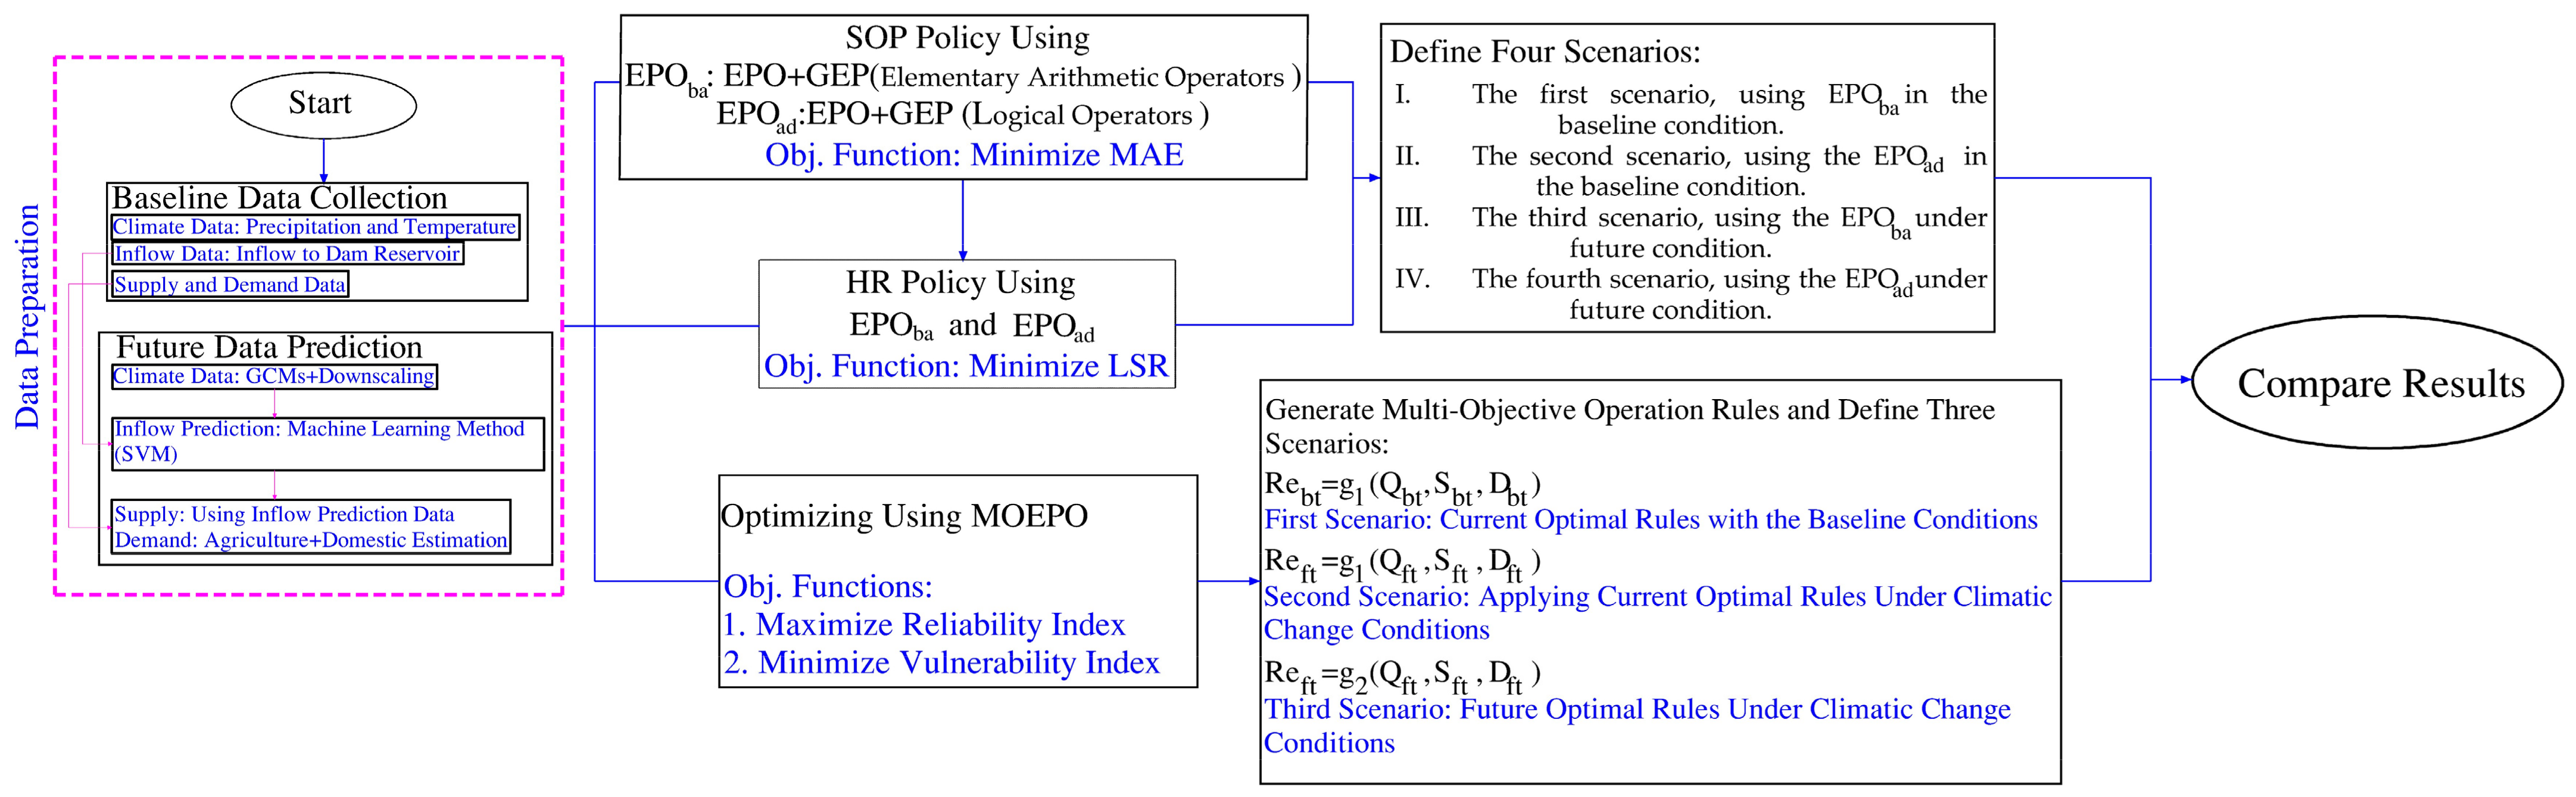
The primary purpose of this study was to determine the best operation rule under climate change conditions. In this regard, the objective functions (minimizing LSR in HR, minimizing MAE in SOP, and maximizing reliability and minimizing vulnerability Indexes in the MOO method) and analyzing the output (released, storage and deficits volumes), the Performance Indexes (reliability and vulnerability indexes) were considered to evaluate the results. The main stages of this study are presented in Figure 3. Several algorithms and models were used to achieve this study’s goals, which are briefly introduced below. Please refer to Appendix A for more information about constraints and details regarding SOP, HR, and multi-objective optimization.
2.2.1. Reservoir Operation Using Standard Operation Policy (SOP)
Based on the SOP simulation model, the amount of released water from the reservoir is assumed to equal the required demand. The reservoir provides a percentage when it cannot fully meet the need. In this policy, the amount of total shortage is minimized, but the intensity is high. If the volume of water exceeds the reservoir capacity, the excess volume will overflow from the spillway. The total amount of deficiency is minimized, but the severity of the deficiency is high, and it cannot be controlled. To optimize the SOP approach, an optimization model was defined to minimize the average absolute value of the reservoir release error (see Equation (1)). A simulation-optimizer model was developed as there is no explicit relationship between the objective function and the decision variables. For this purpose, the SOP simulation model was defined in the MATLAB environment as a subprogram for the EPO optimization model based on the formulas presented in Appendix A.1.
where:
- MAE: mean absolute errors as objective function
- RSPt: total demand per month
- rspt: total output based on SOP (observational) in t period.
2.2.2. Reservoir Operation Using Hedging Rule (HR)
HR are used to store water in high water seasons to meet needs in dry and low water periods and when the river has little potential to refill the reservoir or there are uncertain flows in the area to create a safety factor for water supply. The primary purpose of HR is to reduce the cost of dealing with a significant water shortage. When these stresses can be controlled to be applied intermittently, but in a small amount, they will result in better performance than when they have been applied abruptly. Hedging starts when the monthly water is less than the threshold volume. Its objective function is to minimize the Long-term Shortage Ratio (LSR), and the optimal hedging coefficients (Kp) are obtained using the EPO optimization algorithm based on LSR minimization. These coefficients are the slope of the operation line in a given month (see Appendix A.2 for more details).
2.2.3. Multi-Objective Optimization
When generating the rules of reservoir operation to meet the demands due to the variability of policies and objectives at the basin level, in the long run, it is not possible to determine what the main focus is. Therefore, all objectives should be considered according to the system’s policies. There is a need to use multi-objective optimization models by which all the study objectives can be regarded using the Pareto curve. This helps managers and users to make the best possible decision based on the set of goals and available options. In this study, by applying the multi-objective optimization method, the dam reservoir rules of operation were extracted by considering the conditions resulting from climate change as multi-objective. The objective functions were minimizing vulnerability and maximizing the Reliability Indexes. See Appendix A.3 for more information about the constraints, objectives and penalty functions.
2.2.4. Gene Expression Programming
In symbolic regression or function find, the goal is to find an expression that satisfactorily explains the dependent variable. In this study, the GEP was employed to find a symbolic function between Re (Total Released Water) as a dependent variable and Q (Inflow), D (Demand) and S (Storage) as independent variables. In fact, GEP is commonly used to solve some nonlinear and unstable problems, in which the dependent variable cannot be simply formulated. For instance, combining MOEPO algorithm with GEP is a useful tool to formulate the outputs of Metaheuristic Algorithms. For further study on the framework of GEP, refer to [58].
2.2.5. Emperor Penguin Optimization (EPO) and Multi-Objective Emperor Penguin Optimization (MOEPO)
The Emperor Penguin Optimization (EPO) algorithm was first introduced by [59]. They introduced this new innovative algorithm and compare the performance of this algorithm with other MOA to solve various problems. In this regard, the performance of the EPO algorithm on benchmark test functions was compared to 44 linear and nonlinear criteria with the performance of eight MOA (Spotted Hyena Optimizer (SHO), Grey Wolf Optimizer (GWO), Particle Swarm Optimization (PSO), Multi-Verse Optimizer (MVO), Sine Cosine Algorithm (SCA), Gravitational Search Algorithm (GSA), Genetic Algorithm (GA), Harmony Search (HS)). Additionally, for better determination of the proposed algorithm performance, this algorithm was applied to seven real-life engineering optimization problems with nonlinear structure and mixed-integer.
MOEPO borrows the properties of multi-objective operators of NSGA-II, which is an established fast and efficient multi-objective method mentioned in the literature review. The MOEPO algorithm uses the Non-Domained Sort (NDS) and the Crowding Distance (CD) operator to select the most appropriate solution. The solution with the highest level (level = 1) and the highest CD value is selected as the most suitable solution. These selection criteria are used as a solution in a less crowded area of the target space may guide the search process. After obtaining the most suitable solution, the rest of the solutions are modified. After all solutions have been modified, the modified solutions (n) are combined with the initial population (n) to give the total number of solutions 2n. These 2n solutions are re-levelled based on the unknown Pareto fronts and their mass distance operator. Based on the new level and the CD value, the top-n solutions are selected from the 2n solutions. For more information on the MOEPO multi-objective optimization algorithm, please visit [60].
2.2.6. Reservoir Operation Rule Generation Using EPO, MOEPO Algorithms and GEP
Since metaheuristic algorithms produce only numerical outputs and do not produce formulaic outputs, one of the leading issues in EPO application can be the development of this algorithm and its integration with other methods so that it can provide more desirable results for specific problems [61,62]. Since some data-driven models like GEP convert system inputs to outputs using the desired mathematical relationship, this model was used to achieve the desired mathematical relationship for generating policies. It should be noted that before generating a model or estimating a mathematical relation to solve a problem in GEP, the user must first specify the number of mathematical functions and operators; one development could be the combination of EPO with GEP by integrating various logical operators (EPOad) and elementary arithmetic operators (EPOba) and the coupling of MOEPO with GEP by trigonometric functions. It is worth mentioning that the GEP model performs better in producing output formulas related to the HR and SOP, except for the four elementary arithmetic operators (×, ÷, +, −), there are several other operators such as the multi-criteria function (≤, ≥, <, >) operators of logical functions (if, and) and Boolean function were considered as logical operators. This condition is known as modified GEP in this study.
To generate the HR and SOP policies, four scenarios are considered as below:
- The first scenario, development of baseline rules based on the volume of available water in the reservoir using EPOba in the baseline condition.
- The second scenario, development of baseline rules based on the volume of available water in the reservoir using the EPOad in the baseline condition.
- The third scenario, development of future rules based on the volume of available water in the reservoir using the EPOba under future condition.
- The fourth scenario, development of future rules based on the volume of available water in the reservoir using the EPOad under future condition.
2.3. Vulnerability and Reliability Indexes
Reliability, vulnerability, and resilience are the most commonly cited performance metrics within WRM (Water Resource Management) literature [63,64]. These performance criteria generally refer to how likely a system is to fail (its reliability) and how severe the consequences of failure might be (its vulnerability). The vulnerability of a system is also implicitly included in the control rules and triggers of each “level of service” event for a given resource system. Water system reliability is defined as the probability of water supply fully meeting demand over the planning horizon. According to the definitions cited above, the vulnerability and reliability indexes defined in Equations (2) and (3) were employed in the study in terms of percentage.
In the above equations:
- Dt: Demand volume in the t period
- Dmax: Maximum demand in the under-review period.
- Ret: the released volume from the reservoir in the t period.
3. Results
3.1. Integrate SOP and HR Using EPOad and EPOba
Following, after validation of the mentioned methods in extracting the SOP and HR, these methods were applied to produce allocation rules in future and baseline periods.
3.1.1. Validation of the SOP Simulation with EPO
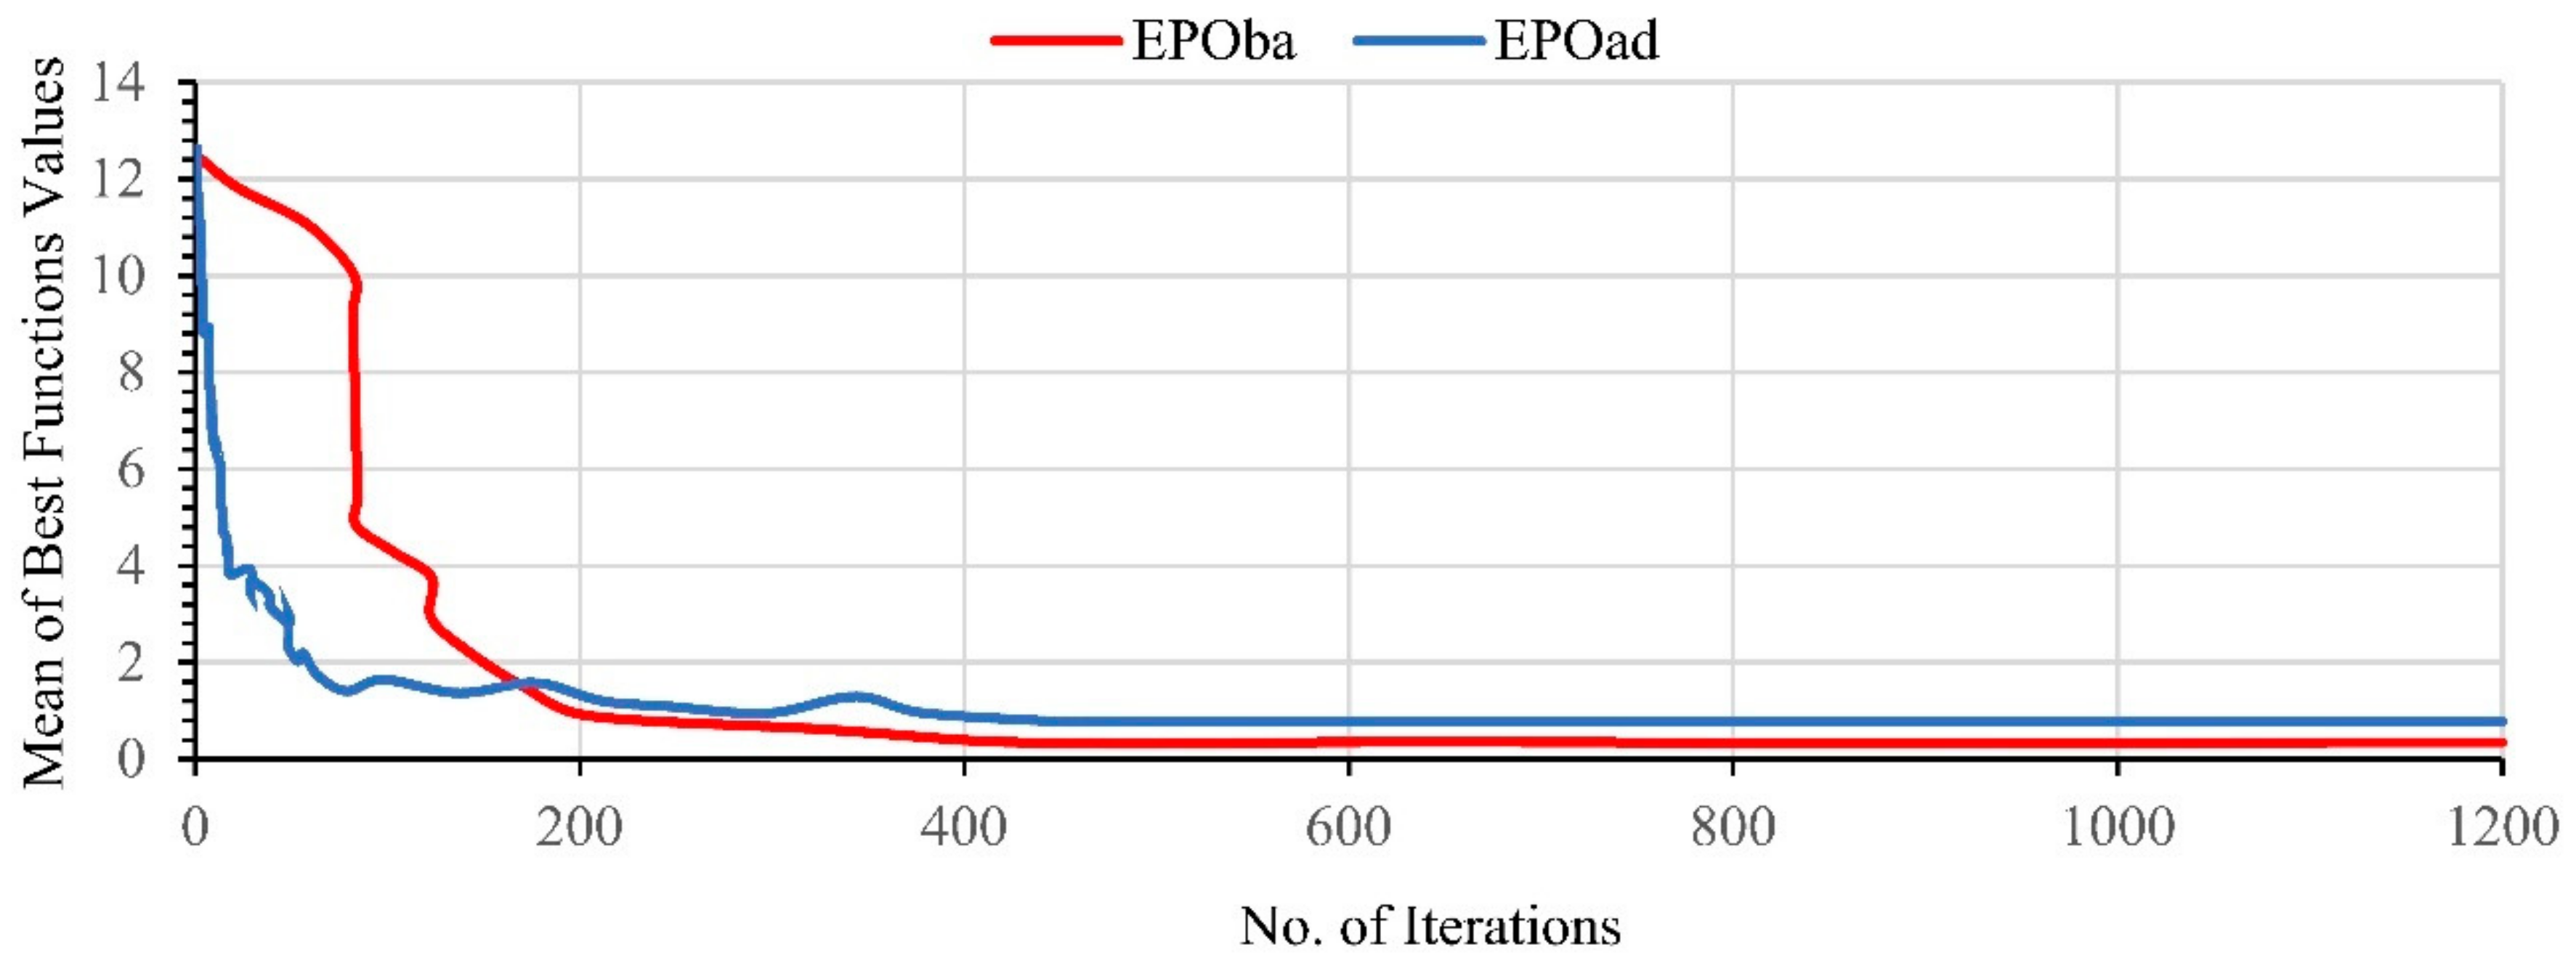
Figure 4 shows the convergence curve of SOP obtained from EPOad and EPOba algorithms. According to the Figure, the convergence rate of EPOad and EPOba are almost the same; both algorithms reach the final result of the objective function after about 400 iterations; EPOad reaches the objective function of 0.32 while the EPOba reaches the objective function of 0.75.
The validation results of the EPOad and EPOba algorithms are presented in Table 1. It shows the higher accuracy of EPOad in simulating the SOP.
In Equations (4) and (5), the rules derived from the EPOba and EPOad approaches with the minimum objective function value for the baseline period are presented.
In the above equations:
- RSPt: Total released water based on Reservoir System Policy in the t period
- AWt: Available water in the dam reservoir (in the t period).
The results of the reservoir Performance Indexes for the four proposed scenarios are shown in Table 2. Based on the information in this table, it can be noted that using the EPOad algorithm will improve the performance in the baseline and future conditions.
According to the results of this section, since the EPOad algorithm has a better performance in simulating the SOP, only the EPOad results (after this, referred to as the “SOP”) were used in the continuation.
3.1.2. Validation of the HR Simulation with EPO
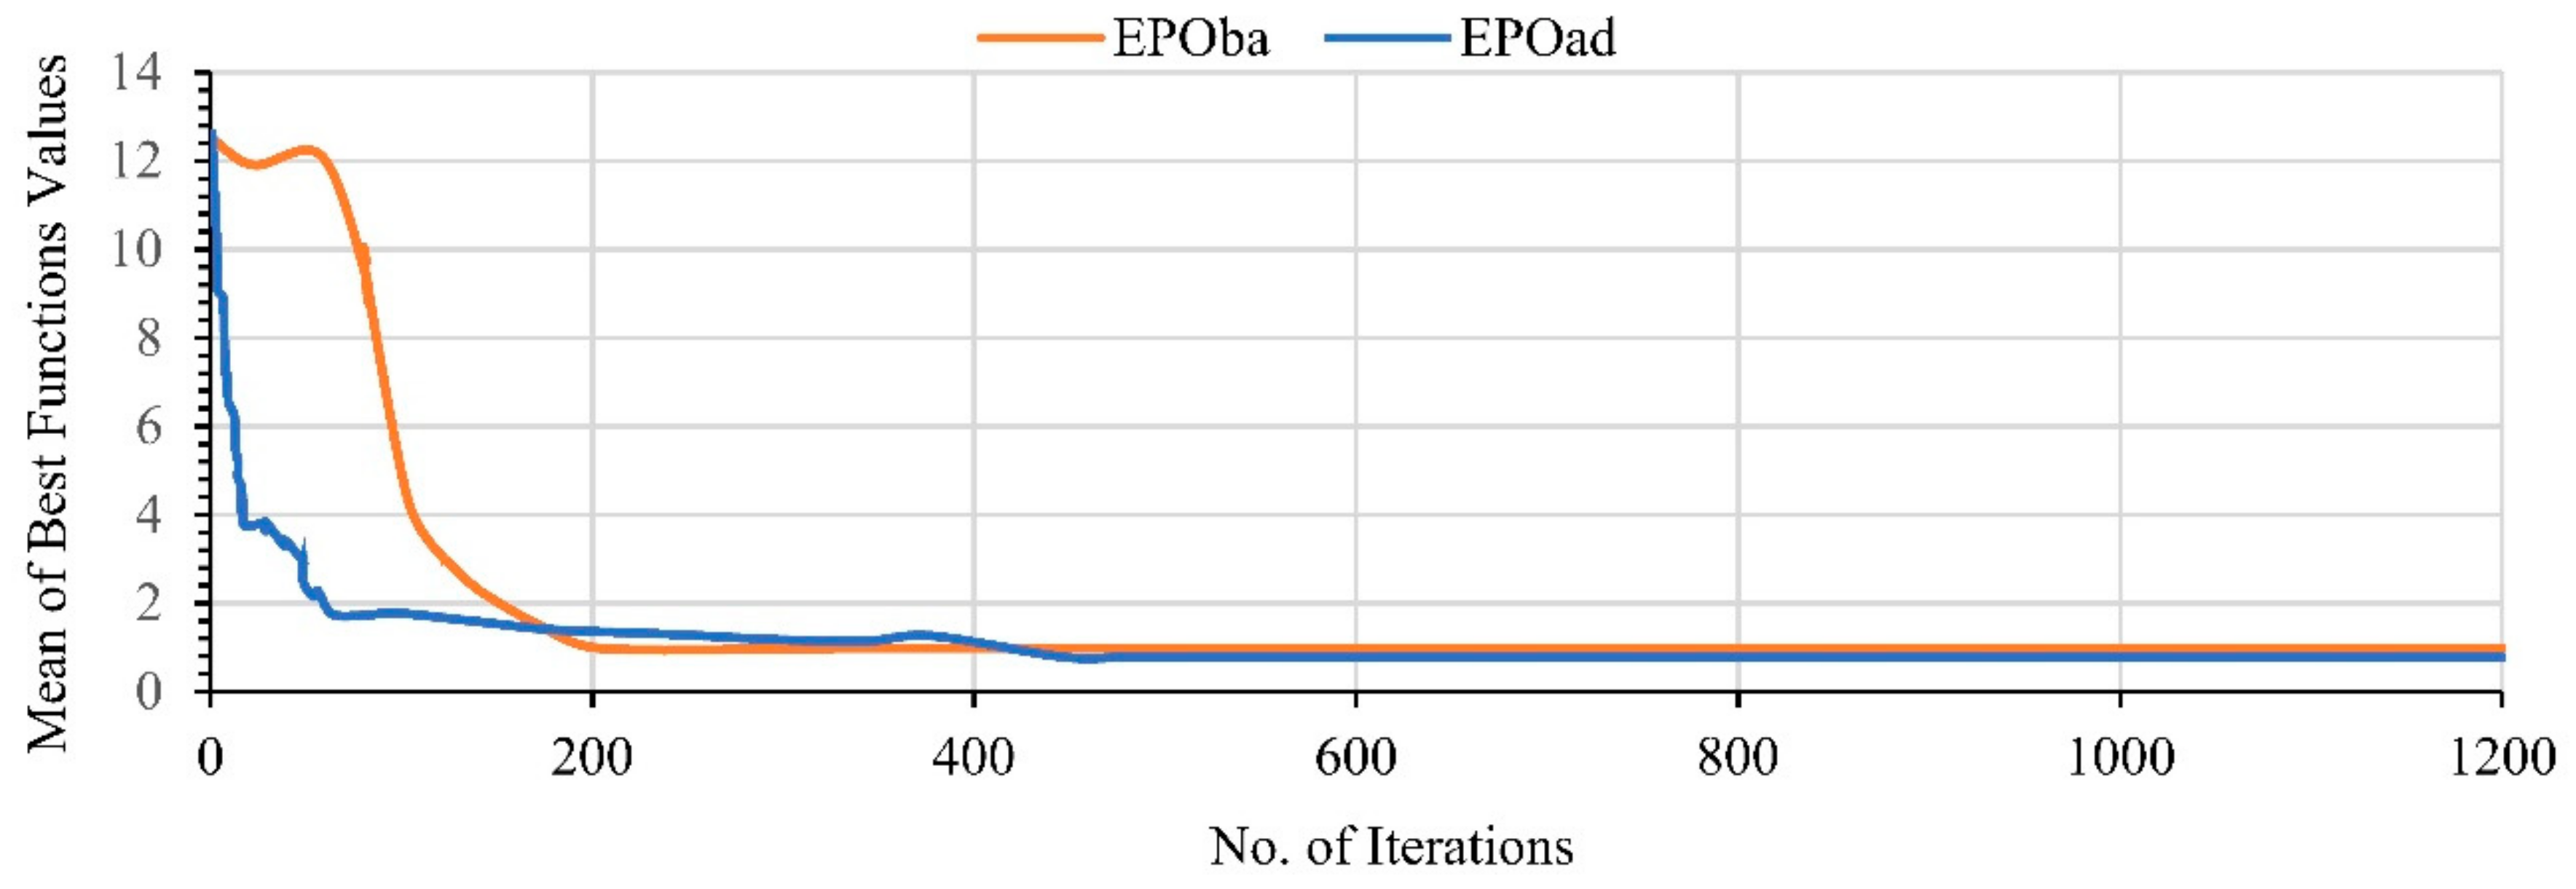
The results of deriving the HR using EPOad and EPOba algorithms are shown in Figure 5 and Table 3. As can be seen in the Figure, the EPOad by objective function of 0.87 compare with EPOba by objective function of 0.98 has a better performance in minimizing the MAE index. Examination of the results of the implementation of the HR by the algorithms shows that when using the EPOad algorithm in simulating, the total output from the reservoir is more balanced with the demand, so the less objective function is obtained. Comparing the results in Table 2 also shows that the EPOba outputs are more similar to the SOP.
In Equations (6) and (7), the rules derived from the EPOba and EPad approach with the minimum objective function value (see Equation (A6) for more details) for the baseline are presented.
3.1.3. Comparison of the Results of HR and SOP in Extracting Allocation Rules in Four Scenarios
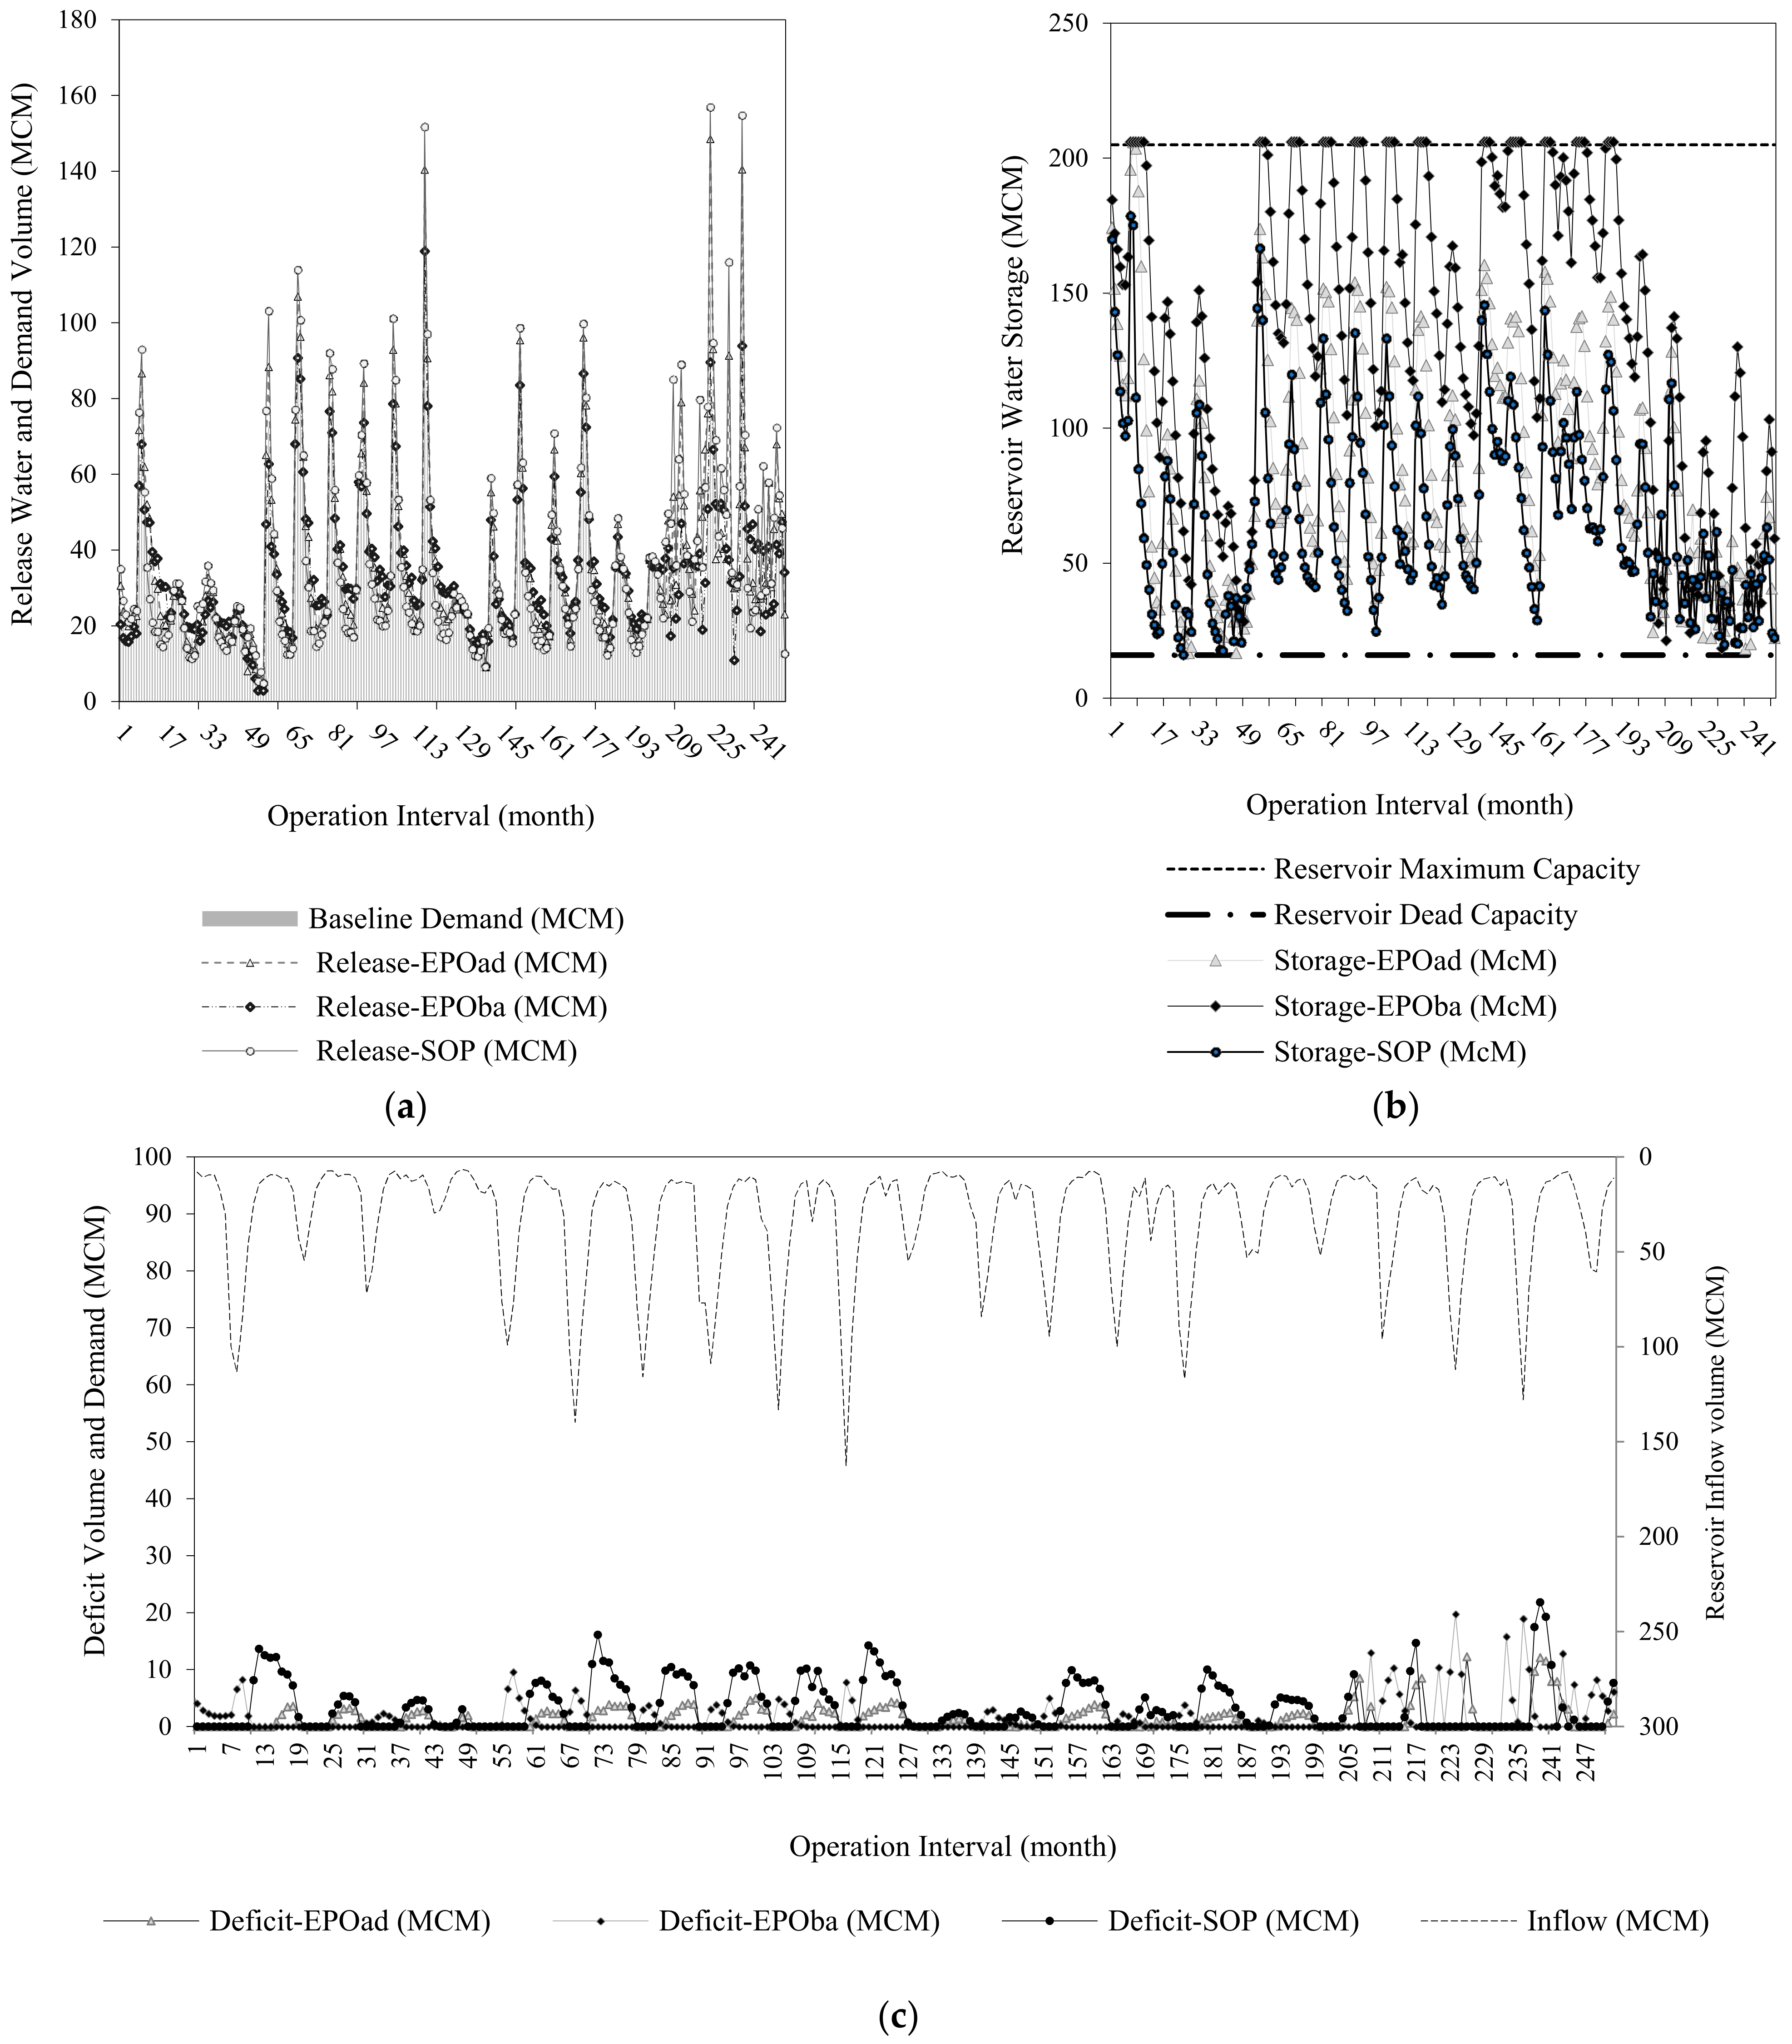
The reservoir optimization Hedging Rule provided for the baseline (scenarios 1 and 2) and future conditions (scenarios 3 and 4) and SOP are shown in Figure 6 and Figure 7. The changes in total and deficiencies volume by the rules extracted from both algorithms in four scenarios and the average demand volume are compared in Figure 6b,c. According to Figure 6, corresponding to the EPOad diagram, the storage volume for 75% of the study period is more than 49 MCM and less than 120 MCM. The released volume from the reservoir for 25% of the study period is less than 20 MCM and more than 42 MCM. For 75% of the study period, the deficiencies amount is less than 1.2 MCM. Corresponding to the EPOba diagram, the storage magnitude for 75% of the study period is more than 96 MCM and less than 171 MCM. For 50% of the study period, the released volume is between 22 and 40 MCM. For 75% of the study period, the amount of deficiencies is less than 1.8 MCM. According to the SOP diagram, for 50% of the months, the reservoir storage is about 92–41 MCM. The released volume for 75% of the study period is more than 18 MCM and less than 44 MCM. For 75% of the period, the deficit is less than 2.2 MCM.
Using the EPOad in Figure 7, the storage is over 33 MCM and less than 65 MCM in 75% of the study period. For 50% of the study period, the released volume is between 38 and 77 MCM. There are fewer than 1.9 MCM of deficiencies in 75% of the months. Based on EPOba, in 75% of the study period, the storage is less than 68 MCM. For 75% of the months, the released water from the dam reservoir is less than 30 MCM. Deficiencies are less than 4.4 MCM in 75% of months. According to the SOP diagram, 50% of the time, the storage volume is between 12 and 30 MCM. In 75% of the months, the dam reservoir’s release is greater than 11 MCM and less than 29 MCM. Deficiencies are less than 8.2 MCM in 75% of months. As shown in part (a) of Figure 6 and Figure 7, the EPOad performed better EPOba in extracting the total output rule from the reservoir (total discharge, deficit and storage volume from the reservoir) in the baseline and future.
To evaluate the performance of the reservoir in meeting the demand, the values of Performance Indexes in the four scenarios are compared in Table 4.
The first and second scenario results showed that using the EPOad, has increased the reliability index in the baseline by 11% and decreased the vulnerability index (improvement) by 40% compared to the EPOba. These changes (using EPOad instead of EPOba algorithm) in future conditions (third and fourth scenarios) were 12% increasing the Reliability and 5% decreasing the vulnerability indexes. The results also show in the second and fourth scenarios (EPOad) the reliability and vulnerability indexes will decline by 43% and increase by 44%, respectively. In other words, the status of reservoir performance indexes in the future will be much worse than the baseline.
3.2. Comparison of the Results of Multi-Objective Optimization (MOEPO) and SOP in Extracting Allocation Rules in Four Scenarios
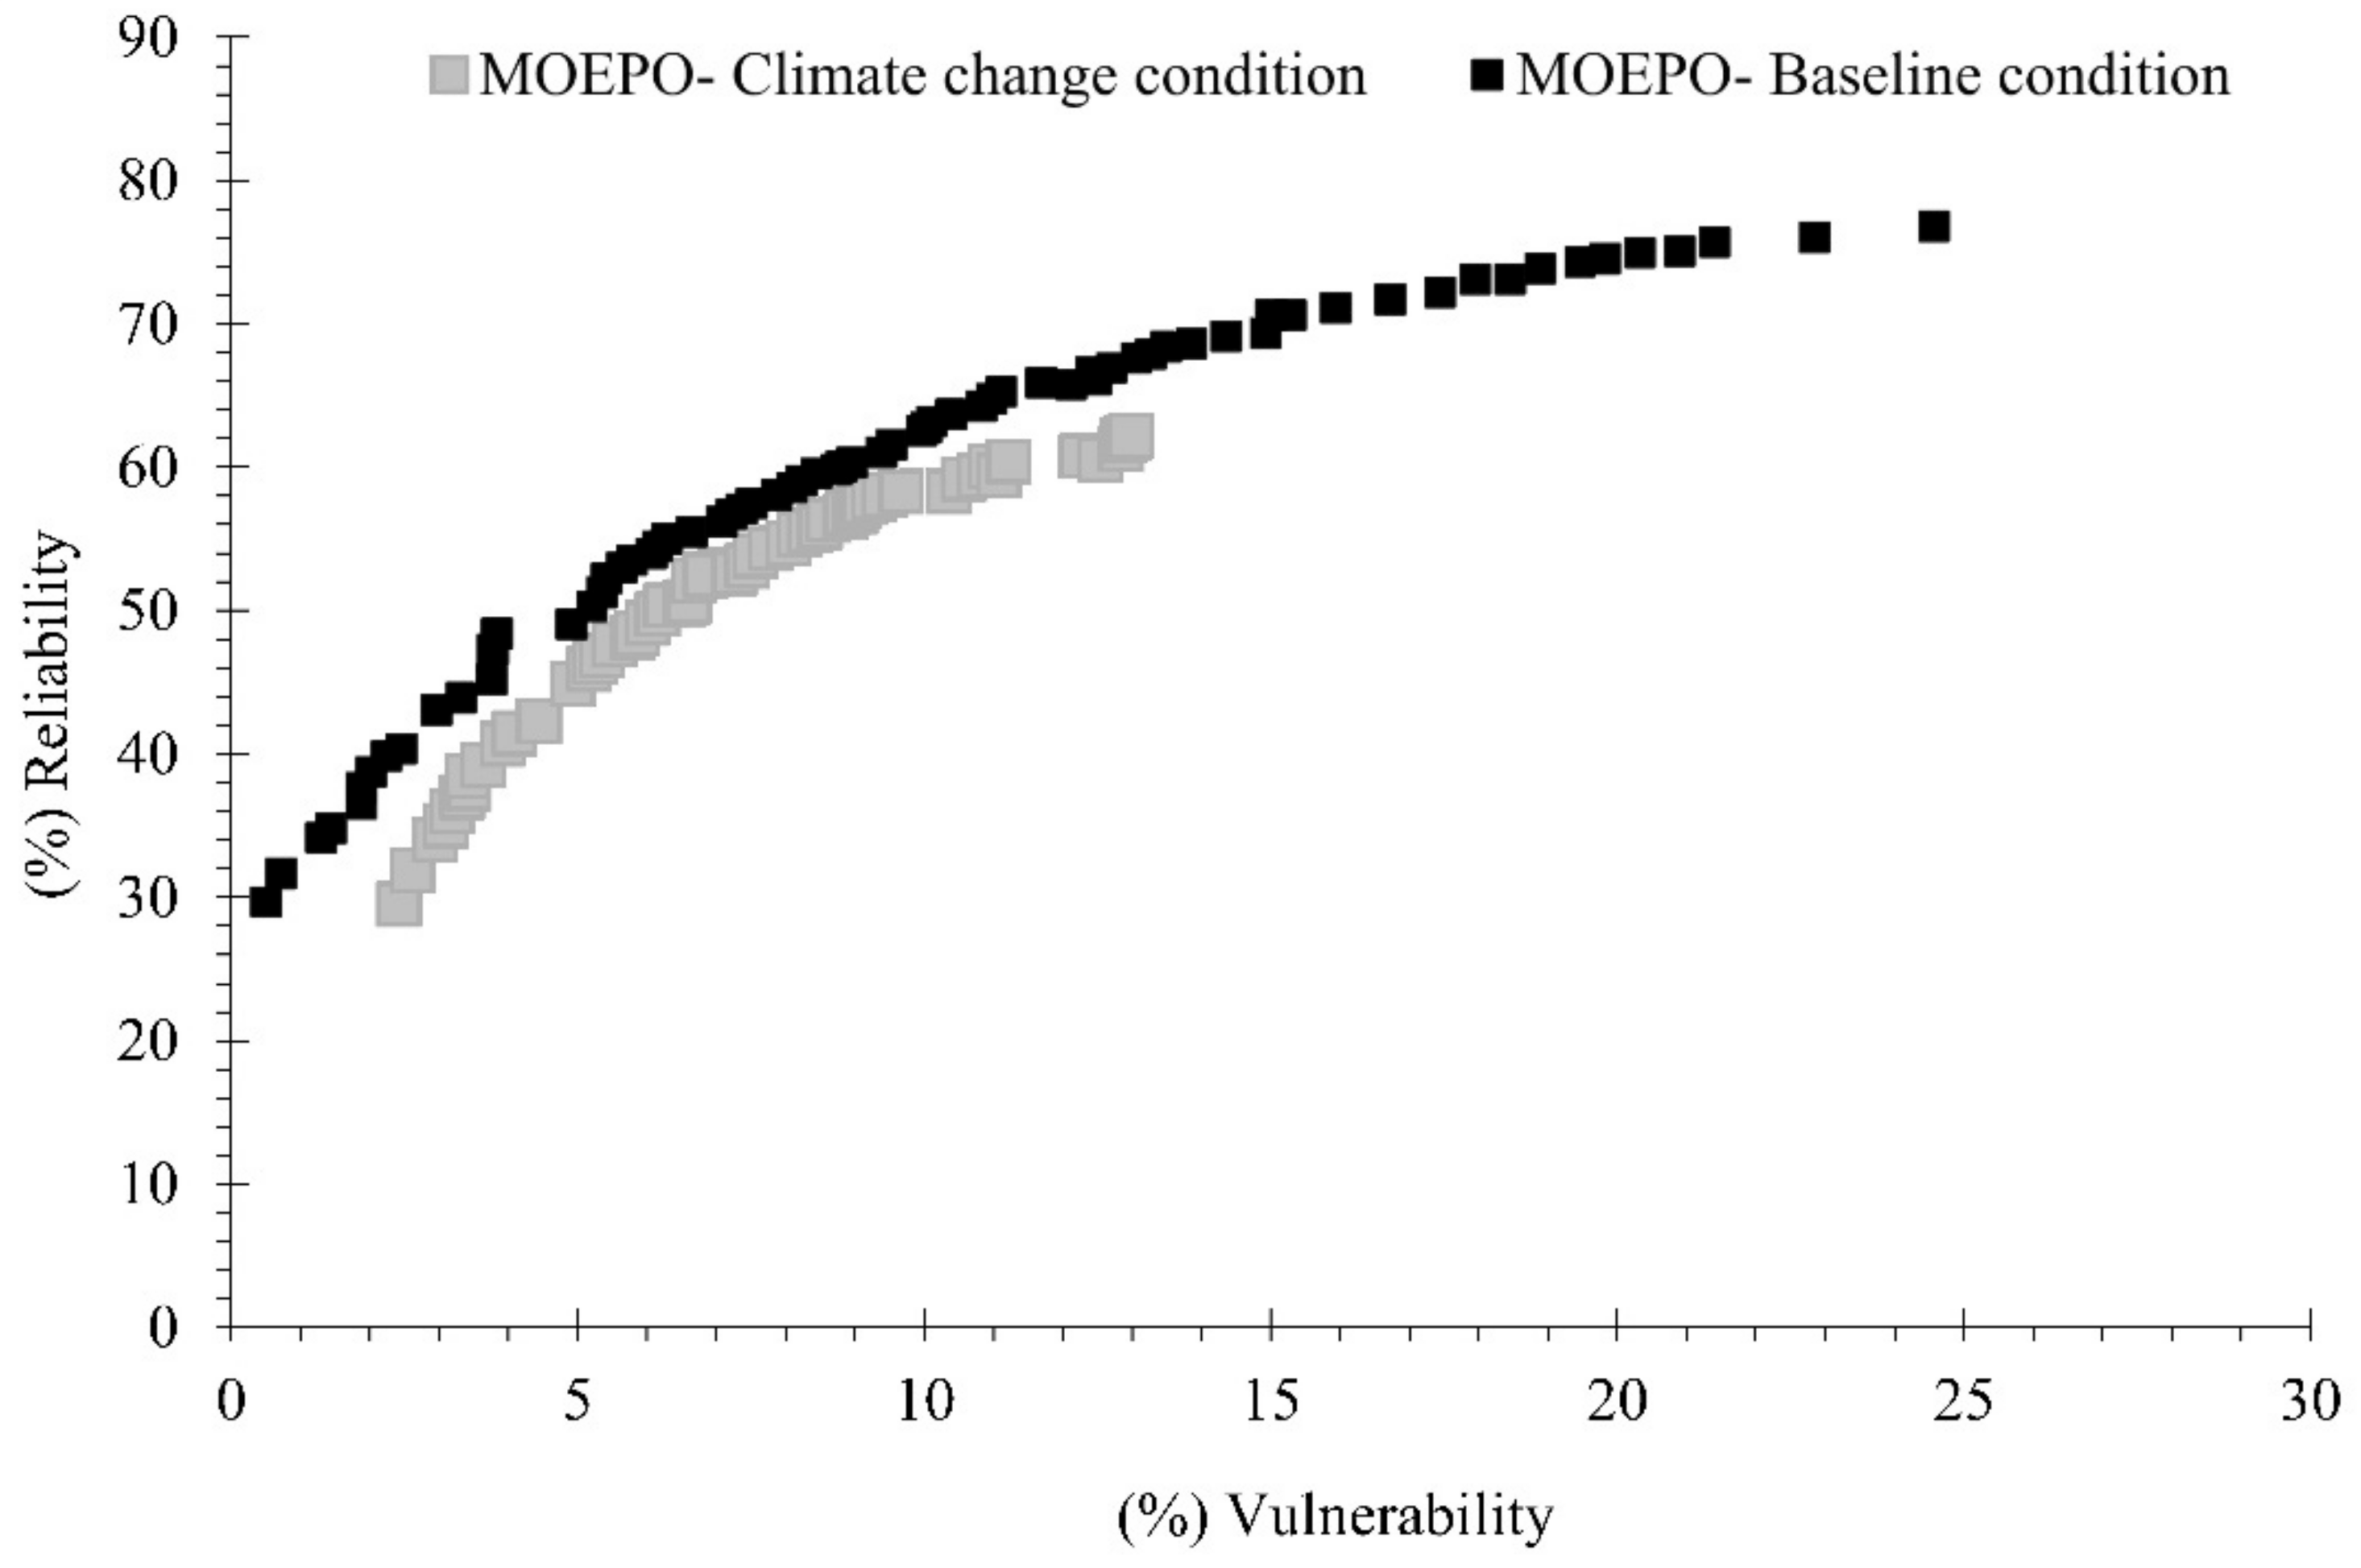
Figure 8 shows the Pareto curve of the MOEPO in the baseline and under climate change conditions. Each of these points on the Pareto curve can be considered an optimal solution. It represents an optimal operation policy that includes the released volume from the reservoir, which is a function of the amount of water entering the reservoir, the volume of demand and the volume of storage. It should be noted that none of the points of the Pareto curve is particularly superior to the other points; according to different objectives, the selected decision options can be different.
For the same level of reliability, in the baseline, the vulnerability index is smaller than under the climate change conditions. For example, in the reliability of 60%, the vulnerability index in the baseline is 8.8%, and in the future period is 11.2%.
Operation Rules and Three Considered Scenarios
Operation rules were calculated using the MOEPO algorithm with the objective functions of minimizing Vulnerability due to reservoir deficiencies and maximizing the Reliability of demand. Three operation rules (Scenarios) are defined in Equation (8).
where Re is the total released water function of input discharge, storage and demand, is the first operation rule calculated for the baseline conditions (first scenario), is applying the baseline rules to calculate water allocation for the future period, and is the third calculated rule in which the reservoir operation rules are calculated for the future period (2025–2045) based on future inflow and demands (using future data). The following equations (Equations (9)–(11)) are the rules obtained for the reliability index of 46 and 48% (see Table 5) from the MOEPO for the First, Second and Thirds Scenarios.
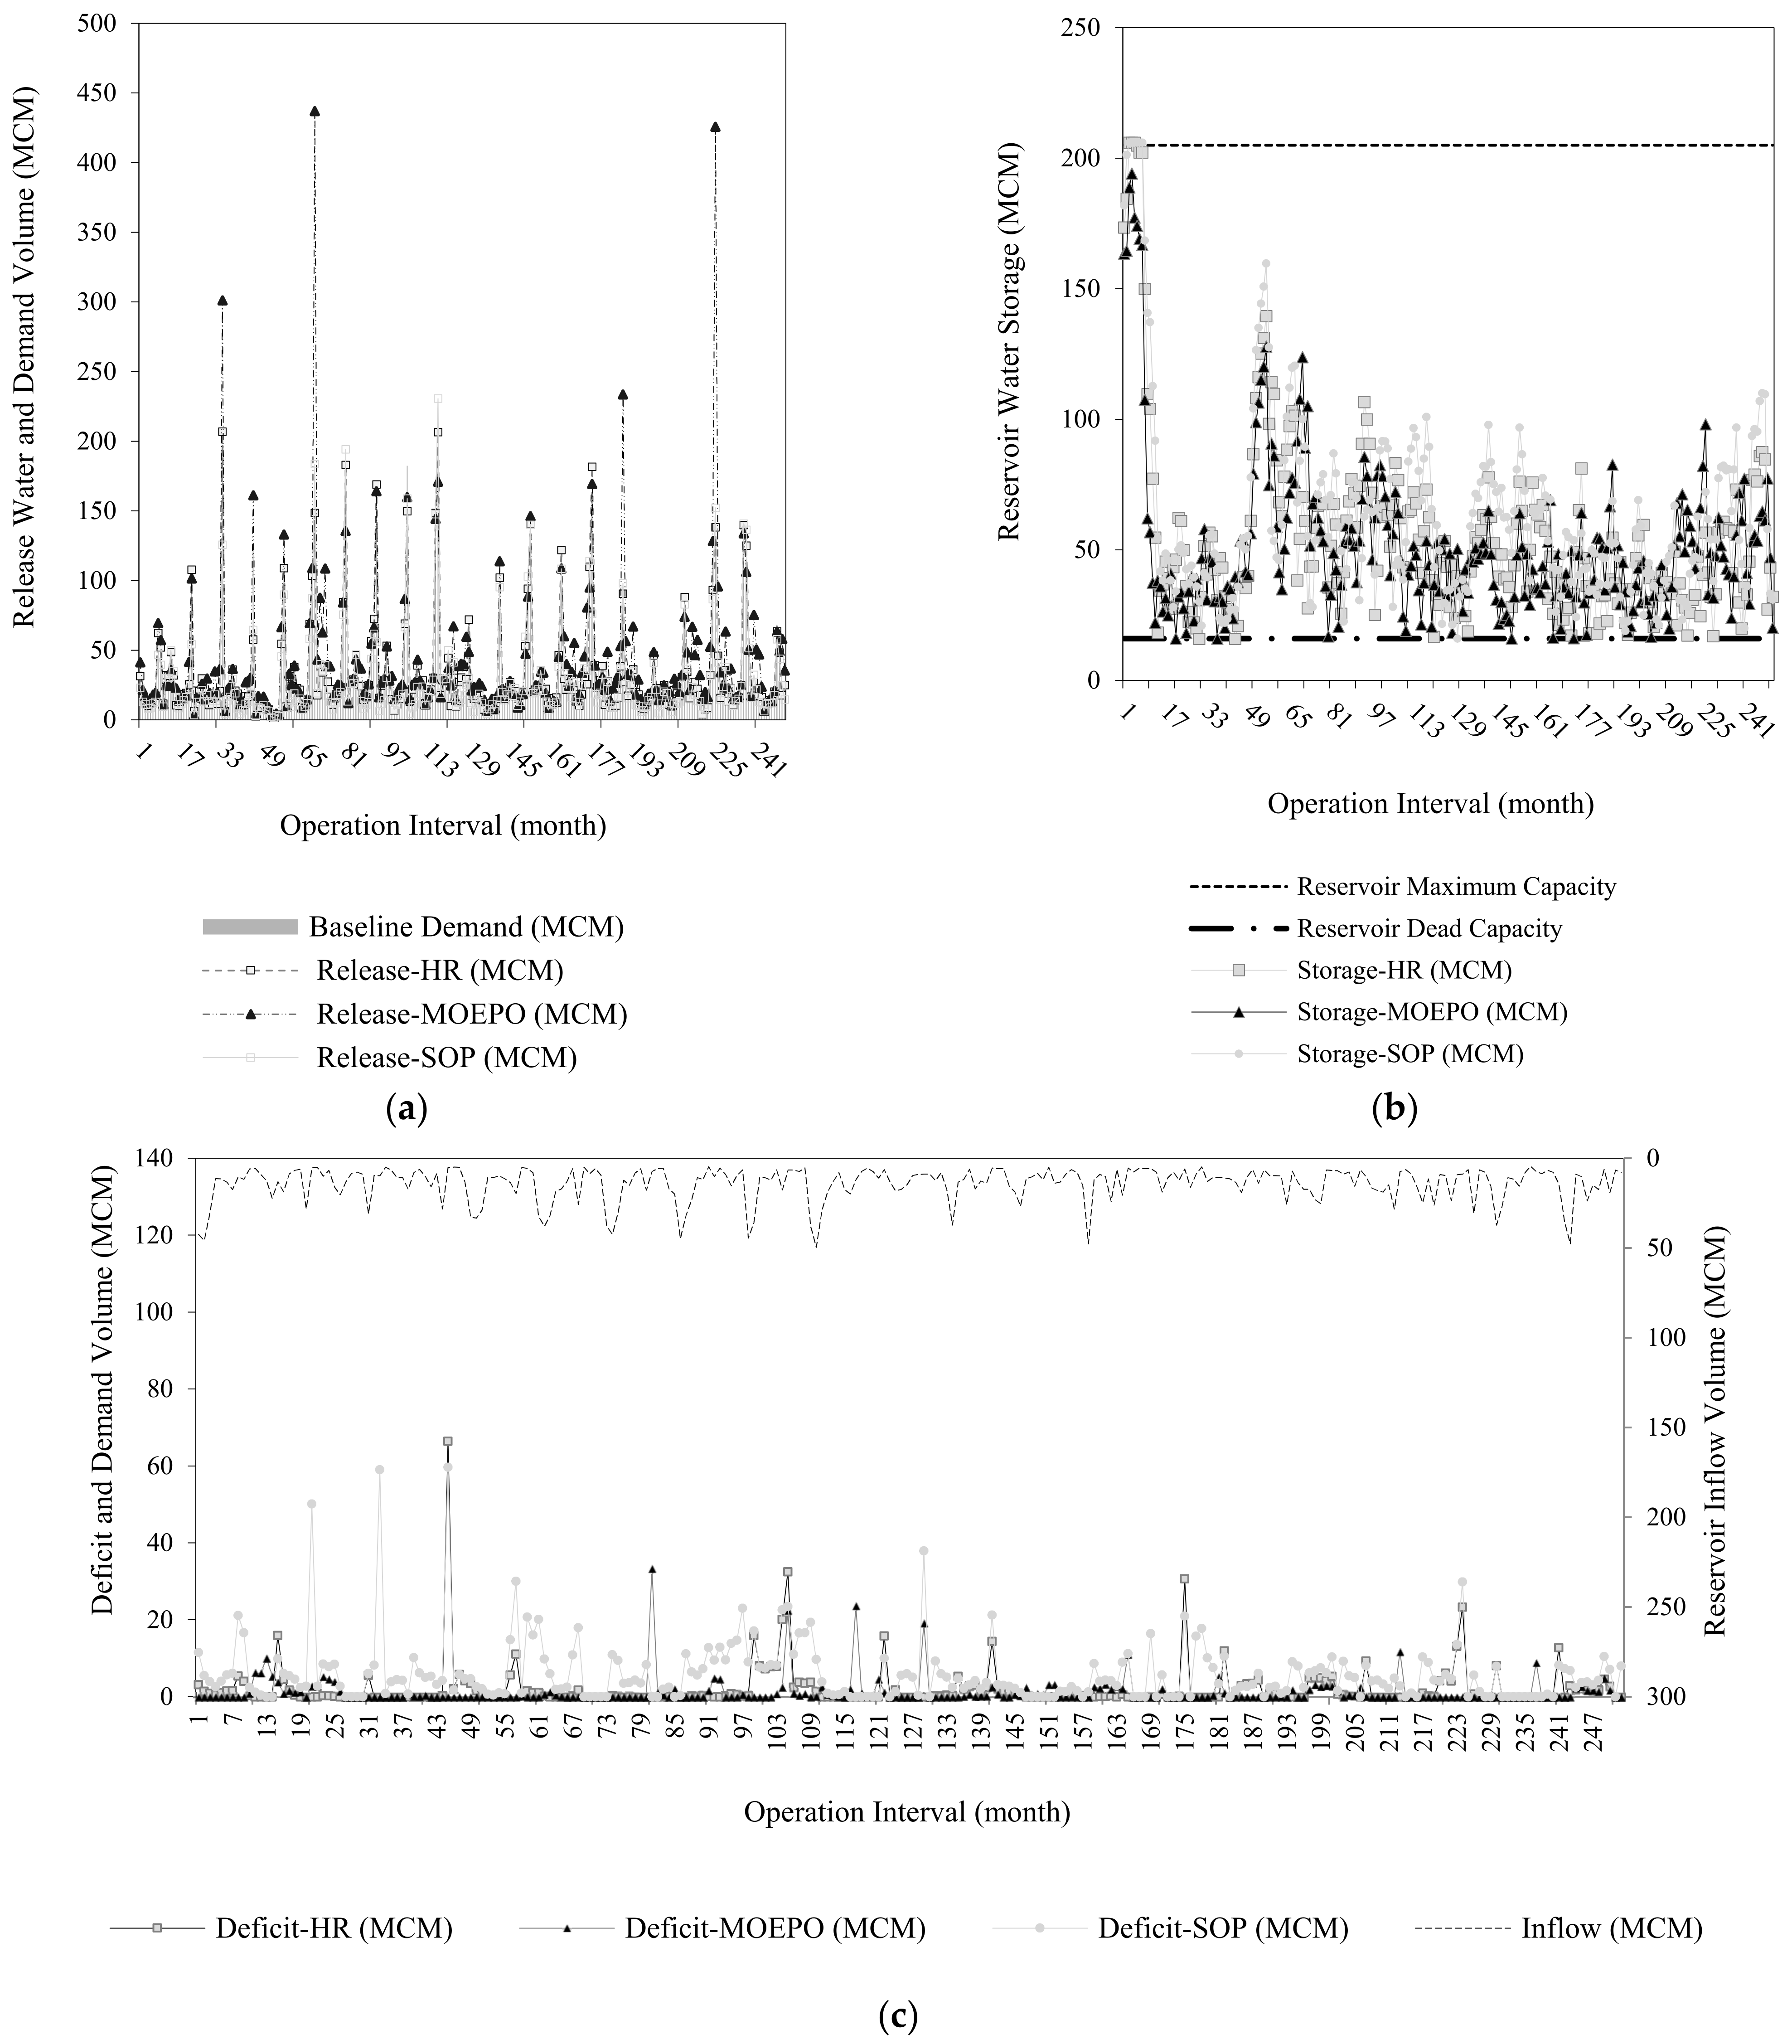
To evaluate this method on the overall performance of the reservoir, the results were compared with the results of the SOP method. Results of the three mentioned scenarios are presented in Figure 9, Figure 10 and Figure 11. In Figure 9, for the MOEPO and SOP, the storage in 75% of the months is less than 166 and 119 MCM, respectively. The released volume in 75% of months for the MOEPO and SOP equals 40 and 44 MCM, respectively. These algorithms’ deficiencies in 75% of the study period are less than 0.4 and 2.2 MCM, respectively. The storage, released, and the deficiencies for the MOEPO in 75% of the months are less than 61, 32 and 0.3 MCM, respectively. These amounts are 67, 29 and 1.8 MCM for SOP, respectively (Figure 10). According to Figure 11, the amount of storage in the dam reservoir related to the MOEPO and SOP in 75% of the months is less than 59, 60 and 65 MCM, respectively. The volume of water re-leased in 75% of the months is less than 44, 38 and 32 MCM, respectively. Deficiencies are less than 0.9 MCM in 75% of months for the MOEPO, and less than 1.6 MCM for SOP.
In these figures, the released volume calculated by the MOEPO in the baseline is less than the released volume by the SOP. Subsequently, the stored volume in these scenarios is higher than the SOP. Regarding the released volume and meeting the demands as shown in part (c) of the Figures, the SOP has tried to make the allocated water equal to the demands, and the deficiency volume is less than the MOEPO. As mentioned earlier, the primary purpose of the optimization method is to reduce the vulnerability index and increase the reliability index, which means that this optimization algorithm, in addition to meeting the demands, is to increase reservoir resilience. In fact, the MOEPO, by applying minor deficiencies throughout the operation time, tries to reduce the number of failures and the deficiency amounts to increase the capacity to supply demands. A comparison of the third and first scenarios shows that released volume has increased (about 16%) due to an increase in the demand volume over time. The second and third scenario comparison results indicate that the released volume in the third scenario is more consistent with the demand volume. In addition, based on part (b) of all figures, storage volume in the third scenario is less than in the other two scenarios. In general, based on Figure 9, Figure 10 and Figure 11, the third scenario is more suitable for future conditions.
To evaluate the dam reservoir’s performance, the values of two vulnerability and reliability indexes in different scenarios are compared in Table 4. Reservoir allocation using the multi-objective optimization method improves the reliability and vulnerability indexes by about (25%, 35%) and (26%, 31%) in baseline and future periods, respectively. In addition, according to Figure 10 and Figure 11 and Table 5, it is necessary to mention that the baseline rule is not appropriate for the future period; in fact, this will reduce the dam reservoir performance indexes. So, applying future rules for the future period (scenario 3) can be helpful to face this issue.
4. Discussion
According to this study’s contents, using obtained rules of MOPEO improved the resilience and performance of the dam reservoir in the study area. The use of multi-objective optimization will reduce the number of failures and general deficiencies of the dam reservoir system during the operation period compared to the SOP allocation rule. This subject is also investigated in [5,65,66]. In [67], the performance of multi-objective Modified Genetic Programming in optimizing dam allocation with the SOP method is investigated. This study also shows that the valuable roles of multi-objective optimization rules improve dam reservoir performance compared to SOP.
5. Conclusions
In this research, in the first step, two reservoir management method, SOP and HR, were evaluated, and two algorithms, EPOad and EPOba, was used for the simulation of this part. The validation results of algorithms in the extraction of the SOP indicated an appropriate performance of the EPOad. In other words, the EPOad improved the objective function by 57% over the EPOba in reconstructing the SOP and decreased RMSE by 1.27%, and NS increased by 4% compared to the EPOba.
After proving the effectiveness of the proposed EPOad and EPOba approach, it was used to derive the HR. The result of this part is also the EPOad will improve the objective function by 15% compared to the EPOba approach. Next, the optimal allocation rules (storge and deficit volume changes) based on EPOad and EPOba approaches for baseline and futures were compared in four scenarios. The results indicated the higher performance of the EPOad.
A comparison of the first and second scenarios showed that the use of EPOad resulted in an 11% increase in reliability, a 40% decrease in vulnerability indexes in the baseline. Additionally, in the third and fourth scenarios, the use of EPOad increased the reliability index by 12% and reduced the vulnerability index by 5%. The results showed that in the second and fourth scenarios using EPOad (future period), the reliability and vulnerability indexes in the future compared to the baseline will increase by 43% and decrease by 44%, respectively. Meanwhile, in the first and third scenarios, the above indexes will decrease by 44% and increase by 26%, respectively. In other words, the status of Reservoir Performance Indexes in both algorithms declined in future compared to the baseline period.
The optimal multi-objective rules in the baseline were evaluated for water demand in the next step. For this purpose, three scenarios are defined. The storage, deficiencies and release volumes were calculated by the MOEPO for the three scenarios. The release volume in the third was higher than in the first scenario. This happened due to the increase in water demand in the third scenario compared to the first. Comparing the third and second scenarios showed that the release volume was more in line with the demand volume in the third scenario. Overall, the results showed that the dam performance has improved in the third scenario.
Finally, to evaluate the reservoir’s performance in meeting the demand, the values of the objective functions were compared in the three scenarios. The comparison of objective functions in the first and second scenarios showed that the rules derived from the baseline were not suitable for future period. On the other hand, the comparison of the second and third scenarios showed that by applying future rules in the third scenario for future conditions, in the Reliability Index of 46%, the Vulnerability Index improved about 38%.
Based on the results of this research, the following conclusions can be drawn:
- The boolean function increased the accuracy and performance of the generated allocation rules.
- The multi-objective optimization policy, SOP, and HR were classified from the most to the least based on improving the Performance Indexes.
- To increase the performance of the dam reservoir, it is necessary to generate particular management policies for each interval.
- The suggestions for future study are:
- Comparing this Metaheaustric algorithm with other well-known in terms of solving time consumption, convergence, etc.
- Investigating the Agriculture adaptation strategies (Deficit Irrigation, Changing cultivation date, etc.) in improving the system performance.
- Investigating other decision variables in Performance Indexes.
The optimization can be extended to the field of consumption and demands. In this study, only the issue of managing the volume of released water from the dam reservoir is discussed, a limitation that can be addressed in prospective investigations.
Author Contributions
All authors contributed to the study’s conception and design. Material preparation, data collection and analysis were performed by I.Y., M.B. and J.Á.-G. All authors have read and agreed to the published version of the manuscript.
Funding
This publication has been funded by the Consejería de Economía, Ciencia y Agenda Digital de la Junta de Extremadura and by the European Regional Development Fund of the European Union through the reference grant GR21161.
Data Availability Statement
The authors confirm that all data supporting the findings of this study are available from the corresponding author by request.
Conflicts of Interest
The authors declare no conflict of interest.
Appendix A
Appendix A.1. Standard Operation Policy
One of the situations in which reservoir operation simulation is performed is the Standard Operation Policy (SOP). This method is also called S-shaped curve of operation. In this multi-conditional rule, the amount of available water is considered as a threshold for determining the release of the reservoir. In this rule, available water is defined as the volume of storage in the reservoir, plus the amount of inflow with the deduction of losses due to evaporation, as follows (Equation (A1)).
where:
- AWt: Available water volume during period t
- St: Reservoir storage volume in the t period
- Qt: Inflow volume during the period t
- Et: Evaporation depth from the surface of the reservoir during the t period
- At and At+1: the reservoir surface areas at the beginning and end of the t th period, which use Equations (A3) and (A4), respectively.where a0 and a1 are constant coefficients of the surface-volume curve of the reservoir.
The total output rule (sum of discharge and overflow) based on the SOP can be as follows (Equation (A5)):
where:
- rspt: total output based on SOP (observational) in t period
- D: the average volume of demand over the entire period of operation.
- Smax: the maximum volume or reservoir capacity (constant number).
Appendix A.2. Hedging Rule
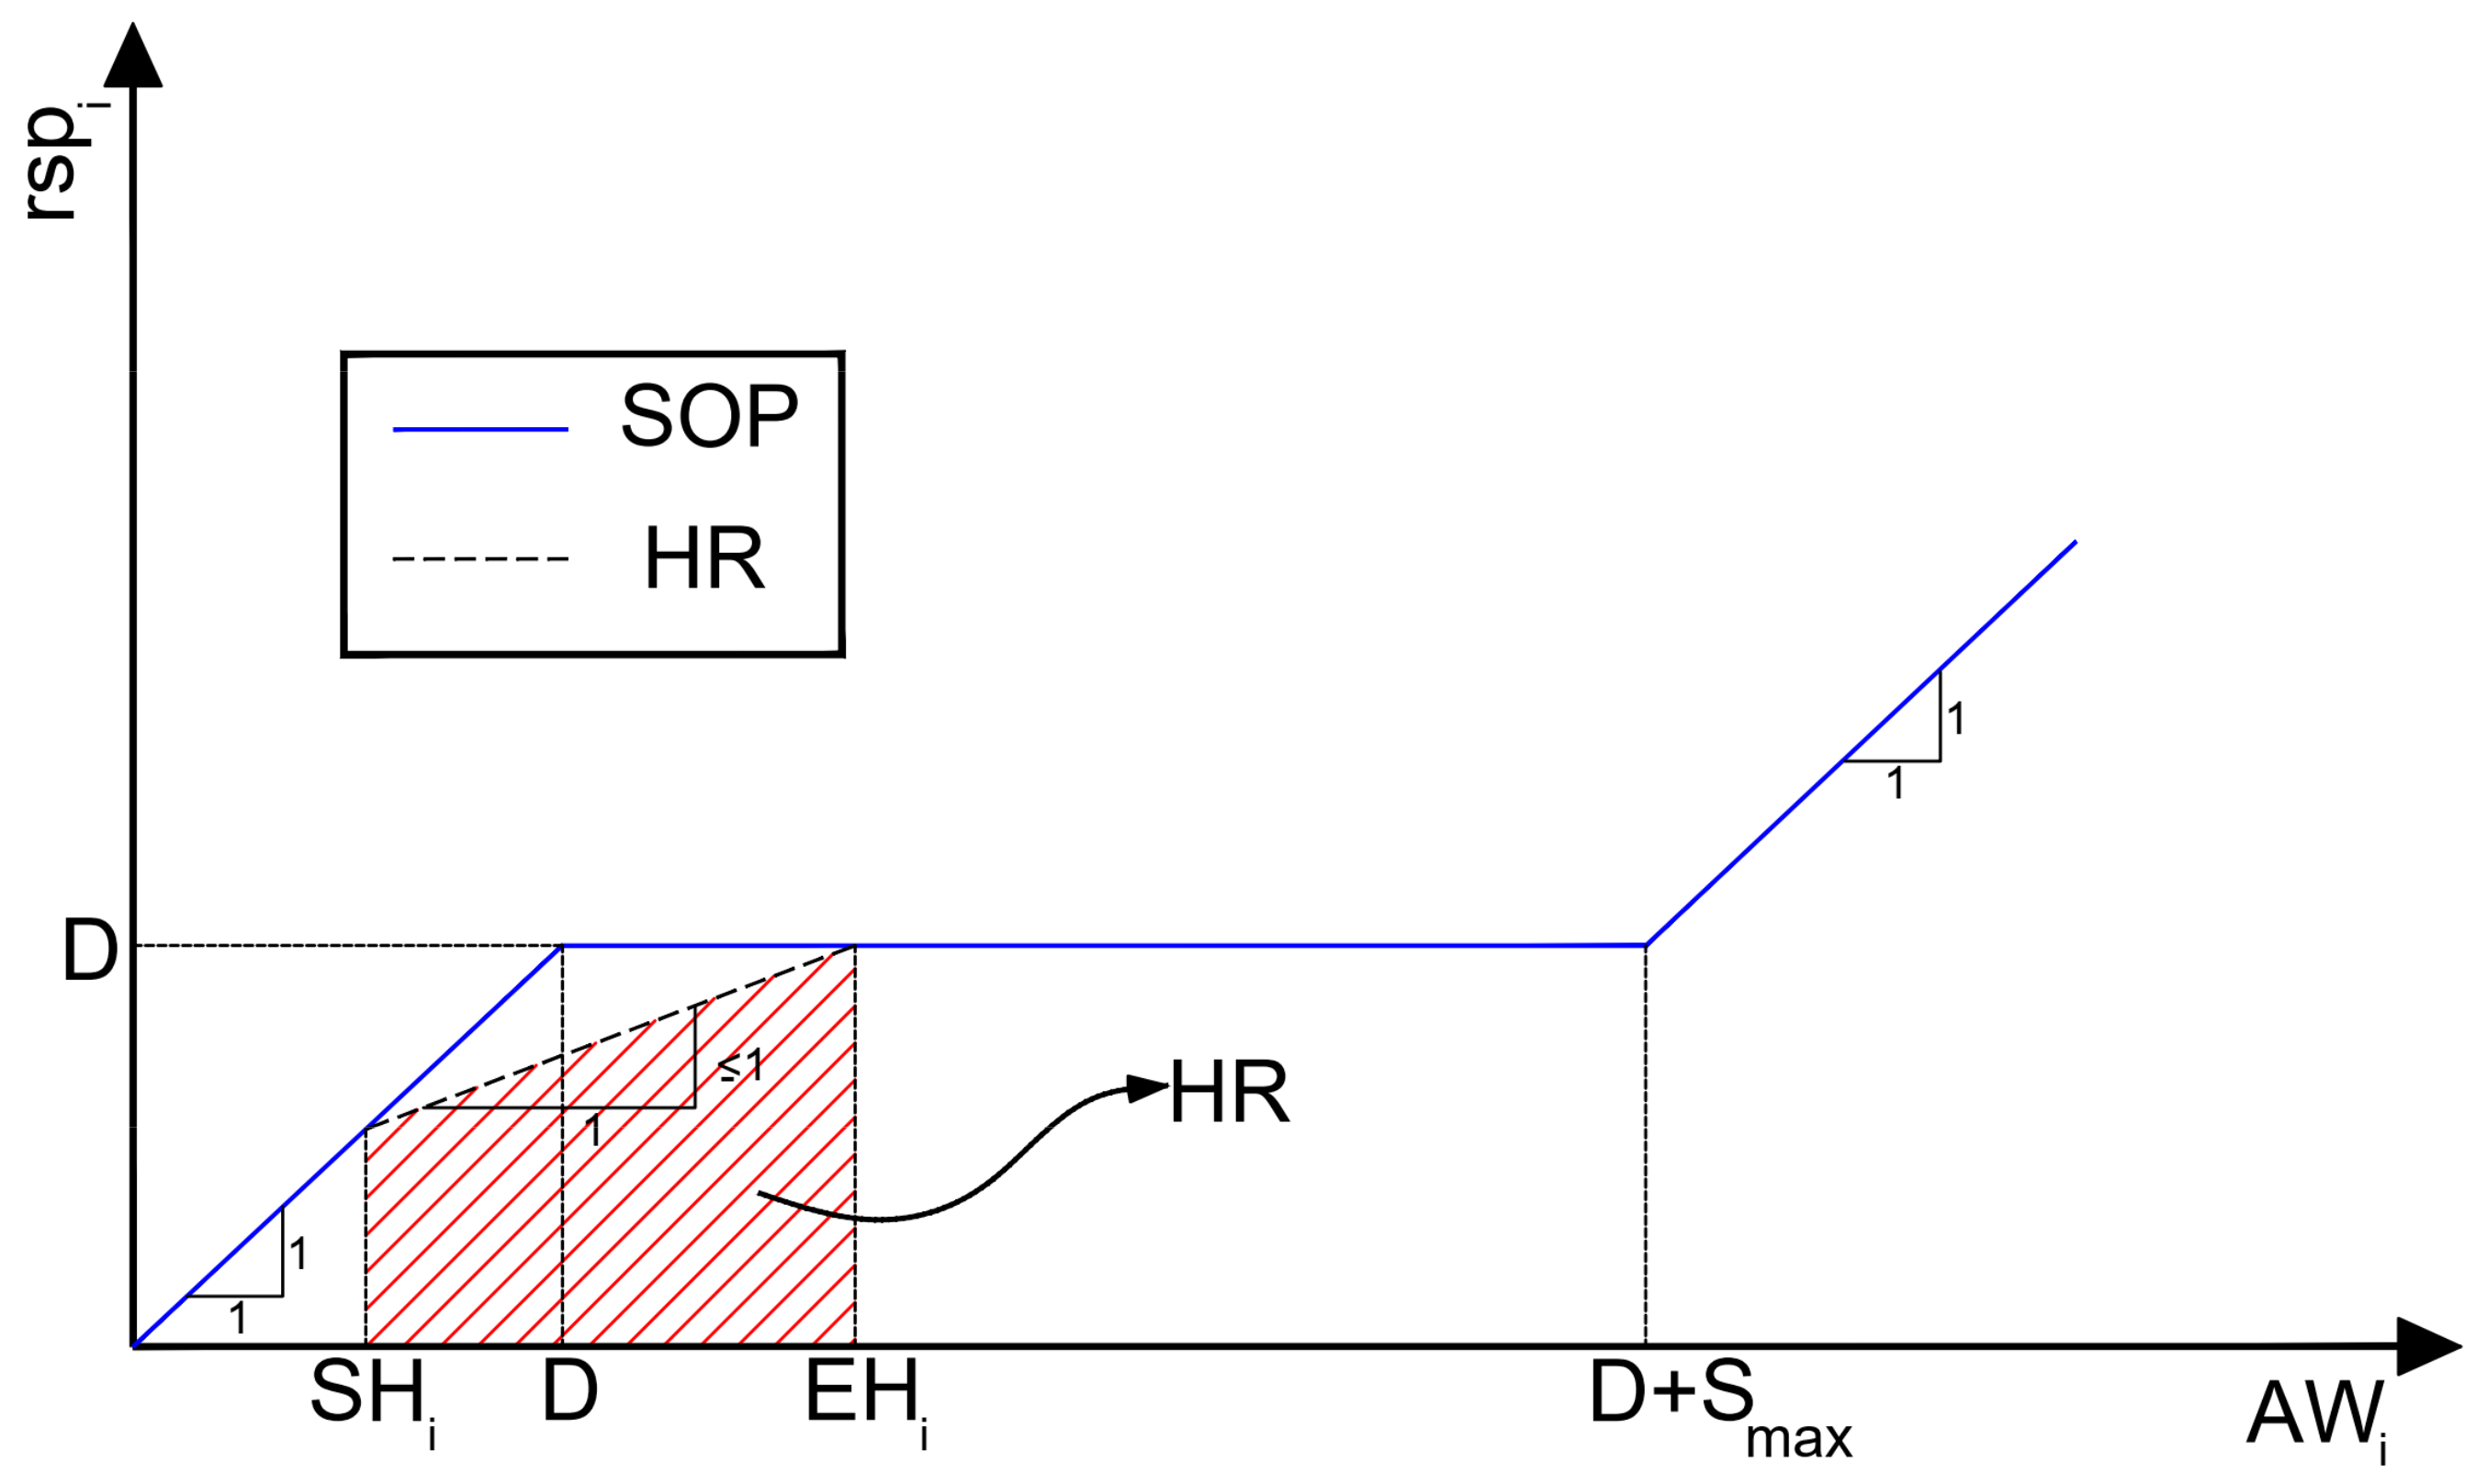
One of the common water resources management strategies is to limit the allocation of water demand, even in cases where there are enough reserves to provide. This approach is used through methods called Hedging Rule in reservoir management. The HR aims to reduce the damage caused by a severe deficiency in exchange for accepting more extended periods of deficiency with less intensity. Therefore, this rule is based on the principle that when the estimated capacity of the reservoir, which is determined by available water, is below the threshold. To preserve water for future use, a hedging is started. As can be seen in Figure A1, when the available water is between the SH and EH limits, the hedging will be in place. These two limits are called the Start Hedging (SH) and the End Hedging (EH), respectively. The SH varies between 0 and D and EH between D and D + S. The operation policy for D = EH = SH is the same as the SOP in which there would be no hedging. The objective function can be to minimize the LSR (Long-term Shortage Ratio) in allocating to the average demand in the operating range.
Figure A1.
Comparison of HR and SOP.

To start the HR, a threshold volume is required, and the threshold volume is determined using the total storage St and the inflow to the reservoir Q(t) in the current period. According to this policy, at the time of applying HR, the demand and, consequently, the reservoir output is a function of the storage volume at the beginning of the current period plus the anticipated inflow. The objective function is to minimize the LSR defined in Equation (A6).
Appendix A.2.1. Objective Function
The objective function of HR can be found in Equation (A6).
- LSR: Long-term Shortage Ratio (as objective function)
- RSPHt: total output (sum of release and overflow) based on the HR in t period.
- Dt: the demand in t.
- Dmax: the highest demand during t.
The penalty in the above equation is defined as follows (Equations (A7)–(A9)).
Appendix A.2.2. Constraint
The constraint used to apply HR are as follows (Equations (A10) and (A11)).
where
- St: the reservoir storage in t.
- Smin: reservoir dead volume.
is calculated according to Equation (A12) and according to Equation (A13).
HR starts when the storage volume plus the amount of inflow is smaller than the value of Kp multiplied by the monthly demand, and the amount of release is obtained according to the Equation (A14). If this value is larger, the reservoir will supply the total demand.
Appendix A.3. Multi Objective Optimization of Dam Reservoir Operation
To achieve this maximum resilience, the problem of reservoir operation with two objective functions are expressed as Equations (A15) and (A16).
In the above Equations:
- F(u1): Objective function related to the vulnerability index
- F(u2): Objective function related to the reliability index
- Dt: Demand volume in the t period
- Dmax: Maximum demand in the under-review period.
- : the released volume from the reservoir in t period.
The constraints applied to the reservoir operation are presented in Equations (A17) and (A18).
Smin is the minimum volume or dead volume of the reservoir, which can be obtained from the continuity equation (Equation (A19)). In this equation, time steps are considered monthly.
where St+1 and St are reservoir storage volumes at the beginning and end of t and t + 1 periods, respectively, Qt is amount of inflow volume to the reservoir during the t period, Ret is the volume of release from the reservoir during the t period, SPt is the amount of overflow volume from the reservoir at the beginning of the t period (Equation (A20)) and LEt is the volume of losses due to evaporation from reservoir surface during t period.
where Smax is the maximum volume of reservoir capacity and St+1 is reservoir storage volume at the beginning and end of the t + 1 the period.
In this study, penalty values are added to the objective functions if the constraints are violated, as shown in Equations (A21) and (A22).
where Penalty1 is the penalty function is the allocation problem due to the violation of the constraint of Equation (A22) and Penalty2 is the penalty function is the specialized problem due to the violation of the constraint of the Equation (A23) and the coefficients to are the positive constants of the penalty function. In these cases, the penalty functions are added to the objective functions as follows (Equations (A23) and (A24)).
References
- Raje, D.; Mujumdar, P.P. Reservoir Performance under Uncertainty in Hydrologic Impacts of Climate Change. Adv. Water Resour. 2010, 33, 312–326. [Google Scholar] [CrossRef]
- Neelakantan, T.; Sasireka, K. Hydropower Reservoir Operation Using Standard Operating and Standard Hedging Policies. Citeseer 2013, 5, 1191–1196. [Google Scholar]
- Men, B.; Wu, Z.; Li, Y.; Liu, H. Reservoir Operation Policy Based on Joint Hedging Rules. Water 2019, 11, 419. [Google Scholar] [CrossRef] [Green Version]
- Zhao, J.; Cai, X.; Wang, Z. Optimality Conditions for a Two-stage Reservoir Operation Problem. Water Resour. Res. 2011, 47. [Google Scholar] [CrossRef]
- Alimohammadi, H.; Massah Bavani, A.R.; Roozbahani, A. Mitigating the Impacts of Climate Change on the Performance of Multi-Purpose Reservoirs by Changing the Operation Policy from SOP to MLDR. Water Resour. Manag. 2020, 34, 1495–1516. [Google Scholar] [CrossRef]
- Sattari, M.T.; Apaydin, H.; Ozturk, F. Operation Analysis of Eleviyan Irrigation Reservoir Dam by Optimization and Stochastic Simulation. Stoch. Environ. Res. Risk Assess. 2009, 23, 1187–1201. [Google Scholar] [CrossRef]
- Allawi, M.F.; Jaafar, O.; Hamzah, F.M.; El-Shafie, A. Novel Reservoir System Simulation Procedure for Gap Minimization between Water Supply and Demand. J. Clean. Prod. 2019, 206, 928–943. [Google Scholar] [CrossRef]
- Mansouri, S.; Fathian, H.; Shahbazi, A.N.; Lour, M.A.; Asareh, A. Multi Objective Simulation-Optimization Operation of Dam Reservoir in Low Water Regions Based on Hedging Principles. Res. Sq. 2022. [Google Scholar] [CrossRef]
- Allawi, M.F.; Jaafar, O.; Mohamad Hamzah, F.; Abdullah, S.M.S.; El-Shafie, A. Review on Applications of Artificial Intelligence Methods for Dam and Reservoir-Hydro-Environment Models. Environ. Sci. Pollut. Res. 2018, 25, 13446–13469. [Google Scholar] [CrossRef]
- Hue, C.; Boullé, M.; Lemaire, V. Online Learning of Aweighted Selective Naive Bayes Classifier with Non-Convex Optimization. Stud. Comput. Intell. 2017, 665, 3–17. [Google Scholar] [CrossRef]
- Cruz-Duarte, J.M.; Amaya, I.; Ortiz-Bayliss, J.C.; Pillay, N. Naïve Hyper-Heuristic Online Learning to Generate Unfolded Population-Based Metaheuristics to Solve Continuous Optimization Problems. In Proceedings of the 2021 IEEE Symposium Series on Computational Intelligence, SSCI 2021, Orlando, FL, USA, 5–7 December 2021. [Google Scholar] [CrossRef]
- Goodarzian, F.; Kumar, V.; Abraham, A. Hybrid Meta-Heuristic Algorithms for a Supply Chain Network Considering Different Carbon Emission Regulations Using Big Data Characteristics. Soft Comput. 2021, 25, 7527–7557. [Google Scholar] [CrossRef]
- Fathollahi-Fard, A.M.; Dulebenets, M.A.; Hajiaghaei-Keshteli, M.; Tavakkoli-Moghaddam, R.; Safaeian, M.; Mirzahosseinian, H. Two Hybrid Meta-Heuristic Algorithms for a Dual-Channel Closed-Loop Supply Chain Network Design Problem in the Tire Industry under Uncertainty. Adv. Eng. Inform. 2021, 50, 101418. [Google Scholar] [CrossRef]
- Rabbani, M.; Oladzad-Abbasabady, N.; Akbarian-Saravi, N. Ambulance Routing in Disaster Response Considering Variable Patient Condition: NSGA-II and MOPSO Algorithms. J. Ind. Manag. Optim. 2022, 18, 1035–1062. [Google Scholar] [CrossRef]
- Dulebenets, M.A. An Adaptive Polyploid Memetic Algorithm for Scheduling Trucks at a Cross-Docking Terminal. Inf. Sci. 2021, 565, 390–421. [Google Scholar] [CrossRef]
- Pasha, J.; Nwodu, A.L.; Fathollahi-Fard, A.M.; Tian, G.; Li, Z.; Wang, H.; Dulebenets, M.A. Exact and Metaheuristic Algorithms for the Vehicle Routing Problem with a Factory-in-a-Box in Multi-Objective Settings. Adv. Eng. Inform. 2022, 52, 101623. [Google Scholar] [CrossRef]
- Nawi, N.M.; Khan, A.; Rehman, M.Z.; Chiroma, H.; Herawan, T. Weight Optimization in Recurrent Neural Networks with Hybrid Metaheuristic Cuckoo Search Techniques for Data Classification. Math. Probl. Eng. 2015, 2015, 868375. [Google Scholar] [CrossRef] [Green Version]
- Panda, N.; Majhi, S.K. Effectiveness of Swarm-Based Metaheuristic Algorithm in Data Classification Using Pi-Sigma Higher Order Neural Network. Adv. Intell. Syst. Comput. 2021, 1199, 77–88. [Google Scholar] [CrossRef]
- Tu, L.-T.; Bradai, A. On the Performance of Physical Layer Security of RIS-Aided Communications. In Proceedings of the 2021 IEEE Conference on Antenna Measurements & Applications (CAMA); IEEE: Piscataway, NJ, USA, 2021; pp. 570–574. [Google Scholar]
- Gomes, L.S.; Maia, A.G.; de Medeiros, J.D.F. Fuzzified Hedging Rules for a Reservoir in the Brazilian Semiarid Region. Environ. Chall. 2021, 4, 100125. [Google Scholar] [CrossRef]
- Djebedjian, B.; Abdel-Gawad, H.A.A.; Ezzeldin, R.M. Global Performance of Metaheuristic Optimization Tools for Water Distribution Networks. Ain Shams Eng. J. 2021, 12, 223–239. [Google Scholar] [CrossRef]
- Lee, H.M.; Jung, D.; Sadollah, A.; Lee, E.H.; Kim, J.H. Performance Comparison of Metaheuristic Optimization Algorithms Using Water Distribution System Design Benchmarks. In Harmony Search and Nature Inspired Optimization Algorithms; Springer: New York, NY, USA, 2019; pp. 97–104. [Google Scholar]
- Bilal; Pant, M. Parameter Optimization of Water Distribution Network–A Hybrid Metaheuristic Approach. Mater. Manuf. Processes 2020, 35, 737–749. [Google Scholar] [CrossRef]
- NA, S. Groundwater Vulnerability Mapping Using the Modified DRASTIC Model: The Metaheuristic Algorithm Approach. Environ. Monit. Assess. 2021, 193, 1–19. [Google Scholar]
- Karimi-Rizvandi, S.; Goodarzi, H.V.; Afkoueieh, J.H.; Chung, I.-M.; Kisi, O.; Kim, S.; Linh, N.T.T. Groundwater-Potential Mapping Using a Self-Learning Bayesian Network Model: A Comparison among Metaheuristic Algorithms. Water 2021, 13, 658. [Google Scholar] [CrossRef]
- Al-Fugara, A.; Ahmadlou, M.; Shatnawi, R.; AlAyyash, S.; Al-Adamat, R.; Al-Shabeeb, A.A.-R.; Soni, S. Novel Hybrid Models Combining Meta-Heuristic Algorithms with Support Vector Regression (SVR) for Groundwater Potential Mapping. Geocarto Int. 2022, 37, 2627–2646. [Google Scholar] [CrossRef]
- Samantaray, S.; Das, S.S.; Sahoo, A.; Satapathy, D.P. Evaluating the Application of Metaheuristic Approaches for Flood Simulation Using GIS: A Case Study of Baitarani River Basin, India. Mater. Today Proc. 2022, 61, 452–465. [Google Scholar] [CrossRef]
- Yin, J.; Guo, S.; Wu, X.; Yang, G.; Xiong, F.; Zhou, Y. A Meta-Heuristic Approach for Multivariate Design Flood Quantile Estimation Incorporating Historical Information. Hydrol. Res. 2019, 50, 526–544. [Google Scholar] [CrossRef]
- Song, C.; Yao, L.; Hua, C.; Ni, Q. Comprehensive Water Quality Evaluation Based on Kernel Extreme Learning Machine Optimized with the Sparrow Search Algorithm in Luoyang River Basin, China. Environ. Earth Sci. 2021, 80, 1–10. [Google Scholar] [CrossRef]
- Almubaidin, M.A.A.; Ahmed, A.N.; Sidek, L.B.M.; Elshafie, A. Using Metaheuristics Algorithms (MHAs) to Optimize Water Supply Operation in Reservoirs: A Review. Arch. Comput. Methods Eng. 2022, 2022, 1–35. [Google Scholar] [CrossRef]
- Dogani, A.; Dourandish, A.; Ghorbani, M.; Shahbazbegian, M.R. A Hybrid Meta-Heuristic for a Bi-Objective Stochastic Optimization of Urban Water Supply System. IEEE Access 2020, 8, 135829–135843. [Google Scholar] [CrossRef]
- Chong, K.L.; Lai, S.H.; Ahmed, A.N.; Zaafar, W.Z.W.; Rao, R.V.; Sherif, M.; Sefelnasr, A.; El-Shafie, A. Review on Dam and Reservoir Optimal Operation for Irrigation and Hydropower Energy Generation Utilizing Meta-Heuristic Algorithms. IEEE Access 2021, 9, 19488–19505. [Google Scholar] [CrossRef]
- Sharifi, M.R.; Akbarifard, S.; Madadi, M.R.; Qaderi, K.; Akbarifard, H. Application of MOMSA Algorithm for Optimal Operation of Karun Multi Objective Multi Reservoir Dams with the Aim of Increasing the Energy Generation. Energy Strategy Rev. 2022, 42, 100883. [Google Scholar] [CrossRef]
- Donyaii, A.; Sarraf, A.; Ahmadi, H. Application of a New Approach in Optimizing the Operation of the Multi-Objective Reservoir. J. Hydraul. Struct. 2020, 6, 1–20. [Google Scholar]
- Donyaii, A.; Sarraf, A.; Ahmadi, H. Evaluation of Whale, Fruit Fly and Cuckoo Search Algorithms in Optimizing Multi-Objective Operation of Golestan Dam Reservoir Based on Multi-Criteria Decision-Making Method. Water Resour. Eng. 2020, 13, 85–100. [Google Scholar]
- Babamiri, O.; Marofi, S. A Multi-Objective Simulation–Optimization Approach for Water Resource Planning of Reservoir–River Systems Based on a Coupled Quantity–Quality Model. Environ. Earth Sci. 2021, 80, 1–19. [Google Scholar] [CrossRef]
- Azari, A.; Hamzeh, S.; Naderi, S. Multi-Objective Optimization of the Reservoir System Operation by Using the Hedging Policy. Water Resour. Manag. 2018, 32, 2061–2078. [Google Scholar] [CrossRef]
- Zhao, S.Z.; Suganthan, P.N. Two-Lbests Based Multi-Objective Particle Swarm Optimizer. Eng. Optim. 2011, 43, 1–17. [Google Scholar] [CrossRef]
- Sun, Y.; Guan, Y.; Wang, H.; Wu, G. Autotrophic Nitrogen Removal in Combined Nitritation and Anammox Systems through Intermittent Aeration and Possible Microbial Interactions by Quorum Sensing Analysis. Bioresour. Technol. 2019, 272, 146–155. [Google Scholar] [CrossRef]
- Ravi, V.; Pradeepkumar, D.; Deb, K. Financial Time Series Prediction Using Hybrids of Chaos Theory, Multi-Layer Perceptron and Multi-Objective Evolutionary Algorithms. Swarm Evol. Comput. 2017, 36, 136–149. [Google Scholar] [CrossRef]
- Qi, R.; Qian, F.; Li, S.; Wang, Z. Chaos-Genetic Algorithm for Multiobjective Optimization. In Proceedings of the World Congress on Intelligent Control and Automation (WCICA), Dalian, China, 21–23 June 2006; Volume 1, pp. 1563–1566. [Google Scholar]
- Marichelvam, M.K.; Prabaharan, T.; Yang, X.S. A Discrete Firefly Algorithm for the Multi-Objective Hybrid Flowshop Scheduling Problems. IEEE Trans. Evol. Comput. 2014, 18, 301–305. [Google Scholar] [CrossRef]
- Patel, V.K.; Savsani, V.J. A Multi-Objective Improved Teaching-Learning Based Optimization Algorithm (MO-ITLBO). Inf. Sci. 2016, 357, 182–200. [Google Scholar] [CrossRef]
- Rashedi, E.; Rashedi, E.; Nezamabadi-pour, H. A Comprehensive Survey on Gravitational Search Algorithm. Swarm Evol. Comput. 2018, 41, 141–158. [Google Scholar] [CrossRef]
- Cheng, J.; Yen, G.G.; Zhang, G. A Grid-Based Adaptive Multi-Objective Differential Evolution Algorithm. Inf. Sci. 2016, 367–368, 890–908. [Google Scholar] [CrossRef]
- Yosefipoor, P.; Saadatpour, M.; Solis, S.S.; Afshar, A. An Adaptive Surrogate-Based, Multi-Pollutant, and Multi-Objective Optimization for River-Reservoir System Management. Ecol. Eng. 2022, 175, 106487. [Google Scholar] [CrossRef]
- Wang, Y.; Xie, J.; Xu, Y.-P.; Guo, Y.; Wang, Y. Scenario-Based Multi-Objective Optimization of Reservoirs in Silt-Laden Rivers: A Case Study in the Lower Yellow River. Sci. Total Environ. 2022, 829, 154565. [Google Scholar] [CrossRef] [PubMed]
- Talatahari, S.; Aalami, M.T.; Parsiavash, R. Multi-Objective Optimization of Double Curvature Arch Dams Subjected to Seismic Loading Using Charged System Search. arXiv 2022, arXiv:arXiv.2207.04366. [Google Scholar]
- Wolpert, D.H.; Macready, W.G. No Free Lunch Theorems for Optimization. IEEE Trans. Evol. Comput. 1997, 1, 67–82. [Google Scholar] [CrossRef] [Green Version]
- Solgi, M.; Bozorg-Haddad, O.; Loáiciga, H.A. A Multi-Objective Optimization Model for Operation of Intermittent Water Distribution Networks. Water Supply 2020, 20, 2630–2647. [Google Scholar] [CrossRef]
- Kumar, V.; Yadav, S.M. Multi-Objective Reservoir Operation of the Ukai Reservoir System Using an Improved Jaya Algorithm. Water Supply 2022, 22, 2287–2310. [Google Scholar] [CrossRef]
- Yoosefdoost, I.; Khashei-Siuki, A.; Tabari, H.; Mohammadrezapour, O. Runoff Simulation under Future Climate Change Conditions: Performance Comparison of Data-Mining Algorithms and Conceptual Models. Water Resour. Manag. 2022, 2022, 1–25. [Google Scholar] [CrossRef]
- Viertel, K. The Development of the Concept of Uniform Convergence in Karl Weierstrass’s Lectures and Publications between 1861 and 1886. Arch. Hist. Exact Sci. 2021, 75, 455–490. [Google Scholar] [CrossRef]
- Stefánsson, A.; Končar, N.; Jones, A.J. A Note on the Gamma Test. Neural Comput. Appl. 1997, 5, 131–133. [Google Scholar] [CrossRef]
- Doorenbos, J.; Pruitt, W.O. Guidelines for Predicting Crop Water Requirements. FAO Irrig. Drain. Pap. 1977, 24, 144. [Google Scholar]
- Allen, R.G.; Pereira, L.S.; Raes, D.; Smith, M. Crop Evapotranspiration-Guidelines for Computing Crop Water Requirements-FAO Irrigation and Drainage Paper 56. Fao Rome 1998, 300, D05109. [Google Scholar]
- Mohammadrezapour, O.; Yoosefdoost, I.; Ebrahimi, M. Cuckoo Optimization Algorithm in Optimal Water Allocation and Crop Planning under Various Weather Conditions (Case Study: Qazvin Plain, Iran). Neural Comput. Appl. 2017, 31, 1879–1892. [Google Scholar] [CrossRef]
- Ferreira, C. undefined Gene Expression Programming: A New Adaptive Algorithm for Solving Problems. Complex Syst. 2001, 13, 87–129. [Google Scholar]
- Dhiman, G.; Kumar, V. Emperor Penguin Optimizer: A Bio-Inspired Algorithm for Engineering Problems. Knowl. -Based Syst. 2018, 159, 20–50. [Google Scholar] [CrossRef]
- Kaur, H.; Rai, A.; Bhatia, S.S.; Dhiman, G. MOEPO: A Novel Multi-Objective Emperor Penguin Optimizer for Global Optimization: Special Application in Ranking of Cloud Service Providers. Eng. Appl. Artif. Intell. 2020, 96, 104008. [Google Scholar] [CrossRef]
- Zhou, M.; Chen, J.; Huang, H.; Zhang, D.; Zhao, S.; Shadabfar, M. Multi-Source Data Driven Method for Assessing the Rock Mass Quality of a NATM Tunnel Face via Hybrid Ensemble Learning Models. Int. J. Rock Mech. Min. Sci. 2021, 147, 104914. [Google Scholar] [CrossRef]
- Ghorbani, H.; Wood, D.A.; Mohamadian, N.; Rashidi, S.; Davoodi, S.; Soleimanian, A.; Shahvand, A.K.; Mehrad, M. Adaptive Neuro-Fuzzy Algorithm Applied to Predict and Control Multi-Phase Flow Rates through Wellhead Chokes. Flow Meas. Instrum. 2020, 76, 101849. [Google Scholar] [CrossRef]
- Hashimoto, T.; Stedinger, J.R.; Loucks, D.P. Reliability, Resiliency, and Vulnerability Criteria for Water Resource System Performance Evaluation. Water Resour. Res. 1982, 18, 14–20. [Google Scholar] [CrossRef] [Green Version]
- Zou, H.; Liu, D.; Guo, S.; Xiong, L.; Liu, P.; Yin, J.; Zeng, Y.; Zhang, J.; Shen, Y. Quantitative Assessment of Adaptive Measures on Optimal Water Resources Allocation by Using Reliability, Resilience, Vulnerability Indicators. Stoch. Environ. Res. Risk Assess. 2019, 34, 103–119. [Google Scholar] [CrossRef]
- Wang, Z.; Zhen, H.-L.; Deng, J.; Zhang, Q.; Li, X.; Yuan, M.; Zeng, J. Multiobjective Optimization-Aided Decision-Making System for Large-Scale Manufacturing Planning. IEEE Trans. Cybern. 2021, 52, 8326–8339. [Google Scholar] [CrossRef] [PubMed]
- Zhou, Y.; Kang, J.; Kwong, S.; Wang, X.; Zhang, Q. An Evolutionary Multi-Objective Optimization Framework of Discretization-Based Feature Selection for Classification. Swarm Evol. Comput. 2021, 60, 100770. [Google Scholar] [CrossRef]
- Ashofteh, P.-S.; Haddad, O.B.; Akbari-Alashti, H.; Mariño, M.A. Determination of Irrigation Allocation Policy under Climate Change by Genetic Programming. J. Irrig. Drain. Eng. 2014, 141, 04014059. [Google Scholar] [CrossRef] [Green Version]
Figure 1.
Study basin and reference stations used in this research.

Figure 2.
Average monthly inflow volume to the reservoir, average monthly evaporation depth, and the average monthly volume of water demand in the baseline and under climate change conditions.
Figure 2.
Average monthly inflow volume to the reservoir, average monthly evaporation depth, and the average monthly volume of water demand in the baseline and under climate change conditions.

Figure 3.
Flowchart of the research methodology.

Figure 4.
Convergence curve of SOP extraction using EPO algorithms.

Figure 5.
Convergence curve of HR extraction using EPO algorithms.

Figure 6.
Change in output, storage, deficit volume using EPOad and EPOba algorithms in the first and second scenarios: (a) Released water and demand Volume (MCM); (b) Reservoir storage (MCM); (c) Deficit, demand and reservoir inflow volumes (MCM).
Figure 6.
Change in output, storage, deficit volume using EPOad and EPOba algorithms in the first and second scenarios: (a) Released water and demand Volume (MCM); (b) Reservoir storage (MCM); (c) Deficit, demand and reservoir inflow volumes (MCM).

Figure 7.
Change in output, storage, deficit volume using EPOad and EPOba algorithms in the third and fourth scenarios: (a) Released water and demand Volume (MCM); (b) Reservoir storage (MCM); (c) Deficit, demand and reservoir inflow volumes (MCM).
Figure 7.
Change in output, storage, deficit volume using EPOad and EPOba algorithms in the third and fourth scenarios: (a) Released water and demand Volume (MCM); (b) Reservoir storage (MCM); (c) Deficit, demand and reservoir inflow volumes (MCM).

Figure 8.
Comparison of the Pareto curve of two objective functions (vulnerability and reliability Indexes) in the baseline and future periods.
Figure 8.
Comparison of the Pareto curve of two objective functions (vulnerability and reliability Indexes) in the baseline and future periods.

Figure 9.
Comparison of: (a) Released volume; (b) Storage volume; (c) Deficit volume, corresponding to the first scenario.
Figure 9.
Comparison of: (a) Released volume; (b) Storage volume; (c) Deficit volume, corresponding to the first scenario.

Figure 10.
Comparison of: (a) Released volume; (b) Storage volume; (c) Deficit volume, corresponding to the second scenario.
Figure 10.
Comparison of: (a) Released volume; (b) Storage volume; (c) Deficit volume, corresponding to the second scenario.

Figure 11.
Comparison of: (a) Released volume; (b) Storage volume; (c) Deficit volume, corresponding to the third scenario.
Figure 11.
Comparison of: (a) Released volume; (b) Storage volume; (c) Deficit volume, corresponding to the third scenario.


Table 1.
Validation results of EPOba and EPOad in simulating the SOP.
| Algorithm | MAD 1 | MSE 2 | RMSE 3 | MAPE 4 | R(XY) 5 | NS 6 | MAE 7 | R2 | SSE 8 |
|---|---|---|---|---|---|---|---|---|---|
| EPOad | 0.774 | 1.513 | 1.230 | 4.487 | 0.999 | 0.995 | −0.774 | 0.997 | 381.386 |
| EPOba | 0.511 | 12.276 | 3.504 | 2.124 | 0.98 | 0.961 | −0.24 | 0.961 | 3093.48 |
1 Mean Absolute Deviation. 2 Mean Square Error. 3 Root Mean Square Error. 4 Mean Absolute Percentage Error. 5 Correlation Coefficient between X and Y. 6 Nash–Sutcliffe. 7 Mean Absolute Error. 8 Sum of Squared Errors.
Table 2.
Vulnerability and reliability indexes in the four scenarios.
| Scenarios | Reliability (%) | Vulnerability (%) |
|---|---|---|
| First | 43.56 | 9.44 |
| Second | 55.88 | 6.73 |
| Third | 29.74 | 23.45 |
| Fourth | 36.65 | 14.65 |
Table 3.
Validation results of EPOba and EPOad in simulating the SOP.
| Algorithm | MAD | MSE | RMSE | MAPE | R(XY) | NS | MAE | R2 | SSE |
|---|---|---|---|---|---|---|---|---|---|
| EPOad | 1.734 | 22.838 | 4.779 | 10.245 | 0.97 | 0.927 | −0.98 | 0.93 | 5755.17 |
| EPOba | 1.113 | 9.656 | 3.107 | 5.308 | 0.99 | 0.966 | −0.98 | 0.95 | 2433.26 |
Table 4.
Vulnerability and Reliability Indexes in the four scenarios (HR).
| Sc. | Reliability % | Vulnerability % | Parameter Changes in Scenarios | Reliability Change % | Vulnerability Change % |
|---|---|---|---|---|---|
| First | 48.41 | 8.15 | Comparison of the first and second | 11.60 | −40.03 |
| Second | 54.76 | 5.82 | Comparison of the third and fourth | 12.44 | −5.51 |
| Third | 33.49 | 11.11 | Comparison of the first and third | −44.55 | 26.64 |
| Fourth | 38.25 | 10.53 | Comparison of the second and fourth | −43.16 | 44.73 |
Table 5.
The values of the objective functions examined in three scenarios.
| Method | Sc. | Vulnerability % | Reliability % | Parameter Changes in Scenarios | Vulnerability Change % | Reliability Change % |
|---|---|---|---|---|---|---|
| MOEPO | First Scenario | 4.33 | 48 | Comparison of the first and third | 0 | −4.3478 |
| Second Scenario | 5.98 | 46 | Comparison of the Second and third | −38.106 | 0 | |
| Third Scenario | 4.33 | 46 | Comparison of the first and second | 27.592 | −4.3478 | |
| SOP | Baseline Condition | 14 | 48 | Comparison of the first scenario and Baseline condition | −35.714 | 25 |
| Future Condition | 16 | 46 | Comparison of the Second scenario and Baseline condition | −31.25 | 26.087 |
Publisher’s Note: MDPI stays neutral with regard to jurisdictional claims in published maps and institutional affiliations. |
© 2022 by the authors. Licensee MDPI, Basel, Switzerland. This article is an open access article distributed under the terms and conditions of the Creative Commons Attribution (CC BY) license (https://creativecommons.org/licenses/by/4.0/).
Share and Cite
MDPI and ACS Style
Yoosefdoost, I.; Basirifard, M.; Álvarez-García, J. Reservoir Operation Management with New Multi-Objective (MOEPO) and Metaheuristic (EPO) Algorithms. Water 2022, 14, 2329. https://doi.org/10.3390/w14152329
AMA Style
Yoosefdoost I, Basirifard M, Álvarez-García J. Reservoir Operation Management with New Multi-Objective (MOEPO) and Metaheuristic (EPO) Algorithms. Water. 2022; 14(15):2329. https://doi.org/10.3390/w14152329
Chicago/Turabian StyleYoosefdoost, Icen, Milad Basirifard, and José Álvarez-García. 2022. "Reservoir Operation Management with New Multi-Objective (MOEPO) and Metaheuristic (EPO) Algorithms" Water 14, no. 15: 2329. https://doi.org/10.3390/w14152329
Note that from the first issue of 2016, this journal uses article numbers instead of page numbers. See further details here.