Article

Groundwater Extraction Reduction within an Irrigation District by Enhancing the Surface Water Distribution

by
Hamed Tork
1,
Saman Javadi
1,*,
Seyed Mehdy Hashemy Shahdany
1,
Ronny Berndtsson
2,* and
Sami Ghordoyee Milan
1
1
Department of Water Engineering, College of Aburaihan, University of Tehran, Tehran 3391653755, Iran
2
Division of Water Resources Engineering and Centre for Advanced Middle Eastern Studies, Lund University, SE-221 00 Lund, Sweden
*
Authors to whom correspondence should be addressed.
Water 2022, 14(10), 1610; https://doi.org/10.3390/w14101610
Submission received: 6 April 2022 / Revised: 8 May 2022 / Accepted: 10 May 2022 / Published: 17 May 2022

Abstract

:
Today, in developing countries, the low surface water distribution efficiency and the lack of supplying water needs of farmers by surface water resources are compensated by excessive aquifer water withdrawal. This mismanagement has caused a sharp drop in the groundwater level in many countries. On the other hand, climate change and drought have intensified the pressure on water resources. This study aims to evaluate novel strategies for developing surface water distribution systems for stress reduction of the Najafabad aquifer in Isfahan, central plateau of Iran. The performance of several strategies for agricultural water distribution and delivery, such as hydro-mechanical operating system, manual-based operating system, and centralized automatic operating system, was evaluated in this study. In the first step, two indices, i.e., water distribution adequacy and dependability, were obtained using a flow hydraulic simulation model. Then, the water distribution adequacy map and amount of reduction in the water withdrawal of existing wells were determined for each strategy. Finally, using the MODFLOW groundwater simulation model, the changes in groundwater levels due to the normal and drought scenarios (15 and 30%) were extracted during five years for each strategy. The findings for the normal scenario showed that the centralized automatic operating system strategy had the most significant impact on agricultural water management in the surface water distribution system with a 30% increase in agricultural water distribution adequacy index compared to the current situation. This strategy increased the groundwater level by 11.6 m and closed 35% of the groundwater wells. In this scenario, the hydro-mechanical operating system strategy had the weakest performance by increasing the aquifer level by only 1.31 m. In the 15% and 30% drought scenarios, the centralized automatic operating system strategy exerted the best performance among other strategies by increasing the aquifer water level by 10.18 and 9.4 m, respectively, compared to the current situation. Finally, the results showed that the spatial segmentation of the aquifer exerted better efficiency and better monitoring in the more susceptible regions.

1. Introduction

Withdrawal of groundwater resources has increased six-fold over the past century, yet one-third of the world’s population is currently under water stress [1]. Due to population growth and climate change, the pressure on water resources has increased worldwide, especially in arid and semi-arid regions [1,2,3]. The Middle East, North Africa, and the Mediterranean countries are under constant water stress due to the lack of permanent access to surface water, which has led to groundwater being used as a reliable source in these areas [4]. However, excessive exploitation for drinking, industrial, and agricultural uses [5,6] causes depletion of groundwater storage capacity [7], land subsidence [8], ecosystem damage [9], and seawater intrusion [10]. In addition, drought is one of the crucial factors that has intensified the pressure on groundwater resources [11,12,13]. The need for surface water resources has increased with increasing temperature, followed by increased competition in the groundwater withdrawal [3,14,15,16]. In view of this, access to groundwater resources is becoming more critical in warmer and more populous communities [17,18]. In most tropical countries, groundwater is mainly used for agricultural purposes, especially irrigation [19,20]. Modern irrigation methods can create a balance in water supply and demand and allow crop production in semi-desert lands [21]. On the other hand, these methods now use about 90% of the world’s freshwater resources [5].
The widespread distribution of groundwater resources and low-cost infrastructure facilities have led to more than 40% of the world’s regions and 60% of the United States being equipped with irrigation systems [22]. Studies show that the lack of regular maintenance of water distribution systems [23] and the lack of appropriate equipment [24] are among the factors that cause the inability of these systems to supply the water needed by farmers. For example, the total irrigation efficiency of surface water distribution systems in Iran fluctuates between 15 and 36% [25]. Additionally, in a study in Ethiopia, the results showed that 76% of the water transferred to the farm using the traditional distribution systems are wasted [26]. Poor network performance in terms of adequacy and dependability of surface water distribution has made agriculture increasingly dependent on groundwater resources [24]. In a study, Barkhordari et al. (2020) investigated the effects of operation automation on reducing losses in Oklahoma, United States. The operation modeling was performed by the centralized model predictive controller [27]. The modeling results showed that the strategy could be a safe and practical technique to reduce losses due to improper performance of water structures in irrigation and thus improve water efficiency.
The surface irrigation water distribution systems vulnerability becomes apparent under water shortage conditions. Different configurations for automation of these surface water distribution systems have been conducted using various centralized and decentralized techniques to promote farmers’ trust in surface water distribution processes and reduce groundwater extraction [28]. In other words, canal automation projects were initially employed in surface water distribution systems to increase farmers’ flexibility in agricultural water delivery. In this regard, a wide range of the control algorithms, from classical-based to machine learning-oriented approaches, have been extensively employed to meet multiple operating surface water distribution systems objectives [29,30]. Most studies in this field employ a hydraulic simulation model to simulate water distribution by comparing variations of delivered water and agricultural water demand at each catchment and eventually evaluating the performance of the surface water distribution. In this regard, flow hydraulics simulation models such as SOBEK, EPA-SWMM, HEC-RAS, CANALMAN, and SIC or open-source academic models such as ICSS based on the numerical solution of Saint-Venant equations with different numerical schemes are used to achieve the desired objective [31,32]. The high accuracy and reliability of automatic control methods have caused extensive application of automatic control algorithms in the surface water distribution and replacement of controllers with an operator and numerical models with simplified analytical models [33,34,35,36,37].
Although groundwater use as a complementary source to surface water improves the performance of exploitation systems in terms of equity and dependability in water distribution, excessive groundwater withdrawal has adverse effects on the condition of aquifers [38]. For example, 277 plains out of the main 609 plains throughout Iran are in critical water condition [15]. In this regard, proper groundwater management has become a crucial matter globally [13] that should be addressed by planning and providing accurate and practical strategies for recovering groundwater aquifers [39,40,41].
Considering that it is necessary to find novel and improved approaches for reducing groundwater over-exploitation and providing possibilities for aquifer recovery and recharge, the surface water distribution systems’ operation—supplying the demanded water in the irrigation districts—needs to be upgraded. The direct impacts of these systems’ modernization strategies can improve the reliability of the surface water distribution for the farmers, resulting in shut down of pump stations, and providing appropriate recovery time for the aquifers located beneath the irrigation districts. On the other hand, novel modernization strategies should also consider climate change impacts and specifically drought periods as critical factors. In view of this, we aimed to (a) investigate the capabilities of a novel automatic surface water distribution operating system as an aquifer balancing strategy in drought conditions, and (b) to spatially assess the automatic operating system impacts using a groundwater modelling system. To fulfill the objectives, we i) developed a hydraulic simulation model using the integral-delay method to simulate the surface water distribution, ii) simulated groundwater exploitation by considering each strategy, with numerical modeling using the MODFLOW for an arid plain in Central Iran, iii) evaluated the surface water distribution system’s performance under two operation scenarios for normal (without water shortage) and drought (including 15% and 30% water deficit at the canal’s head-source) conditions, and iv) monitored short-term groundwater levels (i.e., five year) after the surface water distribution system’s modernization.

2. Materials and Methods
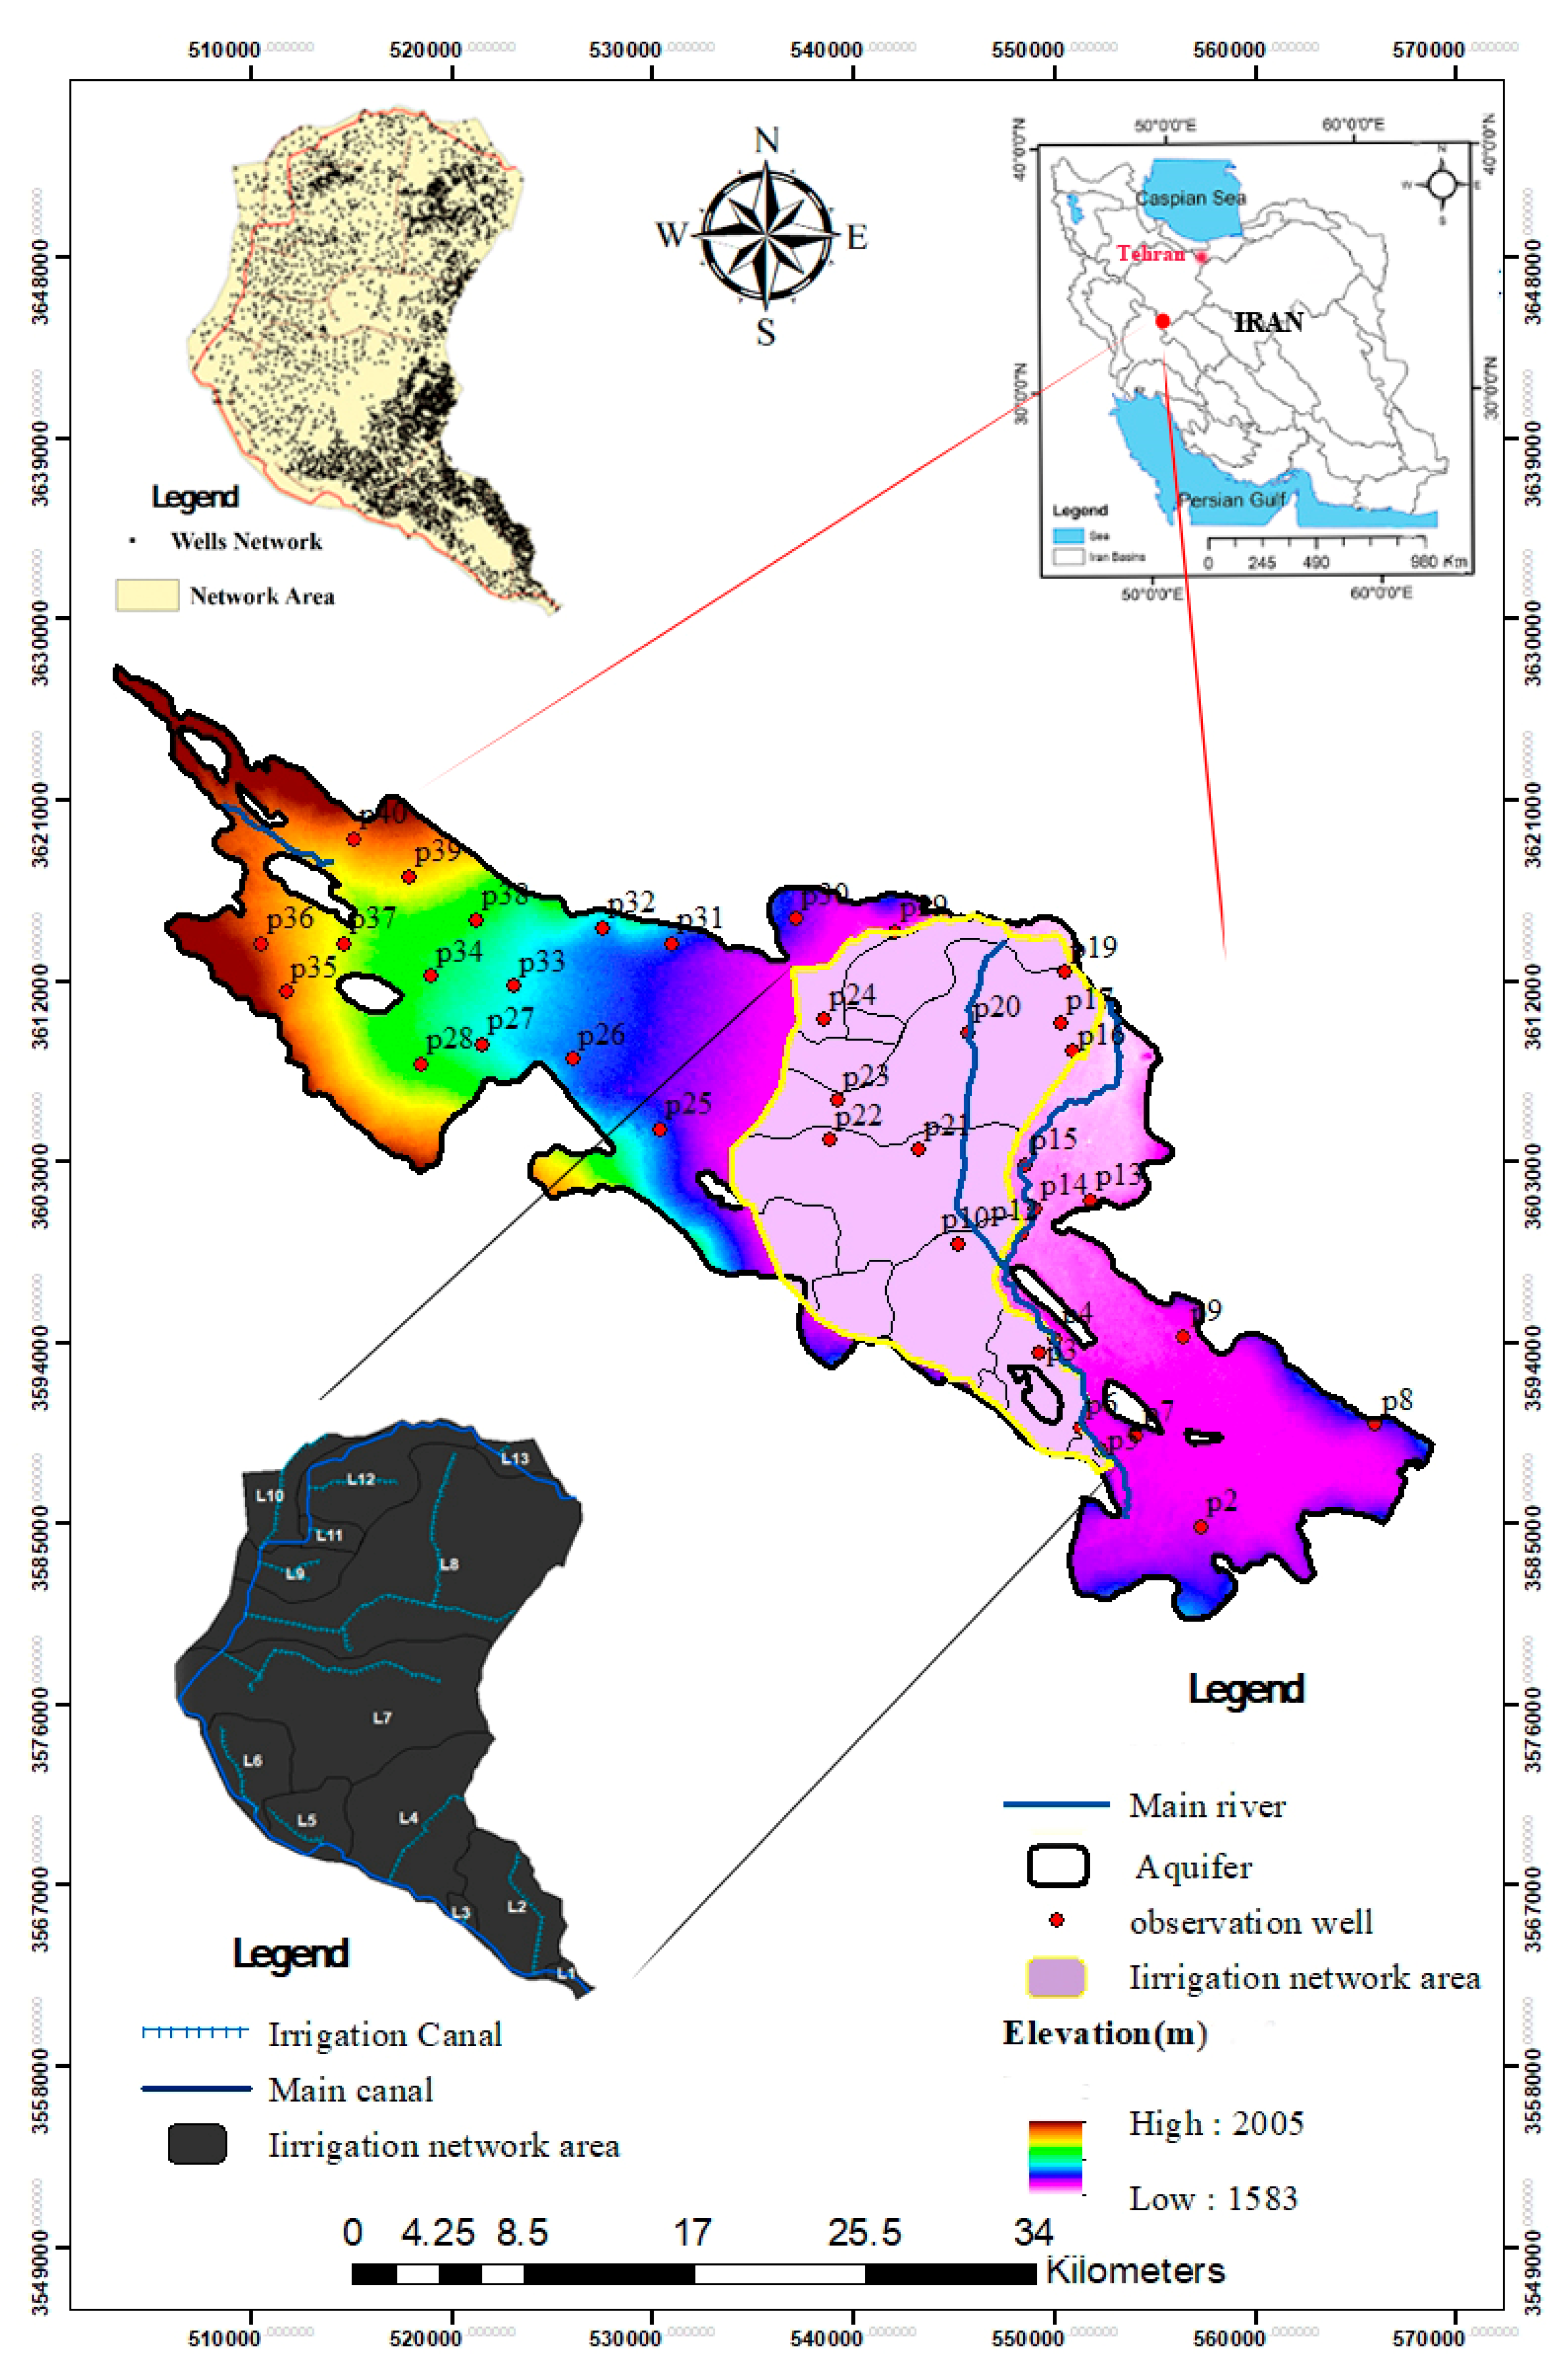
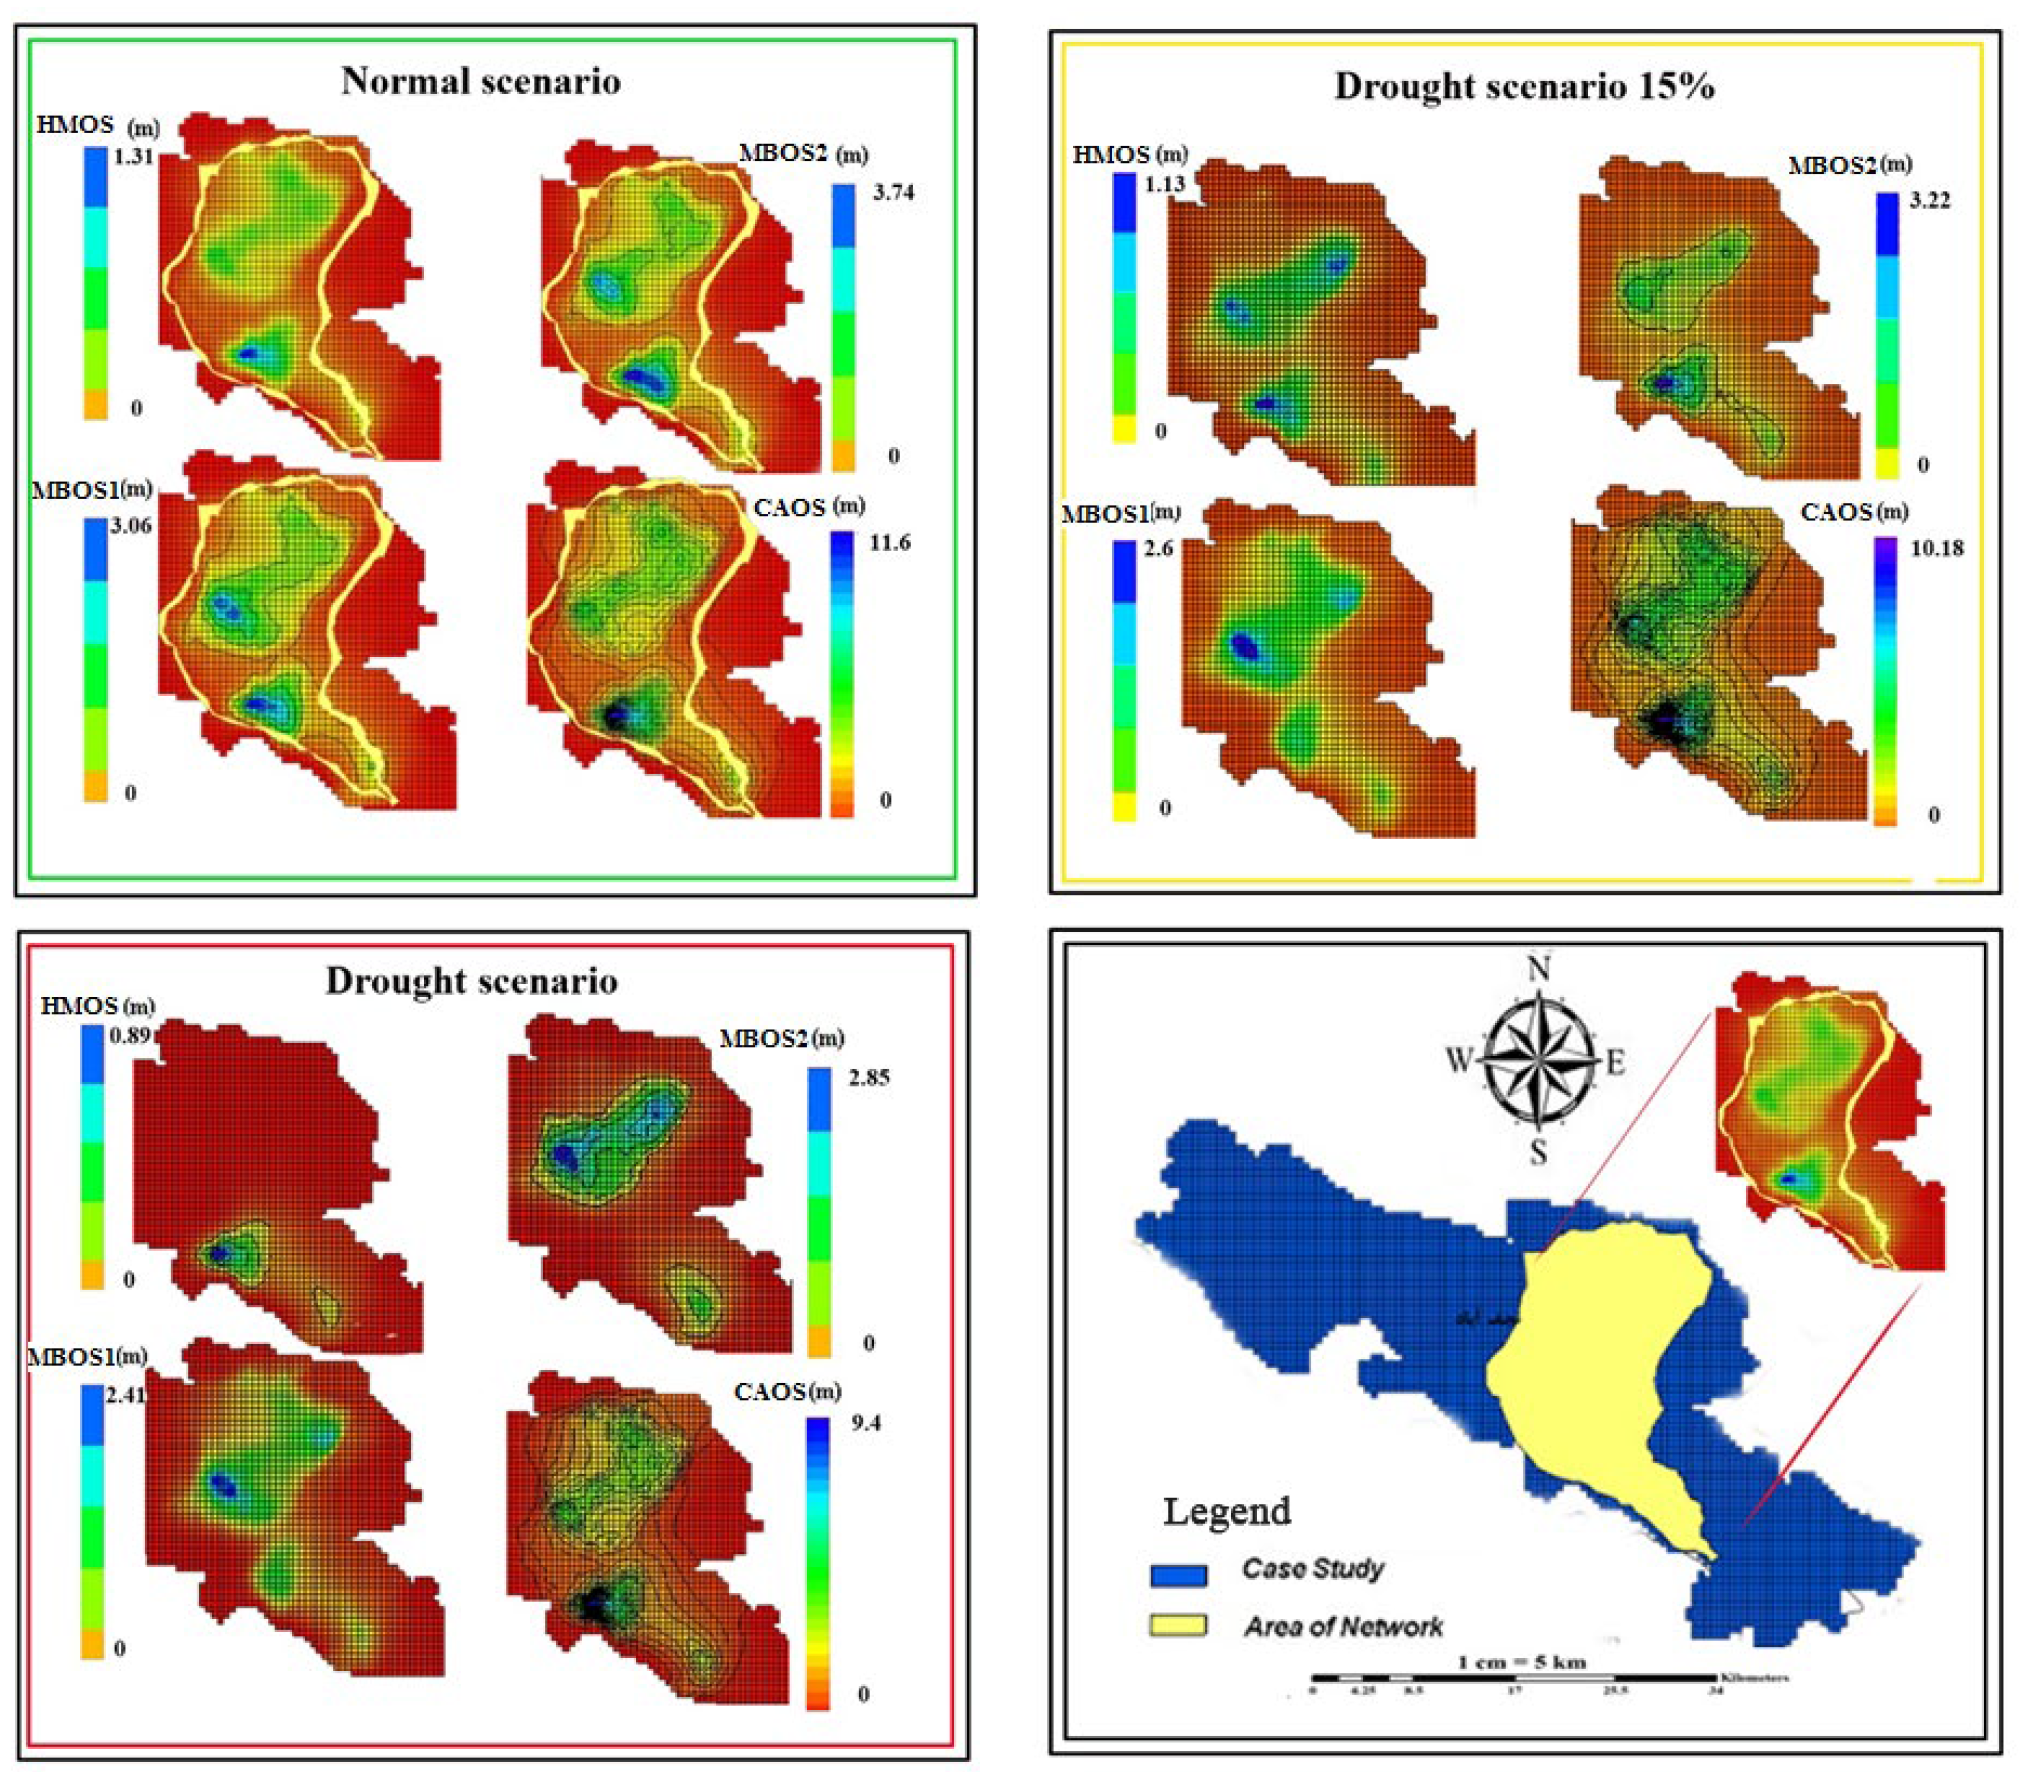
2.1. Study Area

As one of the main areas of the Gavkhouni basin, the Najafabad alluvial aquifer (32°18′–32°50′ N, 50°53′–51°42′ E) is located in the central plateau of Iran. It includes hilly areas (679 km2) and plains (1076 km2). The average annual precipitation, evaporation, and temperature recorded in the area are 175 mm, 2231 mm, and 14.6 °C, respectively. The general groundwater flow throughout the aquifer is from northwest to southeast. Moreover, the maximum groundwater elevation in this aquifer is equal to 1840 m, observed in the northwest, while the minimum elevation is 1540 m, observed in the center due to the excessive pumping of exploitation wells. The Zayanderoud river drains the Najafabad aquifer by passing through the area. During the last decade, climate change and prolonged droughts in the area have undesirably affected the interactions of the aquifer and the river, resulting in a groundwater level decrease and a smaller water discharge from the aquifer to the river [30]. Figure 1 shows that approximately 532 km2 (54% of the area) of the Najafabad region is covered by agricultural lands, meadows cover more than 252 km2 (25%), and the rest includes urban areas and rock.
Because of the high density of exploitation wells in the middle areas of the plain, a conical sinking is observed. According to the Groundwater Budget Report (2012), the flow in southeastern areas of the aquifer is in a northeast–southwest direction. The bedrock comprises shales belonging to the second geological period and is classified as formable rocks. Therefore, water transfer through these plates is at a minimum. The middle and southeastern regions of the aquifer have established transmissivity curves. The amount of transmissivity reaches a maximum of 2000 m2/day in southeastern areas, while its minimum value is 250 m2/day.
Annually, 29.4 mm of rainwater infiltrate directly to the aquifer, with a volume of 26 MCM (million cubic meter). Moreover, the estimated infiltration of surface runoff is about 189.2 MCM. About 883.1 MCM per year are extracted from the exploitation wells, from which 860.2, 17.2, and 5.7 MCM are used in agriculture, industry, and urban water supply, respectively. Irrigation infiltration and industrial–urban return flow are 424.8 and 58.9 MCM/year, respectively. The evaporation from the watershed is 0.8 MCM/year due to the shallow depth of the water table in some parts of the study area. The yearly water level drop of the aquifer is 1.3 m. In addition, the over-exploitation compared to the groundwater aquifer balance is estimated at 138 MCM [42].
An area of 29,000 ha is covered by the Nekouabad surface water distribution network. The network is located in 13 separate areas in the Najafabad aquifer (Figure 1). The Zayanderoud dam located upstream of the basin is the primary source of the water supply of the network. In the last years, undesirable agricultural water distribution management has resulted in a 30 to 40% decrease in inflow to the agricultural water distribution network. Thus, today’s agriculture in the study area is more based on groundwater resources than surface water. About 72% of the annual withdrawals (370 MCM) of 15,000 exploitation wells are consumed by the Nekouabad surface water distribution system, and the rest by other uses.

2.2. Simulation of Surface Water Distribution Management

The flow rate delivered to each catchment along the main canal of the network was determined by simulating the flow hydraulics to evaluate the current management of the surface water distribution network. The MATLAB 2018b programming environment was used to develop a mathematical model for the flow hydraulics in the main canal of the surface water distribution system to exchange information between the model and the controller. Several mathematical models have been introduced for the design of the controllers, each with its own weaknesses and strengths [43,44,45]. The integral-delay model, first proposed by Schormans (1997), is a widely used model in water systems projects for the automation of irrigation canals because of its simplicity and high reliability [43,44,45,46,47]. In this study, the integral-delay model was used for flow simulation in the study canal.

2.2.1. Performance Evaluation Indices

The water distribution adequacy and dependability indices were used to investigate the performance of agricultural water management by applying balancing strategies in the surface water distribution network. The adequacy and dependability indices examine the distribution quality and distribution time, respectively. The adequacy index is calculated by Molden and Gates [48]:
P A = 1 T T ( 1 R R ( Q D Q R )
where PA is the adequacy index for the entire system, T is the study period, R is the total number of measured catchments, QD is the delivered flow, and QR is the required flow.
The dependability index is obtained from the Molden and Gates [49] method:
P D = 1 R R C V T ( Q D Q R )
This index means the reliability of agricultural water distribution performance over time in each subcomponent (upstream, middle, and downstream) under the control of the agricultural water distribution system, where PD is the dependability index for the whole system, and CVT is the coefficient of variation. Q D is the actual amount delivered by the system and Q R is the amount of water required for consumption use. The interpretation of these indices is shown in Table 1 [38].

2.2.2. Aquifer Balancing Strategies

Four strategies were selected to improve the agricultural water distribution management: hydro-mechanical operating system, manual-based operating system (with two different approaches: manual-based operating system A and manual-based operating system B), and centralized automatic operating system.

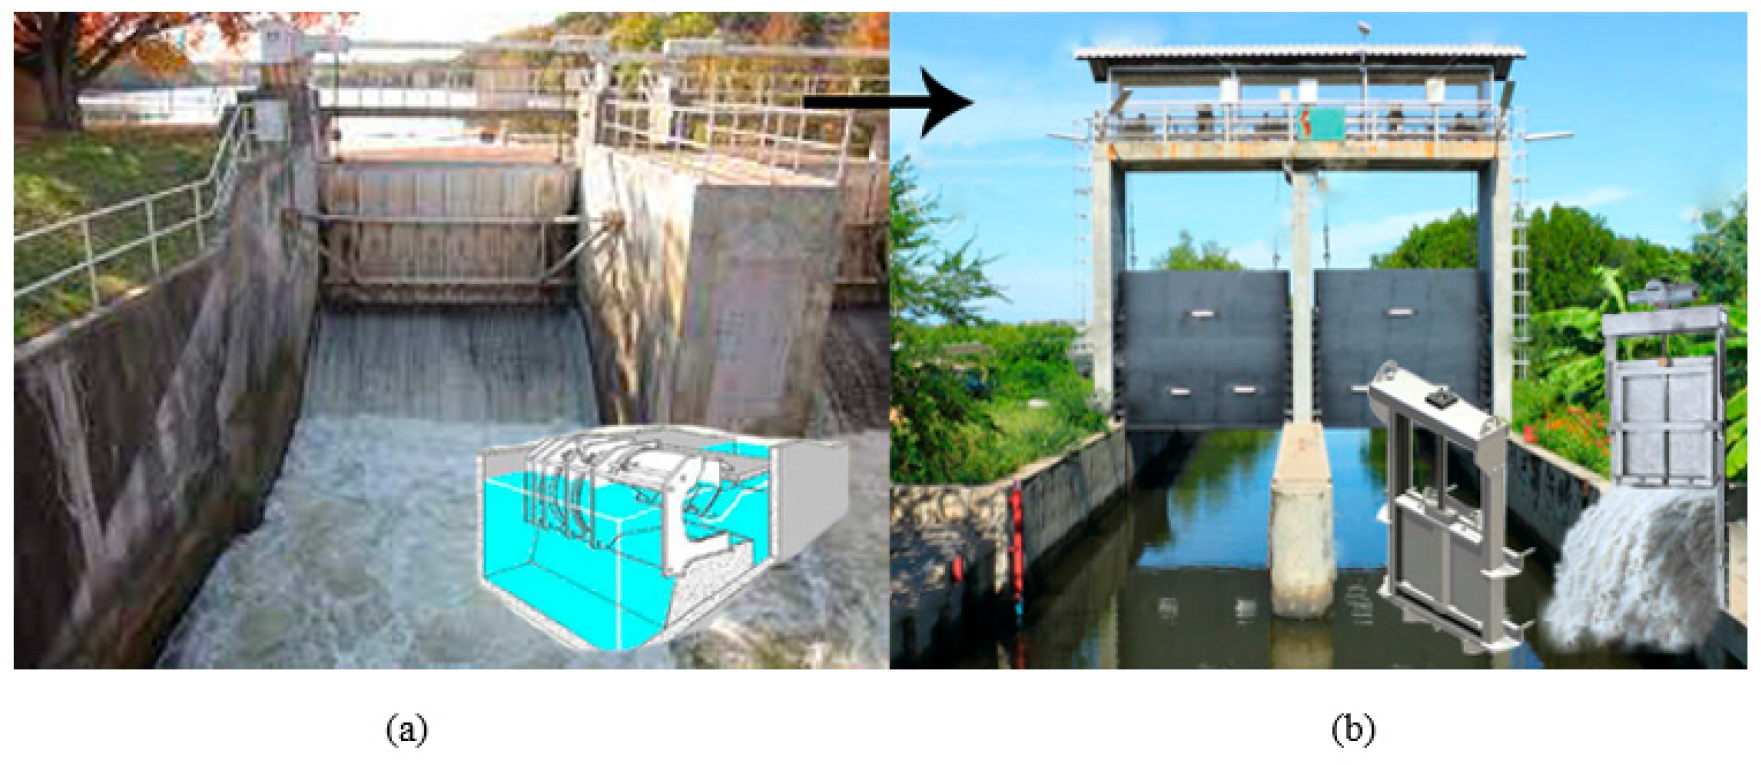
2.2.3. Hydro-Mechanical Operating System

The control of water level is one of the main goals of using water structures. Changing the type of reservoirs of surface water distribution systems from Neyrpic module reservoirs to sliding valves [50] is one of the strategies studied here (Figure 2). The flow rate through Neyrpic reservoirs usually changes once a day due to the lack of operator, and they are usually fully open or closed. However, sliding valves can adjust the flow rate to the desired level several times a day and are much easier to operate.

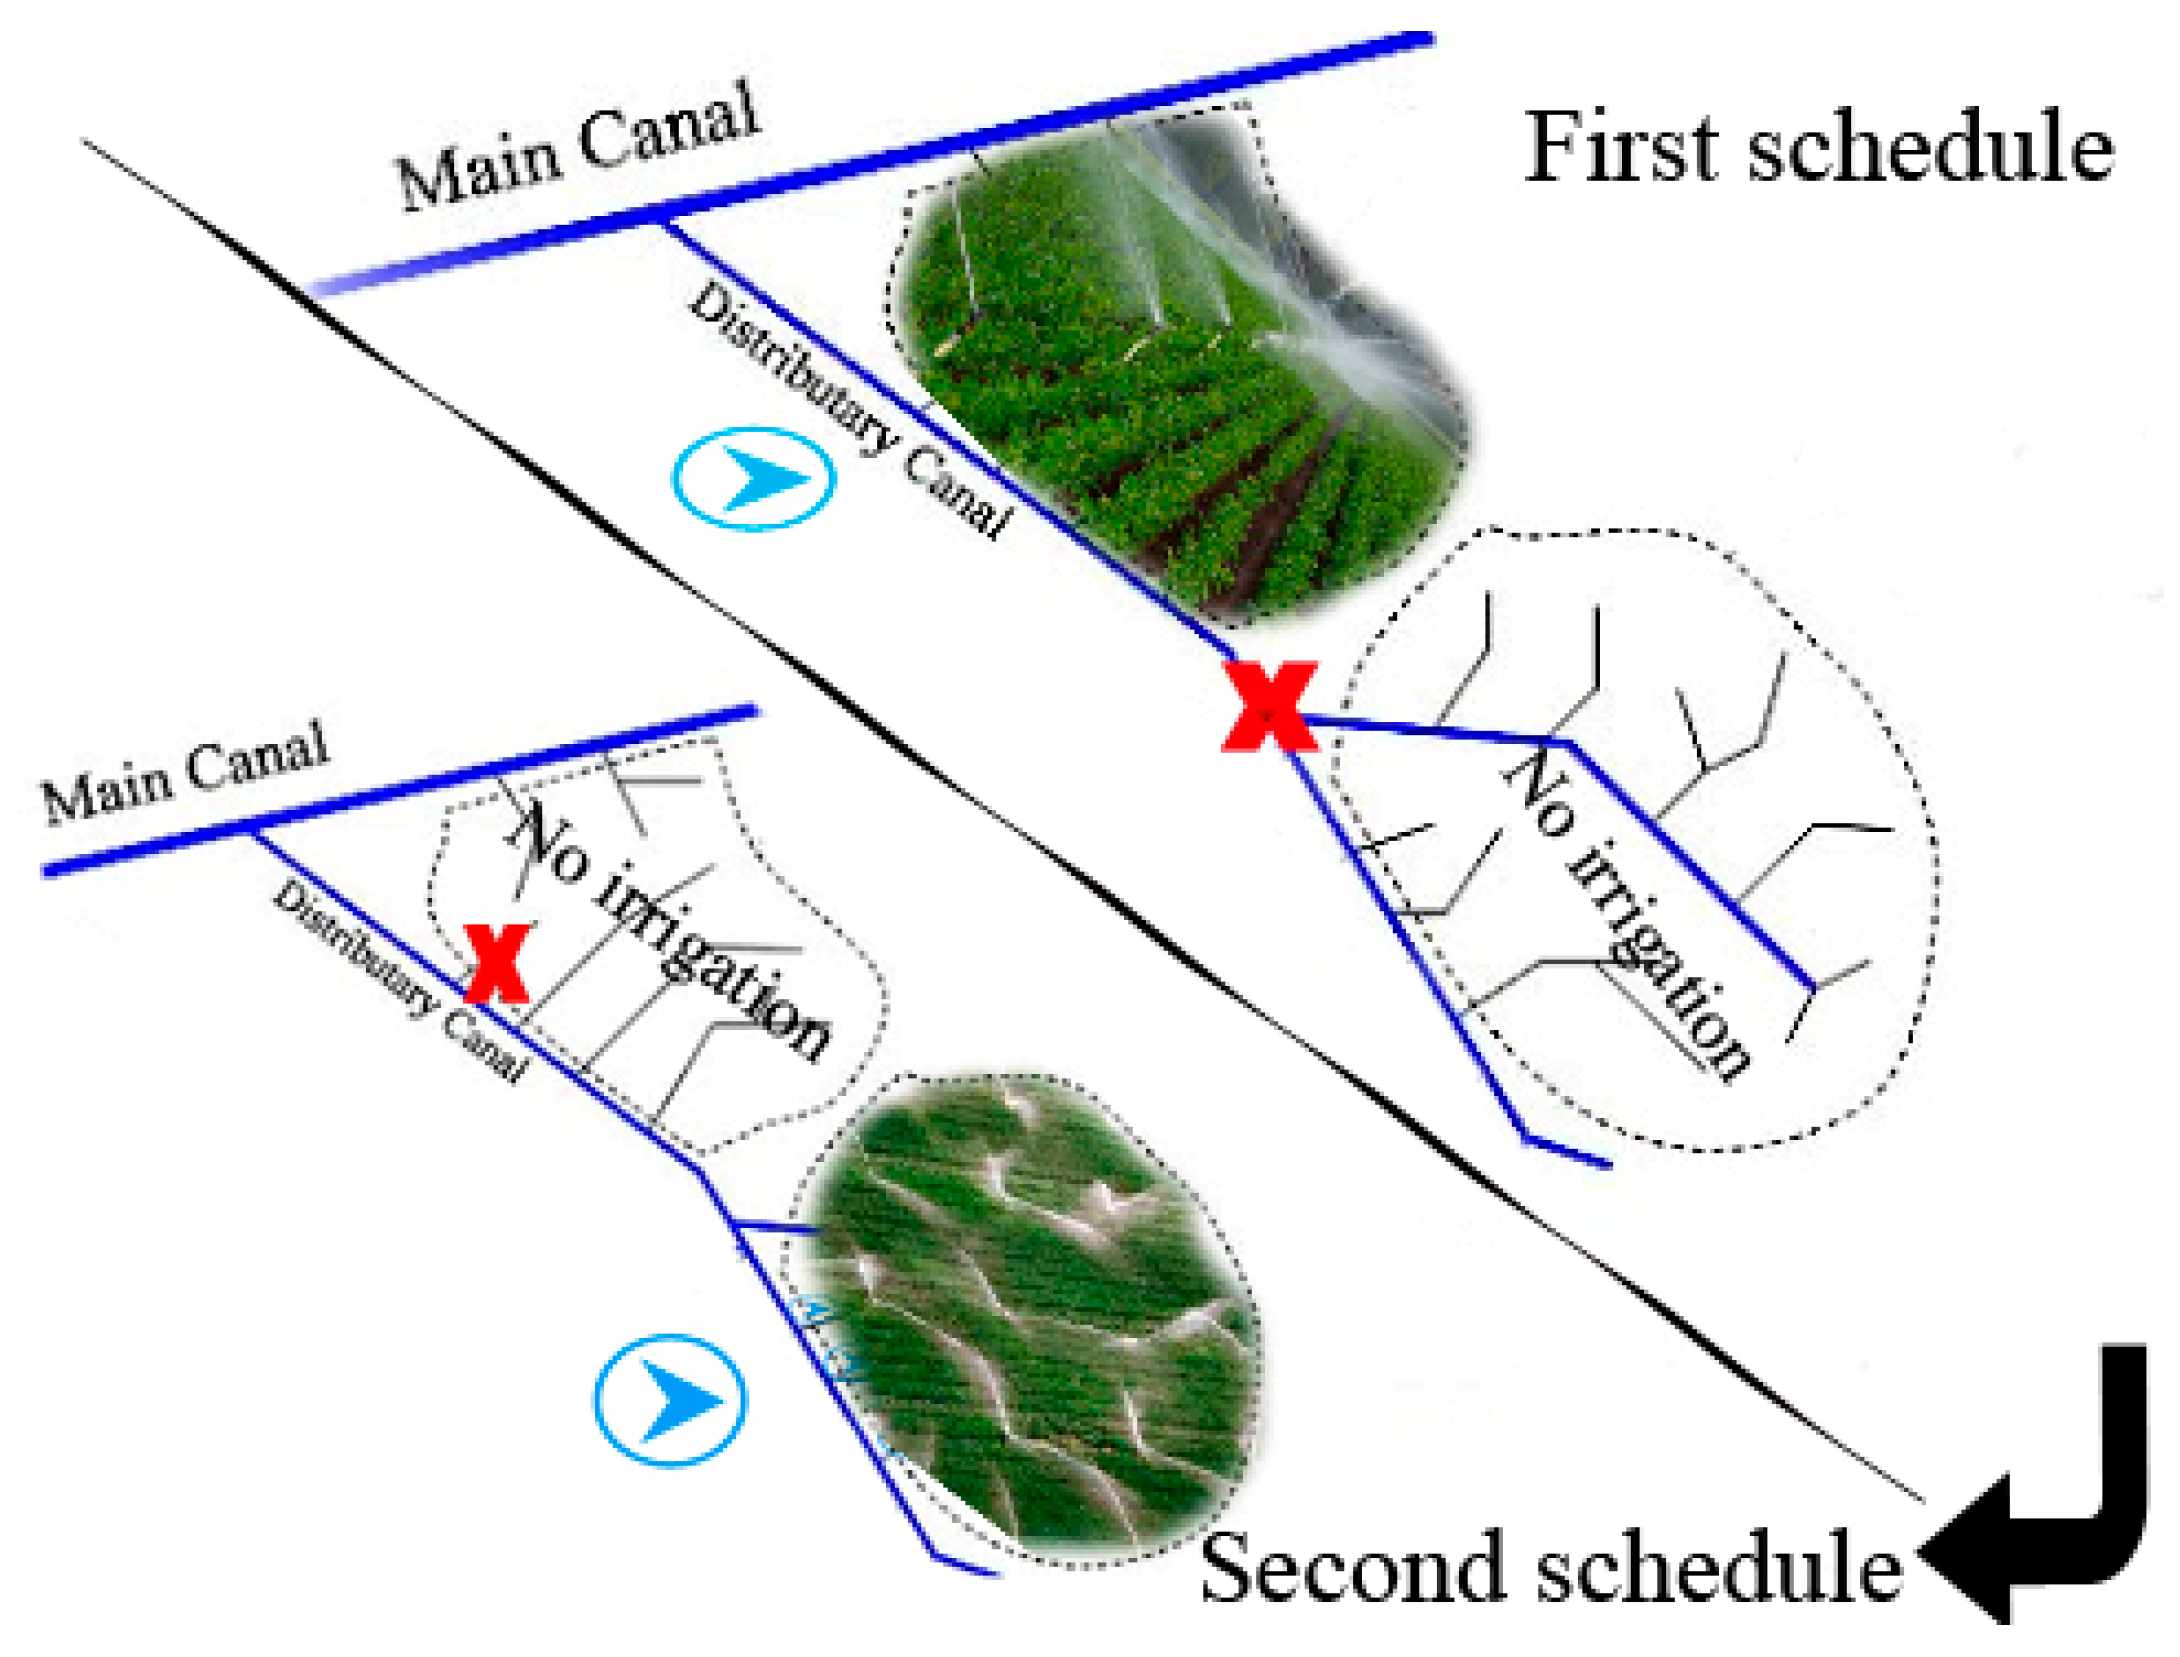
2.2.4. Manual-Based Operating System

Water delivery scheduling (manual-based operating system A) strategy was developed to determine effectiveness of conventional management in the agricultural water distribution system for the main canal (Figure 3). In this strategy, the catchments upstream of the main canal collected water in half (or a part) of the agricultural water management time, and the downstream catchments were closed. In contrast, water was available for the lower catchments in the other half, and the upstream did not receive water [50].
Increasing the inflow and reducing the flow time in the main canal manual-based operating system B. Manual-based operating system B was developed in brainstorming sessions based on the conventional experimental management method for agricultural water distribution. It considered reducing the time of inflow to the reservoirs to half of the normal surface water distribution system while doubling the inflow volume to the reservoirs.

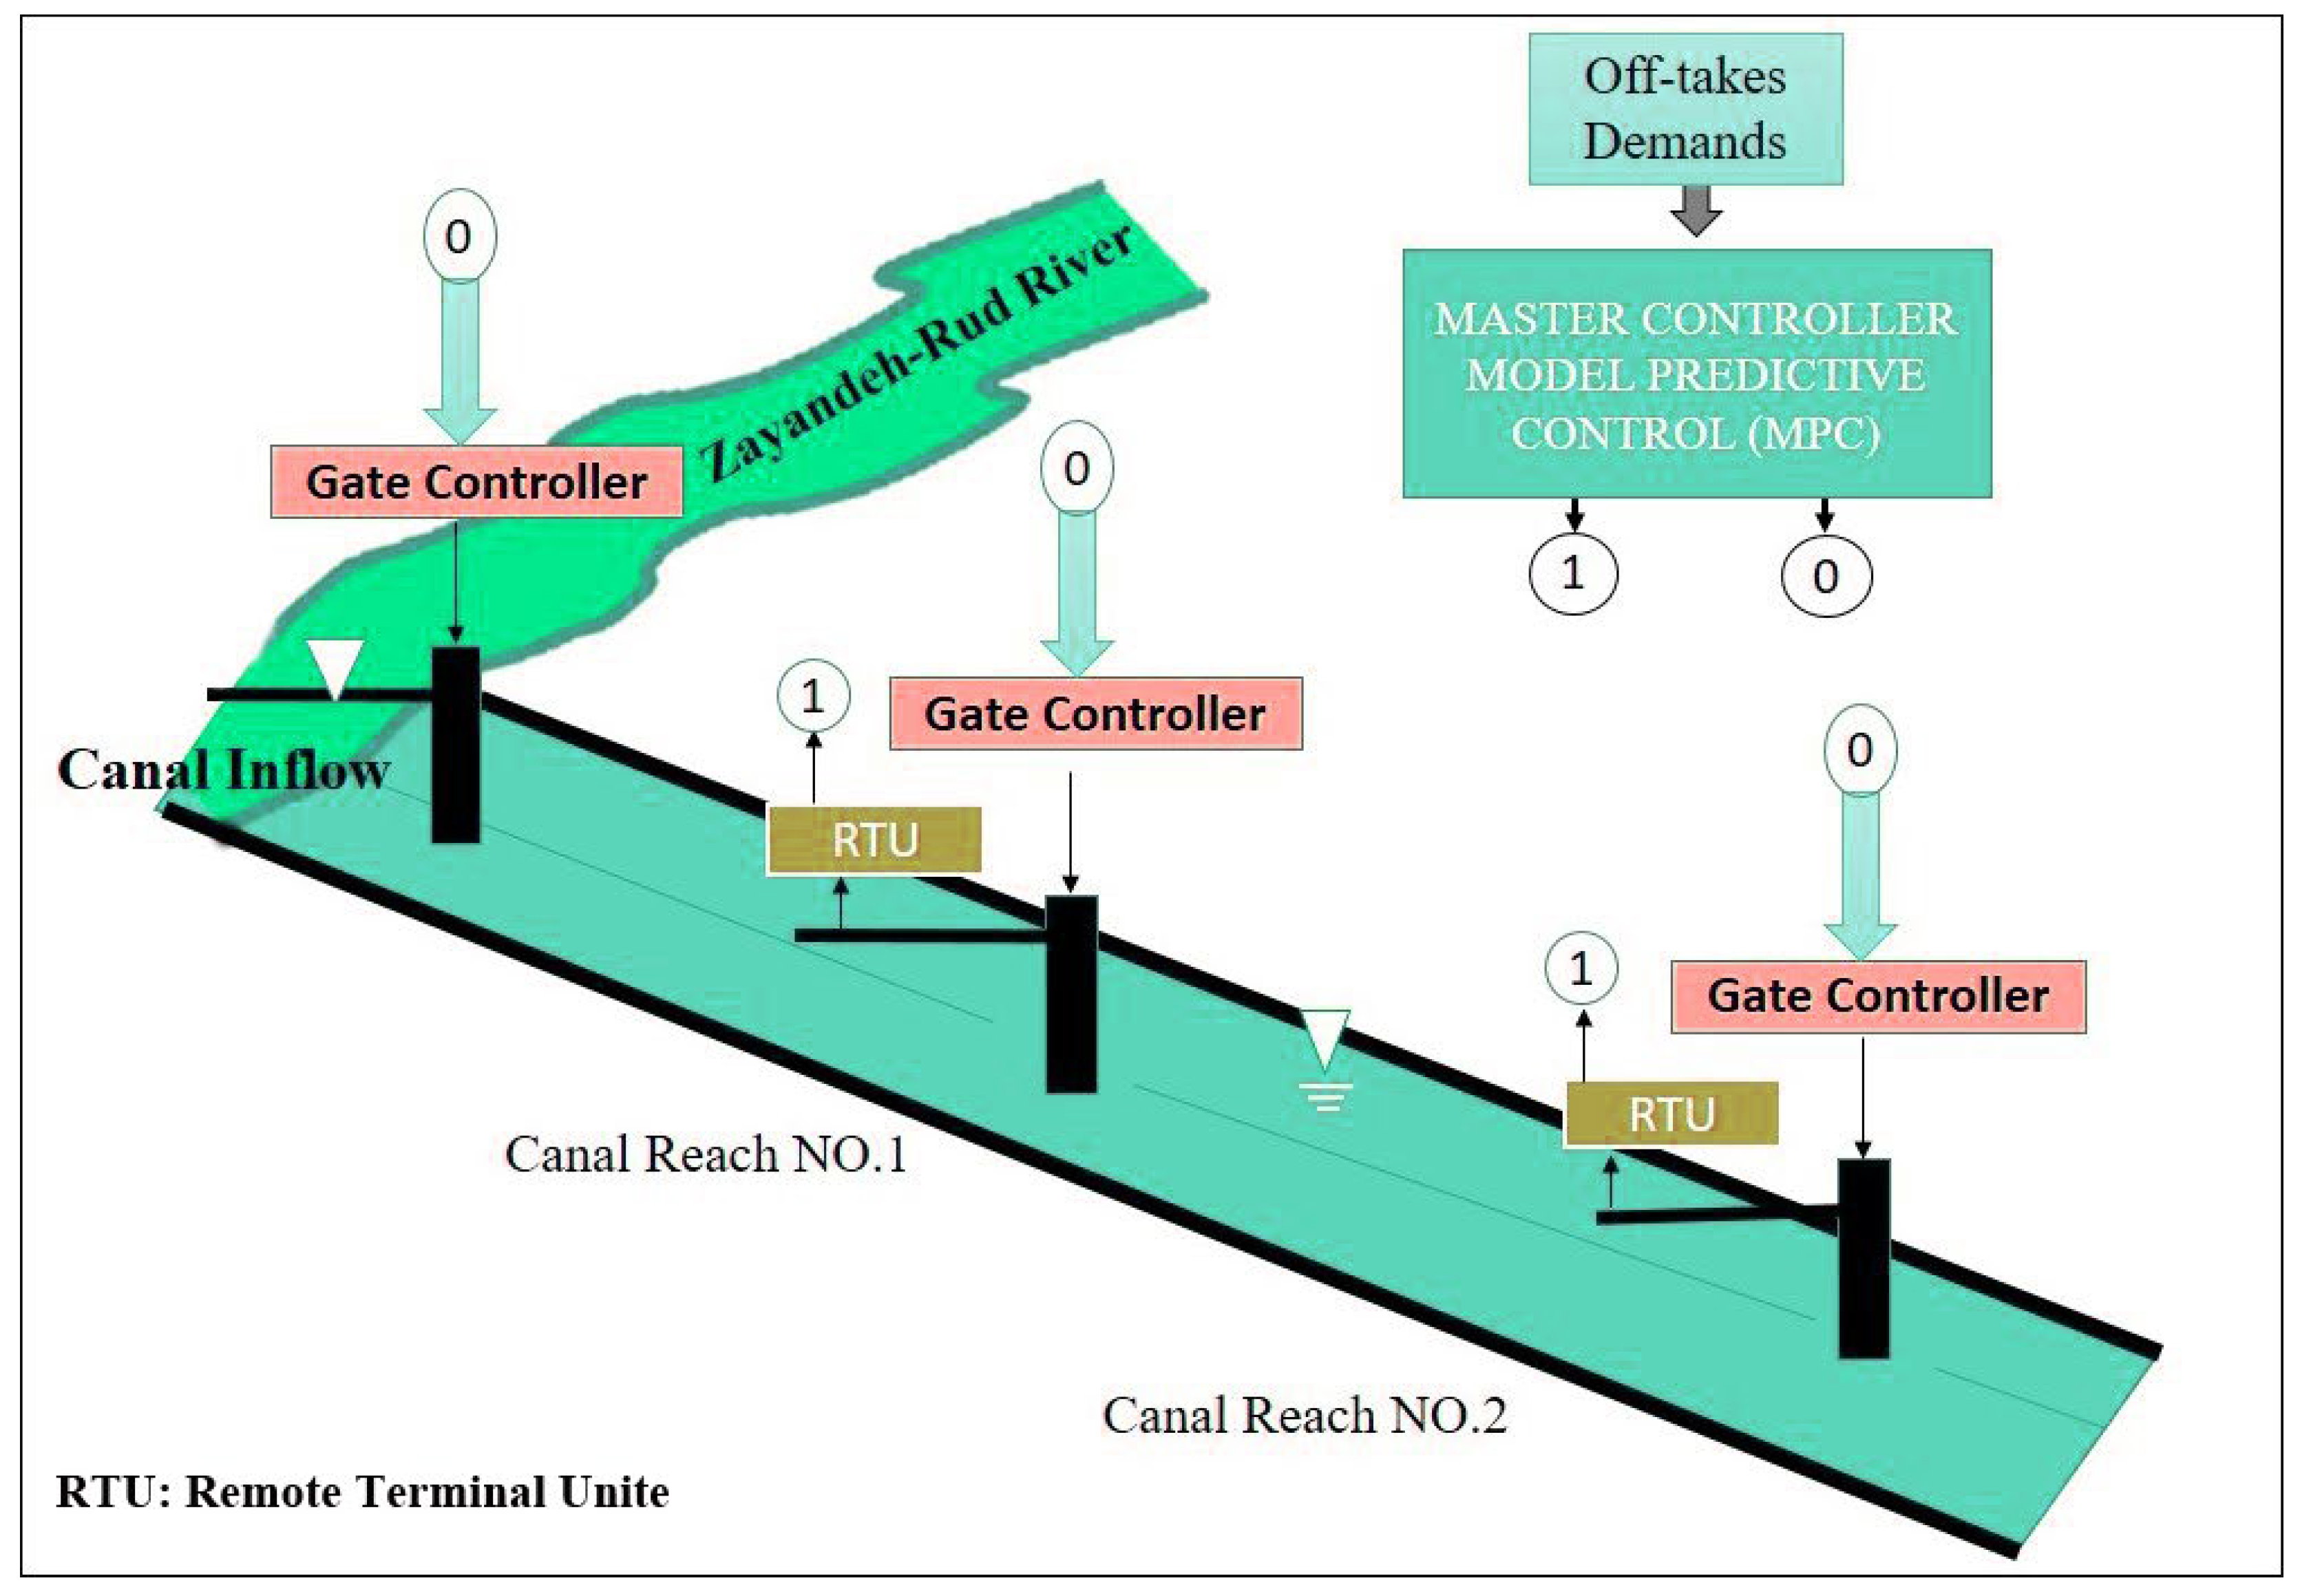
2.2.5. Centralized Automatic Operating System

As an automatic controlling technique, the centralized automatic operating system involved an optimization procedure for calculating the water level in water distribution systems (van Overloop, 2006). The centralized automatic operating system controls the water level of each downstream unit based on the target water level by adjusting the controlling structures located above each unit (Figure 4). The controller calculates the settings of the structures by predicting flow hydraulics in a specific time horizon using a simplified mathematical model of the canal flow hydraulics. In this study, the linear state-space model obtained from the discrete Saint-Venant equation was used as the internal model predictive controller [51].
To simulate the water system control, the state-space model was used to express the internal model, which allows a multivariate formulation of linear models to be compressed. The model used for the canal system can generally be expressed in the form [51]:
x ( k + 1 ) = A ( k ) · x ( k ) + B u · u ( k ) + B d · d ( k ) y ( k ) = C · x ( k )
where X is the flow status in the main canal (usually, the water level at the target point), u is the control action calculated by the controller (the change of the state of the adjusting structure), d is the predicted disturbance, and k is the time interval. A, Bu, and Bd are the system matrix, the control coefficient matrix, and the disturbance coefficient matrix, respectively. The formulation of this equation depends on the type of internal model selected for the system. Examples of internal models include the Saint-Venant equations, the integral-delay model, and a uniform flow section.
The objective function formulates the objectives that the controller is trying to achieve. The objective function consists of a set of sub-objectives that might be conflicting. Minimizing the movement of adjusting structures versus proper control of water levels at canal reaches is an example of such conflicting objectives. Equation (4) shows the objective function for the canal system of this problem [51]:
min   J = X T · Q · X + U T · R · U
where J is the objective function that should be minimized, X is the state variables, U is control operators, Q is the weight matrix for the state variables, and R is the weight matrix for the control operators. By defining href as the objective function parameters and defining the error function in the form of Equation (5) and its substitution in Equation (3), the error function in each unit can be calculated based on the inlet and outlet flows [51,52]:
e ( k ) = h ( k ) h r e f

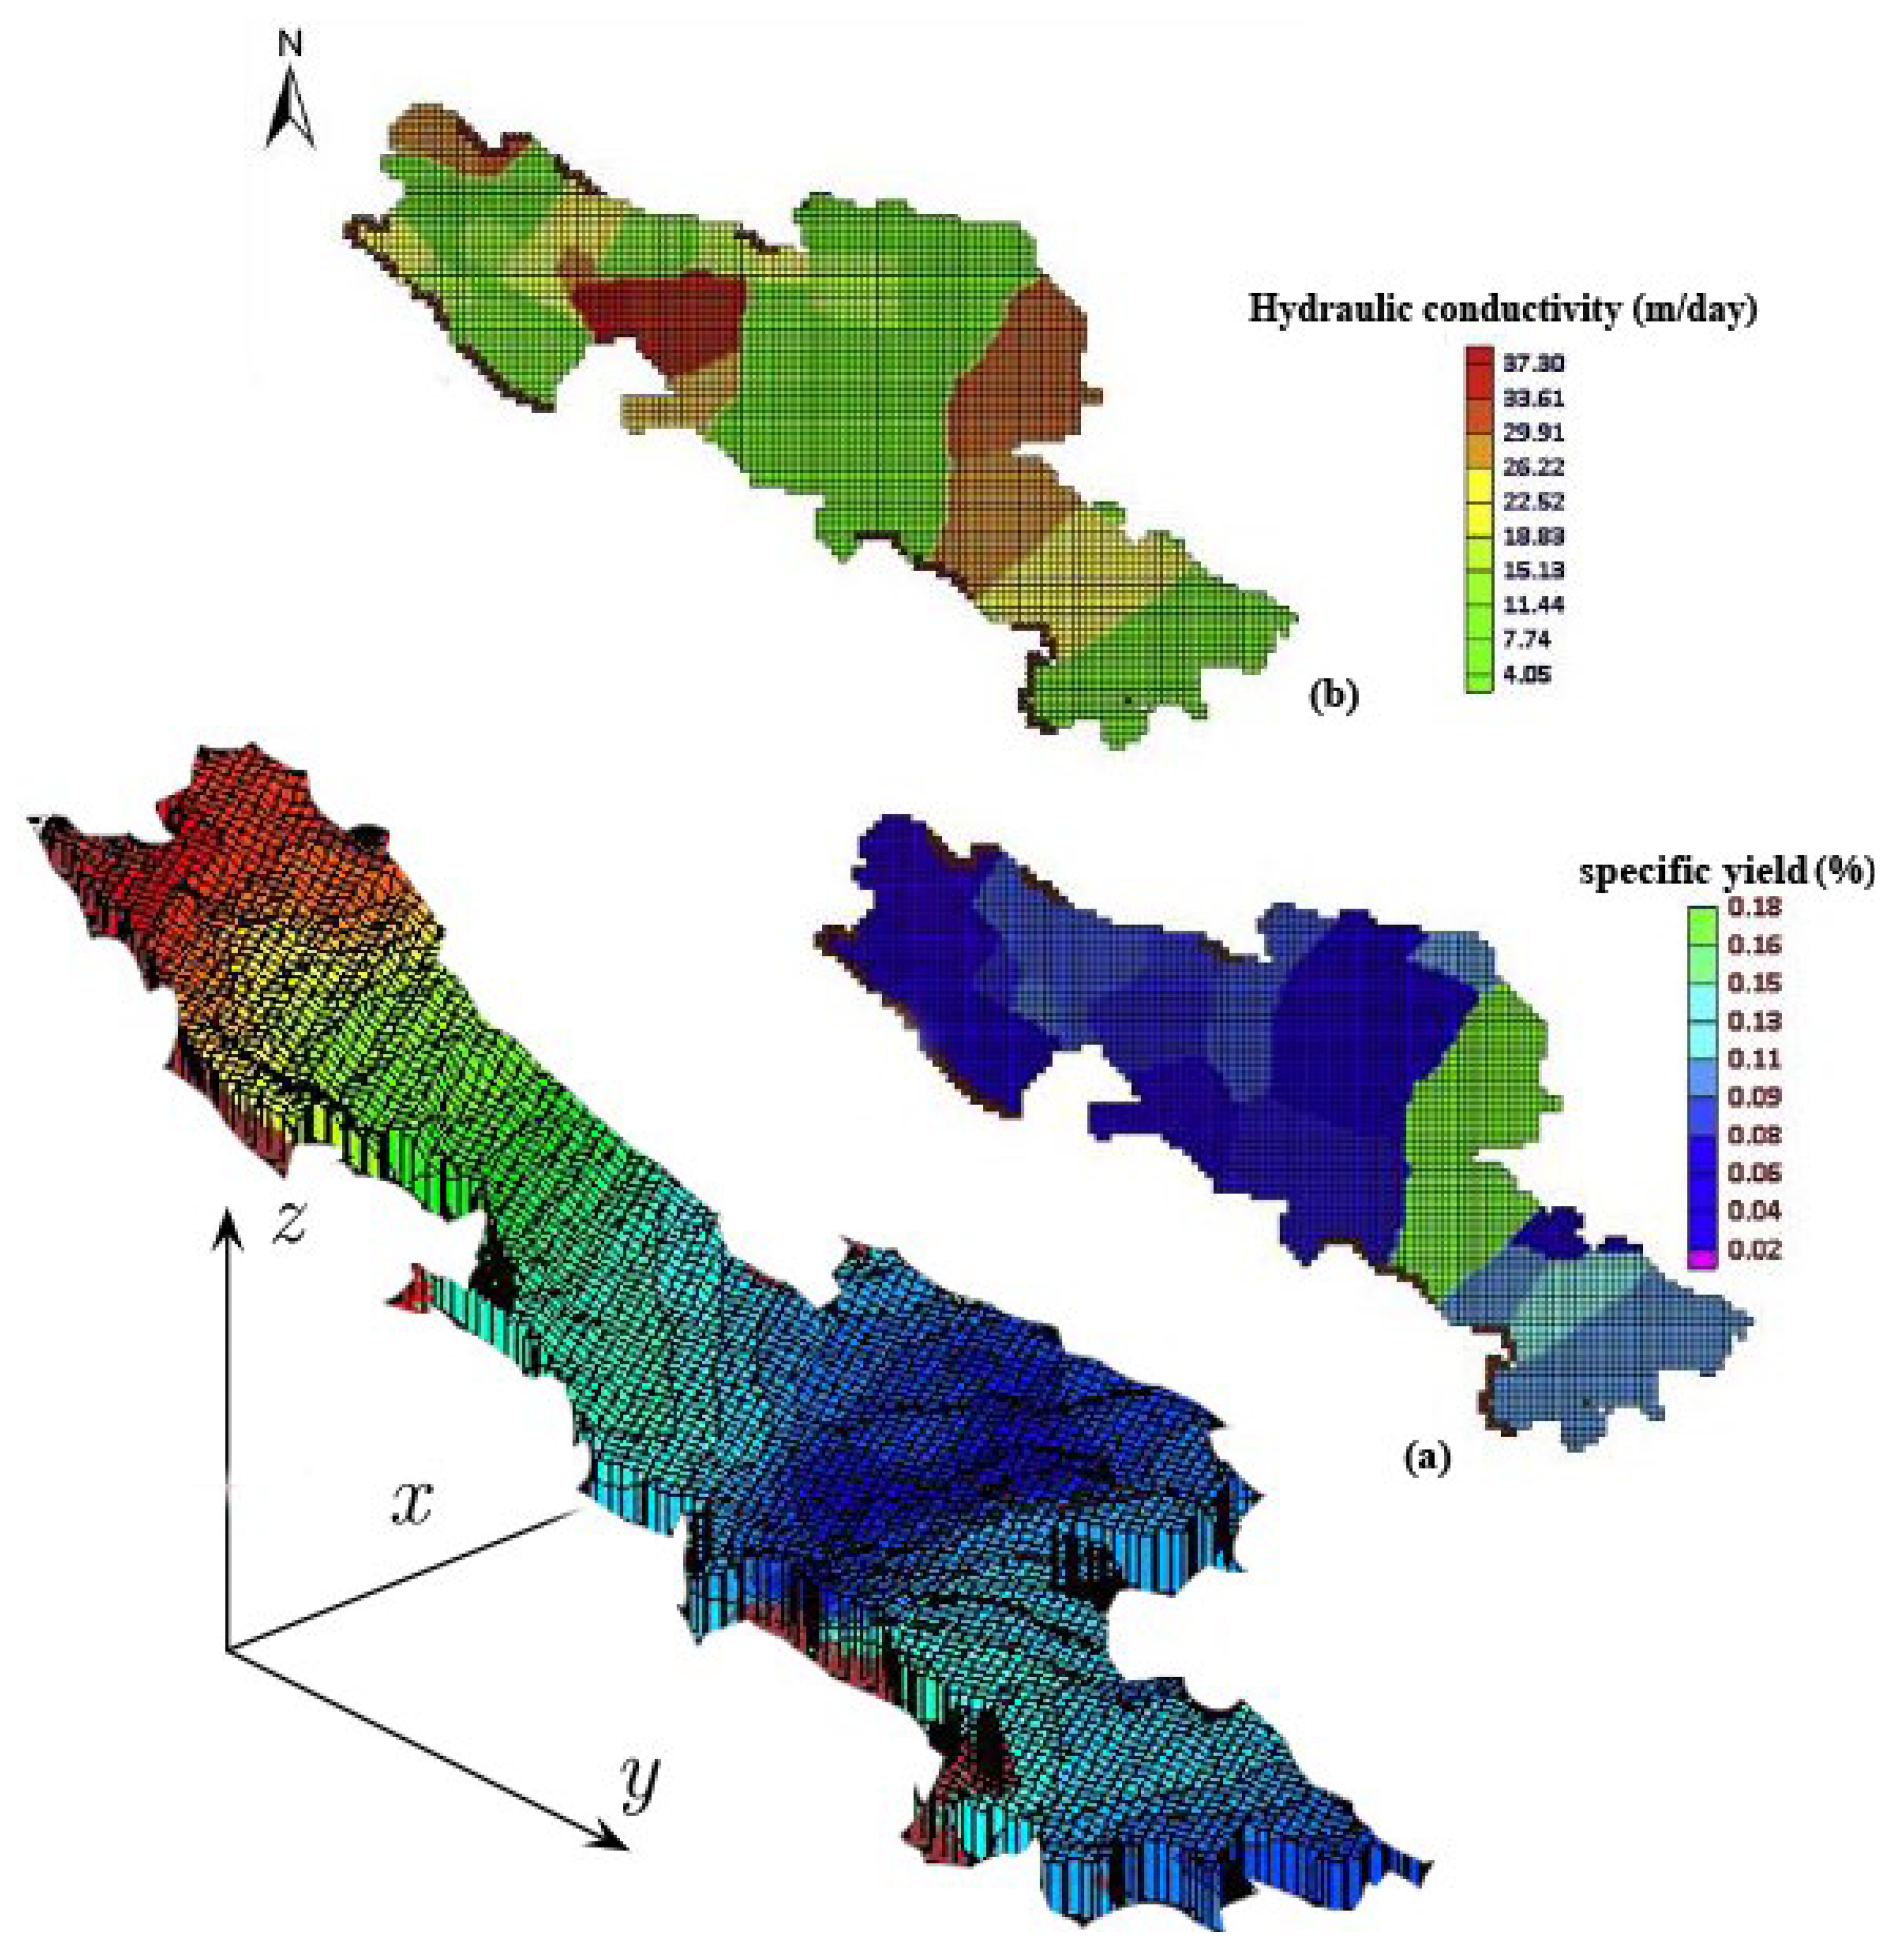
2.3. Numerical Modeling of the Groundwater

As stated in the objectives, we aimed to introduce novel agricultural water management strategies that can prevent over-exploitation of groundwater resources by improving the efficiency of the surface water distribution system. Therefore, the MODFLOW 2000 code and groundwater modeling system (GMS 10.4.1) software were used to simulate the effects of water balancing strategies [53,54]. In this study, 40 observation wells were used as observation points, and the aquifer was considered as a 500 × 500 m grid network. A total of 17 inlet sections with an inflow capacity of 49.6 MCM to the aquifer were selected. Moreover, there was no groundwater outflow from the aquifer because of the excessive groundwater withdrawal and the cone created in the area. October of the 2015–2016 water year was considered as a study period for steady-state analysis due to having the slightest fluctuations in water level. Furthermore, a period from November of 2015–2016 water year to the September of 2017–2018 water year was used for model calibration in monthly unsteady-state analysis. The storage coefficient was used for model calibration in steady conditions, while specific yield in the open water table was used to calibrate the model in unsteady conditions.

2.4. Drought Scenarios

Specific changes in the inflow to the main canal of the study area were considered as operating scenarios. The purpose of presenting various scenarios of agricultural water management was to investigate the conditions of water distribution in the main canal due to applying strategies for the improvement of the agricultural water management performance. Two general drought scenarios were considered based on the actual conditions that have occurred in the study area: the normal scenario and 15 and 30% drought scenarios.
In the normal scenario, the inflow to the main canal is the same as the flow that normally entered the main canal on the days of operation. According to climate change and meteorological data, it was decided to reduce the inflow to the main canal by 15 and 30% to simulate the drought conditions. The ability of the developed strategies in improving the water distribution process under these scenarios was examined in this study.

3. Results

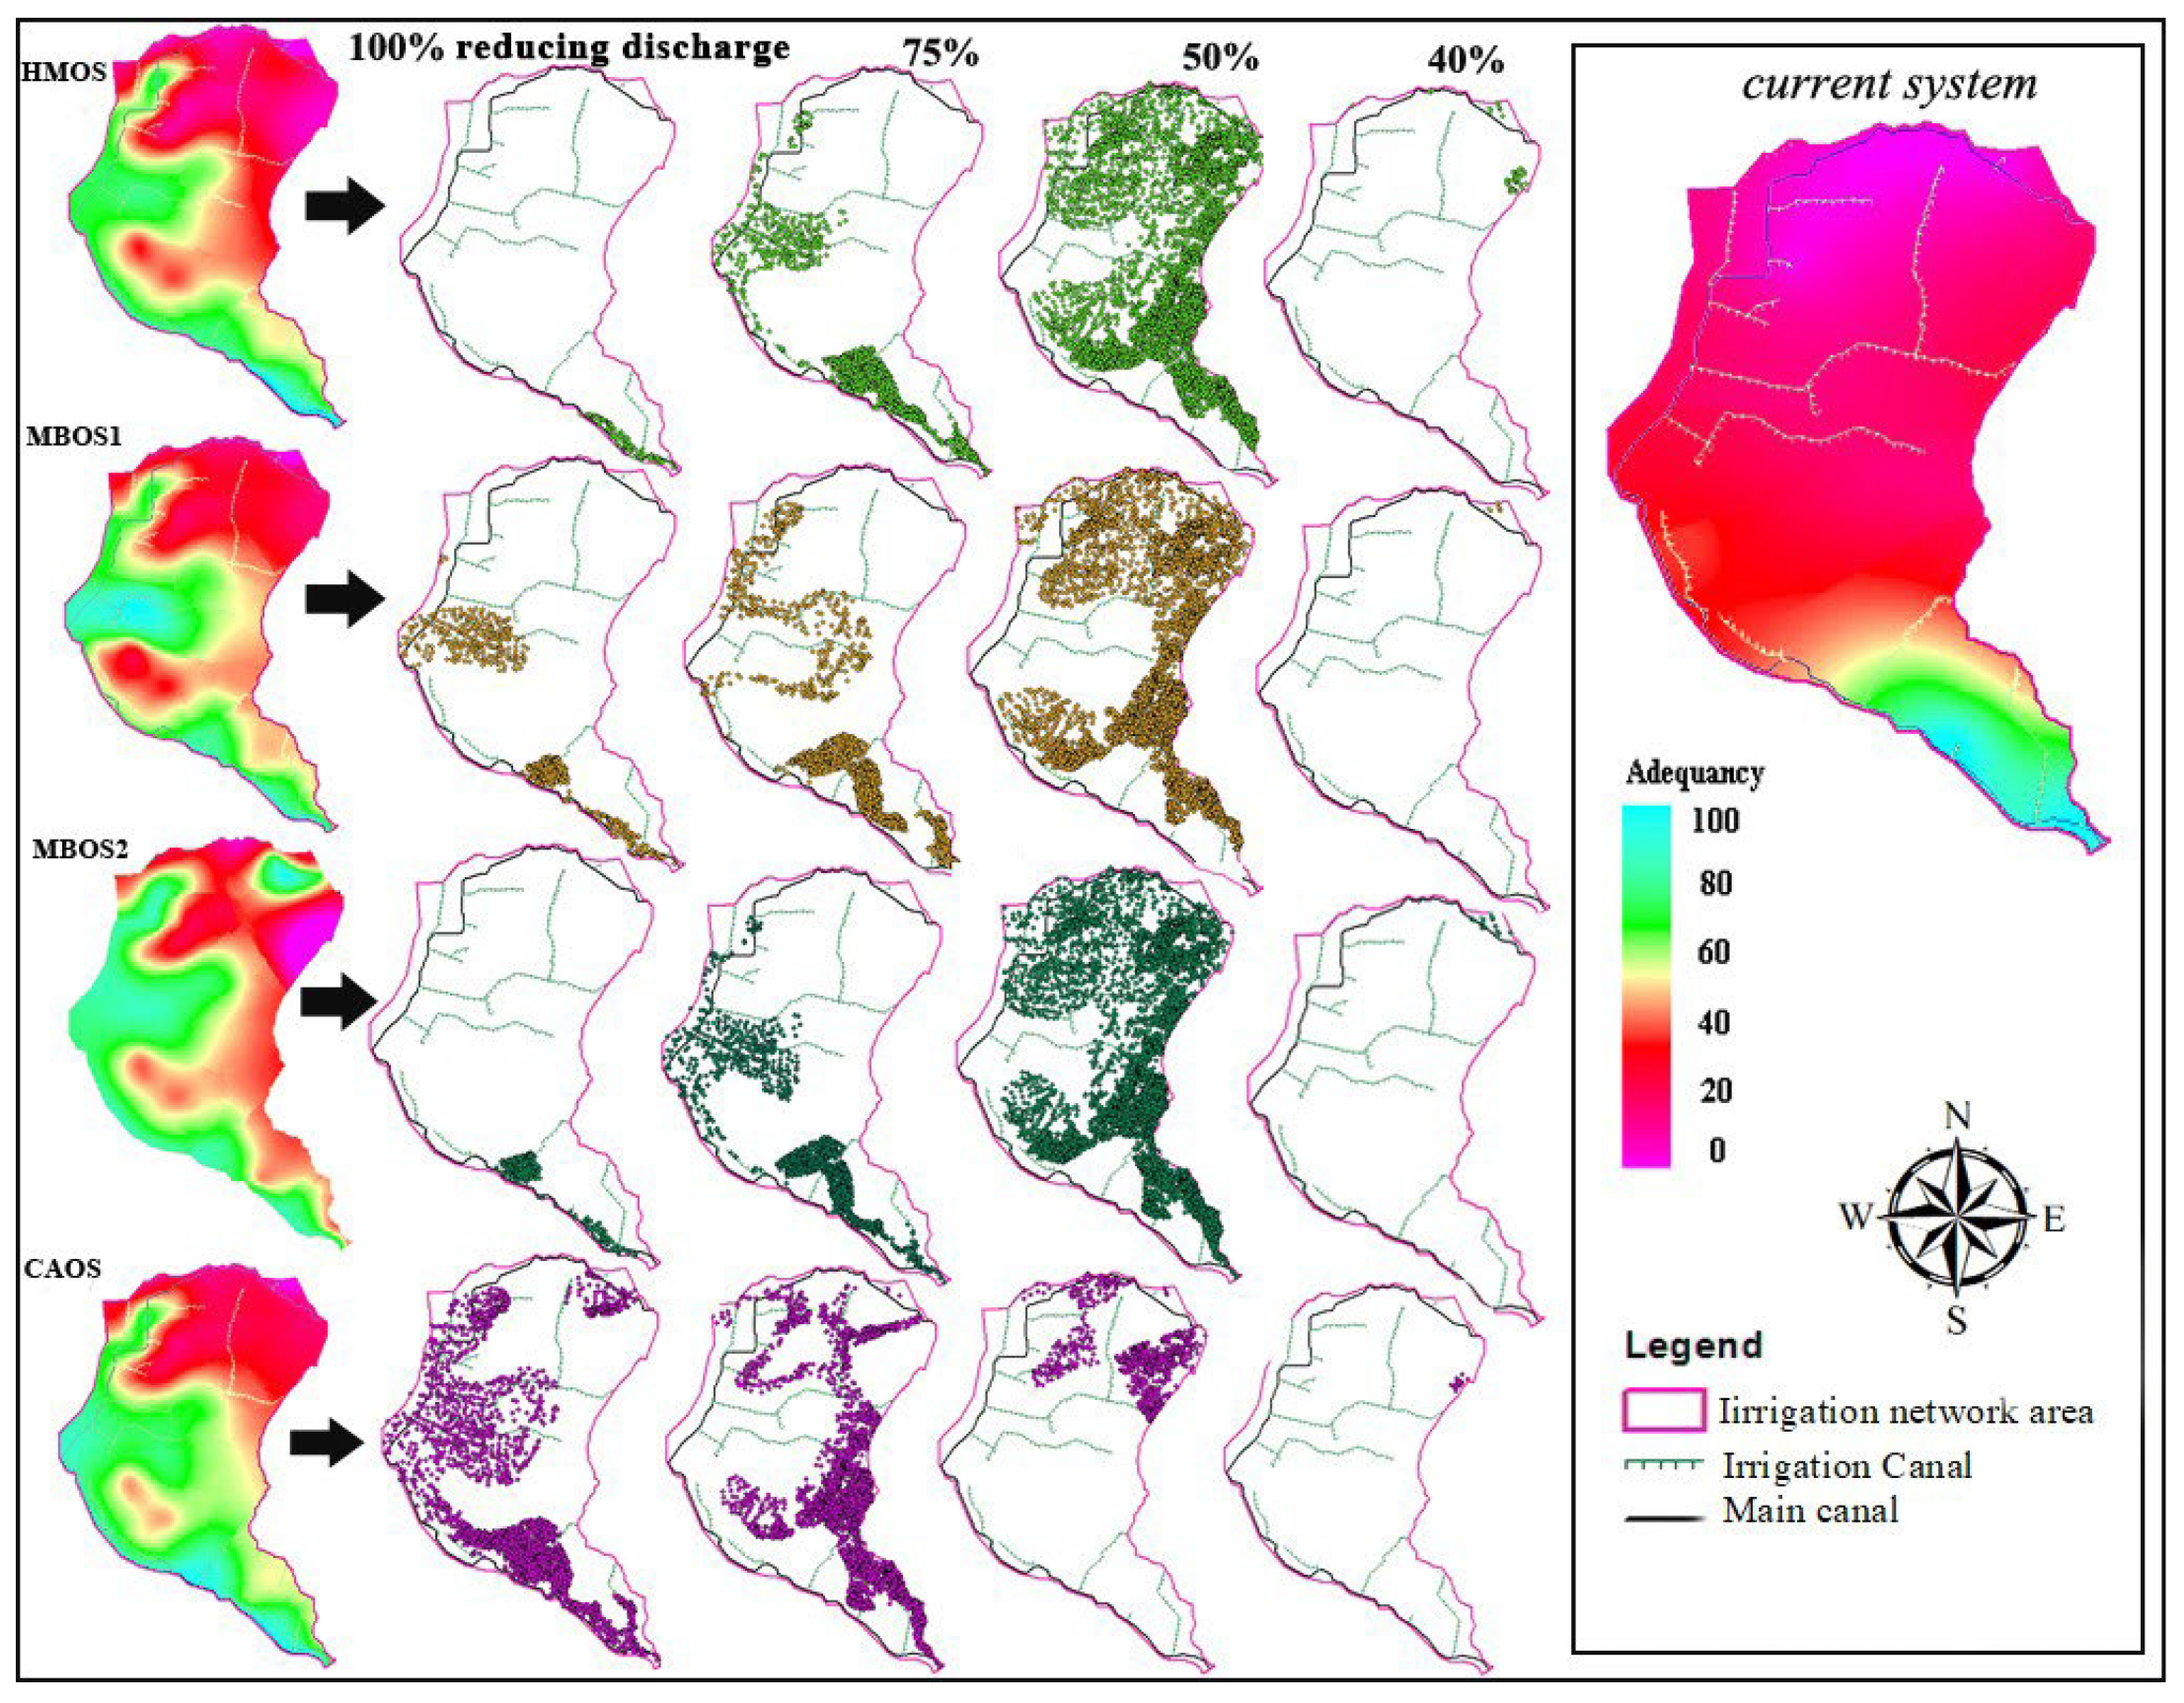
3.1. Adequacy and Dependability Indices of Agricultural Water Distribution in the Normal Scenario

The water distribution adequacy index was obtained for all 13 reservoirs in the main canal using the delivered flow rate obtained from the hydraulic simulation model. The average change of water distribution adequacy index in the current conditions from 90% in the first reservoir (L1) to 69% in the last reservoir (L13), as well as poor results of the water distribution dependability index (Table 2), show the improper and inefficient management of the water distribution network. Due to a decrease in inflow, there was a remarkable vulnerability in the downstream reservoirs, and the network could not meet the reservoirs’ needs. As a result, there is a need to use groundwater resources as a complementary source of water. According to Table 2, the balancing strategies improved the adequacy and dependability of water distribution along the main canal. The adequacy index improved by 6, 7, 10, and 30%, using the balancing strategies of hydro-mechanical operating system, manual-based operating system A, manual-based operating system B, and centralized automatic operating system, respectively, compared to the existing situation of the surface water distribution system.
As expected, centralized automatic operating system showed the best performance by reducing operator error and automating the distribution process. In contrast, hydro-mechanical operating system exerted the weakest performance among the balancing strategies despite a slight performance improvement compared to the current management condition of the distribution system. The results indicated an increase in the regions with performance improvement, which was 7, 8, 11, and 30% for hydro-mechanical operating system, manual-based operating system A, manual-based operating system B, and centralized automatic operating system, respectively. Depending on how much the water distribution adequacy index has improved in each region, the wells located in these areas have faced a desirable decrease in withdrawal between 40 and 75%. There were even no longer needs for some wells to be used and they were closed (Figure 5 and Table 3).
The most undesirable adequacy index was obtained using the hydro-mechanical operating system strategy. In this strategy, 88 wells were closed completely, and the withdrawal from the remaining wells was reduced. The results indicated that manual-based operating system B performed better than the conventional agricultural water distribution method and hydro-mechanical operating system. The number of wells being closed using this strategy was 2.2 times that of manual-based operating system A and 7.1 times that of hydro-mechanical operating system. In the best case, the centralized automatic operating system strategy resulted in closing 2494 wells, and 3701, 990, and 17 wells experienced a withdrawal reduction by 75, 50, and 40%, respectively.

3.1.1. Adequacy and Dependability Indices of Agricultural Water Distribution in the 15% Drought Scenario

The simulation results in the 15 % drought scenario showed a better performance of centralized automatic operating system compared to other balancing strategies. Using this strategy, all reservoirs were in good and fair conditions in terms of water distribution dependability and adequacy indices, respectively. However, only three reservoirs were in fair conditions in the current situation, and the rest of the reservoirs were in an unstable state (Table 4). A comparison of the water distribution adequacy map in the current sitution and the map of each balancing strategy indicated an increase in the regions with the performance improvement, which was 5, 7, 15, and 40 % for hydro-mechanical operating system, manual-based operating system A, manual-based operating system B, and centralized automatic operating system, respectively (Figure 6).
The specific yield varied between 2 and 18 %, while this value was in the range of 8 to 16% in the central portion of the aquifer (Figure 6a). The maximum value of hydraulic conductivity was about 38 m/day in the western region of the aquifer. Due to the sedimentation of fine particles, the lowest hydraulic conductivity values were observed in the south of the aquifer (Figure 6b). Finally, the constructed model showed highest sensitivity to the hydraulic conductivity, while the specific yield had the least effect on groundwater changes.

3.1.2. Adequacy and Dependability Indices of Agricultural Water Distribution in the 30% Drought Scenario

The results obtained from flow hydraulics simulation in terms of adequacy and dependability indices of water distribution showed the weakness of the current agricultural water distribution management system and the superiority of the centralized automatic operating system balancing strategy in the 30% drought scenario over other proposed strategies (Table 5). By applying balancing strategies, the number of reservoirs in stable or good conditions increased in comparison with the existing situation.

3.2. Numerical Modeling of Groundwater

Groundwater models can be used to study the behavior of a system in current and future conditions. Therefore, to simulate the effects of water withdrawal reduction strategies in improving the water delivery situation in the surface water distribution network as well as the optimal use of surface water resources, the numerical model of groundwater simulation of the Najafabad aquifer was obtained using MODFLOW. The performance of balancing strategies developed in this study were investigated on the condition of the aquifer in the next five years. The specific yield in the open water table was used to calibrate the model in unsteady conditions. In addition to this parameter, the recharge values and input and output fronts were also calibrated. The error evaluation criteria of mean error, mean absolute error, and root mean squared error of the calibration were 0.035 m, 0.79 m, and 0.93 m, respectively, indicating the high performance of the model in the unsteady flow regime. Based on the simulation results, the specific yield in the open water table varied between 1 and 20%. Then, the model results were used in the unsteady period considering the normal and drought scenarios. The conceptual model used was distributive and could indicate the effectiveness and performance of each agricultural water management method in each aquifer part.

3.2.1. Aquifer Situation in the Next Five Years Due to the Normal Scenario

After calibrating and validating the numerical model, the balancing strategies were used to simulate and predict the future situation of the aquifer in a short period, i.e., the next five years. The effects of these strategies on the aquifer can be seen on a map using the groundwater modeling system model (Figure 7). The groundwater maps of the model show the remarkable effectiveness of balancing strategies on the aquifer, so that in the best case, applying the fourth balancing strategy in a 5-year period increased the aquifer level by 11.6 m and reduced the aquifer withdrawal by 16%.
The average groundwater level rise under the influence of the manual-based operating system A, manual-based operating system B, and hydro-mechanical operating system strategies were 3.74, 3.06, and 1.31 m, respectively. Among the proposed strategies, the hydro-mechanical operating system, despite more structural changes than the manual-based operating system A and manual-based operating system B strategies in the surface water distribution system, showed a more unsatisfactory performance. However, this strategy was able to improve agricultural water management compared to the current situation. Figure 8 shows that the exploitation resources, as well as agricultural and arable lands, are mainly located in the central and southern regions of the aquifer. Therefore, the effects of the strategies on these regions are quite obvious.

3.2.2. Aquifer Situation in the Next Five Years Due to the 15% Drought Scenario

After applying the 15% drought scenario, the hydro-mechanical operating system, manual-based operating system A, manual-based operating system B, and centralized automatic operating system strategies caused a change in groundwater level by 1.13, 2.60, 3.22, and 10.18 m, respectively (Figure 8). About 15% drought scenario had the highest (15%) and lowest (12.2%) effects on the manual-based operating system B and centralized automatic operating system strategies, respectively. Similar to the results of the normal scenario, the centralized automatic operating system strategy had the most significant impact on the aquifer and reduced the groundwater withdrawal by 12% compared to the current situation. Hydro-mechanical operating system, manual-based operating system A, and manual-based operating system B reduced groundwater withdrawal by 5, 4, and 5%, respectively.

3.2.3. Aquifer Situation in the Next Five Years Due to the 30% Drought Scenario

In the 30% drought scenario, hydro-mechanical operating system, manual-based operating system A, manual-based operating system B, and centralized automatic operating system increased the groundwater level by 0.89, 2.41, 2.85, and 9.4 m, respectively, compared to the current situation (Figure 7). The 30% drought scenario had the highest (32%) and lowest (19%) effects on the hydro-mechanical operating system and centralized automatic operating system strategies, respectively, indicating the effectiveness of the centralized automatic operating system strategy in low water seasons or droughts such as recent years in the study area. Similar to the normal and 15% drought scenarios, the centralized automatic operating system strategy had the greatest impact on the aquifer and reduced the groundwater withdrawal by 10% of the total yearly exploitation (825.4 MCM) in the current situation. Moreover, hydro-mechanical operating system, manual-based operating system A, and manual-based operating system B reduced groundwater withdrawal by 2, 4, and 3%, respectively.

4. Discussion

A flow hydraulic simulation model was used to evaluate balancing strategies in managing the surface water distribution system. The adequacy and dependability indices were calculated using the outflows obtained from the model. These indices indicate the suitability of distribution quality and distribution time in the surface distribution system, respectively. The normal scenario improved both indices for all strategies compared to the current situation. However, the centralized automatic operating system strategy showed the best performance with a 30% improvement in the water distribution adequacy index, while the hydro-mechanical operating system strategy showed the weakest performance with a 7% improvement.
The inefficiency of the hydro-mechanical operating system strategy might be because this method continued the procedure of adjusting the water level as before, and the only difference with the current situation was replacing the Neyrpic module reservoirs with sliding valves. Although sliding valves are more adjustable than Neyrpic module reservoirs, their operation requires more personnel than the Neyrpic reservoirs, and due to the reduced human resources because of the lack of maintenance budgets in the current situation, the structures could be adjusted only once a day. Therefore, it is not possible to significantly improve the efficiency of the water distribution system using the hydro-mechanical operating system strategy. Thus, the structural changes in the surface water distribution system should be performed on a small scale and not along the main canal.
Increasing the volume of inflow to the surface water distribution system in the manual-based operating system B strategy in a lower time increases the speed of water distribution and reduces the losses due to transmission. This is one of the advantages of the manual-based operating system B strategy over 1. Hydro-mechanical operating system and manual-based operating system A. Manual-based operating system A and manual-based operating system B, with a slight difference in performance, showed a good improvement in the water distribution indices. Figure 8 shows that in the 15 and 30% drought scenarios, the hydro-mechanical operating system and manual-based operating system A strategies were greatly influenced by the drought scenarios, and therefore, if selected, should be among the last priorities. In contrast, centralized automatic operating system was affected to a lesser extent among all the study strategies (Figure 8). The results of groundwater level simulation showed the superiority of centralized automatic operating system and manual-based operating system B methods in groundwater level rise by 11.6 and 3.74 m, respectively, in the normal scenario and almost the same ratio in drought scenarios compared to other strategies (Figure 8). This indicates that if financial resources are available in drought conditions, the centralized automatic operating system strategy and, otherwise, manual-based operating system B will be suitable for aquifer rehabilitation.
According to previous studies on aquifers throughout the world, drilling deep wells, uncontrolled withdrawal, and climate change are among the most critical problems that have led to a decrease in groundwater levels in aquifers. In this regard, practical storage and recovery strategies were introduced to reduce the withdrawal of groundwater resources by increasing or decreasing the number of effective parameters in the balance [54]. There are also a variety of aquifer recharge methods, including constructing recharge wells and pits, flood scattering, and recharge intensification using various water resources such as surface water, urban and agricultural effluents [54,55,56,57,58], and floods [59]. These strategies can be limited due to the need for excess water resources for recharge, sedimentation problems, and clogging of the recharge area [56], and restrictions on the choice of recharge area [19,57].
The main limitations of the above methods common in aquifer recovery are: (i) it is not possible to implement these strategies accurately in the whole aquifer, and (ii) climate change, such as drought that intensifies the pressure on water resources, is not usually considered in these strategies. Because of these two limitations, even if a strategy improves the condition of the aquifer in the short-term, it is not possible to generalize its outcomes for long-term periods.
The main difference between the approach considered in this study and the previous studies is that by improving the surface water distribution adequacy index, the areas with the withdrawal reduction were identified. The spatial scattering of the aquifer improved focused monitoring in vulnerable areas. In this situation, monitoring the entire aquifer is replaced by monitoring limited areas that have water shortage problems. Additionally, the reduction of groundwater withdrawal due to the improvement of surface water distribution reduced the use of pumps for groundwater withdrawal by farmers and thus reduced energy. This can encourage farmers to maximize the productivity of available surface water and minimize groundwater withdrawal. Combining the surface water exploitation model and groundwater simulation in a 5-year period by considering various balancing strategies, the present study is a first investigation on (i) spatial scattering of groundwater reduction areas, (ii) improving surface water distribution system by limiting the vulnerable areas, and (iii) evaluating various aquifer groundwater balancing techniques.

5. Conclusions

This study investigated the performance of groundwater balancing strategies for the Nekouabad surface water distribution system in Najafabad, Iran, by considering normal and drought (15 and 30%) scenarios. In this regard, water distribution adequacy and dependability indices were calculated for each strategy in all operation scenarios using a flow hydraulic simulation model prepared in the MATLAB programming environment. Then, the amount of withdrawal from the exploitation wells was obtained to compare the strategies. The results entered the groundwater simulator model using the MODFLOW code, and the changes in groundwater level were predicted for the next five years.
According to the results, in the normal scenario, using modern equipment and automatic control, the centralized automatic operating system strategy significantly affected the agricultural water distribution system with a 30% improvement in surface water distribution adequacy than the existing situation. It increased the groundwater level by 11.6 m over five years. Additionally, in this scenario, the hydro-mechanical operating system strategy exerted the weakest performance with an increase of 1.31 m in groundwater level. This trend continued in the 15 and 30% drought scenarios, and centralized automatic operating system, with 10.18 and 9.8 m, and the hydro-mechanical operating system with 1.13 and 0.89 m groundwater level rise had the highest and least impact on the aquifer, respectively. In the normal scenario, manual-based operating system A and manual-based operating system B, with a 3.06 and 3.74 m increase in groundwater level, had almost similar effects on the aquifer, followed by similar trends in the 15 and 30% drought scenarios. In the absence of sufficient funds to equip the surface water distribution system with centralized model predictive controller, manual-based operating system A and manual-based operating system B are good alternatives for water distribution management, so that the manual-based operating system B strategy, only by changing the discharge strategy and minor structural changes, it was possible to improve the agricultural water distribution adequacy index by 10% and the groundwater level by 3.74 m. Combining the surface water exploitation and the groundwater simulation models and defining the drought scenario by examining the climatic conditions of the region are among the novelties of this work.
It should be noted that the proposed strategies are applicable only in areas where there is combined exploitation of surface water and groundwater. For future research, it is suggested to investigate the effectiveness of the introduced strategies in short, medium, and long-term periods using factor-based models. Moreover, the interaction among farmers, exploitation team, surface water distribution system management, and regional water management can be studied in the future to determine what educational and extension methods should be conducted to improve the interactions between the farmers and the regional water organization to reduce the withdrawal from the exploitation wells.

Author Contributions

Conceptualization: H.T., S.J. and S.M.H.S.; data collection: H.T., S.J. and S.M.H.S.; formal analysis: H.T., S.J. and S.M.H.S.; validation: H.T., S.J. and S.M.H.S.; supervision: S.J. and R.B.; writing—original draft: all authors; APC: R.B. and S.G.M. All authors have read and agreed to the published version of the manuscript.

Funding

This research received no external funding.

Institutional Review Board Statement

Not applicable.

Informed Consent Statement

Not applicable.

Data Availability Statement

The data presented in this study will be available on interested request from the first corresponding author.

Acknowledgments

This study was supported by the Middle East in the Contemporary World project at the Centre for Advanced Middle Eastern Studies, Lund University.

Conflicts of Interest

The authors declare no conflict of interest.

References

  1. Vörösmarty, C.J.; McIntyre, P.B.; Gessner, M.O.; Dudgeon, D.; Prusevich, A.; Green, P.; Liermann, C.R. Global threats to human water security and river biodiversity. Nature 2010, 467, 555–561. [Google Scholar] [CrossRef]
  2. Alcamo, J.; Henrichs, T.; Rösch, T. World Water in 2025—Global Modeling and Scenario Analysis for the World Commission on Water for the 21st Century; Kassel World Water Series 2; Center for Environmental Systems Research, University of Kassel: Kassel, Germany, 2000. [Google Scholar]
  3. Kahil, M.T.; Dinar, A.; Albiac, J. Modeling water scarcity and droughts for policy adaptation to climate change in arid and semi-arid regions. J. Hydrol. 2015, 522, 95–109. [Google Scholar] [CrossRef] [Green Version]
  4. MacDonald, A.M.; Bonsor, H.C.; Dochartaigh, B.E.O.; Taylor, R.G. Quantitative maps of groundwater resources in Africa. Environ. Res. Lett. 2012, 7, 024009. [Google Scholar] [CrossRef]
  5. Kourakos, G.; Dahlke, H.E.; Harter, T. Increasing groundwater availability and seasonal base flow through agricultural managed aquifer recharge in an irrigated basin. Water Resour. Res. 2019, 55, 7464–7492. [Google Scholar] [CrossRef] [Green Version]
  6. Villholth, K.; Giordano, M. Groundwater use in a global perspective–can it be managed. Agric. Groundw. Revolut. Oppor. Threat. Dev. 2007, 3, 393–402. [Google Scholar]
  7. Perkin, J.S.; Gido, K.B.; Falke, J.A.; Fausch, K.D.; Crockett, H.; Johnson, E.R.; Sanderson, J. Groundwater declines are linked to changes in Great Plains stream fish assemblages. Proc. Natl. Acad. Sci. USA 2017, 114, 7373–7378. [Google Scholar] [CrossRef] [PubMed] [Green Version]
  8. Agoubi, B.; Kharroubi, A.; Abida, H. Saltwater intrusion modelling in Jorf coastal aquifer, South-eastern Tunisia: Geochemical, geoelectrical and geostatistical application. Hydrol. Processes 2013, 27, 1191–1199. [Google Scholar] [CrossRef]
  9. Erler, A.R.; Frey, S.K.; Khader, O.; d’Orgeville, M.; Park, Y.J.; Hwang, H.T.; Lapen, D.R.; Peltier, W.R.; Sudicky, E.A. Evaluating climate change impacts on soil moisture and groundwater resources within a lake-affected region. Water Resour. Res. 2019, 55, 8142–8163. [Google Scholar] [CrossRef]
  10. Taylor, R.G.; Scanlon, B.; Döll, P.; Rodell, M.; Van Beek, R.; Wada, Y.; Longuevergne, L.; Leblanc, M.; Famiglietti, J.S.; Edmunds, M.; et al. Ground water and climate change. Nat. Clim. Chang. 2013, 3, 322–329. [Google Scholar] [CrossRef] [Green Version]
  11. Wada, Y.; Wisser, D.; Bierkens, M.F. Global modeling of withdrawal, allocation and consumptive use of surface water and groundwater resources. Earth Syst. Dyn. 2014, 5, 15–40. [Google Scholar] [CrossRef] [Green Version]
  12. Ashraf, B.; AghaKouchak, A.; Alizadeh, A.; Mousavi Baygi, M.; Moftakhari, H.R.; Mirchi, A.; Anjileli, H.; Madani, K. Quantifying anthropogenic stress on groundwater resources. Sci. Rep. 2017, 7, 1–9. [Google Scholar] [CrossRef] [Green Version]
  13. Joodaki, G.; Wahr, J.; Swenson, S. Estimating the human contribution to groundwater depletion in the Middle East, from GRACE data, land surface models, and well observations. Water Resour. Res. 2014, 50, 2679–2692. [Google Scholar] [CrossRef]
  14. Voss, K.A.; Famiglietti, J.S.; Lo, M.; De Linage, C.; Rodell, M.; Swenson, S.C. Groundwater depletion in the Middle East from GRACE with implications for transboundary water management in the Tigris-Euphrates-Western Iran region. Water Resour. Res. 2013, 49, 904–914. [Google Scholar] [CrossRef] [Green Version]
  15. Prasad, Y.S.; Rao, B.V. Groundwater depletion and groundwater balance studies of Kandivalasa river sub basin, Vizianagaram district, Andhra Pradesh, India. Groundw. Sustain. Dev. 2018, 6, 71–78. [Google Scholar] [CrossRef]
  16. Suter, J.F.; Rad, M.R.; Manning, D.T.; Goemans, C.; Sanderson, M.R. Depletion, climate, and the incremental value of groundwater. Resour. Energy Econ. 2019, 63, 101143. [Google Scholar] [CrossRef]
  17. Gleeson, T.; Wada, Y.; Bierkens, M.F.; Van Beek, L.P. Water balance of global aquifers revealed by groundwater footprint. Nature 2012, 488, 197–200. [Google Scholar] [CrossRef]
  18. Zektser, I.S.; Everett, L.G. Groundwater Resources of the World and Their Use; Groundw. No 6; UNESCO: Paris, France, 2004; Available online: http://unesdoc.unesco.org/images/0013/001344/134433e.pdf (accessed on 9 April 2010).
  19. Scanlon, B.R.; Faunt, C.C.; Longuevergne, L.; Reedy, R.C.; Alley, W.M.; McGuire, V.L.; McMahon, P.B. Groundwater depletion and sustainability of irrigation in the US High Plains and Central Valley. Proc. Natl. Acad. Sci. USA 2012, 109, 9320–9325. [Google Scholar] [CrossRef] [Green Version]
  20. De Graaf, I.E.; Gleeson, T.; Van Beek, L.R.; Sutanudjaja, E.H.; Bierkens, M.F. Environmental flow limits to global groundwater pumping. Nature 2019, 574, 90–94. [Google Scholar] [CrossRef]
  21. Serra, P.; Salvati, L.; Queralt, E.; Pin, C.; Gonzalez, O.; Pons, X. Estimating water consumption and irrigation requirements in a long-established mediterranean rural community by remote sensing and field data. Irrig. Drain. 2016, 65, 578–588. [Google Scholar] [CrossRef]
  22. Shahdany, S.H.; Majd, E.A.; Firoozfar, A.; Maestre, J. Improving operation of a main irrigation canal suffering from inflow fluctuation within a centralized model predictive control system: Case study of Roodasht Canal, Iran. J. Irrig. Drain. Eng. 2016, 142, 05016007. [Google Scholar] [CrossRef]
  23. Abbasi, F.; Sohrab, F.; Abbasi, N. Evaluation of irrigation efficiencies in Iran. Irrig. Drain. Struct. Eng. Res. 2017, 17, 113–120. [Google Scholar]
  24. Agide, Z.; Haileslassie, A.; Sally, H.; Erkossa, T.; Schmitter, P.S.; Langan, S.J.; Hoekstra, D. Analysis of Water Delivery Performance of Smallholder Irrigation Schemes in Ethiopia: Diversity and Lessons across Schemes, Typologies and Reaches; International Livestock Research Institute: Nairobi, Kenya, 2016. [Google Scholar]
  25. Barkhordari, S.; Shahadany, S.H.; Taghvaeian, S.; Firoozfar, A.R.; Maestre, J.M. Reducing losses in earthen agricultural water conveyance and distribution systems by employing automatic control systems. Comput. Electron. Agric. 2020, 168, 105122. [Google Scholar] [CrossRef]
  26. Guan, G.; Clemmens, A.; Kacerek, T.; Wahlin, B. Applying water-level difference control to central Arizona project. J. Irrig. Drain. Eng. 2011, 137, 747–753. [Google Scholar] [CrossRef]
  27. Yang, Z.; Mao, Z.; Guan, G.; Gao, W. Space-time mesh refinement method for simulating transient mixed flows. J. Hydraul. Res. 2021, 59, 835–846. [Google Scholar] [CrossRef]
  28. Zhong, K.; Guan, G.; Tian, X.; Maestre, J.M.; Mao, Z. Evaluating optimization objectives in linear quadratic control applied to open canal automation. J. Water Resour. Plan. Manag. 2020, 146, 04020087. [Google Scholar] [CrossRef]
  29. Zhonghao, M.; Guanghua, G.; Zhonghua, Y.; Ke, Z. Linear model of water movements for large-scale inverted siphon in water distribution system. J. Hydroinformatics 2019, 21, 1048–1063. [Google Scholar] [CrossRef] [Green Version]
  30. Liu, G.; Guan, G.; Wang, C. Transition mode of long distance water delivery project before freezing in winter. J. Hydroinformatics 2013, 15, 306–320. [Google Scholar] [CrossRef]
  31. Savari, H.; Monem, M.; Shahverdi, K. Comparing the Performance of FSL and Traditional Operation Methods for On-Request Water Delivery in the Aghili Network, Iran. J. Irrig. Drain. Eng. 2016, 142, 04016055. [Google Scholar] [CrossRef]
  32. Shahverdi, K.; Monem, M.J. Application of reinforcement learning algorithm for automation of canal structures. Irrig. Drain. 2015, 64, 77–84. [Google Scholar] [CrossRef]
  33. Shahverdi, K.; Monem, M.J.; Nili, M. Fuzzy SARSA learning of operational instructions to schedule water distribution and delivery. Irrig. Drain. 2016, 65, 276–284. [Google Scholar] [CrossRef]
  34. Omidzade, F.; Ghodousi, H.; Shahverdi, K. Comparing fuzzy SARSA learning and ant Colony optimization algorithms in water delivery scheduling under water shortage conditions. J. Irrig. Drain. Eng. 2020, 146, 04020028. [Google Scholar] [CrossRef]
  35. Shahverdi, K.; Maestre, J.; Alamiyan-Harandi, F.; Tian, X. Generalizing fuzzy SARSA learning for real-time operation of irrigation canals. Water 2020, 12, 2407. [Google Scholar] [CrossRef]
  36. Gleeson, T.; Richter, B. How much groundwater can we pump and protect environmental flows through time? Presumptive standards for conjunctive management of aquifers and rivers. River Res. Appl. 2018, 34, 83–92. [Google Scholar] [CrossRef]
  37. Salam, M.; Cheema, M.J.M.; Zhang, W.; Hussain, S.; Khan, A.; Bilal, M.; Arshad, A.; Ali, S.; Zaman, M.A. Groundwater storage change estimation using grace satellite data in Indus Basin. Big Data Water Resour. Eng. 2020, 1, 13–18. [Google Scholar] [CrossRef]
  38. Aslam, M.; Arshad, M.; Hussain, S.; Usman, M.; Zahid, M.B.; Sattar, J.; Arshad, A.; Iqbal, M.M.; Waqas, M.S. An integrated approach for estimation of van genuchten model parameters in undisturbed and unsaturated soils. Pak. J. Agri. Sci. 2021, 58, 1895–1901. [Google Scholar]
  39. Arshad, A.; Zhang, Z.; Zhang, W.; Dilawar, A. Mapping favorable groundwater potential recharge zones using a GIS-based analytical hierarchical process and probability frequency ratio model: A case study from an agro-urban region of Pakistan. Geosci. Front. 2020, 11, 1805–1819. [Google Scholar] [CrossRef]
  40. Ministry of Power. Water Resources Balances for Najafabad Aquifer Area; Iran Water Resource: Tehran, Iran, 2012.
  41. Litrico, X.; Fromion, V. Modeling and Control of Hydrosystems; Springer Science & Business Media: Berlin, Germany, 2009. [Google Scholar]
  42. Xu, M. Real-Time Control of Combined Water Quantity & Quality in Open Channels. Ph.D. Thesis, Delft University of Technology, Delft, The Netherlands, 2013. [Google Scholar]
  43. Schuurmans, J.; Clemmens, A.; Dijkstra, S.; Hof, A.; Brouwer, R. Modeling of irrigation and drainage canals for controller design. J. Irrig. Drain. Eng. 1999, 125, 338–344. [Google Scholar] [CrossRef] [Green Version]
  44. Negenborn, R.R.; Van Overloop, P.-J.; Keviczky, T.; De Schutter, B. Distributed model predictive control of irrigation canals. Netw. Heterog. Media 2009, 4, 359. [Google Scholar] [CrossRef]
  45. Van Overloop, P.; Clemmens, A.; Strand, R.; Wagemaker, R.; Bautista, E. Real-time implementation of model predictive control on Maricopa-Stanfield irrigation and drainage district’s WM canal. J. Irrig. Drain. Eng. 2010, 136, 747–756. [Google Scholar] [CrossRef]
  46. Molden, D.J.; Gates, T.K. Performance measures for evaluation of irrigation-water-delivery systems. J. Irrig. Drain. Eng. 1990, 116, 804–823. [Google Scholar] [CrossRef]
  47. Hosseini Jolfan, M.; Hashemy Shahdany, S.M.; Javadi, S.; Mallakpour, I.; Neshat, A. Effects of canal automation on reducing groundwater extraction within irrigation districts: Case study of Qazvin irrigation district. Irrig. Drain. 2020, 69, 11–24. [Google Scholar] [CrossRef]
  48. Khiabani, M.Y.; Shahadany, S.H.; Maestre, J.; Stepanian, R.; Mallakpour, I. Potential assessment of non-automatic and automatic modernization alternatives for the improvement of water distribution supplied by surface-water resources: A case study in Iran. Agric. Water Manag. 2020, 230, 105964. [Google Scholar] [CrossRef]
  49. Van Overloop, P.J. Model Predictive Control on Open Water Systems; Delft University of Technology: Delft, The Netherlands, 2006. [Google Scholar]
  50. Van Overloop, P.; Weijs, S.; Dijkstra, S. Multiple Model Predictive Control on a drainage canal system. Control Eng. Pract. 2008, 16, 531–540. [Google Scholar] [CrossRef]
  51. Harbaugh, A.; Banta, E.; Hill, M.; Macdonald, M. The US Geological Survey Modular Ground Water Models: User Guide to Modulization Concepts and the Groundwater Flow Process. US Geol. Surv Open-File Rep 2000–92, 2000. Available online: http://water.usgs.gov/nrp/gwsoftware/modflow2000/ofr00-92 (accessed on 9 April 2010).
  52. Lalehzari, R.; Tabatabaei, S.-H.; Kholghi, M. Simulation of nitrate transport and wastewater seepage in groundwater flow system. Int. J. Environ. Sci. Technol. 2013, 10, 1367–1376. [Google Scholar] [CrossRef] [Green Version]
  53. Mazza, R.; La Vigna, F.; Alimonti, C. Evaluating the available regional groundwater resources using the distributed hydrogeological budget. Water Resour. Manag. 2014, 28, 749–765. [Google Scholar] [CrossRef]
  54. Sheng, Z. An aquifer storage and recovery system with reclaimed wastewater to preserve native groundwater resources in El Paso, Texas. J. Environ. Manag. 2005, 75, 367–377. [Google Scholar] [CrossRef]
  55. Anan, M.; Yuge, K.; Nakano, Y.; Saptomo, S.; Haraguchi, T. Quantification of the effect of rice paddy area changes on recharging groundwater. Paddy Water Environ. 2007, 5, 41–47. [Google Scholar] [CrossRef]
  56. Dillon, P.; Arshad, M. Managed aquifer recharge in integrated water resource management. In Integrated Groundwater Management; Springer: Cham, Switzerland, 2016; pp. 435–452. [Google Scholar]
  57. Jeong, H.Y.; Jun, S.-C.; Cheon, J.-Y.; Park, M. A review on clogging mechanisms and managements in aquifer storage and recovery (ASR) applications. Geosci. J. 2018, 22, 667–679. [Google Scholar] [CrossRef]
  58. Gibson, M.T.; Campana, M.E.; Nazy, D. Estimating aquifer storage and recovery (ASR) regional and local suitability: A case study in Washington state, USA. Hydrology 2018, 5, 7. [Google Scholar] [CrossRef] [Green Version]
  59. Javadi, S.; Saatsaz, M.; Shahdany, S.M.; Neshat, A.; Milan, S.G.; Akbari, S. A new hybrid framework of site selection for groundwater recharge. Geoscience Frontiers. 2021, 12, 101144. [Google Scholar] [CrossRef]
Figure 1. Location of the study area and the investigated aquifer.
Water 14 01610 g001
Figure 2. (a) Neyrpic module reservoir, (b) Sliding valve.
Water 14 01610 g002
Figure 3. Schematic of water delivery scheduling (manual-based operating system A).
Water 14 01610 g003
Figure 4. Centralized automatic operating system (note: 0: represents computing-controlled variable and 1: represents the hydraulic variable measured by sensors).
Water 14 01610 g004
Figure 5. Spatial distribution map of adequacy and area of exploitation wells.
Water 14 01610 g005
Figure 6. Groundwater model map simulated by MODFLOW, (a) calibrated specific yield, (b) calibrated hydraulic conductivity.
Water 14 01610 g006
Figure 7. Groundwater level rise under the influence of balancing strategies in normal and drought scenarios (15 and 30%).
Water 14 01610 g007
Figure 8. Aquifer hydrograph after applying alternative management strategies.
Water 14 01610 g008
Table 1. Molden and Gates’ standard for adequacy and dependability indices.
IndexPerformance Class
GoodMediocrePoor
P A 0.9–10.8–0.89<0.8
P D 0–0.10.11–0.20>0.2
Table 2. Number of reservoirs in the Nekouabad surface water distribution system in each category of adequacy and dependability indices of water distribution after the application of the strategies in a normal scenario.
Aquifer Balancing StrategyAdequacy IndexDependability Index
GoodFairPoorGoodFairPoor
HMOS 1247148
MBOS 2A256247
MBOS B 463436
CAOS 313001300
Current system03100112
1 hydro-mechanical operating system, 2 manual-based operating system, 3 centralized automatic operating system.
Table 3. Number of wells with a reduction in the withdrawal after application of the strategies.
Aquifer Balancing StrategyBeing ClosedNumber of Operational Wells
75%50%40%
HMOS881240583044
MBOS A2891233566416
MBOS B627152150504
CAOS2494370199017
Table 4. Number of reservoirs in the Nekouabad surface water distribution system in each category of adequacy and dependability indices of water distribution after the application of the strategies according to the 15% drought scenario.
Aquifer Balancing StrategyAdequacy IndexDependability Index
GoodFairPoorGoodFairPoor
HMOS229148
MBOS A139139
MBOS B 337319
CAOS01301300
Current system01120211
Table 5. Number of reservoirs in the Nekouabad surface water distribution system in each category of adequacy and dependability indices of water distribution after the application of the strategies due to the 30% drought scenario.
Aquifer Balancing StrategyAdequacy IndexDependability Index
GoodFairPoorGoodFairPoor
HMOS0310049
MBOS A0211049
MBOS B 058058
CAOS01301300
Current system00130310
Publisher’s Note: MDPI stays neutral with regard to jurisdictional claims in published maps and institutional affiliations.

