
A Case Study of Flood Risk Evaluation Based on Emergy Theory and Cloud Model in Anyang Region, China

School of Water Conservancy Engineering, Zhengzhou University, Zhengzhou 450001, China
*
Author to whom correspondence should be addressed.
Water 2021, 13(4), 420; https://doi.org/10.3390/w13040420
Submission received: 15 December 2020
/
Revised: 28 January 2021
/
Accepted: 2 February 2021
/
Published: 5 February 2021
(This article belongs to the Section Hydrology)
Abstract
:With the progression of climate change, the intensity and frequency of extreme rainfall have increased in many parts of the world, while the continuous acceleration of urbanization has made cities more vulnerable to floods. In order to effectively estimate and assess the risks brought by flood disasters, this paper proposes a regional flood disaster risk assessment model combining emergy theory and the cloud model. The emergy theory can measure many kinds of hazardous factor and convert them into unified solar emergy (sej) for quantification. The cloud model can transform the uncertainty in flood risk assessment into certainty in an appropriate way, making the urban flood risk assessment more accurate and effective. In this study, the flood risk assessment model combines the advantages of the two research methods to establish a natural and social dual flood risk assessment system. Based on this, the risk assessment system of the flood hazard cloud model is established. This model was used in a flood disaster risk assessment, and the risk level was divided into five levels: very low risk, low risk, medium risk, high risk, and very high risk. Flood hazard risk results were obtained by using the entropy weight method and fuzzy transformation method. As an example for the application of this model, this paper focuses on the Anyang region which has a typical continental monsoon climate. The results show that the Anyang region has a serious flood disaster threat. Within this region, Linzhou County and Anyang County have very high levels of risk for flood disaster, while Hua County, Neihuang County, Wenfeng District and Beiguan District have high levels of risk for flood disaster. These areas are the core urban areas and the economic center of local administrative regions, with 70% of the industrial clusters being situated in these regions. Only with the coordinated development of regional flood control planning, economy, and population, and reductions in the uncertainty of existing flood control and drainage facilities can the sustainable, healthy and stable development of the region be maintained.
1. Introduction
With changes in the modern climate, the frequency of extreme climate events has gradually increased [1]. Rapid global warming, large changes in the underlying surface, and the deterioration of the ecological environment are further complicating the causes of flood disaster [2,3]. Especially since the 21st century, the rate of urbanization has continued to accelerate, and the problem of flooding in urban areas has rapidly intensified. Flood disasters have become a challenging problem [4]. From 2000 to 2010, the average annual population affected by floods in China was 128.315 million, and the average area of farmland affected was 10.597 million hm2, while the average annual direct loss was USD 14.32 billion [5]. An effective way to reduce the damage caused by flood disasters is to perform a complete disaster risk assessment of floods. Due to the wide range of flood risks, the complexity of uncertainties, and the lack of financial support, previous flood research has focused on crisis management. However, since the last century, with the improvement of flood disaster prevention and control, people have become increasingly aware that combinations of engineering and non-engineering measures are key to reducing the problem [6]. As an advanced method of disaster prevention and reduction, flood risk assessment has received a great deal of attention from the academic circle and become an important field, frontier subject and research direction of water resources management [7]. Urban flood risk assessment is of great significance to reduce the damage caused by floods and to protect people’s property.
Traditionally, the main methods used to study flood disasters include GIS (Geographic Information System) evaluations, hydrodynamic models, ancient flood statistical analysis methods, and integrated methods such as mathematical and physical methods for flood risk assessment. At present, the use of GIS is a common method to visualize the underlying surface and establish a series of data models to analyze the impact factors of flood disasters. For example, Chen et al. [8] listed the main factors that contribute to flood formation and used GIS to extract the underlying factors of Memphis University in Memphis, Tennessee. They established a GIS-based urban flooding model, and provided a new way for urban flood disaster risk planning. GIS can better objectively analyze data, and present the results of a risk assessment to people more intuitively. However, the raster-type data require a high level of generalization within the grid, which cannot fully reflect the flood risk status of the region at multiple objectives and time scales. The method only uses simple raster data to split each region, and less consideration is given to the development and impact of disasters with causal patterns. The hydrodynamic method is a traditional flood disaster risk assessment method [9]. For example, Merwade et al. [10], by mapping and analyzing channel data, compared the Brazos river in Texas, Kootenai river in Montana and Strouds river in North Carolina. Creation of a 3D mesh for the main channel using a channel-fitted coordinate system and subsequent integration with surrounding topography produced a coherent river terrain model, which can be used for 2D/3D hydrodynamic modeling and flood inundation mapping. Through the analysis and statistics of flood data, the spatial distribution characteristics of relevant factors can be obtained. However, due to the need for highly accurate information and the long study period, this is not suitable for other regions. Regional floods are caused by the interaction of hazard factors, the disaster environment, and hazard-affected bodies, with a considerable level of uncertainty [11]. The traditional research methods cannot fully reflect the relationship among the influencing factors of a flood disaster. The theories and findings of regional flood analyses also need to be re-evaluated in terms of the impact of floods in the current economic and living situation, to adapt to economic and social progress and the rapid technological advancements.
With the increasing importance of flood risk assessments, a great deal of research methods for flood disasters have been proposed. However, traditional methods are faced with complex and uncertain problems in today’s dramatically changing environment. The introduction of complex models and mathematical methods has placed high demands on the data condition, which are not compatible with the needs of a wide flood hazard assessment. Therefore, this paper proposes a regional flood risk assessment based on emergy theory and the cloud model. Due to the diversity of disaster factors, different factors have significant differences. We, therefore, need to convert all kinds of factors into a consistent material unit for calculations. So, we introduce the theory of emergy value, which measures the complex disaster-causing factors, disaster-bearing environment and disaster-bearing bodies. All kinds of factor indexes were converted into unified solar emergy indexes through the solar emergy conversion rate, and as the basis of the risk assessment model of flood disaster. Song et al. [12] combined emergy theory with system dynamics to establish the emergy flow System Dynamics(SD)model of a city eco-economic system, including economy, population, waste, and an emergy sub model. By designing three scenarios of different economic growth rates and environmental protection investment, they analyzed the sustainable development capacity of Beijing under different scenarios. The cloud model can better transform the uncertainty into a more intuitive and clear description, which is conducive to more extensive mining of existing data, making the evaluation more objective and accurate. As a mathematical model that can effectively deal with qualitative and quantitative problems, the cloud model can directly describe the uncertainty in the form of cloud droplet thickness, which can make the regional flood risk assessment result more accurate [13]. Glenis et al. [14] built a city flood risk model based on the cloud model. They proposed an architecture that would help simplify the process of performing parameter scanning as a service cloud on the infrastructure. At the same time, the architecture was used to assess spatial and temporal flood risk at the whole city scale. Therefore, the cloud model can play an important role in flood disaster risk assessment.
Anyang city is located in the northern temperate zone of central China and has a temperate continental climate, which is typical of China’s urban administrative regions. According to statistics [15], Anyang region has suffered numerous time from flood disasters. In August 1963, August 1982, June 1996, and July 2016, many places within the Anyang region suffered floods and flash floods caused by heavy rainfall. The lives of the people living here have been greatly affected and the economy has suffered as well. At present, there has been a great deal of research related to flood risk assessment in Anyang region and other similar areas. For example, Jiao et al. [16] analyzed typical flood disasters in historical years in the Anyang region, confirming that severe flood disasters caused huge economic losses, indicating that the increase in impermeable water level relatively weakened the flood disaster bearing capacity of the city. This finding is consistent with the flood disaster risk distribution results of Anyang city that were obtained in this paper. Liu et al. [17] used global grid precipitation, digital elevation, slope, river system, GDP and population density data to obtain a flood risk level map of Henan Province, and concluded that the Anyang region is a high-risk area, and the findings on the spatial distribution of the flood index are consistent with the research results of this paper. Therefore, this paper uses the Anyang region for a case study as an application example, and obtains the results of a risk assessment for flood disasters in the Anyang region. The results of the flood disaster risk assessment will help in the construction of reasonable flood disaster early warning systems and the more effective deployment of flood control resources, while providing references for research into the risk of flood disaster in other cities.
2. Materials and Methods
2.1. Development of Flood Disaster Risk Evaluation Model Based Emergy and Cloud Model
The construction of a flood hazard risk assessment model based on emergy evaluation and the cloud model consists of three parts: emergy evaluation conversion, application of the cloud model and the construction of weight. The model is built as follows. Firstly, all factors affecting the flood disaster are identified and the risk assessment criteria of the regional flood disaster are established. Then, the membership function matrix of the cloud model is constructed according to the historical flood disaster data and the weights of each indicator are determined. Finally, the results, grades and distributions of flood risk are determined according to the cloud model.
2.1.1. Emergy Evaluation Conversion
Odum [18] developed the concept of emergy, based on general system theory and thermodynamic laws. It is defined as the amount of emergy that flows or is stored that contains other types of emergy. The theory is used to consider the different emergy masses inherent in the emergy and material flows of complex eco-economic systems. The emergy theory and method have successfully solved the problem that emergy of different types and different properties cannot be added, subtracted or compared in emergy research. The emergy theory and analysis method is an environment–economic theory and system analysis method. The principles and methods of emergy analysis can deepen the understanding of emergy flow, transformation and storage in ecosystems, and provide a common scale for measuring and comparing various types of emergy. The conversion of different types, non-comparable emergies and substances into the same standard emergy value for comparison can measure and compare the true value of different types. All forms of emergy comes from solar emergy, so solar emergy is often used as a benchmark to measure the emergy evaluation of various emergies. The emergy evaluation of a flow of storage can be derived by multiplying its emergy content or mass by its transformity, and the unit is joules (J):
Emergy (sej) = emergy (J) × solar transformity (sej/J)
The emergy conversion is based on the emergy theory of ecological economics. The greatest difficulty in emergy analysis, is the analysis and calculation of the emergy evaluation conversion rate of all kinds of emergy, materials, and even information and labor. So far, international emergy evaluation research has made great progress. Odum and researchers from various countries have calculated the solar emergy evaluation conversion rate of major emergy (material) types in nature and human economic society through extensive research practices, as shown in Table 1. In the system, the solar emergy evaluation conversion rate in the main emergy flow process can be calculated in various ways [19]. The most important method is to calculate the emergy conversion rate of different indexes through emergy storage analysis and the conversion rate of other solar emergy evaluations. Based on the emergy conversion rate, the indexes in the risk assessment of flood disaster were quantified and unified into solar emergy (sej) indexes.
2.1.2. Construction of Cloud Model
In 1995, Li [20], an academician of the Chinese Academy of Engineering, creatively proposed the concept of the cloud model with a large amount of data and research on probability theory and fuzzy mathematics, revealing the relationship between uncertainty and certainty of a large number of fuzzy concepts in natural and social science. The cloud model is a method of fuzzy mathematics, and the normal cloud model is one of the most widely used cloud models [21]. By establishing the normal cloud model, the concept of uncertainty is transformed into explicit relations and data, and the inner relationship between randomness and fuzziness is revealed.
Definition of the normal cloud: let X be an ordinary set X = {X}, let X be the codomain. There is A fuzzy set A in the codomain, which means that for any element x there is A random number u(x), corresponding to x, and this set of random numbers is called the membership of set A.
If the elements in the domain are simple and have their order, then x can be considered as a normal variable, where the distribution of membership on x is called the normal cloud. If the elements in the co-domain are not simply ordered, then according to rule, X can be mapped to another ordered co-domain Y, one of which has only one Y corresponding to X, then Y is the basic variable, and the distribution of membership degree is called the normal cloud.
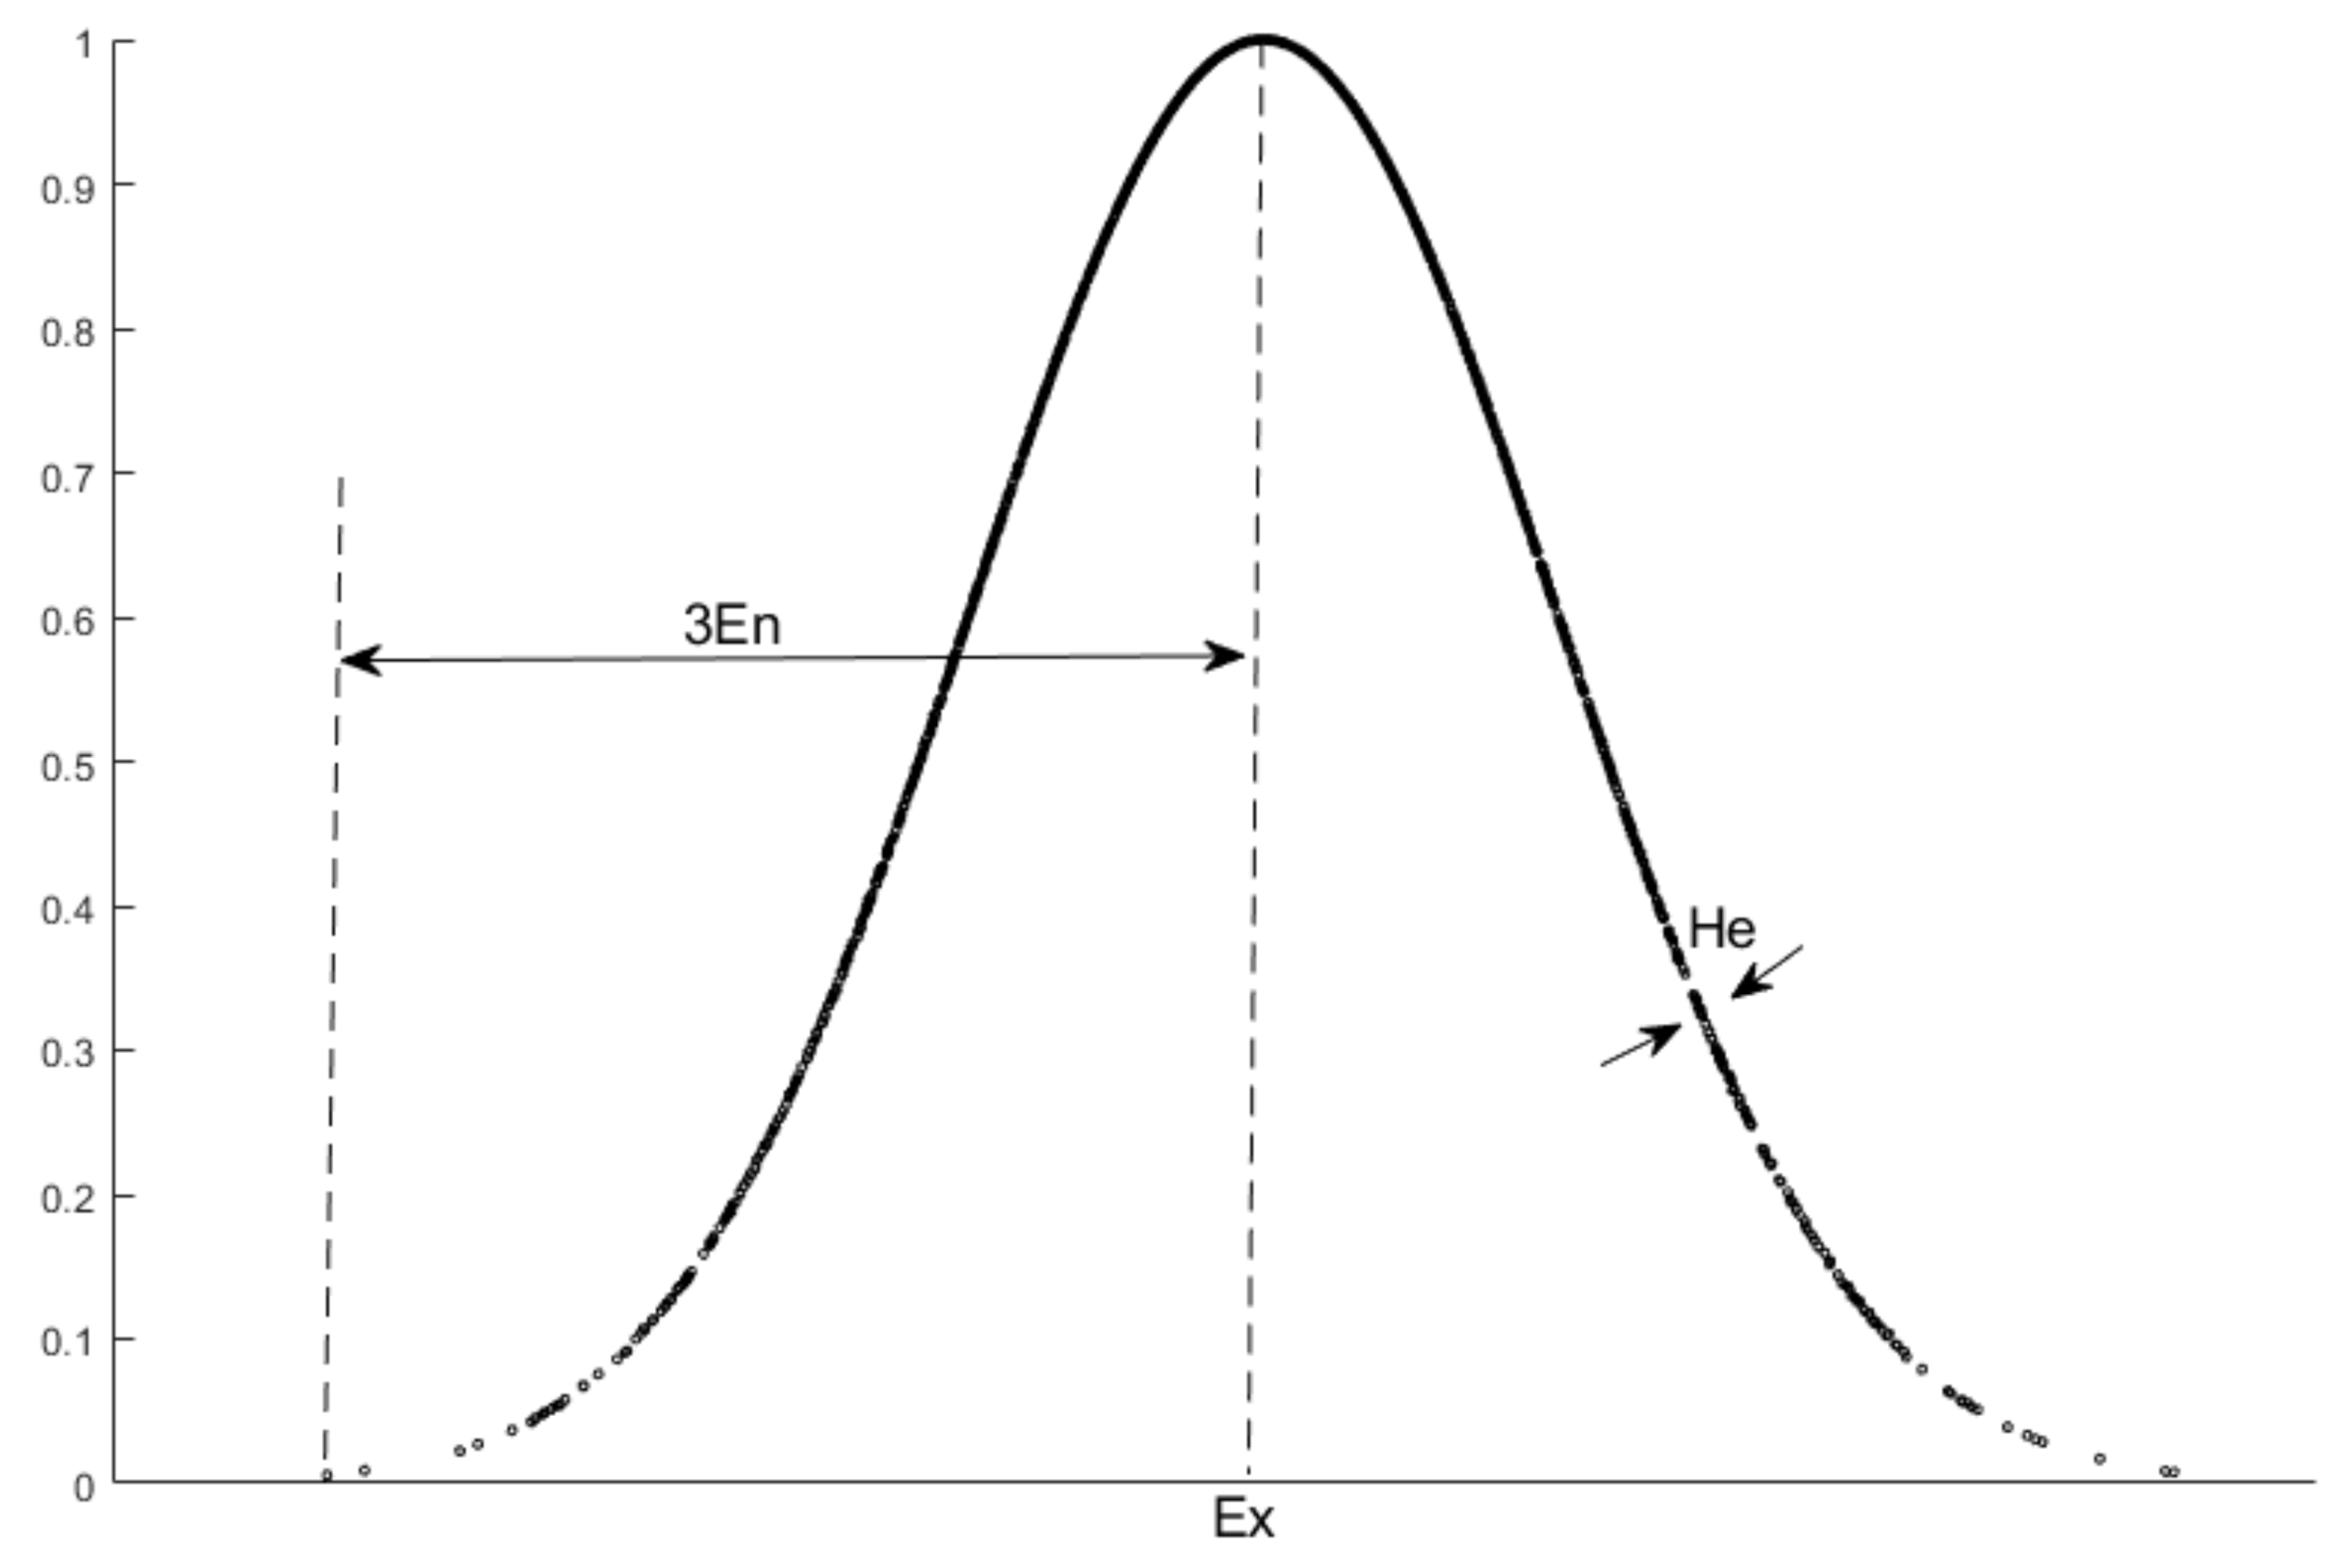
The normal cloud contains three times of normal distribution at the same time. The three numerical eigenvalues of the normal cloud are the expected value Ex, the entropy value En and the hyper entropy value He, respectively. The algorithm for generating the normal cloud can be used in software, and the method of generating the algorithm is known as the cloud generator [22]. There are four types of cloud generators: forward cloud generator, reverse cloud generator, X condition cloud generator and Y condition cloud generator.
In this paper, x conditional cloud generator is used to calculate the membership degree of all levels, and the calculation formula is as follows.
Exij, Enij represent the Ex and En evaluations of the i-th indicator corresponding to the j-th risk level. Xij represents the membership value of the i-th indicator to the j-th risk level; and respectively, represent the upper and lower boundary values of the evaluation index system standard [23]. He (Hyperentropy) represents the uncertainty of entropy and also reflects the dispersion degree of each cloud droplet, as shown in Figure 1.
2.1.3. Entropy Weight
In this paper, the entropy weight method was used to determine the weight of each index. Entropy weighting method is a kind of objective weighting method, which has been widely used in recent years [24] The smaller the entropy value of the index, the greater the variation degree of the index value. The entropy weight method is calculated as follows:
Suppose there are m evaluation objects, and each evaluation object has n evaluation indexes. The range method is used to normalize the index data to the range of [0,1], and the normalized matrix (rij)mxn is established.
fij represents the specific gravity of each indicator:
Calculate the entropy of each index:
Calculate the entropy weight of the j-th evaluation index:
The entropy weight method combined with historical flood data can objectively estimate the influence degree of each index on flood risk assessment [25] and further quantify the entropy weight table of the flood risk assessment index in the Anyang region, which provides fundamental work for the construction of the cloud model.
2.2. Case Study and Available Data
2.2.1. Case Study
The Anyang region is in the north Henan Province, China. It is one of the centers of early Chinese civilizations and is a famous national historical and cultural area. The Anyang region is located between 113°37′ to 114°58′ east longitude and 35°12′ to 36°22′ north latitude. The Anyang region covers a total area of 7413 square kilometers and has jurisdiction that includes 4 districts, 1 county-level city and 4 counties, with a permanent resident population of 5.192 million (Figure 2). The Anyang region is a prefecture-level city, which is typical of urban and rural integrated administrative regions in China. Compared with the European and American urban zoning, it not only has urban areas such as Yindu District, Beiguan District, Longan District and Wenfeng District, but also rural areas such as Anyang County, Hua County and Tangyin County. Urban areas are industrial clusters with dense populations, and rural areas are mainly agricultural. This representative urban planning means that the Anyang region has encompassed a considerable number of urban and rural communities in the long-term development of the area. Therefore, it is of great reference value to study the flood disaster risk in the existing administrative division.
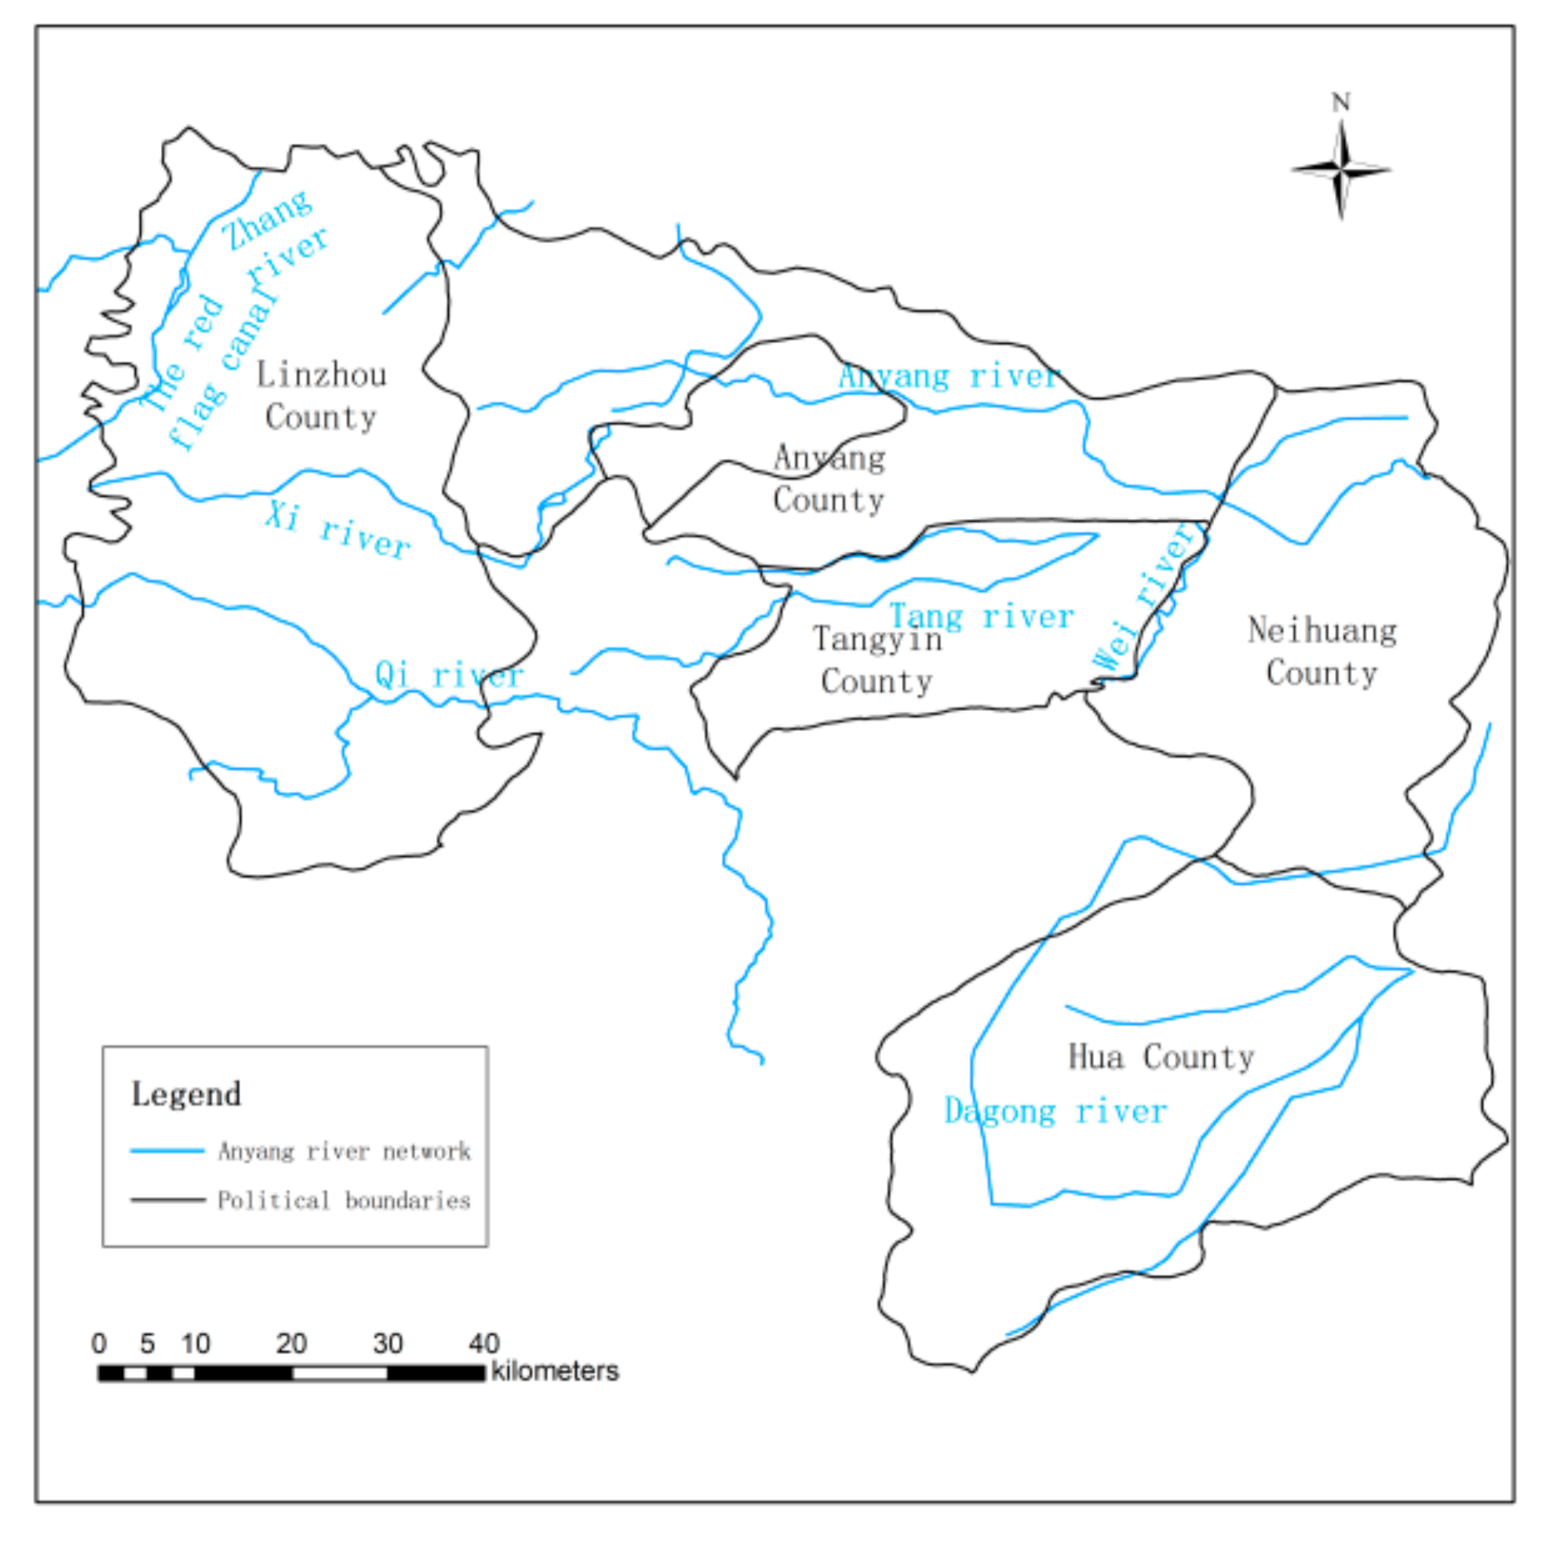
The Anyang region is adjacent to the Taihang Mountains to the west, in which, many rivers are located. As the precipitation varies from season to season, the runoff of each river varies greatly. The plentiful water sources not only bring convenience, but also put a great deal of pressure on flood control. Most of the rivers in Anyang belong to the Zhangwei South Channel of the Hai River, and the main rivers are the Qi River and the Anyang River (Figure 3). According to statistics [26], the Anyang region has suffered more than 15 heavy rainstorms since 2000, most of which have occurred in summer, which have seriously affected the economic life of the local people. In 2016, the direct economic loss due to heavy rainstorms was as high as USD 1 billion.
2.2.2. Identification of the Criteria
A flood disaster is a complex issue. Its formation is the result of a combination of hazard factors, the disaster environment, and the hazard-affected bodies [27]. Based on the natural characteristics of the flood, the hazard factors are composed of heavy rainfall, which is caused by the weather system, for example, air mass, frontal rain, cyclones and anticyclones. The disaster environment is the Earth’s surface system, formed by the interaction of the atmosphere, hydrosphere, lithosphere and biosphere. The hazard-affected bodies include both natural and man-made environmental carriers, and their loss in flood disaster is determined by their spatial density, distribution range, vulnerability characteristics and flood disaster force. In one scenario, the urban disaster environment can form hazard factors, reduce the urban disaster-bearing capacity, and finally lead to disaster. Yet for another scenario, the urban disaster environment can increase the urban hazard-affected capacity by influencing the city’s property distribution, thereby weakening the hazard factors and reducing the urban disaster. It can be seen that the hazard factors, disaster environment and hazard-affected bodies affect and restrict each other. Therefore, in the process of constructing the flood disaster risk assessment for the Anyang region—based on studying many years of rainfall data from the Anyang region, and combining this with analyzing the occurrence and disaster situation of flood disasters in the Anyang region in recent years—appropriate evaluation indexes are selected. In addition, new influences arising from socio-economic development can be incorporated into the flood risk rating system.
Rainfall is a fundamental factor in evaluating the risk of flood disaster in a region. Since the spatial distribution characteristics of precipitation in each year are different, while temporal distribution characteristics of precipitation are consistent [28]. So distribution characteristics of mean annual precipitation of each region in the Anyang region can be used to study the regional precipitation difference. At the same time, the monthly maximum rainfall represents peak data for short-term intense rainfall, which is highly consistent with abrupt precipitation and is a direct contributor to flooding. Therefore, these two datasets are selected as disaster-causing factors. The Anyang region is adjacent to the Taihang mountain range, the rugged terrain and the complex and complicated topographic features all have a significant effect on flood disasters. The highest point in Linzhou District, to the west of the Anyang region, is 1632 m above sea level, and the lowest point in Hua District is only 50 m above sea level. The direct line distance between the two places is less than 180 km. Therefore, the geographical elevation and elevation standard deviation were selected as the disaster-bearing environment. Population status, economic property distribution and the proportion of land use, as the main components involved in influencing flood disaster, do not solely influence flood disaster loss, but are also important indicators of statistical loss. In this paper, population density, per capita income and the proportion of cultivated land and forest land, proportion of urban construction and hydraulic engineering land, and the standard compliance rate of flood control structures are selected as disaster-bearing bodies. As shown in Table 2, the flood disaster evaluation standard system was established. In the following tables, the factors are replaced by the Serial numbers U1–U9.
2.2.3. Data Sources
ArcGIS, as a type of software that works through online maps and related geographic information, is characterized by mapping based on existing geographic data. ArcGIS is software that works through an online map and related geographic information. Its biggest feature is that it is based on the existing geographical data for mapping, and can analyze the study area through the intuitive grid image. In this paper, ArcGIS is used to display other data sets such as rainfall, terrain and other datasets.
- 1.
- Rainfall
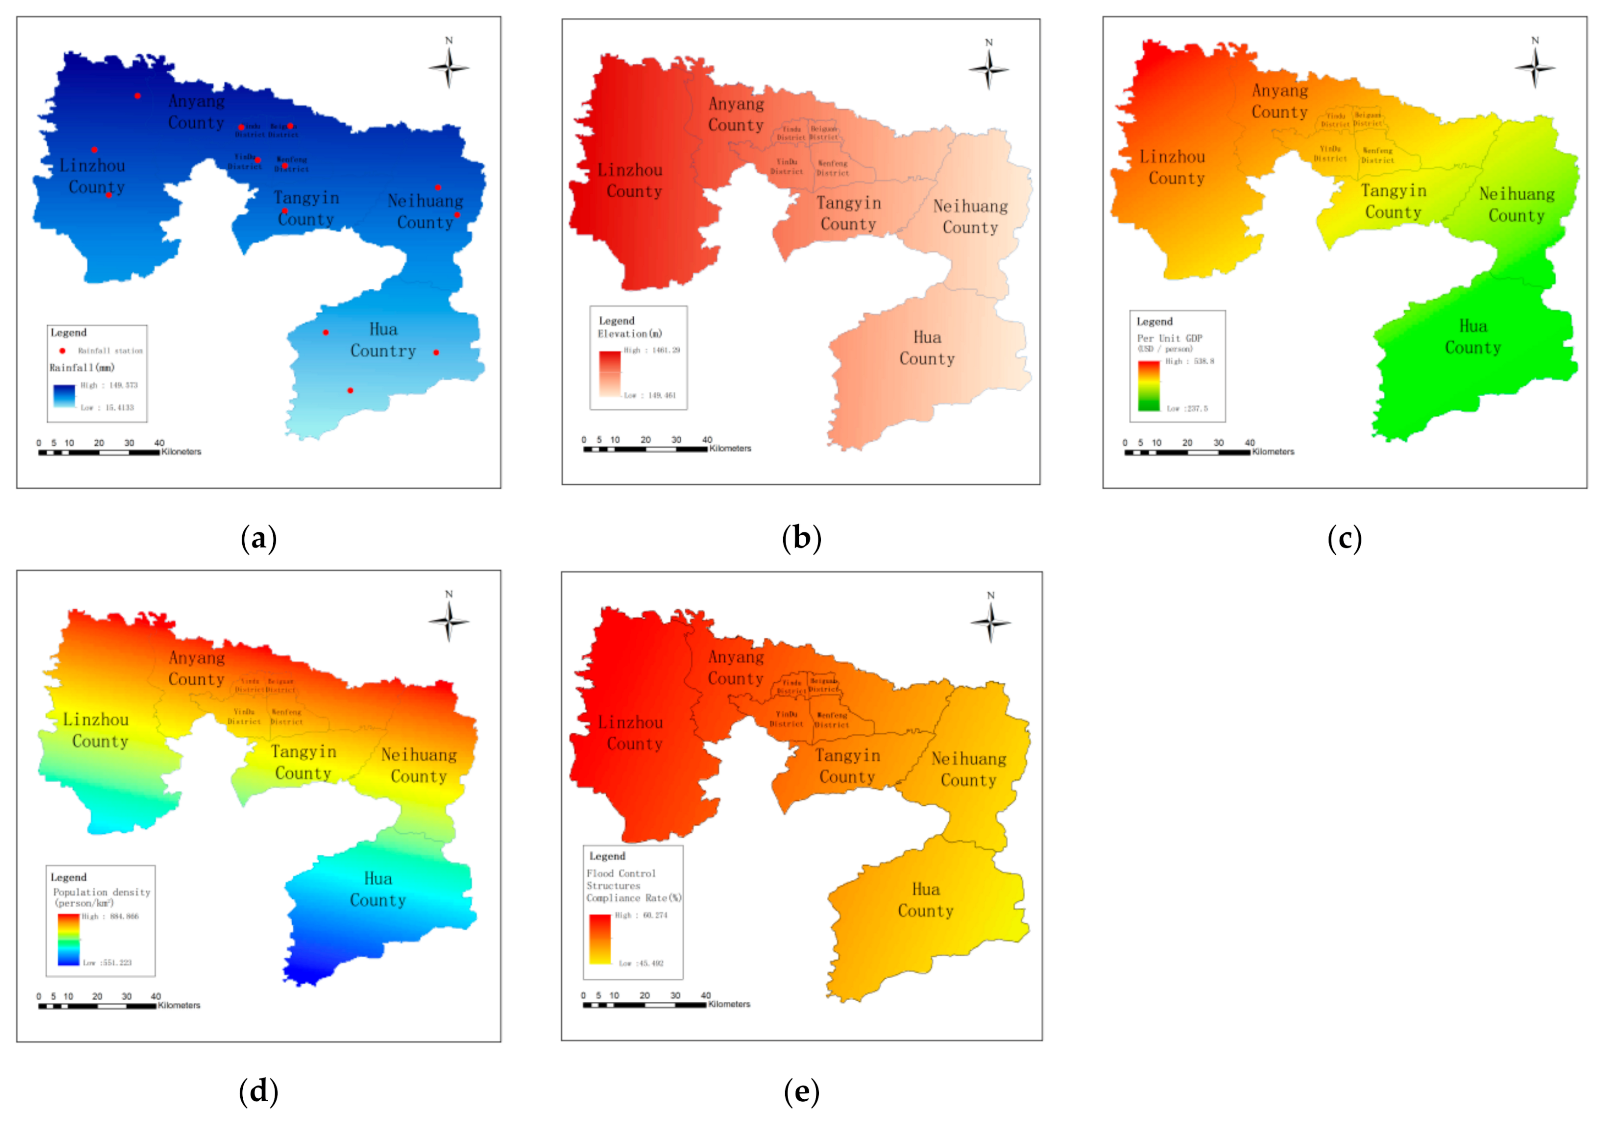
The research data in this paper include annual precipitation in Anyang from 2000 to 2019, and the data are obtained from China Meteorological Data Network (http://data.cma.cn (accessed on 15 October 2020)). Two important indices were derived from this: monthly average precipitation (mm) at 20–20 h (UTC + 8) in the studied years, and the maximum monthly rainfall in the studied years. Krigings interpolation is a function in ArcGIS. Its advantage is that the data gridding process takes into account the spatially relevant nature of the described objects, making the interpolation of results more scientific and closer to the actual situation. According to the surrounding 14 rain measuring stations, the kriging interpolation method in ArcGIS was used to calculate the rainfall of all parts of the region, as shown in Figure 4a.
- 2.
- Topographic characteristics
The change in terrain is an important factor that affects the flood disaster. The risk of flood disaster can be predicted more accurately by the topographic elevation data. The elevation data in the grid cell are generated by the digital elevation model (DEM) with a resolution of 90 m and can be downloaded from the Geospatial Cloud Service Platform. The individual grids are then classified, as shown in Figure 4b.
- 3.
- Social and economic factors
The hazard-affected bodies are shown as the stability of a region’s urban and rural system, which is specifically shown as population density, per capita income, etc. The data are from the statistical yearbook of the Anyang region from 2000 to 2017 [29]. A quantitative display of each grid cell in ArcGIS, as shown in Figure 4c,d.
- 4.
- Flood control construction
The construction standard of flood control facilities in an area is the most important engineering measure for flood control. The flood control structures compliance rate is the ratio of the length of flood protection embankments meeting the requirements of the relevant planned flood protection standards to the total length of the existing embankments [30]. The higher the compliance rate of flood control structures, the lower the risk of local flood disasters. Based on the data of flood control structures reaching the standard in each region of Anyang region, a distribution diagram was drawn, and each grid was marked, as shown in Figure 4e.
3. Results
3.1. Emergy Analysis
Emergy analysis solves the defects that emergy analysis ignores. Namely, the characteristics of emergy quality and the fact that money in an economic analysis cannot measure the contribution of nature to human economic and social development. The emergy value analysis method makes it possible to compare and analyze the emergy flow, logistics and other ecological economic flows of various ecosystems or ecological economic systems that are difficult to be measured. It can be used to evaluate renewable resources, non-renewable resources, goods, services, and even information and education. Emergy value conversion is the basis for the establishment of this model. The emergy conversion rate is an important concept derived from the food chain and thermodynamic principle of an ecosystem. It is a measure of the emergy quality of different types of emergy, which is closely related to the emergy level of the system. According to the second law of thermodynamics, there is a great deal of emergy dissipation and loss in each process of emergy transfer and transformation in the food chain. As a result, emergy is converted from low-grade solar emergy to high-quality greenery, and is transmitted and converted into higher-quality, more intensive emergy for consumers at all levels. In practical analyses, the conversion rate value for solar emergy is used, and how much solar joule emergy is converted per unit of emergy or material. If it takes 34,900 solar joules to form 1 joule of wood, then the emergy conversion rate of wood is 34,900 sej/J. In this paper, the emergy conversion rate is used to convert various disaster factors into solar emjourles (sej). For example, all kinds of planned land, such as farmland, forest land, urban and rural construction land, land for transportation and hydraulic engineering, and land for flood control structures, are converted into emergy value indicators, as shown in Table 3. Flood risk factors, such as regional elevation, monthly maximum rainfall, population density, fixed asset investment, and local GDP, are also converted into unified solar emergy indicators, as shown in Table 3. The distribution and proportion characteristics of each index in the Anyang region can be clearly obtained by converting different indexes into unified emergy value by using the conversion rate of emergy value. It can be found from Table 3, that the land planning of various regions in the Anyang region is completed to a sufficient standard. For example, forest land and cultivated land account for more than 50% in Linzhou City, while the land for transportation and hydraulic engineering is less than 5%. In Beiguan District, the construction land exceeds 60%, but the land for transportation and hydraulic engineering is only 2%. It can be found that the proportion of land used for transportation and hydraulic engineering in urban planning is too low, which greatly affects the construction of local flood control and hydraulic engineering projects and increases the level of risk in the assessment of flood disaster in this area. At the same time, the quantitative results in Table 3 show that the elevation and fixed asset investment emergy of Linzhou City is relatively high, and the monthly maximum rainfall emergy of Yindu District and Beiguan District is relatively high compared to other regions. As the impact factors of flood hazard risk assessment, these emergy indicators will, to a certain extent, cause deviations of the membership function in the cloud model, which will affect the final assessment results.
3.2. Determination of Weight
Weight refers to the impact of the risk evaluation index on this evaluation. The entropy weighting method is a kind of objective weighting method, which has been widely used in recent years. The smaller the entropy value of the index, the greater the variation degree of the index value, and the higher the weight of the index. The entropy weight method is composed of the data evaluation of the evaluation index, combined with a large number of data statistics and data matrix, so the calculated weight has a certain degree of objectivity. The entropy weight method was used to calculate the weight of each index, providing the necessary preparation for the construction of the risk assessment model in this paper. The entropy weight method combined with historical flood data can objectively estimate the impact degree of each index in the flood risk assessment. Therefore, the influence degree of each index in the risk assessment of flood disaster was obtained objectively through the entropy weight method, and the entropy weight table of the flood disaster risk assessment index of the Anyang region was obtained. Table 4 shows the proportion weighting of indicators U1–U9 in this study, and it can be seen that the weighting values for each indicator do not significantly differ. Among them, the weight of precipitation indicator U3, per capita income U6 and proportion of cultivated land and forest land U7 are larger than other factors, which are the three factors that have the greatest impact on the risk assessment of flood disaster.
3.3. Construction of Flood Disaster Risk Evaluation Model Based on Emergy and Cloud Model
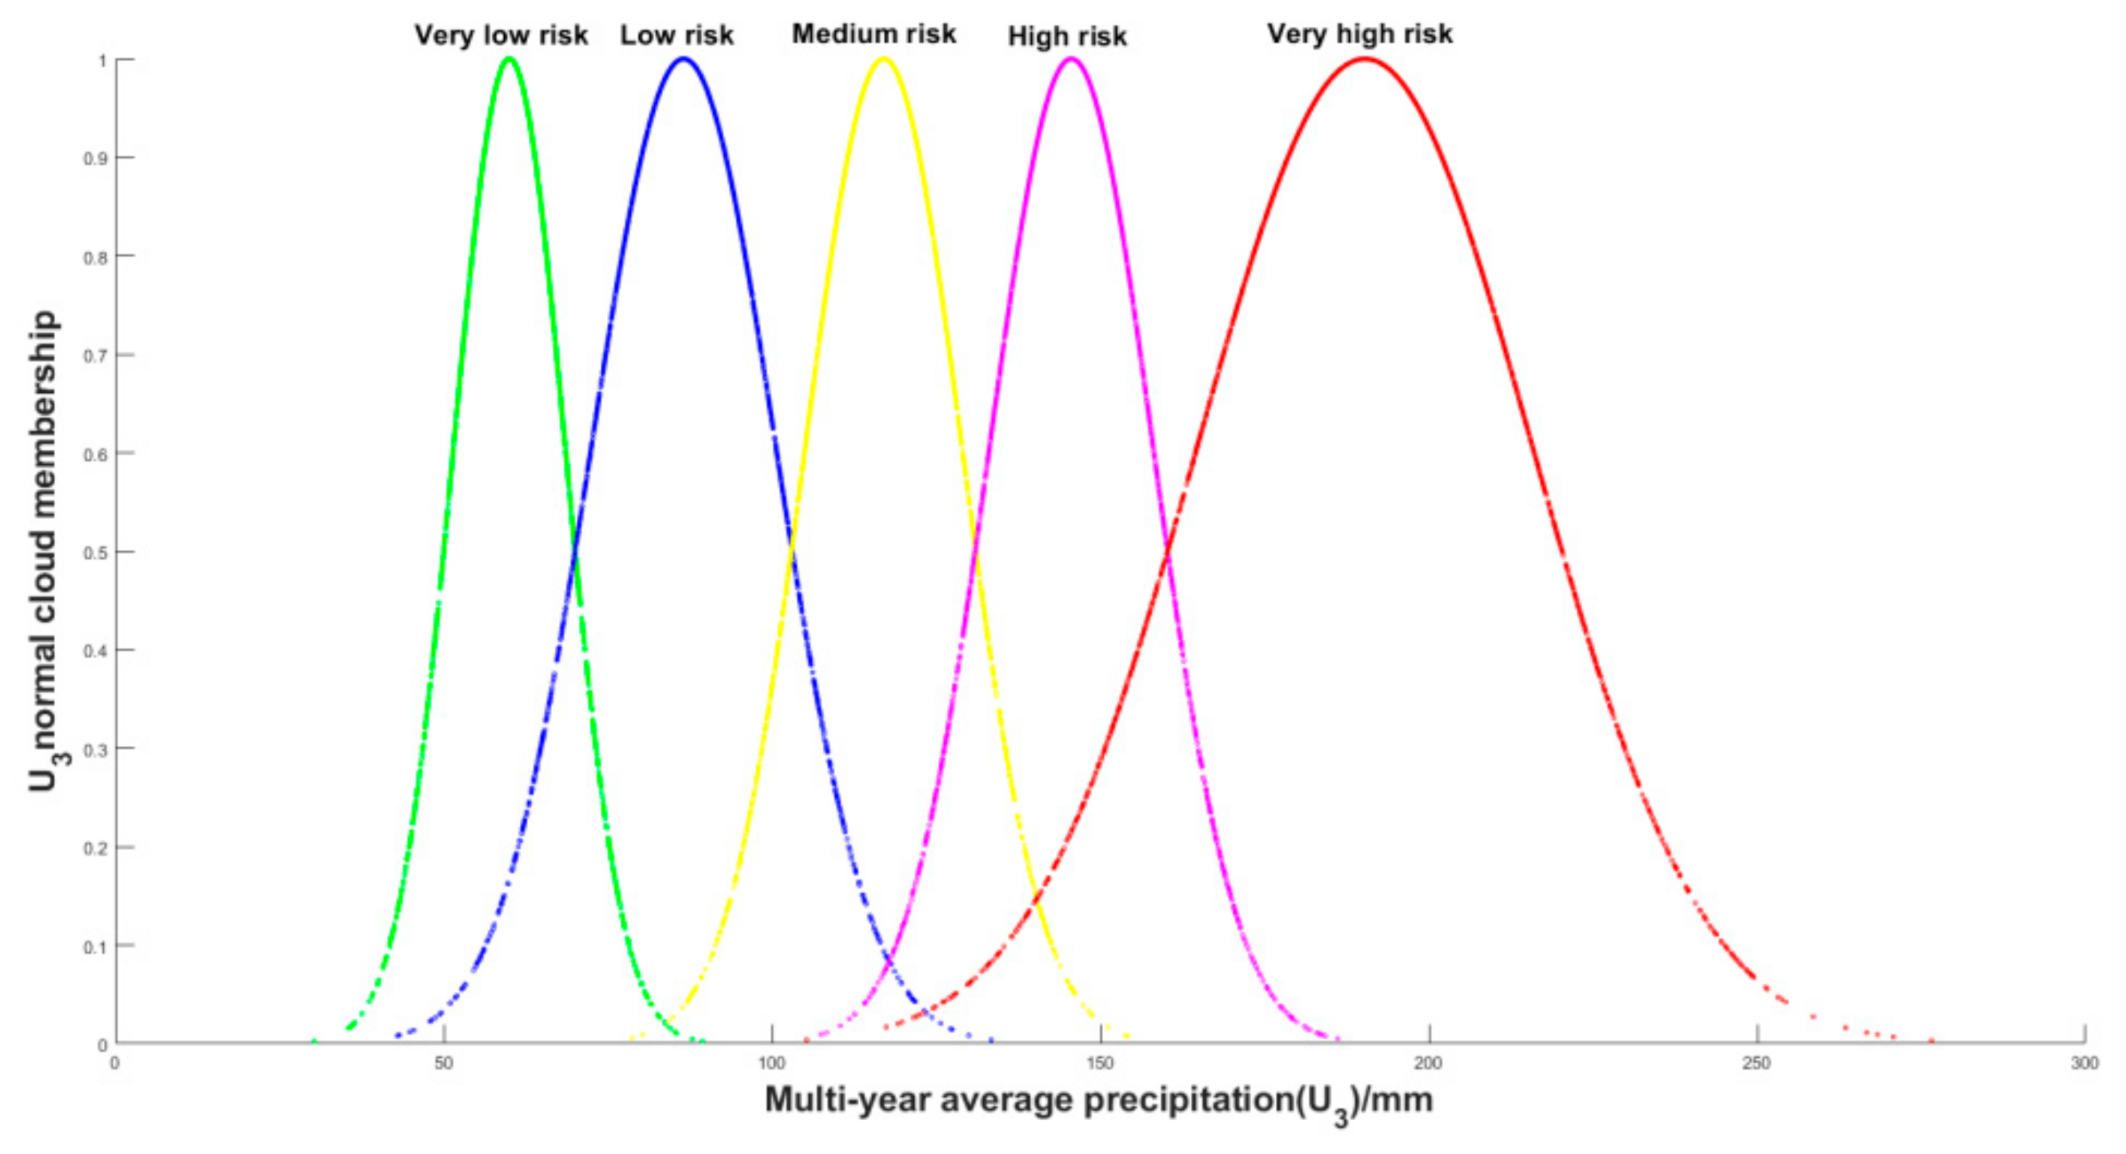
On the basis of the flood disaster risk assessment index system standards depicted in Table 5, the flood disaster cloud model index of Anyang region is constructed, as shown in Table 6. The three indicators in Table 6 are the positive expected values Ex, entropy value (En) and He. The expected value Ex represents the central value of this qualitative concept; entropy (En) is the measure of the fuzzy degree of the qualitative concept, and super-entropy He is the entropy of En and the measure of the uncertainty of the expected value Ex. It is determined by the randomness and fuzziness of entropy, and reflects the degree of dispersion of cloud droplets. Taking the evaluation index precipitation U3 as an example, the cloud drop calculation was repeated 2000 times in Matlab 2018a to construct the normal cloud membership function model. In Figure 5, from left to right, are very low risk, low risk, medium risk, high risk and very high risk curves. It well reflects the distribution characteristics of the normal cloud of the model and accords with the membership function of the normal cloud.
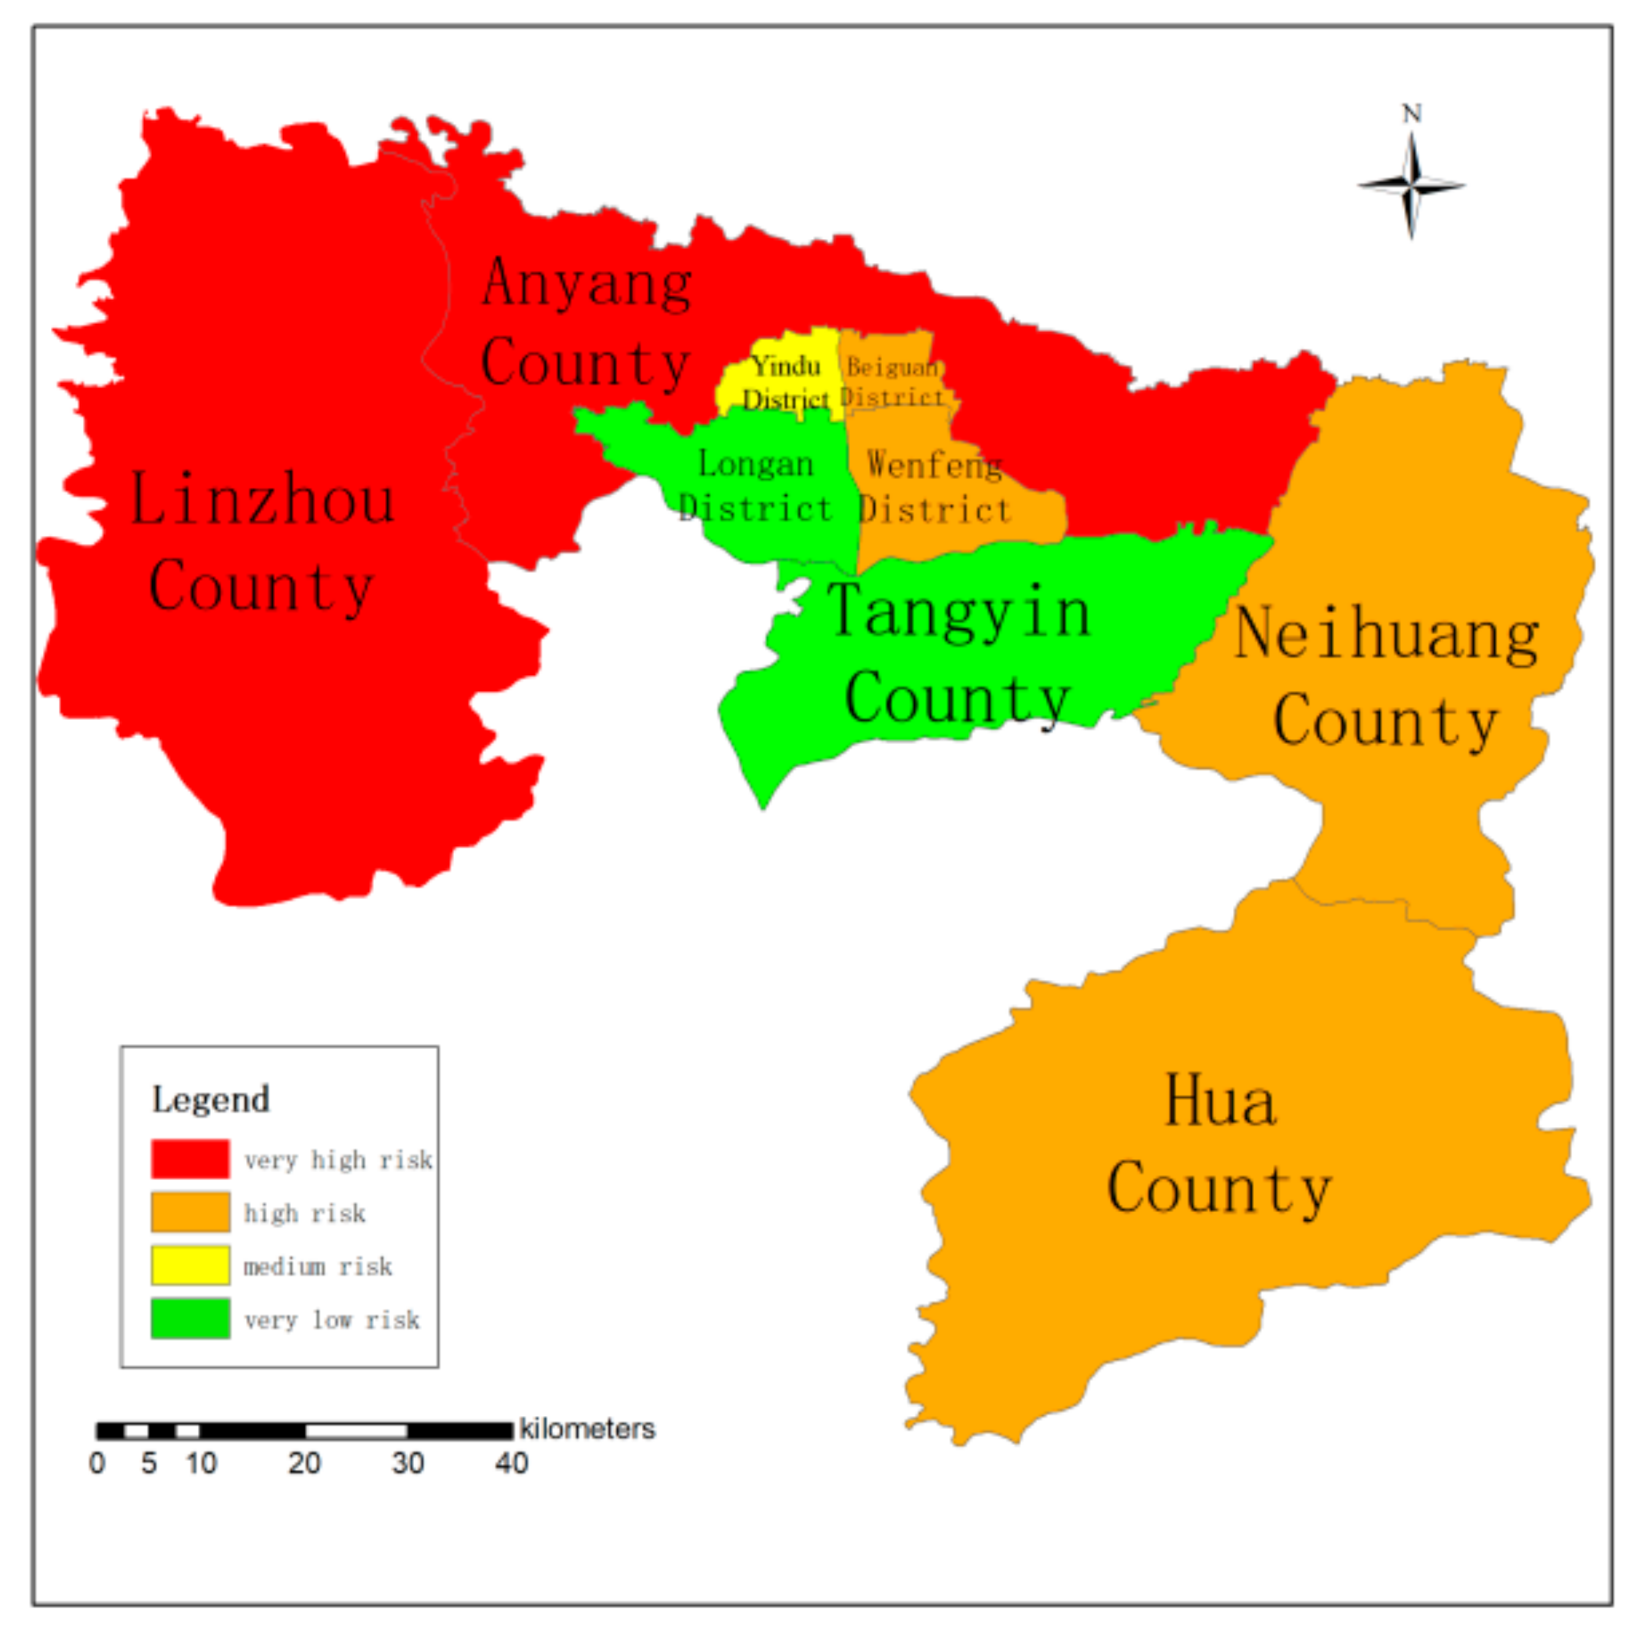
Based on the results of the emergy conversion and entropy weight method, a flood hazard risk assessment model was constructed. According to the number of grids, in order to classify the risk levels of various regions in detail, this paper divides the risk levels of cloud model flood disaster into five risk levels: very low risk, low risk, medium risk, high risk and very high risk. According to the established normal cloud model of flood risk assessment in the Anyang region, the membership degree of flood risk of each county in the Anyang region is calculated by bringing the historical data of each region into the model. Fuzzy mathematics is a mathematical method used to study the law of quantity change which belongs to uncertainty and has fuzziness. The membership degree of the cloud model studied in this paper belongs to a kind of fuzzy mathematics set. Therefore, combining the membership degree U of the Anyang region with the entropy weight W of each index, the fuzzy mathematical transformation method is used to obtain the fuzzy grade B. According to the principle of maximum membership degree, the corresponding grade of the maximum membership degree is used as the flood risk evaluation result of each county in the Anyang region, and the evaluation table of flood risk grade of each county in Anyang region is obtained, as shown in Table 7. The risk level data for each county and district in the Anyang region were incorporated into ArcGIS for processing and analysis, and the risk distribution map of flood disaster in Anyang was obtained. As shown in Figure 6, the distribution of flood disasters in the Anyang region can be clearly seen.
This assessment follows the principle of the highest risk membership. For example, the highest membership degree—very high—risk level in Linzhou City is 0.41, which is significantly higher than the other membership degrees. So, it is considered that the risk level of flood disaster in Linzhou City is very high. According to the risk assessment results, Linzhou District and Anyang County were rated as having a very high risk of flood disaster, while Hua District, Neihuang District, Wenfeng District and Beiguan District were rated as high risk, Yindu district as medium risk, and Longan District and Tangyin District as low risk. The corresponding evaluation results of this model are shown in Figure 7, where the nodes and the relationship between nodes and their corresponding states are clearly presented. From this figure, the flood hazard assessment models can be divided into four groups, each of which is represented by different colors. The white node represents “flood”, in which the flood risk level is classified according to the possibility of flood. Different colors represent different disaster risk levels. The red color represents areas of high risk, with the very high risk affiliation of Anyang County accounting for 39%. Orange indicates the high-risk areas, including Wenfeng District, Beiguan District, Slide County and Neihuang County. Yellow represents the medium flood risk areas and green represents the low flood risk areas. Moreover, each evaluation area box contains information on the results of the risk evaluation, converting the membership of the respective risk level into a percentage representation. Taking Linzhou City as an example, the probability of a high risk flood is 50.2%, and the probability of a low risk flood is 29.4%. Other areas are also defined in this way.
4. Discussion
4.1. Model Performance
The results of the risk assessment for flood disasters are verified by a comparison with the actual historical flood data. Historically, the Anyang region has experienced several major flood disasters. It is difficult to study the damage data of the disastrous flood process because of the lack of detailed data. This study attempted to collect the flood loss data of the event on 19 July 2016, which closely reflects the current economic and social situation of the region, in order to verify our results.
On 19 July 2016, the Anyang region was hit by a massive rainstorm, which affected 87 towns and townships in nine counties and districts within the jurisdiction. This affected an area of 54,600 hectares of crops, and a population of 782,600, resulting in the deaths of 19 people and nine people being classed as missing. A total of 35,678 houses collapsed, 84 trunk road bridges and culverts were washed away, 99 power supply lines were interrupted, more than 200 km of high and low voltage lines were broken, and the urban water flood area was 68.5 km2 [31]. The direct economic loss to the area was about USD 700 million. See Table 8 for the specific loss situation. In this study, only the direct loss caused by the flood disaster was counted. In the production and life after the flood, the losses suffered by cities are temporarily difficult to measure on an economic scale. In this flood disaster, Linzhou and Anyang County losses were more serious than other areas. The cause of the flood disaster was continuous heavy rain which lasted for many days, causing the water level of the local reservoir to surge. Anyang County is located in the lower reaches of Linzhou City plain area; the territory of the most important river for the Anyang River, with a length of 164 km2. The flood control standard of the Anyang region is once in every 100 years, but the flood control level of the urban section of the Anyang River has only reached the standard of once every 50 years, so the planning and maintenance of the river flood control works require further strengthening. Moreover, Linzhou City is close to the Taihang Mountains. The average elevation of the Taihang Mountains is about 1200 m, while Anyang County is a plain area with an average elevation of only 70 m. The varied topography has a great impact on the formation of floods. The torrential rain center is located in the eastern part of Linzhou City and the western part of Anyang County, with an average rainfall of 225.3 mm. The rainfall corresponds to the high-risk grade interval of U3 membership, verifying the accuracy and rationality of the hazard factors. The example shows that Linzhou City and Anyang County are the major flood disaster areas, which coincide with the geographical location of the risk assessment map of the flood disaster, ensuring the risk of flood disaster within the predictable range, and proving the rationality of the index selection. On the whole, the prediction matches the actual flood disaster situation, which represents the actual situation of the region. Therefore, the model established in this paper can effectively predict the risk of flood disaster and provide a new way of thinking for the risk assessment of flood disasters.
4.2. Flood Hazard Risk Assessment and Analysis
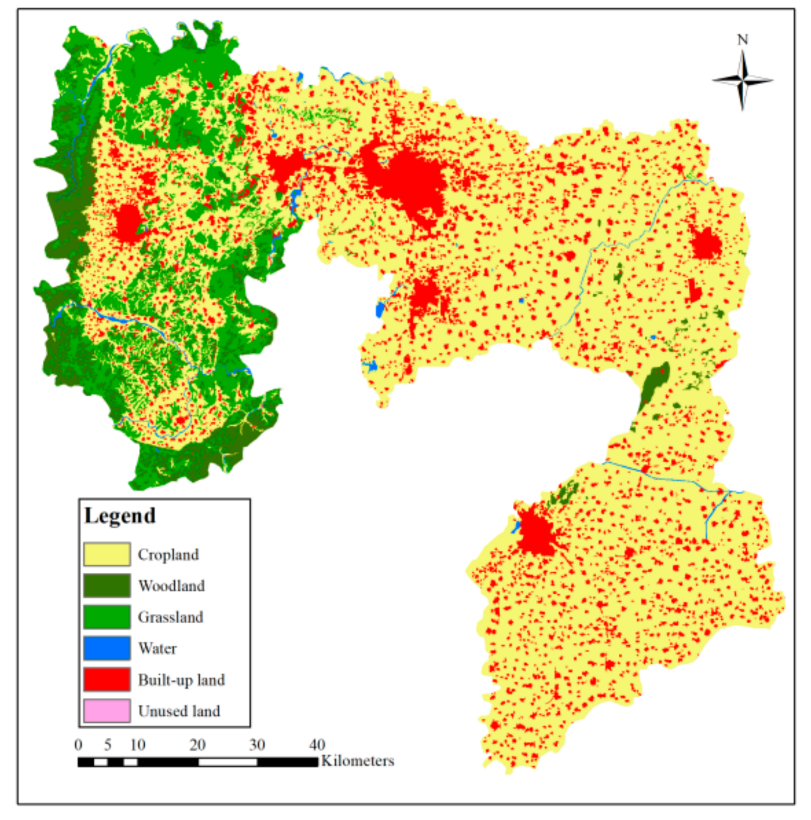
As a part of this research, the flood disaster evaluation results were analyzed. As can be seen from Figure 4b, the west of Linzhou City is close to the Taihang Mountains and the terrain changes greatly, resulting in the terrain being high in the northwest and low in the southeast. The overall elevation of Linzhou County is two to three times that of the rest of the Anyang region. Therefore, elevation is the main factor that causes the very high flood disaster risk in this region, and the wide ranging terrain has a great impact on the flood disaster in this region, accounting for about 50% of the risk. Although forestland occupies a relatively large area—which reduces the threat of flood to a certain extent—due to the terrain, once a flood occurs, landslides, debris flow and other disasters will also then easily occur, causing greater casualties and economic losses. Anyang county (The red area in Figure 5) is located in the plain area, which is the area where 30% of the population of the region is concentrated. Additionally, this area acts as the buffer area of Linzhou County, as shown in Figure 8. Compared with Linzhou County, the area of land occupied by woodland is 60% lower, but the population density is greatly increased. Therefore, this area will face the direct impact of the flood zone; once a flood occurs, there will be a great number of casualties in this area. Therefore, Linzhou County and Anyang County are in the risk assessment grouping of very high risk level. According to the findings of this study, the population and property distribution densities of Hua County, Neihuang County, Wenfeng district and Beiguan district are relatively high, which are the core urban areas of the city. The developed urban agglomeration has 70% of the industry cluster in this region, and the urban–rural development area is about twice as big as other regions. Since 2012, the planning of the Anyang New District has developed rapidly. Due to the rapid development of urbanization, the former farmland and grassland in the permeable layer have been largely replaced by concrete streets and houses, and the wetland has been gradually reduced. In the season of frequent rainstorms, due to the increase in the impermeable layer, surface runoff gathers rapidly, which accelerates the formation time of flood peak to a certain extent. Therefore, when the region faces moderate rain or above, the formation of water accumulation points easily occurs, which is also an important reason for the frequent occurrence of floods in this region. As can be seen from Figure 4c, in the face of flood disaster, these factors will cause a large direct economic loss. Moreover, after a flood, urban productive life and other economic activities are affected, and the indirect losses caused by the flood disaster are greater and last longer. Therefore, the flood disaster risk rating in these areas is high risk. In Wendu District, Longan County, Tangyin County and other areas, the distribution of personnel and property is relatively dispersed, most of which are plain areas, and cultivated land covers a relatively large area, accounting for about 30%. Therefore, the flood control pressure in these areas is relatively small, and the flood risk assessment grade is relatively low. However, farmland hydraulic engineering construction still needs to continue. Irrigation and water conservancy facilities, such as quickly discharging floods into the river, can play a positive role in flood control safety.
According to the results of this study, it is necessary to carry out targeted planning in this region. For the high-risk areas of Linzhou County and Anyang County, we should make good preparations for flood control, implement plans for hydraulic engineering projects with the help of favorable terrain, strengthen the monitoring of the local water level, and make long-term effective hydrological forecasts. These are key to reducing losses to floods. In the urban areas with higher risk levels, primarily in the central region, not only does the occurrence of precipitation need to be predicted, but scientific planning is also needed. For example, scientific planning changes the land use, increases the proportion of park and wetland areas to conserve water, and provides other effective measures for flood control and water formation. At the same time, a multidisciplinary approach and advanced urban planning methods can be applied. For example, green roofs should be allowed, impermeable areas should be reduced, and new highly permeable materials should be used to effectively increase the infiltration rate of road surfaces. Reasonable and systematic engineering planning, high design standards in key areas of engineering construction and emergency plans reduce the threat of mountain floods to urban areas. If targeted measures are actively implemented and all departments cooperate with each other to carry out flood prevention and early warning work, the risk levels in the regions can be reduced, which will support larger populations and industrial planning and promote the sustainable and effective development of the local economy. At the same time, strengthening reasonable planning, reducing the direct connection of impermeable areas for drainage pipe networks, extending the confluence time and strengthening the construction of flood control measures can also fundamentally reduce the hazard risk posed by floods.
4.3. Advantages and Limitations
In recent years, some experts have applied the theory of emergy management to the assessment of flood vulnerability. For example, Chang et al. [32] combined emergy evaluation with the vulnerability of flood disaster, and proposed a new flood disaster evaluation method with emergy evaluation as the evaluation result. The method holds that emergy evaluation originated from the theory of ecological economics, which can evaluate the ecological and economic value of water resources and enrich the value theory of water resources. In this method, the emergy evaluation theory is applied to the risk of flood disaster, and the emergy evaluation is used as a unified measurement scale. However, although being value-oriented can make the impact factors more relatable, we found that this strategy cannot fully describe the relationship between the impact factors of a flood disaster. In addition, using emergy evaluation to analyze flood disasters will lead to ecological evaluation results and increase the uncertainty of prediction. Consequently, this paper proposes a flood disaster evaluation model which combines the cloud model with emergy evaluation. Among the various flood risk assessment methods, more influencing factors can be considered by using the emergy value. The cloud model, as an advanced mathematical model, reveals the inherent relationship between randomness and fuzziness. Meanwhile, the cloud model can transform such uncertainty and increase the reliability of prediction. Therefore, the application of emergy value and the cloud model to flood risk assessment in this paper can more accurately forecast the risk of continuous flood disasters.
Although the method used in this paper can more accurately and comprehensively forecast the risk of flood disasters, many problems remain unresolved in this field of research. Moreover, the lack of data as a result of the imperfect infrastructure, brings great difficulties to this area of research. The index system in this research was constructed based on the city-nature binary system, supported by hazard factors, the disaster environment, and hazard-affected bodies, and considered the number of disaster-causing factors as much as possible. However, a small section of the data is still missing, for example, the lack of data from some hydrological stations due to the flood and the incomplete collection of indirect economic losses caused by the flood, which also increases the uncertainty of flood risk assessment. This paper uses Matlab to establish the cloud model based on historical data. With the development of times, the means of data acquisition are more diversified, which can provide new ideas and methods. In the future, combining high-quality big data with urban flood risk assessments can further expand the research scope of disaster causing factors. How to obtain high quality data will be a key problem in future flood risk research.
5. Conclusions
In this paper, a new method for the assessment of flood disasters is proposed, which introduces the emergy evaluation theory of ecological economics and the cloud model into the flood disaster risk assessment. By using the emergy evaluation, the flood disaster risk factors were converted into emergy units that could be measured, the flood disaster risk assessment scale was established, and the cloud model flood disaster risk assessment model was established. The model was used to evaluate the risk level of Anyang City. The results show that the flood disaster risk levels of Linzhou City and Anyang County are very high, and the probability of very high risk is more than 40%. Huaxian County, Neihuang County, Wenfeng District and Beiguan District have high risk levels. The risk level of flood disaster in Longan District and Tangyin County is low. Through reasonable urban planning, the role of the buffer zone in the suburban county will be brought into play to maintain the normal operation of the local economy and society to the maximum extent.
Compared with historical cases, the results of this evaluation basically match the distribution of high risk areas and disaster situations, which verifies the rationality of the selected indicators and the accuracy of the results, and can better reveal the disaster situations of local flood disasters. The analysis of the results shows that the high risk level of Linzhou County and Anyang County has the great correlation with the local steep terrain and concentrated rainfall, while other areas are related to the local urbanization speed and population density. Compared with the traditional flood risk assessment methods, the flood risk assessment based on emergy evaluation and the cloud model can better quantify the flood disaster and optimize the decision-making method. The results of this study can be used to help the Anyang region allocate flood control resources more effectively, help strengthen flood control management, and minimize the harm caused by flood disasters. In other urban areas, the model can be modified and applied to provide methods and ideas for flood control in other cities.
Author Contributions
This paper was completed by collaboration among all authors. Conceptualization, Z.W. and Y.C.; data curation, Z.W., Y.C. and Y.G.; formal analysis, Z.W. and Y.C.; funding acquisition, Z.W.; investigation, Z.W. and Y.G.; methodology, Y.C.; writing for the original draft, Y.C.; writing for review and editing, Z.W., Y.C., Y.G. All authors have read and agreed to the published version of the manuscript.
Funding
This research was funded by the National Natural Science Foundation of China (NO. 51739009).
Institutional Review Board Statement
Not applicable.
Informed Consent Statement
Informed consent was obtained from all subjects involved in the study.
Data Availability Statement
The data presented in this study are available in article.
Conflicts of Interest
The authors declare there is no conflicts of interest regarding the publication of this paper.
References
- Chen, Y.; Liu, R.; Barrett, D.; Gao, L.; Zhou, M.; Renzullo, L.J.; Emelyanova, I. A spatial assessment framework for evaluating flood risk under extreme climates. Sci. Total Environ. 2015, 538, 512–523. [Google Scholar] [CrossRef]
- El Karim, A.A.; Gaber, A.F.D. Flood Risk Assessment of the Wadi Nu’man Basin, Mecca, Saudi Arabia (During the Period, 1988–2019) Based on the Integration of Geomatics and Hydraulic Modeling: A Case Study. Water 2019, 11, 1887. [Google Scholar] [CrossRef] [Green Version]
- Lyu, H.-M.; Sun, W.-J.; Shen, S.-L.; Arulrajah, A. Flood risk assessment in metro systems of mega-cities using a GIS-based modeling approach. Sci. Total Environ. 2018, 626, 1012–1025. [Google Scholar] [CrossRef]
- Garrido, J.; Requena, I.; Mambretti, S. Semantic model for flood management. J. Hydroinform. 2012, 14, 918–936. [Google Scholar] [CrossRef] [Green Version]
- Shi, J.; Cui, L.; Tian, Z. Spatial and temporal distribution and trend in flood and drought disasters in East China. Environ. Res. 2020, 185, 109406. [Google Scholar] [CrossRef]
- Kekez, T.; Knezić, S.; Andričević, R. Incorporating Uncertainty of the System Behavior in Flood Risk Assessment—Sava River Case Study. Water 2020, 12, 2676. [Google Scholar] [CrossRef]
- Darabi, H.; Choubin, B.; Rahmati, O.; Haghighi, A.T.; Pradhan, B.; Kløve, B. Urban flood risk mapping using the GARP and QUEST models: A comparative study of machine learning techniques. J. Hydrol. 2019, 569, 142–154. [Google Scholar] [CrossRef]
- Chen, J.; Hill, A.A.; Urbano, L.D. A GIS-based model for urban flood inundation. J. Hydrol. 2009, 373, 184–192. [Google Scholar] [CrossRef]
- Li, W.; Lin, K.; Zhao, T.; Lan, T.; Chen, X.; Du, H.; Chen, H. Risk assessment and sensitivity analysis of flash floods in ungauged basins using coupled hydrologic and hydrodynamic models. J. Hydrol. 2019, 572, 108–120. [Google Scholar] [CrossRef]
- Merwade, V.; Cook, A.; Coonrod, J. GIS techniques for creating river terrain models for hydrodynamic modeling and flood inundation mapping. Environ. Model. Softw. 2008, 23, 1300–1311. [Google Scholar] [CrossRef]
- Ciullo, A.; De Bruijn, K.; Kwakkel, J.; Klijn, F. Systemic Flood Risk Management: The Challenge of Accounting for Hydraulic Interactions. Water 2019, 11, 2530. [Google Scholar] [CrossRef] [Green Version]
- Song, T.; Cai, J.-M.; Chahine, T.; Xu, H.; Niu, F.-Q. Modeling urban metabolism of Beijing city, China: With a coupled system dynamics: Emergy model. Stoch. Environ. Res. Risk Assess. 2013, 28, 1511–1524. [Google Scholar] [CrossRef]
- Xu, G.; Huang, G.Q.; Fang, J. Cloud asset for urban flood control. Adv. Eng. Inform. 2015, 29, 355–365. [Google Scholar] [CrossRef]
- Glenis, V.; McGough, A.S.; Kutija, V.; Kilsby, C.; Woodman, S. Flood modelling for cities using Cloud computing. J. Cloud Comput. 2013, 2, 7. [Google Scholar] [CrossRef] [Green Version]
- Miao, L.F. Analysis and Reflection on the severe Rainstorm and Flood disaster in Anyang on 19 July 2016. China Water Con-Servancy 2017, 13, 7–8. (In Chinese) [Google Scholar]
- Jiao, S.X.; Yuan, C.H.; Li, Y. Study on the impact of urban economic development on flood disaster bearing capacity—A case study of anyang city, henan province. Water Soil Conserv. Res. 2014, 21, 311–315. (In Chinese) [Google Scholar] [CrossRef]
- Liu, D.L. Flood Risk assessment in Henan Province based on GIS. Water Soil Conserv. Bull. 2014, 3403, 126–129. (In Chinese) [Google Scholar] [CrossRef]
- Odum, H.T. Scales of ecological engineering. Ecol. Eng. 1996, 6, 7–19. [Google Scholar] [CrossRef]
- Aghbashlo, M.; Rosen, M.A. Consolidating exergoeconomic and exergoenvironmental analyses using the emergy concept for better understanding energy conversion systems. J. Clean. Prod. 2018, 172, 696–708. [Google Scholar] [CrossRef]
- Li, D.Y.; Li, C.Y. Study on the Universality of the Normal Cloud Model. China Eng. Sci. 2004, 6, 28–34. (In Chinese) [Google Scholar] [CrossRef]
- Zhu, Y.; Huang, S.; Chang, J.; Leng, G. Spatial–temporal changes in potential evaporation patterns based on the Cloud model and their possible causes. Stoch. Environ. Res. Risk Assess. 2016, 31, 2147–2158. [Google Scholar] [CrossRef]
- Zhang, L.; Wu, X.; Chen, Q.; Skibniewski, M.J.; Zhong, J. Developing a cloud model based risk assessment methodology for tunnel-induced damage to existing pipelines. Stoch. Environ. Res. Risk Assess. 2015, 29, 513–526. [Google Scholar] [CrossRef]
- Wan, Z.; Hong, Y.; Khan, S.; Gourley, J.; Flamig, Z.L.; Kirschbaum, D.; Tang, G. A cloud-based global flood disaster community cyber-infrastructure: Development and demonstration. Environ. Model. Softw. 2014, 58, 86–94. [Google Scholar] [CrossRef] [Green Version]
- Zou, Z.-H.; Yun, Y.; Sun, J.-N. Entropy method for determination of weight of evaluating indicators in fuzzy synthetic evaluation for water quality assessment. J. Environ. Sci. 2006, 18, 1020–1023. [Google Scholar] [CrossRef]
- Xu, H.; Ma, C.; Lian, J.; Xu, K.; Chaima, E. Urban flooding risk assessment based on an integrated k-means cluster algorithm and improved entropy weight method in the region of Haikou, China. J. Hydrol. 2018, 563, 975–986. [Google Scholar] [CrossRef]
- Yang, Y.Q. On the Utilization of flood resources in Anyang City. J. Anyang Norm. Univ. 2002, 2, 95–97. (In Chinese) [Google Scholar] [CrossRef]
- Deng, W.; Zhou, J.; Zou, Q.; Zhang, Y.; Hua, W. Improved Flood Disaster Assessment Method Based on Cloud Model and Fuzzy Certainty Degree. Inf. Technol. J. 2013, 12, 2064–2068. [Google Scholar] [CrossRef] [Green Version]
- Jia, J.; Wang, X.; Hersi, N.A.M.; Zhao, W.; Liu, Y. Flood-Risk Zoning Based on Analytic Hierarchy Process and Fuzzy Variable Set Theory. Nat. Hazards Rev. 2019, 20, 04019006. [Google Scholar] [CrossRef]
- Anyang Statistics Department. Anyang Statistical Yearbook 2000–2017; China Statistical Publishing House: Beijing, China, 2018. [Google Scholar]
- Ministry of Water Resources. China Water Resources Statistical Yearbook 2000–2017; China Statistical Publishing House: Beijing, China, 2018. [Google Scholar]
- Li, L.L.; Dong, Y.M. Henan: Scientific Defense against heavy Rainstorm and Flood on July 19. Henan Water Conserv. South-To-North Water Divers. Proj. 2016, 8, 1–2. (In Chinese) [Google Scholar]
- Chang, L.-F.; Huang, S.-L. Assessing urban flooding vulnerability with an emergy approach. Landsc. Urban Plan. 2015, 143, 11–24. [Google Scholar] [CrossRef]
Figure 1.
Cloud model characteristic curve.

Figure 2.
Geographical location and specification of the study area.

Figure 3.
River network of Anyang Region.

Figure 4.
The collection and processing data related to flood disasters: (a) Monthly average precipitation (mm); (b) Elevation; (c) Per unit GDP; (d) Population density; (e) Flood control structures compliance rate.
Figure 4.
The collection and processing data related to flood disasters: (a) Monthly average precipitation (mm); (b) Elevation; (c) Per unit GDP; (d) Population density; (e) Flood control structures compliance rate.

Figure 5.
Hazard factor U3 normal cloud membership function.

Figure 6.
Distribution map of flood disaster risk assessment in Anyang Region.

Figure 7.
Flood disaster risk evaluation model based on emergy theory and cloud models.

Figure 8.
The land use coverage map of Anyang city.


Table 1.
Solar emergy conversion rate of the main emergy substance table.
| Name | Unit | Emergy Conversion Rate | Name | Unit | Emergy Conversion Rate |
|---|---|---|---|---|---|
| Solar emergy | sej/J | 1 | The topsoil loses emergy | sej/J | 6.25 × 10⁴ |
| Wind power | sej/J | 6.23 × 10² | Soil dissipation emergy | sej/J | 1.70 × 10⁹ |
| The rain chemical emergy | sej/J | 1.54 × 10⁴ | wood emergy | sej/J | 3.49 × 10⁴ |
| Rainwater potential emergy | sej/J | 8.89 × 10³ | peat emergy | sej/J | 3.20 × 10⁴ |
| Wave emergy | sej/J | 3.00 × 10⁴ | sandstone emergy | sej/J | 1.00 × 10⁹ |
| Tidal power | sej/J | 1.70 × 10⁴ | grain emergy | sej/J | 8.30 × 10⁵ |
| River chemical emergy | sej/J | 4.1 × 10⁴ | wheat emergy | sej/J | 6.80 × 10⁴ |
| Earth cycle emergy | sej/J | 2.90 × 10⁴ | vegetables emergy | sej/J | 2.70 × 10⁴ |
| Thermal electricity | sej/J | 1.59 × 10⁵ | meat emergy | sej/J | 1.7 × 10⁶ |
Table 2.
Flood disaster assessment index system of the Anyang Region.
| Category | The Evaluation Index | Serial Number |
|---|---|---|
| Disaster environment | Elevation/m | U1 |
| Elevation standard deviation/m | U2 | |
| Hazard factors | Multi-year average precipitation/mm | U3 |
| Maximum monthly rainfall/mm | U4 | |
| Hazard-affected bodies | Population density/(person/) | U5 |
| Per capita income/(USD/person) | U6 | |
| Proportion of cultivated land and forest land/% | U7 | |
| Proportion of urban construction and hydraulic engineering land/% | U8 | |
| The proportion of urban land use/% | U9 |
Table 3.
Emergy conversion of different risk factors.
| Region | Linzhou County | Anyang County | Longan District | Yindu District | Wenfeng District | Beiguan District | Hua County | Neihuang County | Tangyin County |
|---|---|---|---|---|---|---|---|---|---|
| Arable land (Ten thousand m2) | 58,950 | 72,184 | 12,829 | 2085 | 7075 | 1280 | 133,167 | 74,206 | 47,002 |
| Emergy (108 sej) | 7.25 | 8.88 | 1.58 | 0.26 | 0.87 | 0.16 | 16.38 | 9.13 | 5.78 |
| Woodland (Ten thousand m2) | 54,409 | 10,014 | 162 | 53 | 25 | 21 | 6555 | 15,028 | 540 |
| Emergy (108 sej) | 32.86 | 6.05 | 0.1 | 0.03 | 0.02 | 0.01 | 3.96 | 9.08 | 0.33 |
| Urban and rural construction land (Ten thousand m2) | 19,070 | 17,586 | 6227 | 3900 | 6835 | 3669 | 28,909 | 15,316 | 8736 |
| Emergy (108 sej) | 2.15 | 1.99 | 0.7 | 0.44 | 0.98 | 0.41 | 3.27 | 1.73 | 0.99 |
| Traffic water use place (Ten thousand m2) | 2228 | 2045 | 1030 | 377 | 1048 | 382 | 3045 | 15,316 | 1600 |
| Emergy (108 sej) | 0.63 | 0.58 | 0.29 | 0.11 | 0.3 | 0.11 | 0.86 | 0.71 | 0.45 |
| Land for flood control structures (Ten thousand m2) | 1010.2 | 1015.7 | 978.3 | 223.3 | 835.9 | 885.5 | 1349.2 | 1346.1 | 690.8 |
| Emergy (108 sej) | 1.27 | 1.27 | 0.72 | 0.58 | 1.24 | 0.52 | 0.97 | 0.79 | 0.67 |
| elevation (m) | 500.01 | 127.07 | 81.96 | 77.23 | 73.82 | 80.63 | 70.63 | 40.35 | 52.66 |
| Emergy (108 sej) | 0.75 | 0.19 | 0.12 | 0.12 | 0.11 | 0.12 | 0.11 | 0.06 | 0.08 |
| The population density (person/km2) | 52.97 | 38.09 | 122.41 | 136.06 | 94.36 | 122.49 | 59.26 | 53.67 | 48.37 |
| Emergy (108 sej) | 0.71 | 0.51 | 1.64 | 1.82 | 1.27 | 1.64 | 0.79 | 0.72 | 0.65 |
| GDP per capita (dollars) | 444.8 | 273.59 | 872.12 | 830.84 | 605.01 | 769.99 | 878.14 | 267.99 | 531.1 |
| Emergy (108 sej) | 1.04 | 0.64 | 2.04 | 1.94 | 1.41 | 1.8 | 2.05 | 0.63 | 1.24 |
Table 4.
Flood Disaster Risk Assessment Entropy weights Table.
| Indicators | U1 | U2 | U3 | U4 | U5 | U6 | U7 | U8 | U9 |
|---|---|---|---|---|---|---|---|---|---|
| Entropy weight | 0.1321 | 0.0673 | 0.1538 | 0.0832 | 0.1032 | 0.1546 | 0.1524 | 0.0568 | 0.0966 |
Table 5.
Flood disaster risk assessment index system standard of Anyang City.
| Indicators | Very Low Risk | Low Risk | Medium Risk | High Risk | Very High Risk |
|---|---|---|---|---|---|
| U1 | (40, 56) | (56, 82) | (82, 156) | (156, 167) | (167, 580) |
| U2 | (2.10, 3.38) | (3.38, 12.50) | (12.503, 15.6) | (15.63, 22.75) | (22.75, 38.02) |
| U3 | (0, 20.01) | (20.01, 53.07) | (53.07, 80.92) | (80.92, 110.23) | (110.23, 170.30) |
| U4 | (10.1, 30.8) | (30.8, 75.9) | (75.9, 108.9) | (108.9, 228.8) | (228.8, 310.1) |
| U5 | (600.01, 613.58) | (613.58, 654.45) | (654.45, 685.05) | (685.05, 747.59) | (747.59, 799.99) |
| U6 | (1200, 1325) | (1325, 2113) | (2113, 2390) | (2390, 2509) | (2509, 3700) |
| U7 | (0.01, 0.07) | (0.07, 0, 25) | (0.25, 0.36) | (0.36, 0.58) | (0.58, 0.91) |
| U8 | (0.023, 0.069) | (0.069, 0.118) | (0.118, 0.187) | (0.187, 0.247) | (0.247, 0.353) |
| U9 | (0.8, 1) | (0.6, 0.8) | (0.6, 0.4) | (0.4, 0.2) | (0.2, 0.1) |
Table 6.
Flood disaster risk assessment index normal cloud standard of the Anyang Region.
| Indicators | Very Low Risk | Low Risk | Medium Risk | High Risk | Very High Risk |
|---|---|---|---|---|---|
| U1 | (48.0, 6.8, 0.05) | (69.0, 11.0, 0.05) | (119.0, 31.4, 0.05) | (161.5, 4.7, 0.05) | (373.5, 175.4, 0.05) |
| U2 | (2.7, 0.5, 0.02) | (8.0, 3.9, 0.02) | (14.1, 1.3, 0.02) | (19.2, 3.0, 0.02) | (38.4, 6.5, 0.02) |
| U3 | (10.0, 8.5, 0.02) | (36.5, 14.0, 0.02) | (67.0, 11.9, 0.02) | (95.6, 12.4, 0.02) | (140.3, 25.5, 0.02) |
| U4 | (20.45, 17.4, 0.05) | (53.35, 45.3, 0.05) | (92.4, 78.5, 0.05) | (168.9, 143.4, 0.05) | (269.5, 228.8, 0.05) |
| U5 | (606.8, 5.8, 0.05) | (634.0, 17.4, 0.05) | (669.8, 13.1, 0.05) | (716.3, 26.6, 0.05) | (773.8, 22.3, 0.05) |
| U6 | (1263, 53, 0.02) | (1719, 335, 0.02) | (2252, 119, 0.02) | (2450, 51, 0.02) | (3105, 506, 0.02) |
| U7 | (0.04, 0.03, 0.02) | (0.15, 0.13, 0.02) | (0.31, 0.26, 0.02) | (0.47, 0.40, 0.02) | (0.75, 0.63, 0.02) |
| U8 | (0.0021, 0.0018, 2) | (0.059, 0.050, 2) | (0.144, 0.122, 2) | (0.249, 0.212, 2) | (0.418, 0.355, 2) |
| U9 | (0.9, 0.764, 0.10) | (0.7, 0.594, 0.10) | (0.5, 0.425, 0.10) | (0.3, 0.255, 0.10) | (0.15, 0.127, 0.10) |
Table 7.
Flood risk assessment table of counties and districts in the Anyang Region.
| Region | Very Low Risk | Low Risk | Medium Risk | High Risk | Very High Risk | Very Low Risk |
|---|---|---|---|---|---|---|
| Linzhou County | 0.240 | 0.000 | 0.075 | 0.091 | 0.410 | Very high risk |
| Anyang County | 0.252 | 0.144 | 0.063 | 0.002 | 0.299 | Very high risk |
| Longan District | 0.423 | 0.105 | 0.088 | 0.000 | 0.109 | Very low risk |
| Yindu District | 0.155 | 0.001 | 0.198 | 0.121 | 0.122 | Medium risk |
| Wenfeng District | 0.160 | 0.000 | 0.049 | 0.214 | 0.126 | High risk |
| Beiguan District | 0.175 | 0.000 | 0.067 | 0.198 | 0.134 | High risk |
| Hua County | 0.017 | 0.149 | 0.035 | 0.269 | 0.114 | High risk |
| Neihuang County | 0.009 | 0.000 | 0.025 | 0.290 | 0.202 | High risk |
| Tangyin County | 0.177 | 0.096 | 0.096 | 0.143 | 0.127 | Very low risk |
Table 8.
Anyang Region flood disaster loss situation table in 2016.
| Region | The Affected Population (104 People) | Crop Disaster Area (km2) | Houses Collapsed (House) | Direct Economic Loss (Million Dollars) |
|---|---|---|---|---|
| Linzhou County | 25.77 | 136 | 7989 | 263.94 |
| Anyang County | 20.35 | 156 | 6466 | 233.58 |
| Longan District | 1.01 | 10 | 2013 | 29.79 |
| Yindu District | 4.20 | 23 | 3015 | 62.60 |
| Wenfeng District | 2.50 | 31 | 2985 | 83.04 |
| Beiguan District | 4.30 | 40 | 2756 | 81.89 |
| Hua County | 10.32 | 70 | 4032 | 120.03 |
| Neihuang County | 7.80 | 50 | 4385 | 105.92 |
| Tangyin County | 2.01 | 0.20 | 2037 | 51.52 |
Publisher’s Note: MDPI stays neutral with regard to jurisdictional claims in published maps and institutional affiliations. |
© 2021 by the authors. Licensee MDPI, Basel, Switzerland. This article is an open access article distributed under the terms and conditions of the Creative Commons Attribution (CC BY) license (http://creativecommons.org/licenses/by/4.0/).
Share and Cite
MDPI and ACS Style
Wu, Z.; Cui, Y.; Guo, Y. A Case Study of Flood Risk Evaluation Based on Emergy Theory and Cloud Model in Anyang Region, China. Water 2021, 13, 420. https://doi.org/10.3390/w13040420
AMA Style
Wu Z, Cui Y, Guo Y. A Case Study of Flood Risk Evaluation Based on Emergy Theory and Cloud Model in Anyang Region, China. Water. 2021; 13(4):420. https://doi.org/10.3390/w13040420
Chicago/Turabian StyleWu, Zening, Yuhai Cui, and Yuan Guo. 2021. "A Case Study of Flood Risk Evaluation Based on Emergy Theory and Cloud Model in Anyang Region, China" Water 13, no. 4: 420. https://doi.org/10.3390/w13040420
Note that from the first issue of 2016, this journal uses article numbers instead of page numbers. See further details here.