Assessing the Influence of Compounding Factors to the Water Level Variation of Erhai Lake


1
Beijing Key Laboratory of Urban Hydrological Cycle and Sponge City Technology, College of Water Sciences, Beijing Normal University, Beijing 100875, China
2
Technology Research Center of Water Science, Beijing Normal University at Zhuhai, Zhuhai 519087, China
3
Key Laboratory for Mechanics in Fluid Solid Coupling Systems, Institute of Mechanics, Chinese Academy of Sciences, Beijing 100190, China
*
Author to whom correspondence should be addressed.
Water 2021, 13(1), 29; https://doi.org/10.3390/w13010029
Submission received: 18 November 2020
/
Revised: 19 December 2020
/
Accepted: 23 December 2020
/
Published: 26 December 2020
(This article belongs to the Special Issue Climate Change Impact and Adaptation in Water Resources Management)
Abstract
:Climate change and human activities cause lake water level (WL) fluctuations to exceed natural thresholds, with implications for the available water resources. Studies that explore WL change trends and the main driving forces that affect water level changes are essential for future lake water resource planning. This study uses the Mann–Kendall trend test method to explore the WL fluctuations trend and WL mutation in Erhai Lake (EL) during 1990–2019 and explore the main driving factors affecting water level changes, such as characteristic WL adjustments. We also use the principal component analysis to quantify the contribution of compound influencing factors to the water level change in different periods. The results showed that the WL rose at a rate of 47 mm/a during 1990–2019 but was influenced by the characteristic WL adjustment of EL in 2004 and the WL mutation in 2005. In 1990–2004, the WL showed a downtrend caused by the increase in water resource development and utilization intensity, and in 2005–2019, the WL showed an uptrend caused by the combined decrease in evaporation, outflow, and the increase in water supply for water conservancy projects. Additionally, the largest contributions of outflow to WL change were 19.34% and 21.61% in 1990–2019 and 1990–2004, respectively, while the largest contribution of cultivated area to WL change was 20.48% in 2005–2019, and it is worth noting that the largest contribution of climate change to WL change was 40.35% in 2013–2019. In the future, under the increase in outflow and evaporation and the interception of inflow, the WL will decline (Hurst exponent = 0.048). Therefore, planning for the protection and management of lakes should consider the impact of human activities, while also paying attention to the influence of climate change.

1. Introduction
Lakes, as the most important part of the freshwater ecosystem on earth [1], provide the necessary ecological resources for the development of human society [2,3,4]. However, in recent years, due to the combined effects of climate change and human activities, the water balance of lakes has changed, and some lakes have continued to experience water level (WL) declines, as well as declines in water storage and catchment areas, which have seriously affected the hydrological process of lakes [5,6]. Lakes can also influence climate change through the carbon cycle, it is a reversible process [7]. What is more, precipitation [8], evaporation [9] and water fluxes by groundwater or surface water plus surrounding land use as well as teleconnections [10,11] play a more well-defined role than “climate” in general. It is very important to monitor lake water resource protection, WL operation, and assessment the influence of compounding factors to the water level variation.
The WL is an intuitive indicator reflecting a lake’s water condition and is not only an important factor affecting the lake ecosystem but also affects lake ecological processes such as nutrient cycling and water layering [12,13], and it can affect the sustainable development of society and economy [14]. Therefore, the WL and its changes in a lake are crucial to the safety and health of the lake ecosystem [15].Currently, the problem of WL fluctuation exceeding the natural change threshold is common in Chinese lakes, and lake managers have also proposed corresponding protection strategies for this question. For example, Poyang Lake, the largest fresh water lake in China, was affected by the decrease inflow and the water regime of the mainstream of the Yangtze River, which caused the WL drop. To alleviate the WL change process, the current protection strategy includes not only reducing the impact of water conservancy and hydropower projects and reducing the water storage after flooding but also restocking water after obtaining information from the Tuolin reservoir [16]. Researchers have studied whether this water replenishment project had a negative impact on the lake water quality and [17] have shown that although the water quality of the lake is worse than the average water quality of Taihu Lake, the water diversion operation can not only accelerate the hydrodynamic cycle of the lake body, but also improve the WL of the lake. In addition, Dongting Lake, the second largest freshwater lake in China, was mainly created by the impoundment of water conservancy projects such as the Three Gorges Project [18]. To reduce the decline in lake WL, [19] a river lake model was established, the optimal operation law curve of the Three Gorges Reservoir was deduced, and the operational WL to restore the ecological balance of the lake area was adjusted. It can be seen that water replenishment projects and characteristic water level adjustments can effectively alleviate the decline in lake WL and improve regional ecological balance. Furthermore, studies have also shown that water replenishment projects can also accelerate the growth of freshwater algae. Therefore, measures to deal with lake water level exceeding the natural change threshold are of vital importance to lake managers. However, analyzing the characteristics of WL changes, grasping future development trends, and preventing and controlling possible ecological and environmental problems are the primary issues that need to be paid attention to in lake protection and management.
Furthermore, affected by the combination of climate change and human activities, the characteristics and influencing factors (climate change, runoff, and human activities) of WL changes in different types of lakes in different climate regions are quite different. The WL of Urmia Lake in northwestern Iran was mainly affected by human activities such as increased water consumption and the construction of water conservancy projects, rather than by the effects of climate change such as changes in rainfall and temperature [20], indicated that human activities were the key factors that determine the water level change of the lake, which to a certain extent masks the influence of natural factors on water level changes [21]. Additionally, the WL of Lake Ontario in North America reached a record high during the spring of 2017 because of human activities such as water management [22]. However, the changes in the WL of Lake Issyk-Kul in Kyrgyzstan and White Bear Lake in the United States were caused by the combined effects of regional precipitation and evaporation [23,24]. What is more, potential future climate change will pose a threat to water resources [25]. However, in previous studies, a large number of methods have been used to assess potential climate change, such as hydrological models [26,27] and regional climate scenario analysis [28,29,30]. They mostly have focused on the impact of climate change or human activities on lake water levels, and few studies have quantitatively analyzed the effects of compound influencing factors (precipitation, evaporation, inflow, outflow, population, and cultivated land area) on lake water levels. Therefore, in-depth analysis of the main driving factors that affect water level changes is essential for lake water environmental protection and management. In particular, quantifying the impact of compound influencing factors on lake water level changes can provide important information for lake water resources management.
Erhai Lake (EL) is the second largest plateau freshwater lake in Yunnan Province, China, and the main source of drinking water in Dali city. EL plays an important role in regional social and economic development and the coordinated construction of ecological civilization. However, EL faces the following major problems: (a) With the development of tourism and industrial and agricultural economies, the amount of water resources in EL is decreasing, and the current utilization rate of water resource development has reached 53.3%. The protection and treatment of EL is extremely unfavorable [31]. (b) In recent years, in response to the needs of ecological restoration such as the restoration of aquatic vegetation, the EL water level is generally operating at a lower level and experiences violent fluctuations [32]. At the same time, whether the WL changes will affect the lake water quality and whether the sewage treatment and interception project will affect the fluctuation of the WL have become key questions to be answered in the protection and management of EL. To answer these questions, we need to systematically analyze the change trend and influencing factors of the EL WL. Existing studies have focused on the water environment [19,33,34,35], while systematic quantitative research on the characteristics of WL changes and influencing factors has rarely been reported.
Briefly, human activities and climate change have changed the regional water cycle, combined with the impact of water resources utilization, which together lead to fluctuations in lake water levels, thereby affecting lake water quality and sustainable use of water resources. However, in contrast to the slow effect of climate change over a long time period, the impacts of human activities normally have occurred over a short time period and caused quick modification of lake hydrology [36]. Therefore, it is difficult to quantitatively distinguish the roles of these two driving factors [37]. In addition, Erhai Lake has paid attention to reducing the pollution load into the lake and improving the water quality of the lake in recent years, but it has not fully considered the impact of pollution interception projects on the water level. Therefore, the operation of the sewage interception project around the lake has also increased the complexity of water level variation, and these compound influencing factors make it more challenging to understand the background mechanism of the WL changes. Therefore, this study aims: (1) to reveal the trend and phase characteristics of the water level in EL during the past 30 years; (2) to explore the main driving forces affecting the hydrological changes of EL and the possible ecological effects; and (3) to quantify the influence of compounding influencing factors (inflow, outflow, climate change, and other human activities) on the WL changes. Finally, these results should provide support for water level management and efficient utilization of water resources in EL.
2. Materials and Methods
2.1. Study Area
Erhai Lake is located in Dali city, within the jurisdiction of Yunnan Bai Nationality Autonomous Prefecture, southwestern China (100°05′–100°17′ E, 25°36′–25°58′ N). The lake area is 252.67 km2, the lake elevation in 2016 was 1965.69 m (National Vertical Datum 1985), and the lake volume is 2.74 billion m3. The major rivers draining into the lake include the Miju River, Luoshi River, and Yong’an River in the north; the Cangshan Eighteen Stream in the west; and the Boluo River in the south. Additionally, Xi’er River is the only natural outflow river of EL (Figure 1). In addition, the EL basin has a low-latitude plateau subtropical monsoon climate, with a multiyear average temperature of 15.6 °C [38], a multiyear average precipitation of 1032 mm, and a lake surface evaporation value of approximately 1200 mm. Additionally, EL plays an important role in local economic development, and its water resources can be used for the water supply, agricultural irrigation, fisheries, tourism, and shipping. However, with population growth and rapid economic development, there have been large fluctuations in the Erhai water level in recent years, and coupled with the higher pollution load into the lake, it leads to changes in the lake landscape pattern and related ecosystem functions and services, and serious water problems have become the key obstacle challenging the protection and development of EL.
2.2. Data Sources
The data used in this study included the WL (Xia guan water level station), outflow, inflow, precipitation, evaporation, number of people in the basin, and the area of cultivated land during 1990–2019; and the hydrometeorological data time step is the annual average, and the social development data time step is the annual total value (Table 1). To ensure the reliability and accuracy of the data, the data adopted in this study came from three sources: (1) hydrological data were provided by the Erhai Conservation Administration. (2) Socioeconomic development data were mainly collected from the “Yunnan Statistical Yearbook” and the “Dali Prefecture Statistical Yearbook” from 1990 to 2019. (3) Meteorological data were acquired from the China Meteorological Science Data Sharing Service network (http://www.escience.gov.cn).
2.3. Methodology
2.3.1. Mann-Kendall Method
The Mann-Kendall (M-K) nonparametric rank correlation test method was proposed by H.B. Mann and M.G. Kendall [39] and is a widely used nonparametric test method recommended by the World Meteorological Organization (WMO). The advantages of this method are that it is convenient to calculate and is more suitable for trend testing of time series with outliers [40]. In recent years, there have been many examples of M-K method application research [41], and the test has often been used to assess the trend components of hydrological and meteorological data, including the time series of precipitation, runoff, temperature, and water quality [42]. In this study, based on the water level, inflow, and outflow data of Erhai Lake in 1990–2019, and using the M-K method to analyze its main change trends and mutation characteristics. The M-K test statistical formula can be found in reference [43]; the M-K test was carried out in MATLAB version 8.0.
The Mann-Kendall test method is used to test the mutation of time series. The specific method is as follows:
First, based on the time series x1, x2, x3, …, xn, an ordered sequence was constructed by Equation (1):
where ri was defined by Equation (2):
Under the assumption of random independence of the time series, the statistics UF was defined by Equation (3):
where UF1 = 0, E(Sk) and Var (Sk) were the mean and variance of the ordered sequence Sk, respectively.
Then, according to the inverse sequence xn, xn−1, …, x1 of the time series x, and following the above process to calculate UBk’ and UBk, which satisfies formula Equation (4):
Based on the statistics of UF and UB values, when UF = UB, the year can be determined as a water level mutation point.
2.3.2. Hurst Exponent
There are many random changes and trend changes in hydrological sequences, which are driven by human activities and climate change. The R/S analysis method (rescaled range analysis), is a statistical analysis method that was proposed by British hydrologist Hurst to address time series. The method was originally used to analyze the inflow and outflow between the reservoir and the river; however, the method is now used in major fields such as the stock market, ecology, and machinery [44,45,46]. In this study, based on the data of water level, precipitation, evaporation, inflow, and outflow in 1990–2019, and using R/S to evaluate its possible future trends. For the basic principles and methods of R/S analysis, please refer to reference [47].
2.3.3. PCA
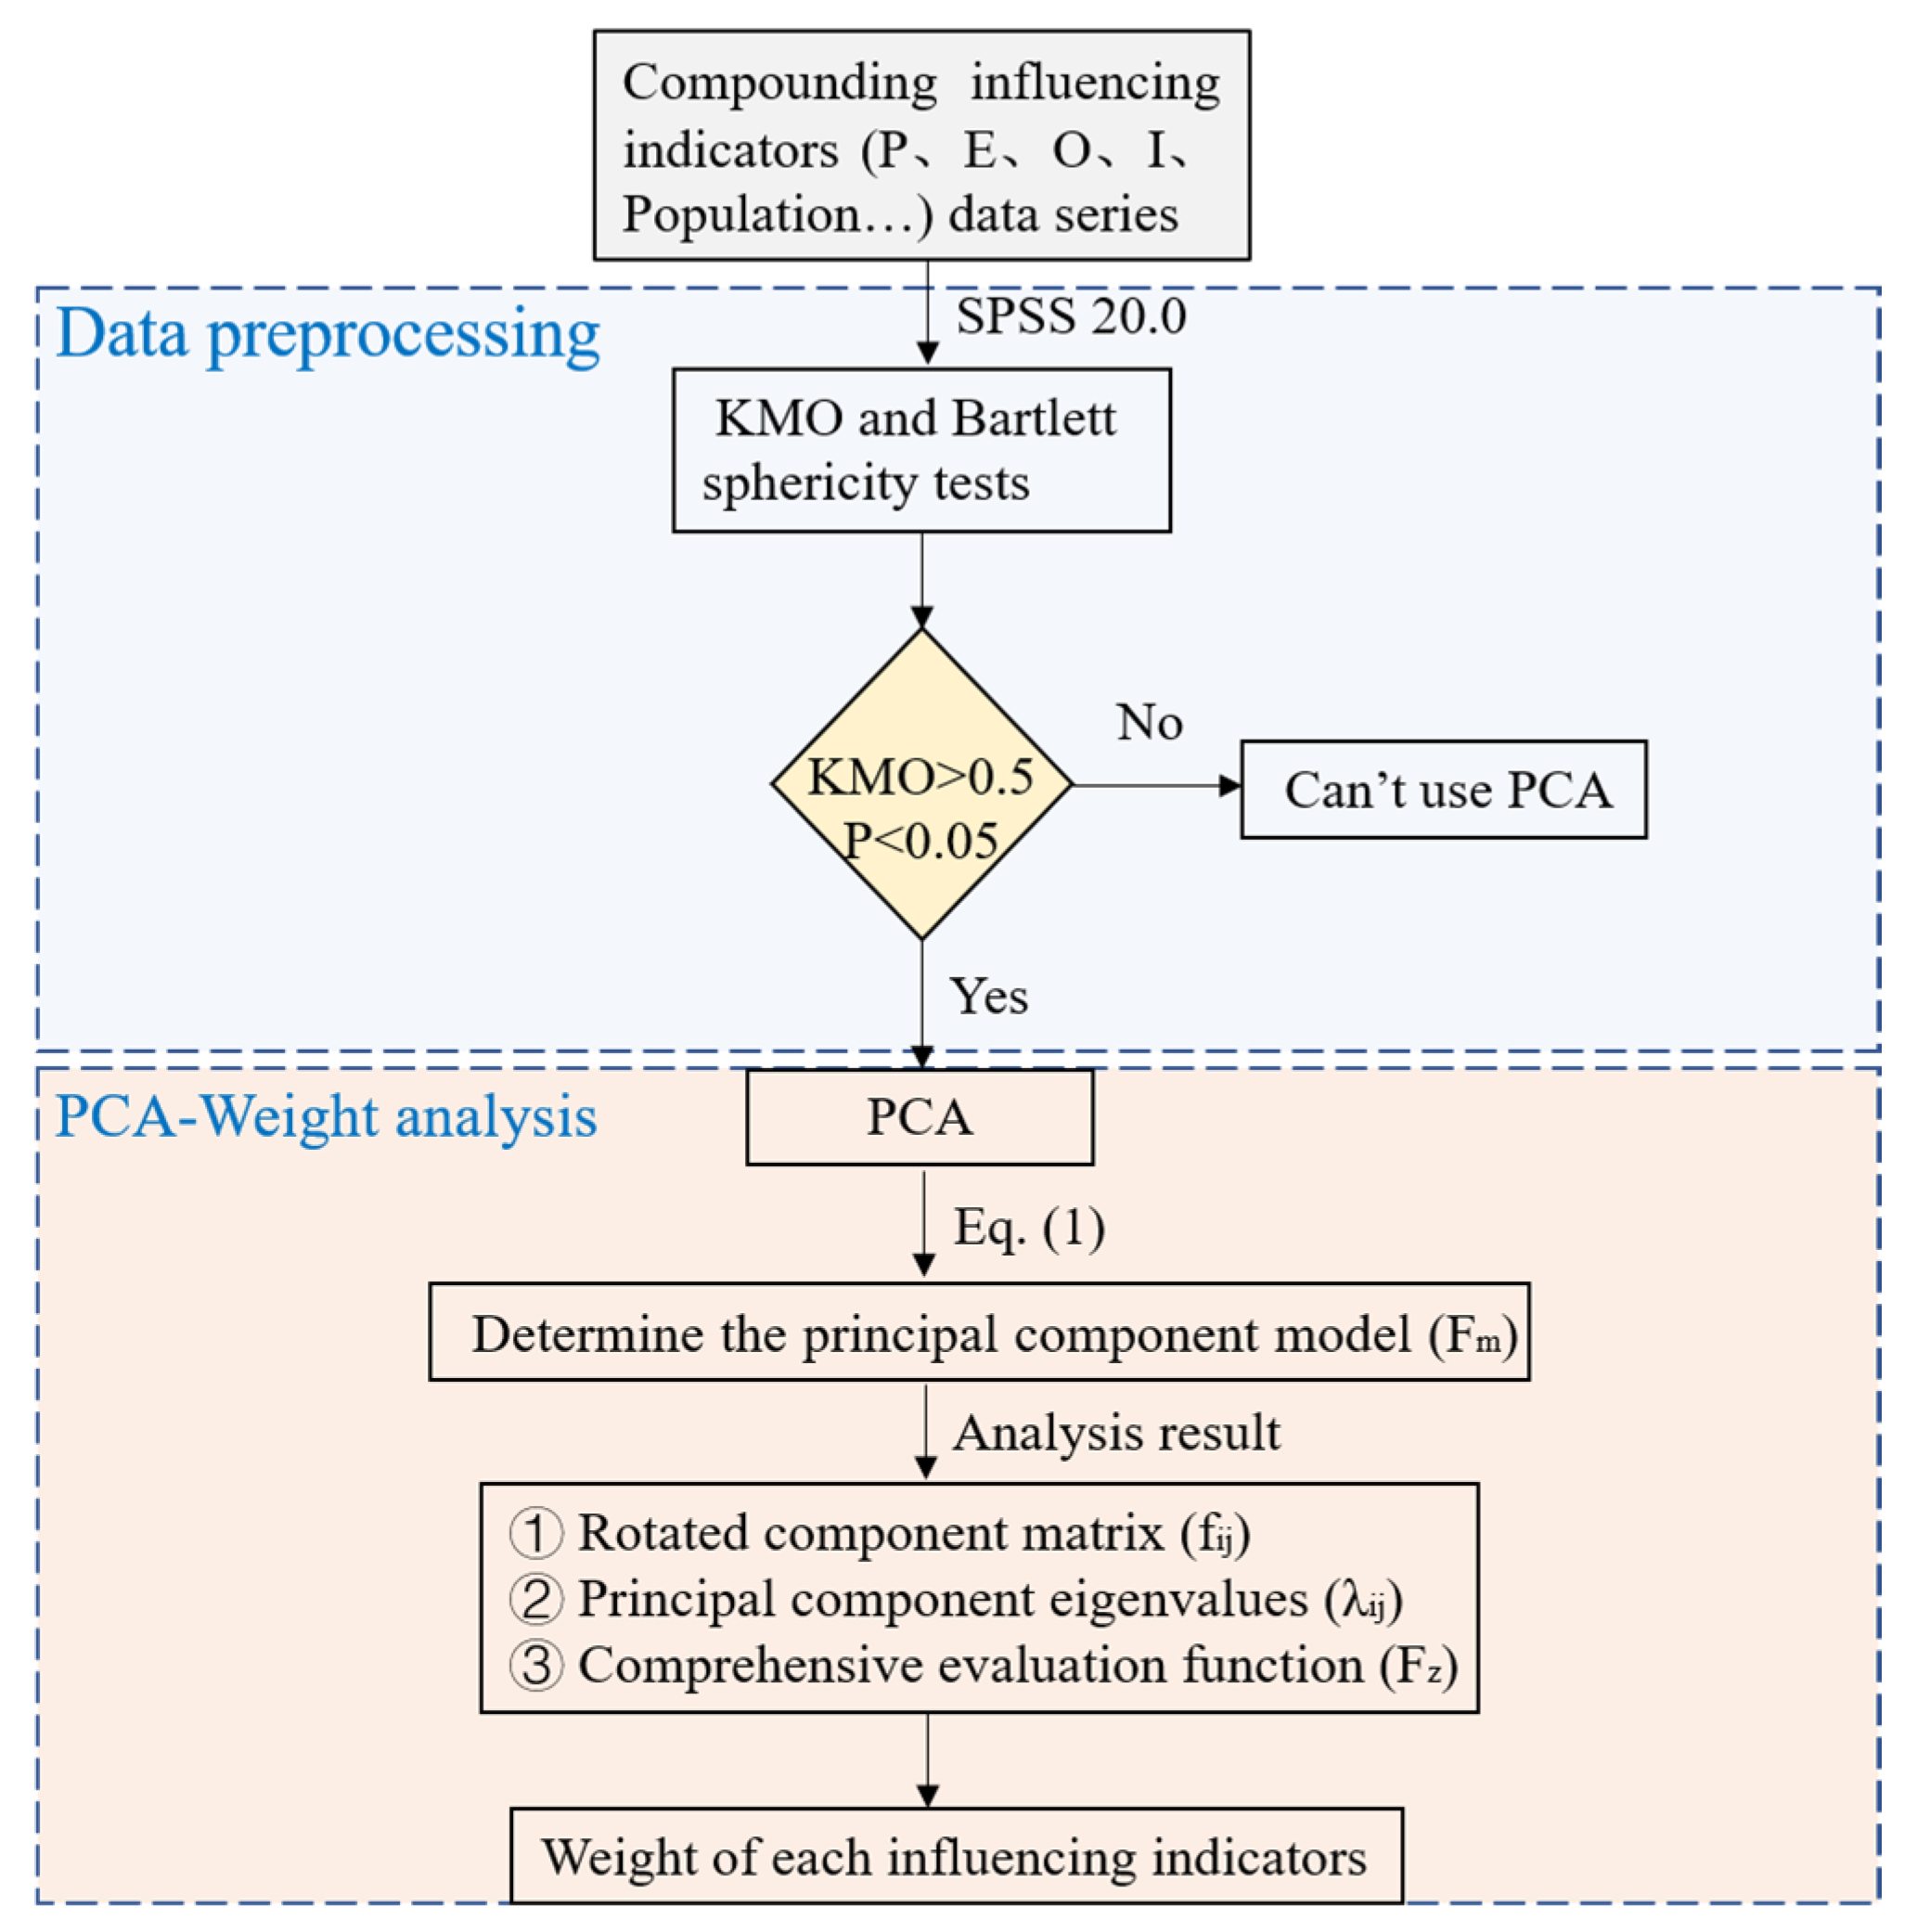
Principal component analysis (PCA) is a typical method used for extracting data and reducing dimensions [48]. In this study, the WL of EL was used as the response variable, precipitation, evaporation, inflow, outflow, population, and cultivated land area were used as the explanatory variable, and SPSS 20.0 was used for data analysis. First, KMO and Bartlett sphericity tests were performed on the data, which precipitation, evaporation, inflow, outflow, population, and cultivated land area of Erhai Lake in 1990–2019. When the KMO test coefficient was greater than 0.5, and p < 0.05, it indicated that the data could be factored (PCA). Varimax orthogonal rotation was then performed on the Kaiser normalized factors to further quantify the contribution of different factors to the change in Erhai water level (Figure 2). The specific methods are as follows:
- (1)
- Determine the principal component model, as defined by Equation (5):where F1, F2, ..., Fm are the m principal components obtained after the analysis, uij is the coefficient in the decision matrix when SPSS software is used for the principal component analysis, and the initial factor load fij is not the coefficient uij of the decision matrix. The relationship between fij and uij is shown in Equation (6):where fij is the initial factor load, is principal component eigenvalues; and uij is decision matrix coefficient.
- (2)
- Construct the comprehensive evaluation function, as defined by the following formula Equation (7):where a1, a2,…, aL is the index w1, w2, …, showing the comprehensive importance of wL in the principal component, and k is the sum of the eigenvalues.
- (3)
- Calculate the weight of each indicator by Equation (8):
To analyze the contribution of precipitation, evaporation, watershed population and other influencing indicators on the Erhai water level, we first used the PCA method to determine the main factors affecting the change in the Erhai water level, and finally calculated the weight of each influencing index.
3. Results
3.1. Variation in Precipitation and Inflow and Outflow in the Erhai Lake Basin
3.1.1. Variation in Precipitation in the Erhai Lake Basin
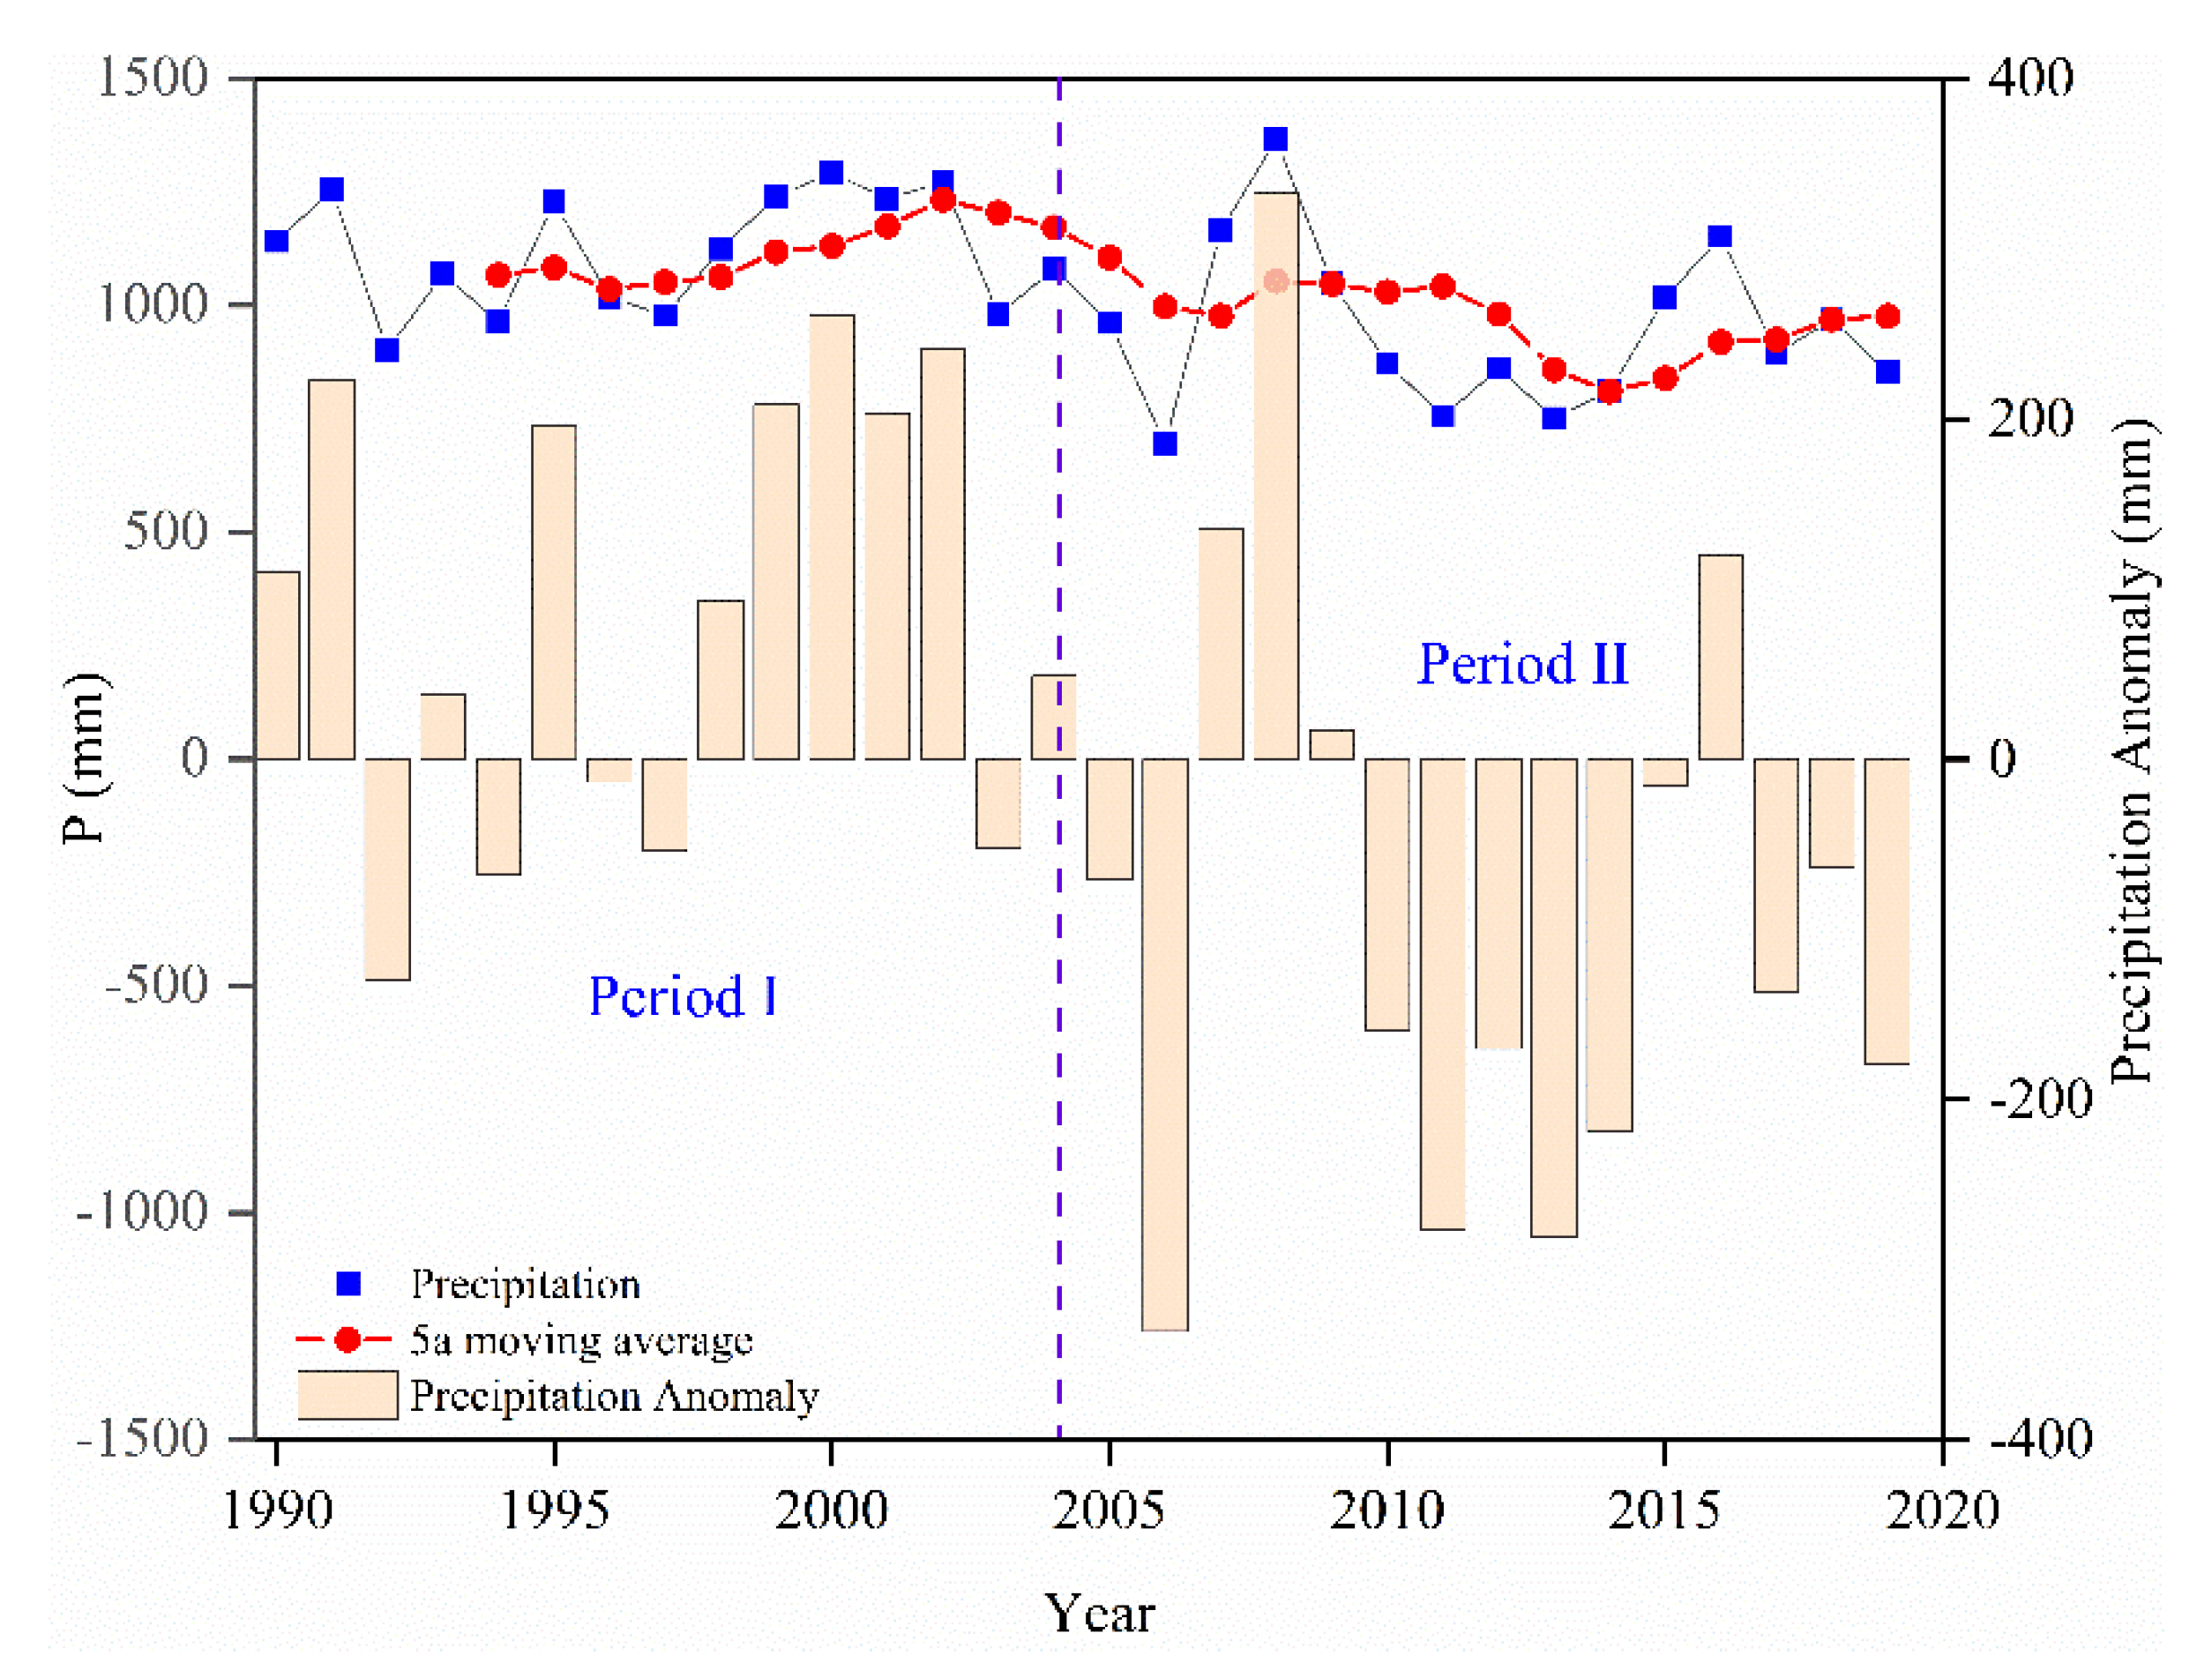
In 1990–2019, the annual precipitation in the Erhai Basin showed a downward trend, with a rate of decline of 87 mm/10a (Figure 3). The annual average precipitation was 1031.78 mm, of which the maximum was 1364.80 mm in 2008, the minimum was 695.30 mm in 2006, and the extreme value ratio was 1.96. In terms of the characteristics of interannual changes, the annual precipitation fluctuated greatly. Taking 2005 as the node, the characteristics showed an initial increase and then a decrease. In 1990–2004, the average annual precipitation was 1118.64 mm, and the average annual precipitation was more than 8%. Ten of the 15 years at this stage were above the average, and the value was continuously high from 1998 to 2002, indicating that the climate of the Erhai Basin in the 1990s was relatively humid with high precipitation. However, in 2005–2019, the average precipitation was 944.92 mm, 16% lower than that in the previous stage, and 8% lower than that in the multiyear average. Additionally, 11 of the 15 years in this period had values below the average, and drying continued from 2010 to 2014, indicating that the climate of the Erhai Basin was relatively dry, and the precipitation was low in the early 21st century. Especially in the last 10 years, the precipitation in the basin was below the average (except in 2006).
3.1.2. Variation in the Inflow and Outflow of Erhai Lake
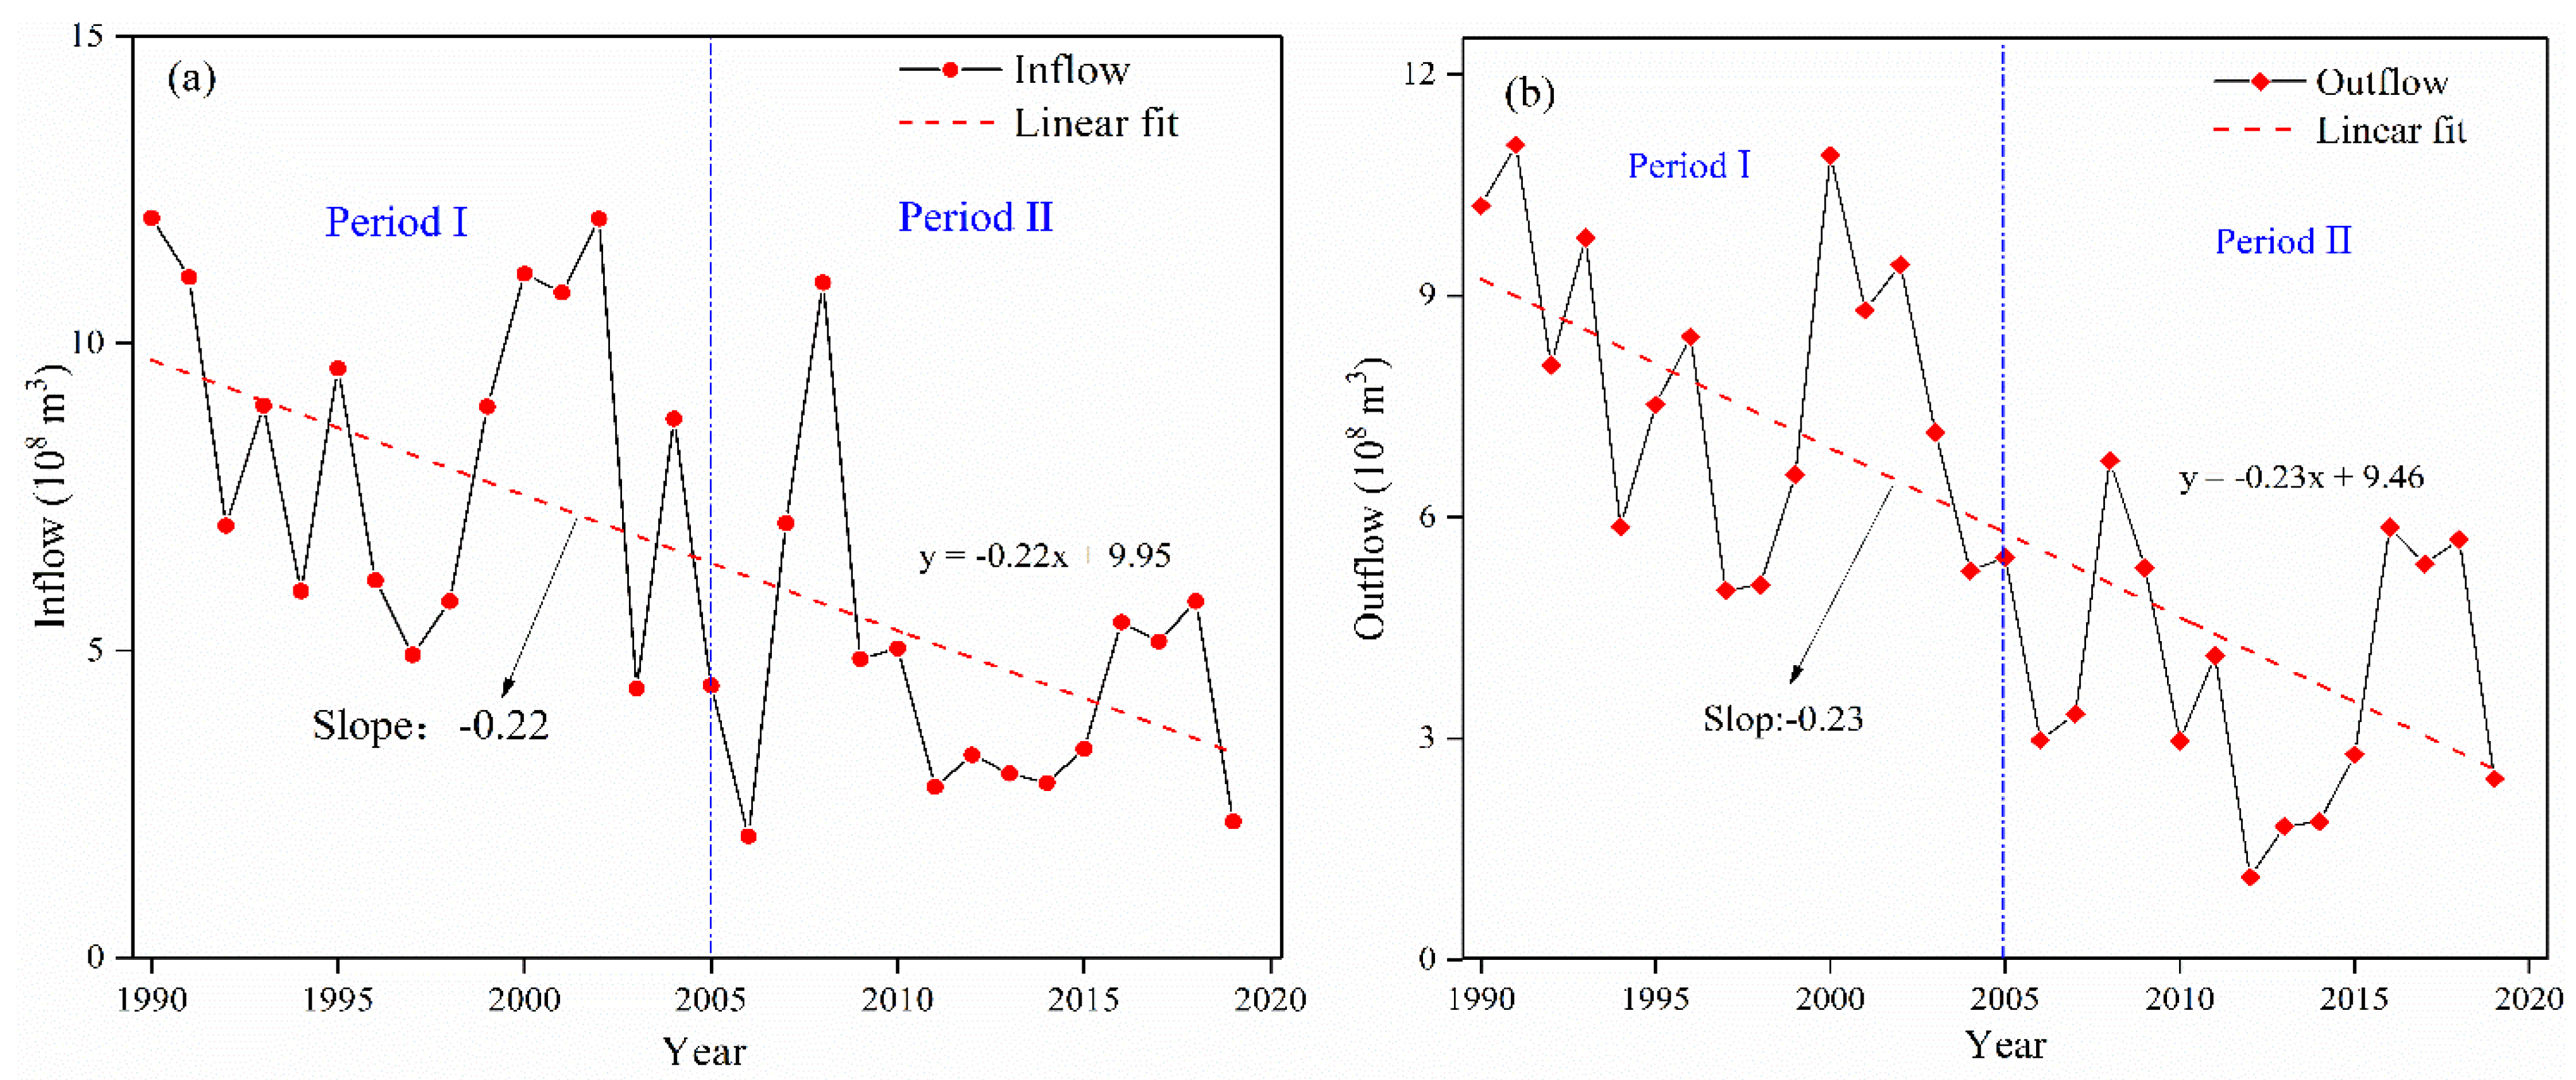
As shown in Figure 4, in 1990–2019, the annual average net inflow and outflow of EL were 653 million m3 and 597 million m3, respectively. The change rule of the inflow and outflow of EL are more obvious, showing a fluctuating downward trend, and the difference between inflow and outflow of EL was small. Meanwhile, the average annual inflow was 56 million m3 more than the outflow, and the decline rate was also smaller. Likewise, the rate of decline of the inflow was only 1 million m3/a higher than the outflow.
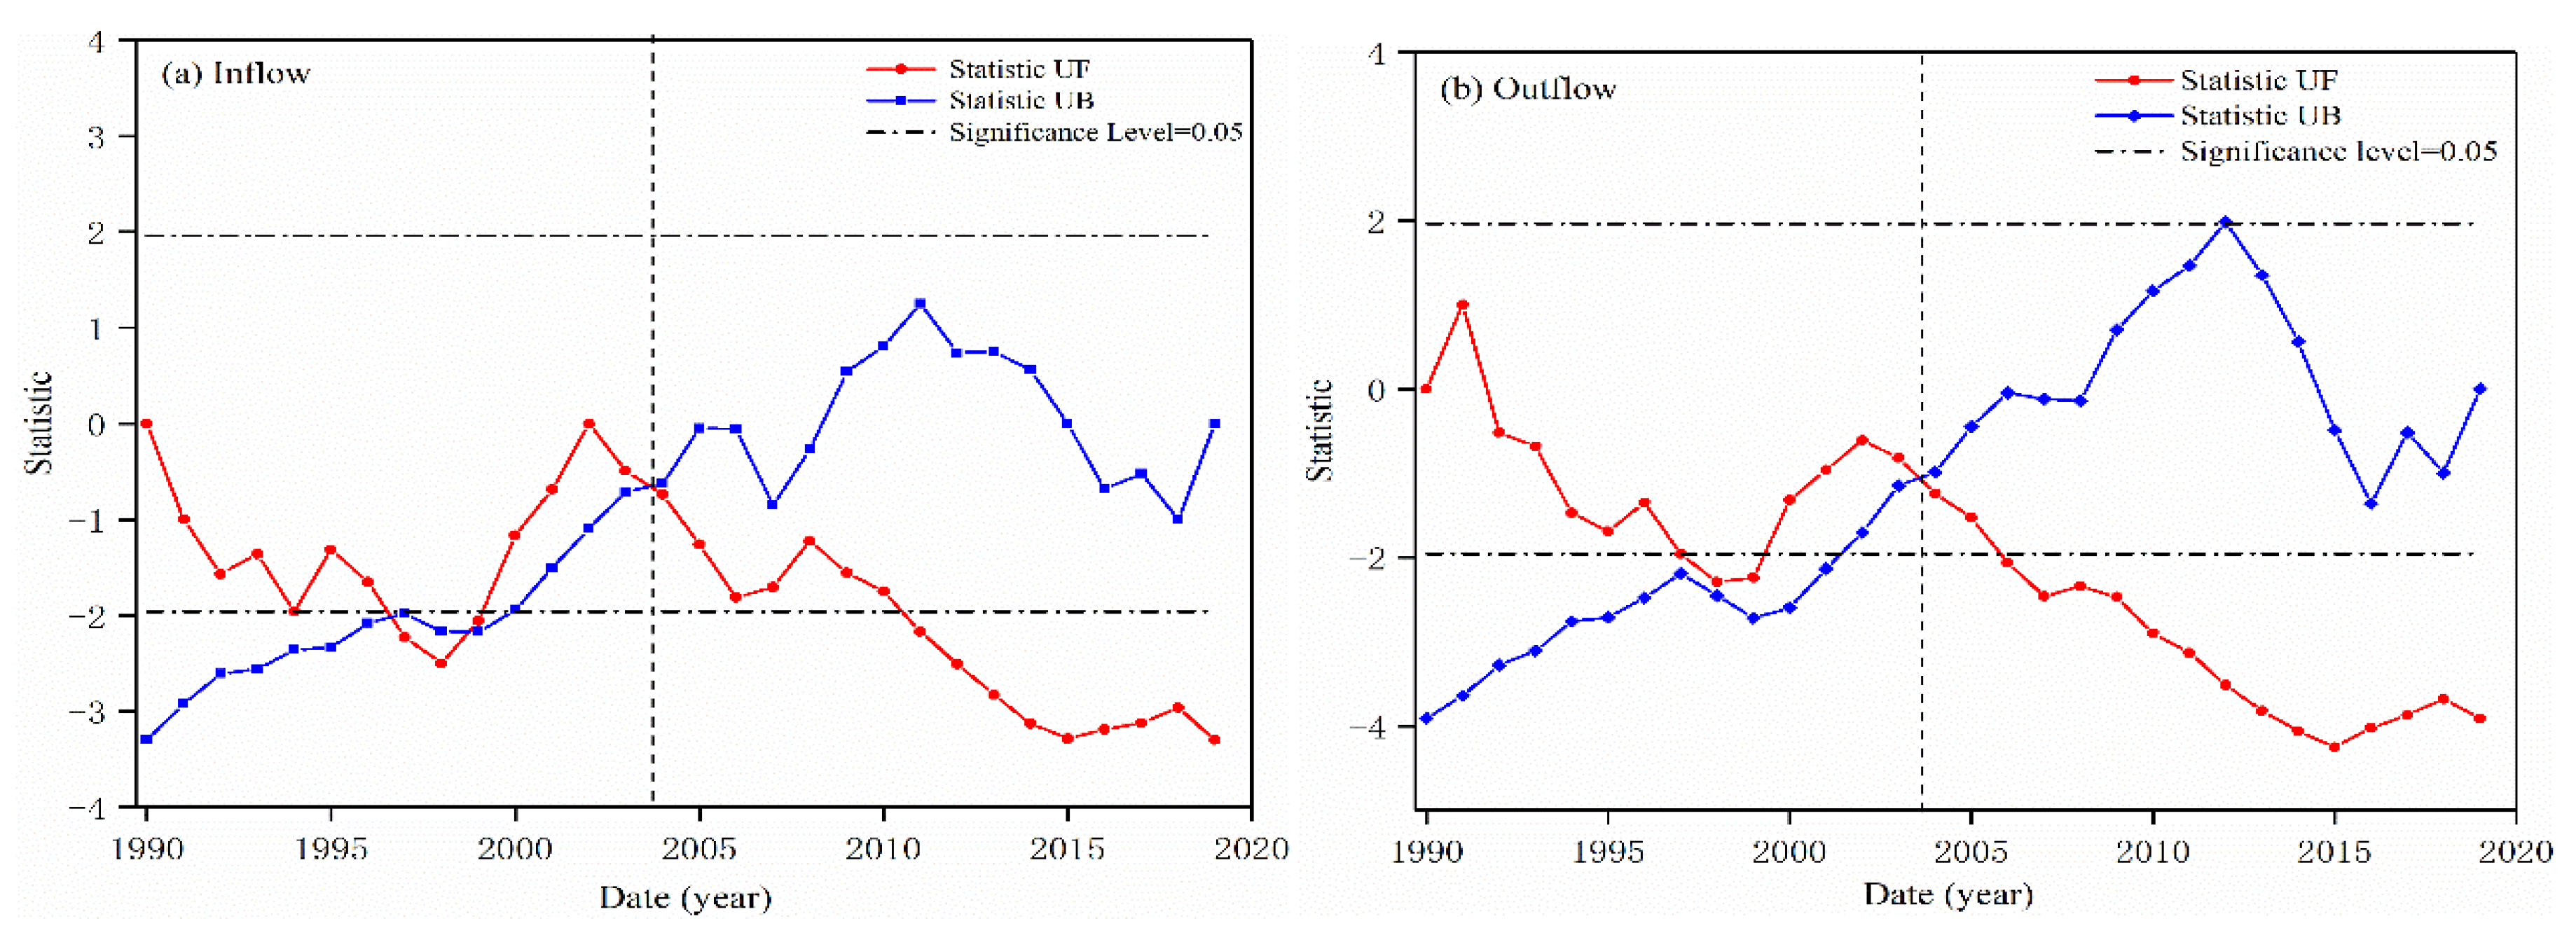
As shown in Figure 5, regarding the variation trends of the inflow and outflow of EL, the M-K trend mutation test showed that the inflow and outflow of the lake mutated in 2004 and showed a downward trend before and after the mutation, and the change was not significant (p > 0.05) (Table S1). Taking the year of mutation 2004 as the node, in 1990–2004, the average inflow was 851 million m3 and more than 30% of the average annual value; the average outflow was 809 million m3 and more than 35% of the average annual value. Although the inflow and outflow of EL were higher than the annual average level, they had a downward trend due to the joint influence of the decrease in precipitation and the increase in water transfer from EL to Binchuan County. In 2005–2019, the average inflow and outflow of the lake were 455 million m3 and 386 million m3, which were 30% and 35% less than that of the multiyear average, respectively; during this period, the decrease in the inflow and outflow of EL was mainly affected by the decrease in precipitation and the implementation of the protection and treatment project around the lake, thereby reduced part of the inflow into the lake.
3.1.3. Variation in the Erhai Lake Water Balance
The characteristics of the water balance in EL during 1990–2019 (Table 2), showed that the change in water storage was 3 million m3, which indicated that EL was positively balanced overall. However, in 1990–2004, the water consumption of EL was 1140 million m3, the change in water storage was minus 6 million m3, and the lake’s water supply was insufficient. Moreover, considering the annual changes in precipitation, evaporation, inflow and outflow, the variation coefficient Cv (coefficient of variation) values were 0.17, 0.19, 0.48, and 0.48, respectively, which indicated that the interannual variation of water inflow and outflow of EL was more intense, and the larger change in water outflow of EL was the main reason for the decrease in water volume during this period. In 2005–2019, the water volume of EL was in a positive balance; compared with 1990–2004, the evaporation and precipitation in this period decreased by 8% and 52%, respectively, and were affected by the water replenishment project. The change in water storage in EL increased by 18 million m³, indicating that the increase in water storage in EL was mainly caused by the increase in water replenishment and the decrease in outflow.
3.2. Characteristics of Water Level Variation in EL
3.2.1. Interannual Variation Trend and Stage Characteristics of Water Level in EL
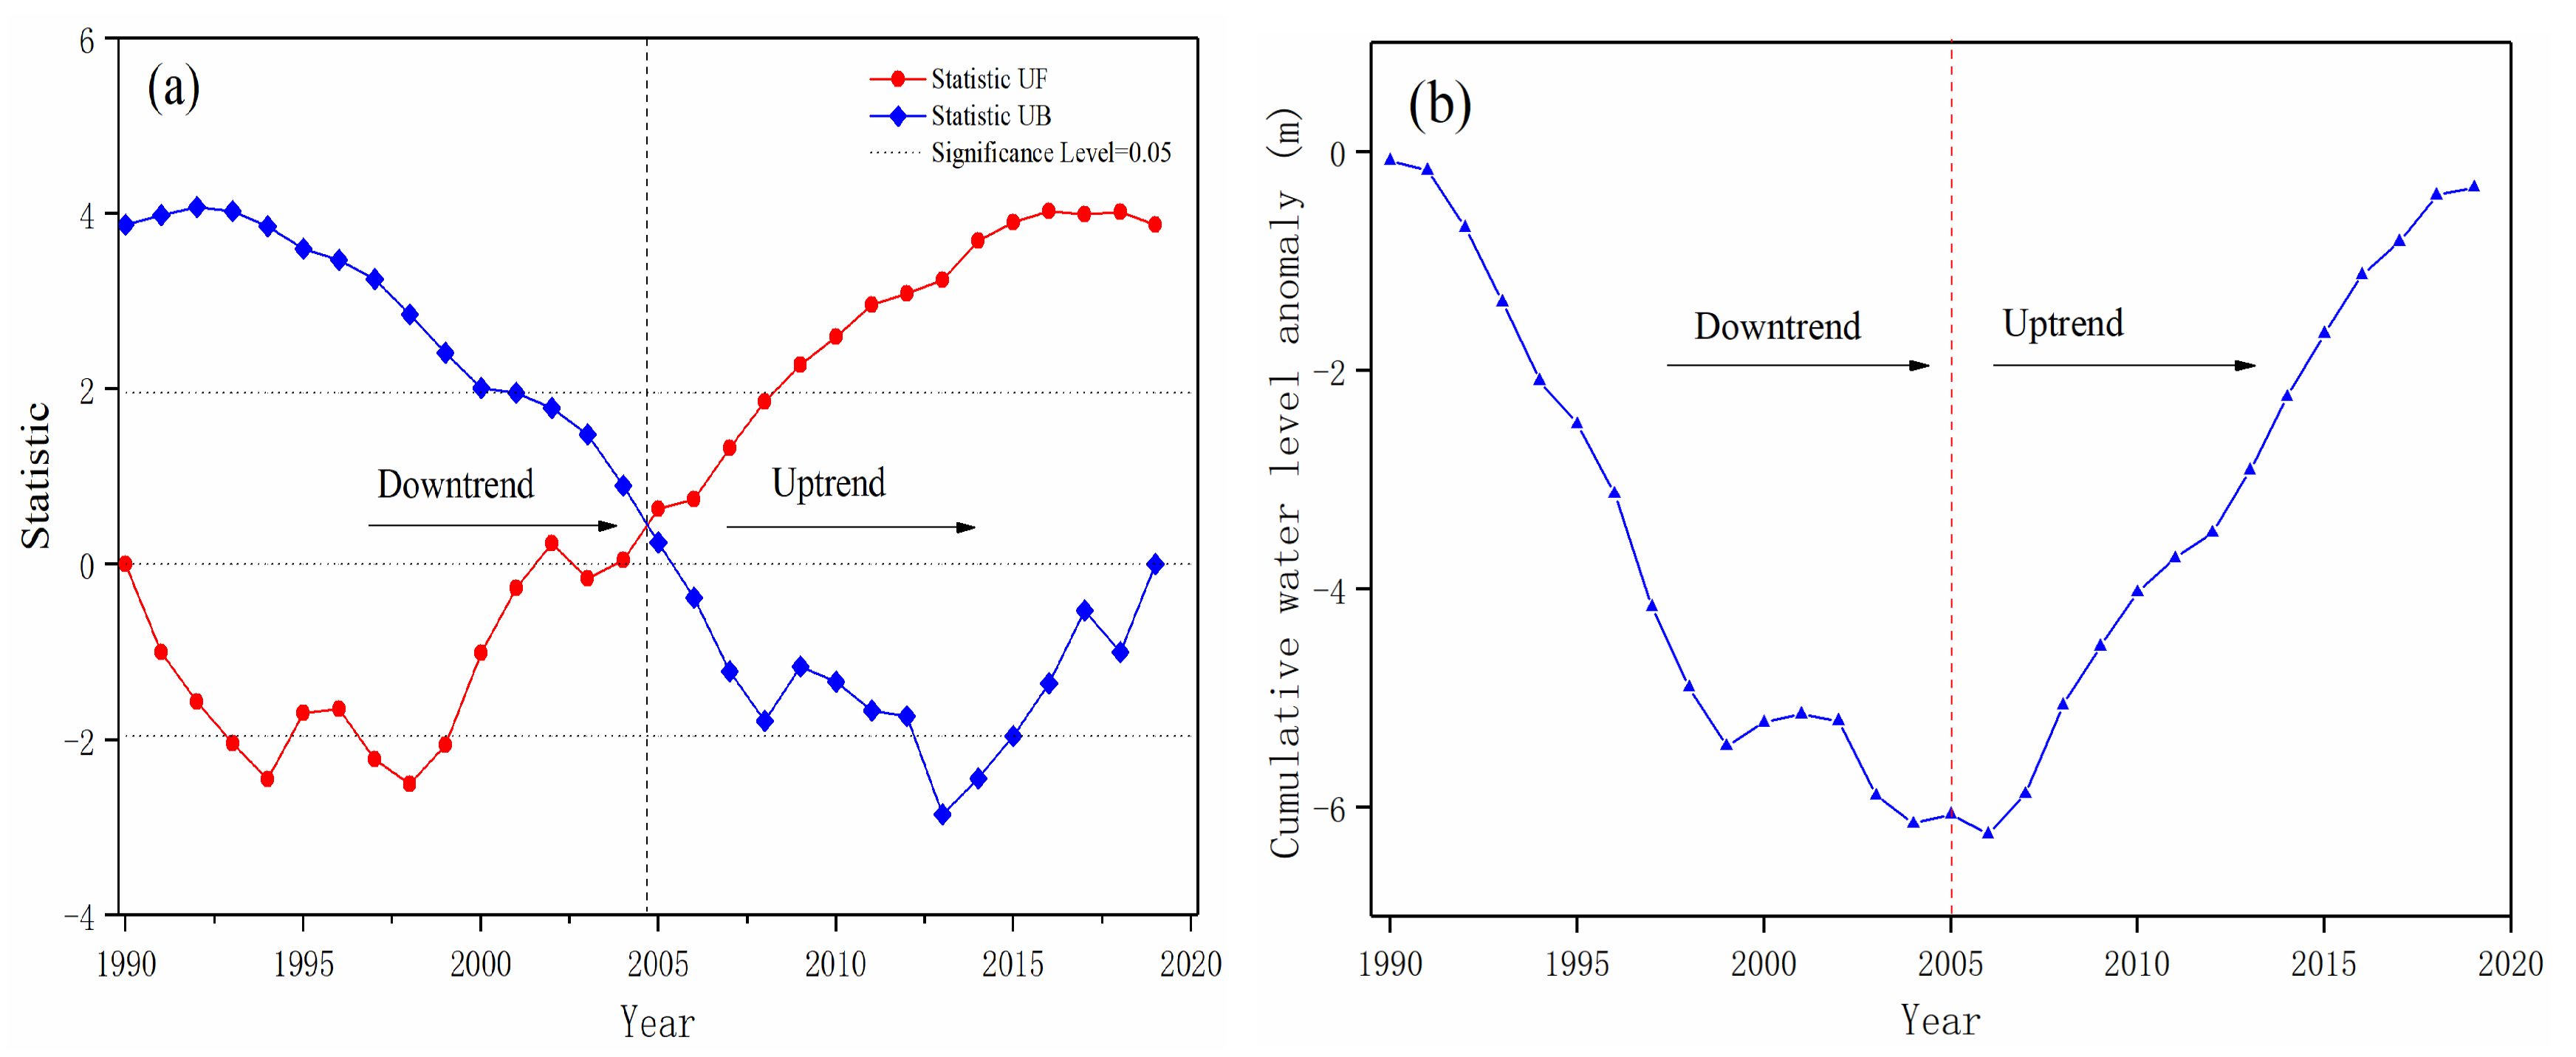
According to the operating WL time series of EL during 1990–2019, the M-K method and annual curve of cumulative water level anomaly was used to analyze the trend and mutation of the annual operating WL (Figure 6). The WL mutation in EL occurred in 2004–2005, which was closer to 2005. Therefore, 2005 was regarded as the year of WL mutation in this study, and 2005 was the first year after the adjustment of the characteristic WL in EL.
In terms of the characteristics of interannual variability, the operating WL of EL has changed significantly during 1990–2019 (Figure 7a). The average water level was 1964.84 m, with an overall rate of 47 mm/a (Table S2), showing a fluctuating upward trend. Furthermore, in 1990–2004, the annual average WL was 1964.43 m. Due to the impact of the water diversion project, the water was transferred to Binchuan County at an annual average of 500 million m3, resulting in a downward trend in WL. In 2005–2019 (after the WL mutation), the WL showed a fluctuating upward trend, with an annual average WL of 1965.24 m. Compared with the first period, the water outflow decreased by 52%, which increased the lake water storage. However, the decrease in the water level in 2013–2019 slowed the rising trend of WL in EL in 2005–2019 (Figure 6a), and the WL showed a downward trend in 2013–2019, with a rate of decline of 98.70 mm/a (Figure 7a). In 2013–2019, the inflow and precipitation decreased by 39% and 11%, respectively, compared with that in 1990–2019, and the evaporation was 37% higher than the precipitation, which indicated that the decrease in the WL in the past seven years was mainly caused by the decrease in inflow (Figure 6b). Moreover, the decrease in inflow not only was related to the decrease in precipitation and the increase in evaporation, but also affected by the treatment projects such as sewage interception around the lake.
3.2.2. Seasonal Characteristics and Trend of Water Level Variation in Erhai Lake
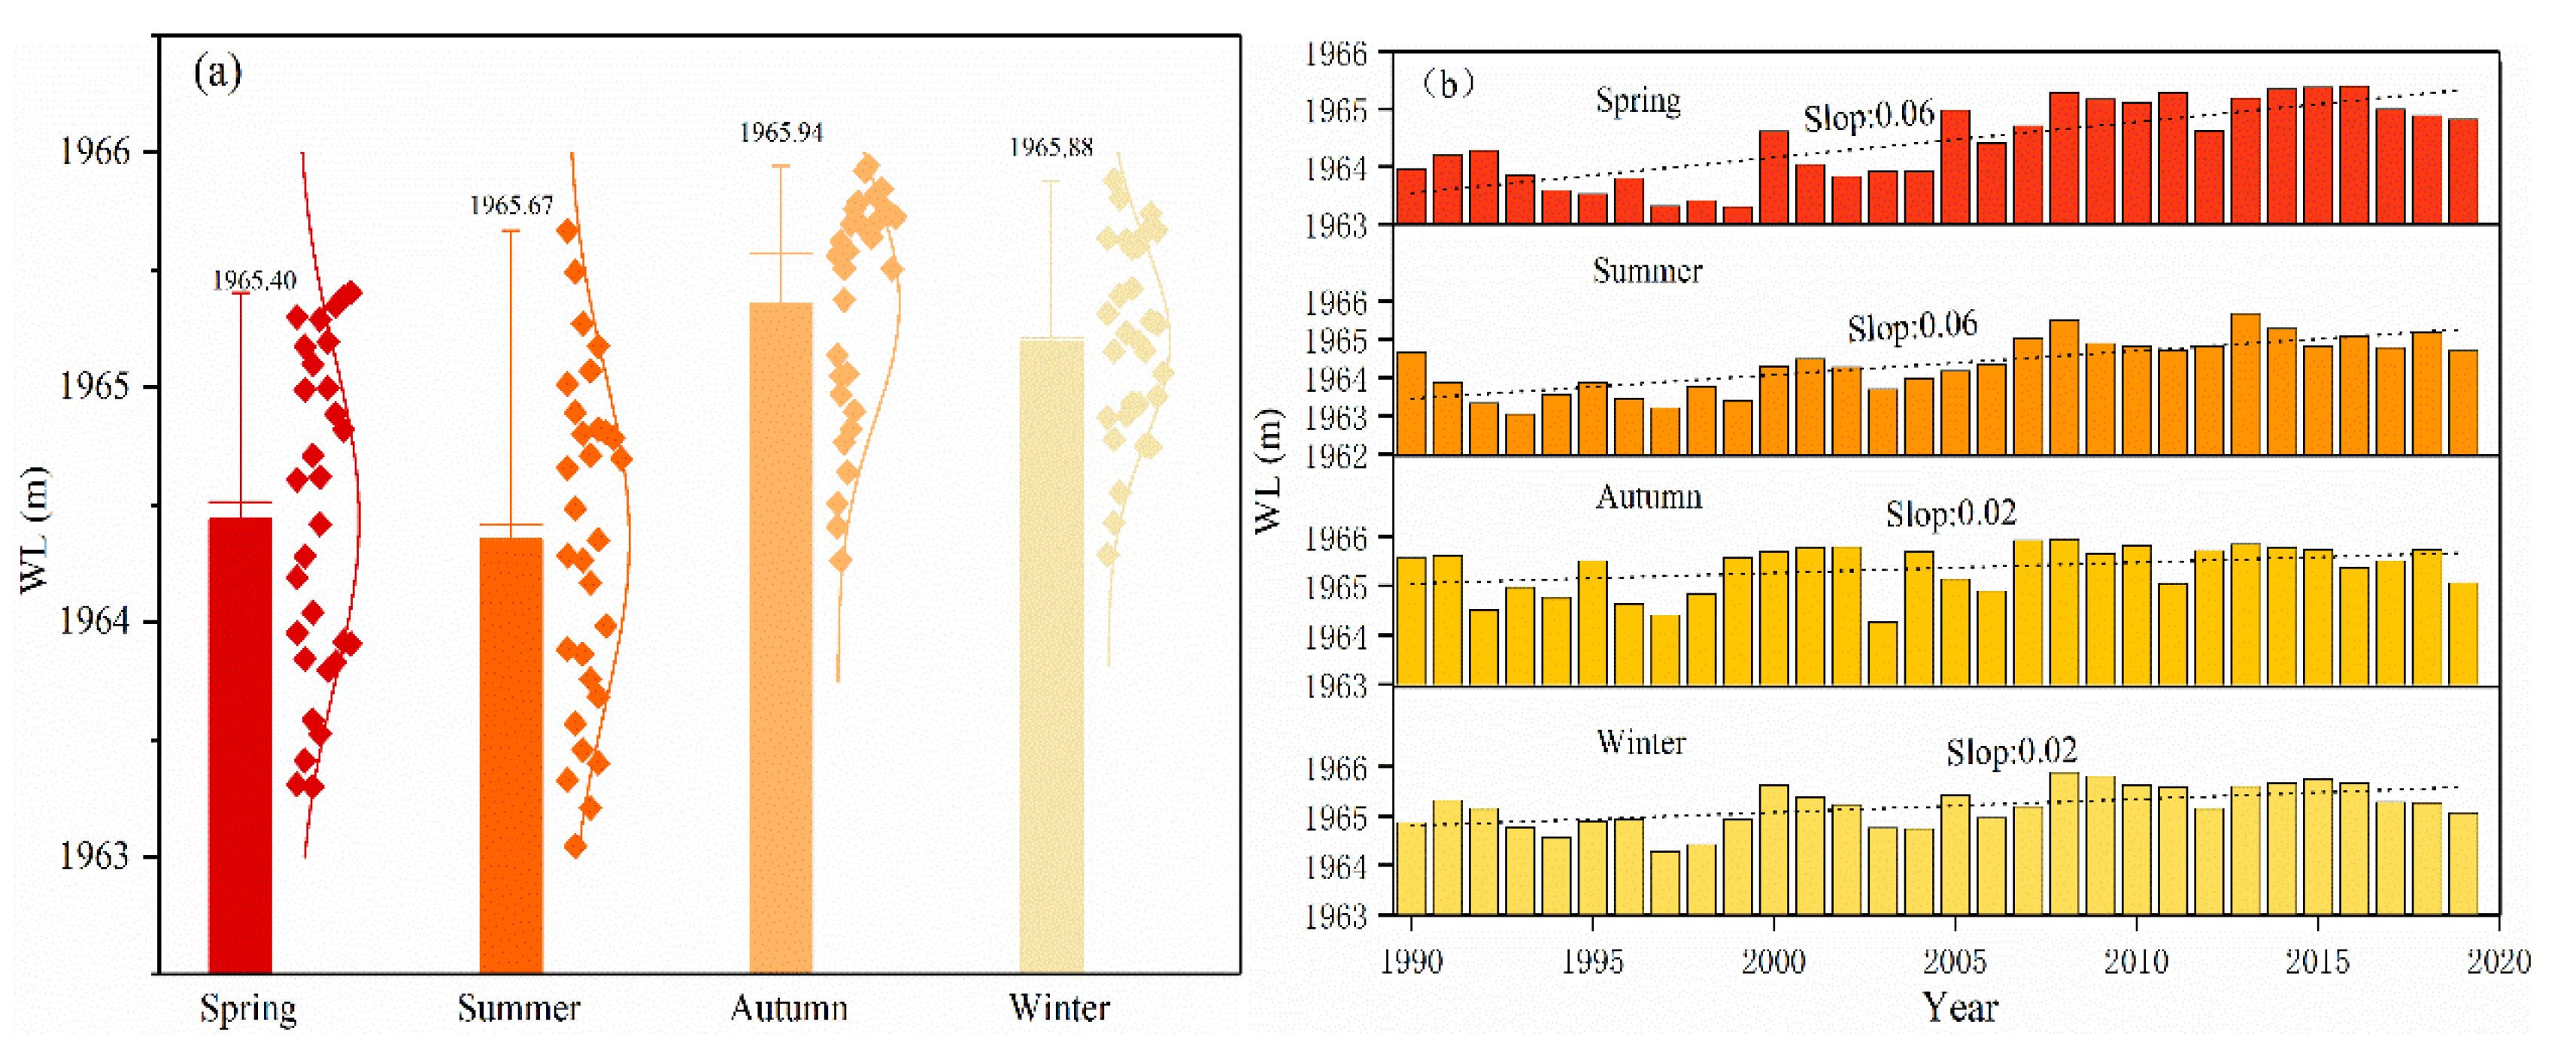
As shown in Figure 8a, the WL of EL changes obviously with seasons, showing the characteristics of being low in spring and summer, and high in autumn and winter. The lowest annual WL occurs from May to June, which was caused by the concentrated period of agricultural water use, and the increase in irrigation water consumption. However, due to the frequent precipitation in EL from May to October during the wet season, the water inflow into the lake increases, and the impact of the water inflow on the lake level has a certain sustainability, making the water level of EL reach its peak in October [49].
In terms of the seasonal change trend, the WL in spring and summer showed an upward trend at a rate of 0.06 m/a (Figure 8b), in which the highest water level was 1965.40 m in 2016. The highest WL year was consistent with the lowest evaporation year, which indicated that the spring WL is greatly affected by evaporation. Moreover, the lowest WL in summer was 1963.05 m in 1993, and the highest water level was 1965.67 m in 2013, with a variation of 2.62 m, which was mainly affected by human activities such as irrigation water and production and living water consumption. However, the fluctuation of the WL in autumn and winter was relatively large, with an overall rate of 0.02 m/a, showing an upward trend. The highest and lowest water levels in autumn were 2008 and 2003, respectively, and the year with the highest WL was consistent with the year with the maximum precipitation, which indicated that the WL in autumn was greatly affected by the previous amount of precipitation. In addition, the highest WL in winter was 1965.88 m in 2008, the lowest was 1964.29 m in 1997, and the precipitation was largest in 2008, and the precipitation and water inflow of EL were low in 1997, which indicated that the WL change in winter was greatly affected by the inflow and precipitation.
4. Discussion
4.1. Influence Factors and Ecological Effects of Water Level Change in EL
As shown in Figure 9, climate change, outflow, inflow, and human activities are the main factors affecting the WL changes in the lake. This study found that the precipitation, evaporation, inflow, and outflow of the lake all showed a downward fluctuating trend in 1990–2019, but the lake WL increased at a rate of 47 mm/a. The rise in the WL was not only related to the increase in the operating WL of EL in 2004, but also affected by the water replenishment project which was officially opened in May 2017 and increased the water storage capacity of the EL. Nevertheless, Figure 5 illustrates that the WL has a downward trend during 1990–2004, mainly caused by the rapid population growth and the development of the industrial and agricultural economy, which increased the intensity of water resource development and utilization (reached 54.3%). In addition, after the water diversion project was completed in 1994, the annual water transfer from EL to Binchuan County was approximately 50 million m³, which was equivalent to the annual decrease in the Erhai water level by 0.2 m. The seasonal and interannual WL fluctuations affect the distribution and stability of aquatic organisms in the lake [50,51,52]. For example, the variation in the WL in EL decreased from more than 2 m in 1978 to 0.75 m in 1983, and the distribution area of submerged vegetation decreased significantly, from 60% to 30% [53]. It is worth noting that affected by the adjustment of the characteristic WL, the decrease in outflow and the increase in supplementary water, the WL showed an upward trend during 2005–2019. The decrease in WL in 2013–2019 was not only caused by the decrease in precipitation, which reduced the main supply of lake water, but also was related to reducing part of the inflow by implementing protection and treatment projects. Therefore, WL changes and consequent habitat loss seriously affected the biodiversity and ecosystem functions of the lake [54,55], and the natural water level fluctuations were essential to the structure and function of the lake ecosystem. For example, exceeding the natural change threshold will cause great harm to ecosystems [56,57], and can directly affect water quality. Under the influence of climate and WL changes in 2007, the Burragorang Lake waters in Australia showed obvious stratification, which led to algal blooms [58].
Concerning the future change trend of the WL, the Hurst exponent of hydrometeorological elements in the Erhai basin calculated by the R/S method showed that the H (Hurst exponent) of the Erhai water level was 0.048 (0 < H < 0.5), indicating that the WL may with increased probability decrease after 2019. However, the Hurst exponents of precipitation, evaporation, inflow, and outflow in EL were 0.049, 0.048, 0.037, and 0.042, respectively, indicating that the decrease in future WL will be caused by the combined effect of runoff changes and climate change. Furthermore, climate change can not only affect the hydrological cycle and natural functions of lakes by changing precipitation, evaporation and temperature conditions but also cause the lake WL to fluctuate beyond its historical range, which may promote the occurrence of extreme events such as floods and droughts, and further affect aquatic organisms [59], For example, a decrease in WL can increase the richness and abundance of dabbling duck species in EL [60].
4.2. Quantitating the Contribution of Compounding Influencing Factors to Water Level Change
In this study, the PCA method was used to extract the main factors affecting the change in the EL water level, and two principal components with eigenvalues greater than 1 were obtained. The variance contribution rates were 52.74% and 30.73%, respectively, and the cumulative contribution rate was 83.47% (Table S3), which explained most of the information that affects the change in the EL water level.
To further quantify the contribution of climate change, inflow, outflow, and human activities to the WL change in EL, a weight determination model based on PCA was established, and the weights of each impact index were calculated. The results are shown in Table 3, which shows that the principal factor for the rise in the EL water level in 1990–2019 was the outflow, accounting for 19.34%. In addition, the contribution of human activities such as the change in population and cultivated area to the WL of EL was second only to the outflow, with contribution proportion of 18.59% and 18.69%, respectively. However, in 1990–2004, the dominant factor of water level change in EL was the outflow, with a contribution rate of 21.61%, followed by the population of the river basin, with a contribution rate of 18.03%. This indicated that with population growth, industrial and agricultural development and large-scale economic development, the per capita water consumption increased [61]. Moreover, in 2005–2019, the water level change in EL was mainly due to the decrease in agricultural irrigation water consumption caused by the slow rate of increase in cultivated area, with a contribution of 20.48%. This was related to some measures taken to strengthen the ecological protection of EL in recent years, such as returning farmland to forests and grass and adjusting the characteristic operation WL, effectively controlling the agricultural irrigation water consumption, and increasing the water storage of the lake, to strengthen the protection of the Erhai ecosystem, which has enabled the sustainable development of EL to be scientifically accomplished [62].
In general, the WL regime of the lake mainly depends on the precipitation, evaporation, inflow, and outflow, basin characteristics and human activities [13,24,63]. Currently, due to the influence of human activities or climate change, China’s lakes are generally affected by falling water levels and water shortages, which not only damage the integrity of lake ecosystems [64] but also affect the function and sustainable utilization of lake ecosystems [65,66]. Meanwhile, to alleviate the current problems faced by lakes, water diversion by water conservancy projects was considered to (a) alleviate the contradiction between limited water and increased water demand [67], (b) improve lake water quality, (c) raise the operating water level of lakes, (d) and restore the ecological characteristics of lakes or rivers [68]. However, due to the reduction of precipitation in the EL basin and the implementation of the sewage interception project around the lake, the water level in EL has declined significantly in last seven years, which has changed the structure and function of the lake ecosystem. To meet the sustainable development and ecological demand of EL, through the three reservoirs connection project in 2017, the water storage capacity of the lake was increased, and the operation WL and storage capacity of EL improved, thus promoting the utilization efficiency of water resources.
5. Conclusions
In this study, we collected WL and meteorological data and social statistics of the EL basin to assess the WL changes in EL in the past 30 years and quantified the impact of climate change and human activities on WL changes. This information is crucial for WL management policies of the Erhai Authority. The following points summarize the main results of the study.
- (1)
- Over the past 30 years, the total volume of EL has been in a state of dynamic positive balance. In 1990–2004, it was mainly influenced by the increase in water consumption, and the volume of EL was in a negative balanced state. In 2005–2019, it was mainly influenced by the adjustment of the operating water level of EL and the connected water replenishment project of the three reservoirs: the outflow decreased, the lake water storage increased, and the volume of EL was in a positive balanced state. Although the water volume in 2005–2019 was in a positive balance, due to the increase in evaporation and the decrease in inflow, the water volume in 2013–2019 was in a negative balance.
- (2)
- In 1990–2019, the water level of EL rose at a rate of 47 mm/a. In 1990–2004 (before the mutation), with population growth and social and economic development, the development and utilization intensity of EL water resources increased, coupled with a decrease in water inflow, which resulted in a decrease in the WL. In 2005–2019 (after the mutation), the evaporation and outflow decreased by 8% and 52% compared with that in 1990–2004, respectively, and the water consumption of the lake decreased. Together with the increased water replenishment, this led to an upward trend of the water level, which was 0.81 m higher than that in 1990–2004. However, affected by the decrease in precipitation and the increase in evaporation and the interception of inflow by the sewage interception project, the decrease in the WL in 2013–2019 slowed the rising trend of the WL in EL in 2005–2019. It has been predicted that the WL will decrease in the future (H = 0.048 < 0.5), which was mainly related to the increase in future lake discharge (H = 0.046) and evaporation (H = 0.048). In addition, it was predicted that the future WL will show a downward trend (H = 0.048 < 0.5), which is mainly affected by the increase in outflow (H = 0.042) and evaporation (H = 0.048) in the future.
- (3)
- In 1990–2019, the decrease in outflow was the major factor influencing the WL change in EL, with a contribution of 19.34%. In 1990–2004, the WL change was mainly caused by the large outflow, with a contribution of 21.61%. In 2005–2019, the change in cultivated area was the main factor influencing the WL fluctuation of EL, with a contribution of 20.48%. In the future, with the impact of climate change and human activities, the precipitation may with increased probability decrease (H = 0.049 < 0.5) and the inflow intercepted by the pollution interception project will have an important impact on the fluctuation of the WL. In particular, in 2013–2019, the maximum contribution of climate change to WL changes was 40.35%. Therefore, the protection and management of EL should consider the demand of WL management when paying attention to reducing the pollution load into the lake and improving the water quality of the lake. Moreover, lake managers should pay more attention to the impact of human activities on the water level, such as wastewater interception and treatment projects around the lake, and also focus on the impact of climate change, which is very important for WL management and EL protection and treatment.
Moreover, some caveats should be emphasized when discussing the contribution of climate change and human activities to the water level of Erhai Lake in this study. Since the water diversion project from Erhai Lake to Binchuan country started in 1994, and the Three Reservoirs Connected Water Replenishment Project was officially implemented at the end of May 2017, and there have been no effective long-term data series. Therefore, when using the PCA method to calculate the index weights, the water replenishment project has not yet been calculated, and contributions may cause some uncertainties in the results. Additionally, the contribution of replenishment to the change in water level in EL should be further discussed, and the droughts might play a significant role on the fluctuation of water levels [69,70], and should be further discussed. Nevertheless, this study revealed the trend of water level changes in EL over the past 30 years and quantified the impact of climate change and human activities on the variation in water level, narrowed the gap in understanding the impact of climate change and human activities on the water level of EL, and enabled lake managers to formulate more appropriate water resource scheduling schemes based on natural ecosystems.
Supplementary Materials
The following are available online at https://www.mdpi.com/2073-4441/13/1/29/s1, Table S1: M-K test of the inflow and outflow of Erhai Lake; Table S2: Mann-Kendall test of the water level of Erhai Lake; Table S3: The eigenvalues and variance contribution rates of principal components in different periods.
Author Contributions
H.W.: writing—original draft, and writing—review and editing. S.W.: writing—review, supervision, funding acquisition, and resources. T.W.: collecting the data. B.Y.: writing—original draft. Z.N.: writing—original draft. All authors have read and agreed to the published version of the manuscript.
Funding
This research was funded the National Major Science and Technology Program for Water Pollution Control and Treatment (2018ZX07701001-17) and the National Natural Science Foundation of China (No. U1902207).
Institutional Review Board Statement
The study did not require ethical approval, because studies not involving humans or animals.
Informed Consent Statement
Informed consent was obtained from all subjects involved in the study.
Data Availability Statement
Publicly available datasets were analyzed in this study. This data can be found here: Statistical Yearbook and http://www.escience.gov.cn.
Acknowledgments
The authors thank the China Meteorological Science Data Sharing Service network for providing meteorological data, and sincere gratitude is extended to the administration of Erhai, which provided the data on water level.
Conflicts of Interest
The authors declare that there is no financial or personal interest in this study.
References
- Geng, M.; Wang, K.; Yang, N.; Li, F.; Zou, Y.; Chen, X.; Deng, Z.; Xie, Y. Evaluation and variation trends analysis of water quality in response to water regime changes in a typical river-connected lake (dongting lake), china. Environ. Pollut. 2020, 268, 115761. [Google Scholar] [CrossRef] [PubMed]
- Alamanos, A.; Latinopoulos, D.; Papaioannou, G.; Mylopoulos, N. Integrated hydro-economic modeling for sustainable water resources management in data-scarce areas: The case of lake karla watershed in greece. Water Resour. Manag. 2019, 33, 2775–2790. [Google Scholar] [CrossRef]
- Kuil, L.; Carr, G.; Viglione, A.; Prskawetz, A.; Bloeschl, G. Conceptualizing socio-hydrological drought processes: The case of the maya collapse. Water Resour. Res. 2016, 52, 6222–6242. [Google Scholar] [CrossRef] [PubMed] [Green Version]
- Zhang, G.; Xie, H.; Yao, T.; Kang, S. Water balance estimates of ten greatest lakes in china using icesat and landsat data. Chin. Sci. Bull. 2013, 58, 3815–3829. [Google Scholar] [CrossRef] [Green Version]
- Huntington, T.G. Evidence for intensification of the global water cycle: Review and synthesis. J. Hydrol. 2006, 319, 83–95. [Google Scholar] [CrossRef]
- Adrian, R.; O’Reilly, C.M.; Zagarese, H.; Baines, S.B.; Hessen, D.O.; Keller, W.; Livingstone, D.M.; Sommaruga, R.; Straile, D.; Van Donk, E.; et al. Lakes as sentinels of climate change. Limnol. Oceanogr. 2009, 54, 2283–2297. [Google Scholar] [CrossRef]
- Cardille, J.A.; Carpenter, S.R.; Foley, J.A.; Hanson, P.C.; Turner, M.G.; Vano, J.A. Climate change and lakes: Estimating sensitivities of water and carbon budgets. J. Geophys. Res. Biogeo 2009, 114. [Google Scholar] [CrossRef] [Green Version]
- Panagoulia, D. Impacts of giss-modelled climate changes on catchment hydrology. Hydrol. Sci. J. 1992, 37, 141–163. [Google Scholar] [CrossRef]
- Panagoulia, D. hydrological response of a medium-sized mountainous catchment to climate changes. Hydrol. Sci. J. 1991, 36, 525–547. [Google Scholar] [CrossRef]
- Shankman, D.; Keim, B.D.; Song, J. Flood frequency in china’s poyang lake region: Trends and teleconnections. Int. J. Climatol. 2006, 26, 1255–1266. [Google Scholar] [CrossRef] [Green Version]
- Chen, H.; Song, S.; Lee, T.; Lowemark, L.; Chi, Z.; Wang, Y.; Hong, E. A multiproxy lake record from inner mongolia displays a late holocene teleconnection between central asian and north atlantic climates. Quat. Int. 2010, 227, 170–182. [Google Scholar] [CrossRef]
- Gao, Y.; Xie, Y.; Zou, D. Hydrological regime change and its ecological responses in east dongting lake, china. Ecohydrol. Hydrobiol. 2020, 20, 142–150. [Google Scholar] [CrossRef]
- Zohary, T.; Ostrovsky, I. Ecological impacts of excessive water level fluctuations in stratified freshwater lakes. Inland Waters 2011, 1, 47–59. [Google Scholar] [CrossRef]
- Song, M.; Wang, R.; Zeng, X. Water resources utilization efficiency and influence factors under environmental restrictions. J. Clean. Prod. 2018, 184, 611–621. [Google Scholar] [CrossRef]
- Poff, N.L.; Allan, J.D.; Bain, M.B.; Karr, J.R.; Prestegaard, K.L.; Richter, B.D.; Sparks, R.E.; Stromberg, J.C. The natural flow regime. Bioscience 1997, 47, 769–784. [Google Scholar] [CrossRef]
- Zhou, J.; Zhang, M. Eco-problem of poyang lake in yangtze river and effect of sluice gate construction at lake's outlet. Water Resour. Prot. 2019, 35, 1–12. [Google Scholar]
- Xu, R.; Pang, Y.; Hu, Z.; Zhu, T. Influence study about water exchange on the taihu lake based on the water diversion project from the yangtze river to the taihu lake (wdyt). China Environ. Sci. 2020, 40, 375–382. [Google Scholar]
- Huang, Y.; Yu, M.; Lu, J.; Sun, Z.; Tian, H. Suitable ecological water level of the east lake dongting after the three gorges project operation. J. Lake Sci. 2020, 32, 417–427. [Google Scholar]
- Li, D.; Ye, B.; Hou, Z.; Chu, Z.; Zheng, B. Long-term performance and microbial distribution of a filed-scale storing multi-pond constructed wetland with ottelia acuminata for the treatment of non-point source pollution. J. Clean. Prod. 2020, 262, 121367. [Google Scholar] [CrossRef]
- Jalili, S.; Hamidi, S.A.; Ghanbari, R.N. Climate variability and anthropogenic effects on lake urmia water level fluctuations, northwestern iran. Hydrol. Sci. J. 2016, 61, 1759–1769. [Google Scholar] [CrossRef] [Green Version]
- Deus, D.; Gloaguen, R.; Krause, P. Water balance modeling in a semi-arid environment with limited in situ data using remote sensing in lake manyara, east african rift, tanzania. Remote Sens. 2013, 5, 1651–1680. [Google Scholar] [CrossRef] [Green Version]
- Gronewold, A.D.; Rood, R.B. Recent water level changes across earth's largest lake system and implications for future variability. J. Gt. Lakes Res. 2019, 45, 1–3. [Google Scholar] [CrossRef]
- Alifujiang, Y.; Abuduwaili, J.; Ma, L.; Samat, A.; Groll, M. System dynamics modeling of water level variations of lake issyk-kul, kyrgyzstan. Water 2017, 9, 989. [Google Scholar] [CrossRef] [Green Version]
- Xiao, K.; Griffis, T.J.; Baker, J.M.; Bolstad, P.V.; Erickson, M.D.; Lee, X.; Wood, J.D.; Hu, C.; Nieber, J.L. Evaporation from a temperate closed-basin lake and its impact on present, past, and future water level. J. Hydrol. 2018, 561, 59–75. [Google Scholar] [CrossRef]
- Vicuna, S.; Dracup, J.A. The evolution of climate change impact studies on hydrology and water resources in california. Clim. Change 2007, 82, 327–350. [Google Scholar] [CrossRef]
- Senent-Aparicio, J.; Lopez-Ballesteros, A.; Perez-Sanchez, J.; Jose Segura-Mendez, F.; Pulido-Velazquez, D. Using multiple monthly water balance models to evaluate gridded precipitation products over peninsular spain. Remote Sens. 2018, 10, 922. [Google Scholar] [CrossRef] [Green Version]
- Pulido-Velazquez, D.; Renau-Prunonosa, A.; Llopis-Albert, C.; Morell, I.; Collados-Lara, A.; Senent-Aparicio, J.; Baena-Ruiz, L. Integrated assessment of future potential global change scenarios and their hydrological impacts in coastal aquifers—A new tool to analyse management alternatives in the plana oropesa-torreblanca aquifer. Hydrol. Earth Syst. Sci. 2018, 22, 3053–3074. [Google Scholar] [CrossRef] [Green Version]
- Collados-Lara, A.; Pulido-Velazquez, D.; Pardo-Iguzquiza, E. An integrated statistical method to generate potential future climate scenarios to analyse droughts. Water 2018, 10, 1224. [Google Scholar] [CrossRef] [Green Version]
- Gudmundsson, L.; Bremnes, J.B.; Haugen, J.E.; Engen-Skaugen, T. Technical note: Downscaling rcm precipitation to the station scale using statistical transformations—A comparison of methods. Hydrol. Earth Syst. Sci. 2012, 16, 3383–3390. [Google Scholar] [CrossRef] [Green Version]
- Hellstrom, C.; Chen, D.L.; Achberger, C.; Raisanen, J. Comparison of climate change scenarios for sweden based on statistical and dynamical downscaling of monthly precipitation. Clim. Res. 2001, 19, 45–55. [Google Scholar] [CrossRef]
- Yan, C.; Lu, X.; Zhao, X. Protection and sustainable utilisation of water resources in lake erhai basin. Int. J. Sustain. Dev. World 2008, 15, 357–361. [Google Scholar] [CrossRef]
- Wu, A.; Zhao, Y.; Qi, L.; Zhu, G.; Chen, F.; Liang, Y.; Cao, T.; Zhong, W. Faster response to water level increase facilitates salix cavaleriei survival in lake erhai. J. Freshw. Ecol. 2019, 34, 469–480. [Google Scholar] [CrossRef] [Green Version]
- Ni, Z.; Wang, S.; Zhao, H.; Jiao, L.; Jin, X. The sources of organic carbon and nitrogen of suspended particulate matter in inflow river of erhai lake. Res. Environ. Sci. 2013, 26, 287–293. [Google Scholar]
- Wang, S.; Zhang, L.; Ni, L.; Zhao, H.; Jiao, L.; Yang, S.; Guo, L.; Shen, J. Ecological degeneration of the erhai lake and prevention measures. Environ. Earth Sci. 2015, 74, 3839–3847. [Google Scholar] [CrossRef]
- Ni, Z.; Wang, S.; Zhang, M. Sediment amino acids as indicators of anthropogenic activities and potential environmental risk in erhai lake, southwest china. Sci. Total Environ. 2016, 551, 217–227. [Google Scholar] [CrossRef]
- Ye, X.; Liu, F.; Zhang, Z.; Xu, C. Quantifying the impact of compounding influencing factors to the water level decline of china's largest freshwater lake. J. Water Res. Plan. Man. 2020, 146, 05020006. [Google Scholar] [CrossRef]
- Wang, D.; Hejazi, M. Quantifying the relative contribution of the climate and direct human impacts on mean annual streamflow in the contiguous united states. Water Resour. Res. 2011, 47. [Google Scholar] [CrossRef] [Green Version]
- Ye, B.; Chu, Z.; Wu, A.; Hou, Z.; Wang, S. Optimum water depth ranges of dominant submersed macrophytes in a natural freshwater lake. PLoS ONE 2018, 13, e0193176. [Google Scholar] [CrossRef] [Green Version]
- Mann, H.B. Nonparametric tests against trend. Econometrica 1945, 13, 245–259. [Google Scholar] [CrossRef]
- Hamed, K.H. Exact distribution of the mann-kendall trend test statistic for persistent data. J. Hydrol. 2009, 365, 86–94. [Google Scholar] [CrossRef]
- Gan, T.Y. Hydroclimatic trends and possible climatic warming in the canadian prairies. Water Resour. Res. 1998, 34, 3009–3015. [Google Scholar] [CrossRef]
- Liu, C.M.; Zheng, H.X. Changes in components of the hydrological cycle in the yellow river basin during the second half of the 20th century. Hydrol. Process. 2004, 18, 2337–2345. [Google Scholar] [CrossRef]
- Liu, J.; Fang, S.; Feng, Q.; Wu, Z.; Han, L.; Huang, J.; Bai, X. Analysis of regime shift in taihu lake based on mann-kendall method. China Environ. Sci. 2015, 35, 3707–3713. [Google Scholar]
- Stan, C.; Marmureanu, L.; Marin, C.; Cristescu, C.P. Investigation of multifractal cross-correlation surfaces of hurst exponents for some atmospheric pollutants. Phys. A 2020, 545, 123799. [Google Scholar] [CrossRef]
- Ying, H.; Zhang, H.; Zhao, J.; Shan, Y.; Zhang, Z.; Guo, X.; Wu, R.; Deng, G. Effects of spring and summer extreme climate events on the autumn phenology of different vegetation types of inner mongolia, china, from 1982 to 2015. Ecol. Indic. 2020, 111, 105974. [Google Scholar] [CrossRef]
- Xu, W.; Liang, Y.; Cushman, J.H.; Chen, W. Ultrafast dynamics modeling via fractional brownian motion run with mittag-leffler clock in porous media. Int. J. Heat Mass Tran. 2020, 151, 119402. [Google Scholar] [CrossRef]
- Bu, Q.; Bi, J.; Yuan, Z.; Huang, L. R/s method for evaluation of pollutant time series in environmental quality assessment. Water Sci. Eng. 2008, 1, 82–88. [Google Scholar]
- Ren, L.; Song, C.; Wu, W.; Guo, M.; Zhou, X. Reservoir effects on the variations of the water temperature in the upper yellow river, china, using principal component analysis. J. Environ. Manag. 2020, 262, 110339. [Google Scholar] [CrossRef]
- He, K.; Gao, W.; Duan, C.; Zhu, Y.; Pan, Y.; Liu, C.; Zhang, W.; Yang, G. Water level variation and its driving factors in lake dianchi, fuxian and yangzong during 1988–2015. J. Lake Sci. 2019, 31, 1379–1390. [Google Scholar]
- Hill, N.M.; Keddy, P.A.; Wisheu, I.C. A hydrological model for predicting the effects of dams on the shoreline vegetation of lakes and reservoirs. Environ. Manag. 1998, 22, 723–736. [Google Scholar] [CrossRef]
- Riis, T.; Hawes, I. Relationships between water level fluctuations and vegetation diversity in shallow water of new zealand lakes. Aquat. Bot. 2002, 74, 133–148. [Google Scholar] [CrossRef]
- White, M.S.; Xenopoulos, M.A.; Hogsden, K.; Metcalfe, R.A.; Dillon, P.J. Natural lake level fluctuation and associated concordance with water quality and aquatic communities within small lakes of the laurentian great lakes region. Hydrobiologia 2008, 613, 21–31. [Google Scholar] [CrossRef]
- Fu, H.; Yuan, G.; Cao, T.; Zhong, J.; Zhang, X.; Guo, L.; Zhang, M.; Ni, L.; Wang, S. Succession of submerged macrophyte communities in relation to environmental change in lake erhai over the past 50 years. J. Lake Sci. 2013, 25, 854–861. [Google Scholar]
- Carmignani, J.R.; Roy, A.H. Ecological impacts of winter water level drawdowns on lake littoral zones: A review. Aquat. Sci. 2017, 79, 803–824. [Google Scholar] [CrossRef] [Green Version]
- Stendera, S.; Adrian, R.; Bonada, N.; Canedo-Argueelles, M.; Hugueny, B.; Januschke, K.; Pletterbauer, F.; Hering, D. Drivers and stressors of freshwater biodiversity patterns across different ecosystems and scales: A review. Hydrobiologia 2012, 696, 1–28. [Google Scholar] [CrossRef]
- Strayer, D.L.; Findlay, S.E.G. Ecology of freshwater shore zones. Aquat. Sci. 2010, 72, 127–163. [Google Scholar] [CrossRef] [Green Version]
- Winfield, I.J. Fish in the littoral zone: Ecology, threats and management. Limnologica 2004, 34, 124–131. [Google Scholar] [CrossRef] [Green Version]
- Vilhena, L.C.; Hillmer, I.; Imberger, J. The role of climate change in the occurrence of algal blooms: Lake burragorang, australia. Limnol. Oceanogr. 2010, 55, 1188–1200. [Google Scholar] [CrossRef]
- Bhele, U.; Öğlü, B.; Tuvikene, A.; Bernotas, P.; Silm, M.; Järvalt, A.; Agasild, H.; Zingel, P.; Seller, S.; Timm, H.; et al. How long-term water level changes influence the spatial distribution of fish and other functional groups in a large shallow lake. J. Great Lakes Res. 2020, 46, 813–823. [Google Scholar] [CrossRef]
- Zhang, S.; Wang, R.; Shen, J.; Ma, C.; Xiao, W. Potential relationship of wintering waterbirds community composition and water-level fluctuation in lake erhai. Asian J. Ecotoxicol. 2018, 13, 143–148. [Google Scholar]
- Chen, X.; Qian, X.; Li, X.; Wei, Z.; Hu, S. Long-term trend of eutrophication state of lake erhai in 1988 -2013 and analyses of its socio-economic drivers. J. Lake Sci. 2018, 30, 70–78. [Google Scholar]
- Lin, S.; Shen, S.; Zhou, A.; Lyu, H. Sustainable development and environmental restoration in lake erhai, china. J. Clean. Prod. 2020, 258, 120758. [Google Scholar] [CrossRef]
- Song, S.; Xu, Y.P.; Wu, Z.F.; Deng, X.J.; Wang, Q. The relative impact of urbanization and precipitation on long-term water level variations in the yangtze river delta. Sci. Total Environ. 2019, 648, 460–471. [Google Scholar] [CrossRef] [PubMed]
- Yin, X.A.; Yang, Z.F. A method to assess the alteration of water-level-fluctuation patterns in lakes. Procedia Environ. Sci. 2012, 13, 2427–2436. [Google Scholar] [CrossRef] [Green Version]
- Coops, H.; Hosper, S.H. Water-level management as a tool for the restoration of shallow lakes in the netherlands. Lake Reserv. Manag. 2002, 18, 293–298. [Google Scholar] [CrossRef] [Green Version]
- Johnson, N.; Revenga, C.; Echeverria, J. Ecology—Managing water for people and nature. Science 2001, 292, 1071–1072. [Google Scholar] [CrossRef]
- Tang, C.; Yi, Y.; Yang, Z.; Zhang, S.; Liu, H. Effects of ecological flow release patterns on water quality and ecological restoration of a large shallow lake. J. Clean. Prod. 2018, 174, 577–590. [Google Scholar] [CrossRef]
- Meador, M.R. Inter-basin water transfer: Ecological concerns. Fisheries 1992, 17, 17–22. [Google Scholar] [CrossRef]
- Cramer, W.; Guiot, J.; Fader, M.; Garrabou, J.; Gattuso, J.; Iglesias, A.; Lange, M.A.; Lionello, P.; Carmen Llasat, M.; Paz, S.; et al. Climate change and interconnected risks to sustainable development in the mediterranean. Nat. Clim. Change 2018, 8, 972–980. [Google Scholar] [CrossRef] [Green Version]
- Tramblay, Y.; Koutroulis, A.; Samaniego, L.; Vicente-Serrano, S.M.; Volaire, F.; Boone, A.; Le Page, M.; Carmen Llasat, M.; Albergel, C.; Burak, S.; et al. Challenges for drought assessment in the mediterranean region under future climate scenarios. Earth Sci. Rev. 2020, 210, 103348. [Google Scholar] [CrossRef]
Figure 1.
Distribution diagram of the study area of Erhai Lake. The map shows the location of Erhai Lake and Erhai Basin in China, and the distribution of the major inflow and outflow sources of Erhai Lake.
Figure 1.
Distribution diagram of the study area of Erhai Lake. The map shows the location of Erhai Lake and Erhai Basin in China, and the distribution of the major inflow and outflow sources of Erhai Lake.

Figure 2.
Principal component method—Flowchart of weight analysis.

Figure 3.
Interannual precipitation changes in the Erhai Basin. Period I represent 1990–2004, and period II represent 2004–2019.
Figure 3.
Interannual precipitation changes in the Erhai Basin. Period I represent 1990–2004, and period II represent 2004–2019.

Figure 4.
Interannual changes in the inflow and outflow of Erhai Lake. (a) and (b) are the inflow and outflow of Erhai Lake during 1990–2019, respectively. Note that outflow includes the Xi’er River outflow and the diversion of water from Erhai Lake into Binchuan County.
Figure 4.
Interannual changes in the inflow and outflow of Erhai Lake. (a) and (b) are the inflow and outflow of Erhai Lake during 1990–2019, respectively. Note that outflow includes the Xi’er River outflow and the diversion of water from Erhai Lake into Binchuan County.

Figure 5.
The Mann-Kendall (M-K) method test of the inflow (a) and outflow (b) in Erhai Lake. A positive UF value indicates that the water level is increasing, and a negative UF value indicates that the water level is decreasing. If the UF and UB curves intersect between the significance values, it indicates that the water level has changed suddenly at this time.

Figure 6.
Detection of abrupt changes and variation trend of annual average water level in Erhai Lake (EL) from the perspective of the M-K method (a) and cumulative anomaly method (b). If the cumulative anomaly curve shows an upward trend, it indicates that the cumulative anomaly value increases and the discrete data are greater than the mean value; on the contrary, the inflection point indicated that it is less than the mean value. The inflection point of the trend is the mutation point.

Figure 7.
Interannual variations of water level during 1990–2019 (a) and hydrometeorological changes (b) in 2013–2019.
Figure 7.
Interannual variations of water level during 1990–2019 (a) and hydrometeorological changes (b) in 2013–2019.

Figure 8.
Seasonal (a) and interannual (b) variations in the water level in Erhai Lake. The standard seasonal division is as follows: spring is from March to May, summer is from June to August, autumn is from September to November, and winter is from December to February.
Figure 8.
Seasonal (a) and interannual (b) variations in the water level in Erhai Lake. The standard seasonal division is as follows: spring is from March to May, summer is from June to August, autumn is from September to November, and winter is from December to February.

Figure 9.
Mechanism of the variation of the water level in the lake. In the figure, “+” is for increase; “–” is for decrease.
Figure 9.
Mechanism of the variation of the water level in the lake. In the figure, “+” is for increase; “–” is for decrease.


Table 1.
List of basic analysis data.
| Category | Variable | Series Length | Data sources |
|---|---|---|---|
| Water level data | Water level | 1990–2019 | Erhai Conservation Administration |
| Water volume data | Outflow Inflow Water transfer | 1990–2019 | Erhai Conservation Administration |
| Meteorological data | Precipitation Evaporation | 1990–2019 | http://www.escience.gov.cn |
| Social development data | Cultivated land area Basin population | 1990–2019 | Statistical Yearbook of Yunnan Province Statistical Yearbook of Dali Prefecture |
Table 2.
Elements of water balance in Erhai Lake.
| Period | Precipitation (108 m3) | Evaporation (108 m3) | Inflow (108 m3) | Outflow (108m3) | Water Supplement Project (108 m3) | Storage Variation (108 m3) | |
|---|---|---|---|---|---|---|---|
| Xi’er River | Water Transfer Project | ||||||
| 1990–2004 | 2.83 | 3.31 | 8.51 | 7.55 | 0.54 | -- | −0.06 |
| 2005–2019 | 2.39 | 3.04 | 4.55 | 3.10 | 0.76 | 0.08 | 0.12 |
| 1990–2019 | 2.61 | 3.18 | 6.53 | 5.32 | 0.65 | 0.04 | 0.03 |
Note: all indicators are represented by period averages.
Table 3.
Factor load matrix and index weighting at different stages.
| Period | Index | Factor 1 | Factor2 | Comprehensive Score | Weight (%) |
|---|---|---|---|---|---|
| 1990–2004 | Inflow | 0.123 | 0.954 | 0.321 | 17.52% |
| Outflow | 0.483 | 0.759 | 0.399 | 21.61% | |
| Precipitation | −0.249 | 0.913 | 0.188 | 10.25% | |
| Evaporation | 0.922 | 0.080 | 0.324 | 17.68% | |
| Cultivated area | 0.888 | −0.003 | 0.289 | 15.74% | |
| Population | 0.950 | 0.071 | 0.331 | 18.03% | |
| 2005–2019 | Inflow | 0.937 | 0.150 | 0.370 | 20.12% |
| Outflow | 0.853 | −0.114 | 0.259 | 14.11% | |
| Precipitation | 0.914 | 0.120 | 0.352 | 19.18% | |
| Evaporation | −0.077 | 0.720 | 0.196 | 10.65% | |
| Cultivated area | 0.380 | 0.794 | 0.376 | 20.48% | |
| Population | −0.013 | 0.935 | 0.284 | 15.46% | |
| 1990–2019 | Inflow | 0.924 | 0.209 | 0.385 | 18.31% |
| Outflow | 0.816 | 0.430 | 0.406 | 19.34% | |
| Precipitation | 0.941 | −0.106 | 0.306 | 14.54% | |
| Evaporation | −0.039 | 0.868 | 0.221 | 10.54% | |
| Cultivated area | 0.689 | 0.546 | 0.393 | 18.69% | |
| Population | 0.533 | 0.743 | 0.391 | 18.59% |
Publisher’s Note: MDPI stays neutral with regard to jurisdictional claims in published maps and institutional affiliations. |
© 2020 by the authors. Licensee MDPI, Basel, Switzerland. This article is an open access article distributed under the terms and conditions of the Creative Commons Attribution (CC BY) license (http://creativecommons.org/licenses/by/4.0/).
Share and Cite
MDPI and ACS Style
Wu, H.; Wang, S.; Wu, T.; Yao, B.; Ni, Z. Assessing the Influence of Compounding Factors to the Water Level Variation of Erhai Lake. Water 2021, 13, 29. https://doi.org/10.3390/w13010029
AMA Style
Wu H, Wang S, Wu T, Yao B, Ni Z. Assessing the Influence of Compounding Factors to the Water Level Variation of Erhai Lake. Water. 2021; 13(1):29. https://doi.org/10.3390/w13010029
Chicago/Turabian StyleWu, Huaxin, Shengrui Wang, Tao Wu, Bo Yao, and Zhaokui Ni. 2021. "Assessing the Influence of Compounding Factors to the Water Level Variation of Erhai Lake" Water 13, no. 1: 29. https://doi.org/10.3390/w13010029
Note that from the first issue of 2016, this journal uses article numbers instead of page numbers. See further details here.