Characterizing the Variation of Dissolvable PAHs in Receiving Water in a Reclaimed Water Irrigation Region

1
Key Laboratory of Water Cycle and Related Land Surface Processes, Institute of Geographic Sciences and Natural Resources Research, Beijing 100101, China
2
College of Resources and Environment, University of Chinese Academy of Sciences, Beijing 100049, China
3
Beijing Water Science & Technology Institute, Beijing 100048, China
*
Author to whom correspondence should be addressed.
Water 2020, 12(10), 2766; https://doi.org/10.3390/w12102766
Submission received: 29 August 2020
/
Revised: 25 September 2020
/
Accepted: 27 September 2020
/
Published: 4 October 2020
(This article belongs to the Section Water, Agriculture and Aquaculture)
Abstract
:Long-term wastewater and reclaimed water irrigation systems constitute the major processes in local water circulation, which concomitantly introduce plenty of undesirable substances that can threaten water quality, ecosystem functions and human health. At the Southeast Reclaimed Water Irrigation Region (SRWIR) of Beijing, wastewater irrigation was adopted from 1969 to 2002, and second-treated effluents (reclaimed water) has been used thereafter. Polycyclic aromatic hydrocarbons (PAHs) were the most ubiquitously detected contaminant in wastewater and reclaimed water and are reported to be carcinogenic. Hence, we measured the concentrations of dissolved sixteen United States Environmental Protection Agency (USEPA) priority PAHs in surface water and groundwater at the SRWIR to characterize their spatial and temporal variations, and to clarify the role of reclaimed water to natural water. The concentration of 16 individual PAHs in reclaimed water, rivers and groundwater varied from 339.4 to 636.2 ng/L, 359.1 to 3,435.0 ng/L and 216.5 to 488,205.2 ng/L, respectively. The lower aromatic rings of PAHs prevailed in aquatic environments rather than the higher ones. Thereinto, naphthalene was the predominant isomer within the highest concentration reached to 486,600 µg/L. The groundwater samples had higher PAHs concentrations at Tongzhou district which attributed to the higher vulnerability of aquifer. Additionally, strong correlations between PAHs and total nitrogen, nitrate, dissolved oxygen and electrical conductivity suggested those potential factors affecting the photo degradation and/or biodegradation of PAHs. The relationship identified between PAHs concentrations and physical and chemical indices would help us to enhance the understanding migration and transformation of PAHs spatially and temporally, enable us to assess the potential risks of the environmental pollutants to aquatic organisms and human water supplies.
1. Introduction
Water quality impairment has been received increased attentions globally over last decades, in particular for these long-standing wastewater and reclaimed water irrigation regions [1,2,3]. In northern China, several cities (e.g., Beijing, Tianjin and Shijiazhuang) have the experience of using reclaimed water for agriculture irrigation and have made great efforts on its potential effects of contaminants in reclaimed water applications [4]. Not only inorganic pollutants, but also organic contaminants such as persistent organic pollutants (POPs) in the reclaimed water have caused focused attention. During the past decades, over 10 million organic compounds have been discovered or synthesized [5], and polycyclic aromatic hydrocarbons (PAHs) are recognized as the most ubiquitously detected POPs in the natural aquatic environment owing to their propensity for persistence, semi-volatility and long-range transport [6,7,8,9]. Qiao et al. 2014 calculated that 68.5% of PAHs in receiving rivers were contributed from wastewater treatment plants.
Except for natural sources (e.g., vegetation fires, synthetic production of organisms and degradation of biomass), PAHs mainly generate from petrogenic sources (e.g., unburned oil and coal) and pyrogenic sources (e.g., the incomplete combustion of fossil fuels) [7,10]. Once PAHs are released, they can migrate horizontally to anywhere (air, soils, rivers, estuarine waters and oceans) via seasonal cycling of deposition, evaporation and e-waste exports [11,12]. The accumulated PAHs on the soil surface can percolate downward into deeper soils and reach the aquifer, reducing the availability of groundwater for long periods because of their toxicity and suspected carcinogenicity and mutagenicity. In order to prioritize regulation of organic contaminants in the aqueous environment, information on distribution and magnitude of PAHs contamination is needed [9].
However, there have been limited studies characterizing the variations of PAHs and identifying the potential influences of reclaimed water in reclaimed water irrigation regions. The Southeast Reclaimed Water Irrigation Region (SRWIR) of Beijing is the most typical reclaimed water irrigation region in China. Long-term wastewater and reclaimed water irrigation were adopted since 1969, but the irrigation application had been decreased dramatically since 2015 according to reports of the Water Science & Technology Institute. Therefore, we collected the reclaimed water and the receiving water, including river and groundwater in 2013 and 2014 before the reclaimed water irrigation dropped. The sixteen USEPA priority PAHs, including naphthalene (Nap), acenaphthylene (Acy), acenaphthene(Ace), fluorene (Fluo), phenanthrene (Phe), anthracene (Ant), fluoranthene (Flua), pyrene (Pyr), benz[a]anthracene (BaA), chrysene (Chry), benzo[b]fluoranthene (BbF), benzo[k]-fluoranthene (BkF), benzo[a]pyrene (BaP), indeno[1,2,3-cd]pyrene (IcdP), dibenz[a,h]anthracene (DBA), and benzo[g,h,i]perylene (BghiP) were measured and analyzed [13]. The objectives of this study were: (1) to explore the spatial and temporal pattern of dissolved PAHs concentration in receiving water; (2) to reveal the role of reclaimed water in PAHs introduction at SRWIR. Our results can help extend our understanding about reclaimed water application and could help local authorities with governance responsibility for water supplies.
2. Materials and Methods
2.1. Study Area
The Southeast Reclaimed Water Irrigation Region (SRWIR) is located in the northwestern part of the North China Plain (NCP) between 39°53′ to 39°53′ N and 116°23′ to 116°53′ E, occupying an area of 789 km2 (Figure 1). The SRWIR is characterized by an alluvial plain, which is surrounded by the Yongding River to the west, the Chaobai River to the northeast, the metropolis area to the north, and the capacious NCP to the south. The area belongs to a temperate continental climate region, with an average annual potential evaporation of 1180 mm, which far exceeds the annual precipitation of 580 mm.
In SRWIR, wastewater irrigation was adopted from 1969 to 2002, and secondarily-treated wastewater (reclaimed water) has been used thereafter. Irrigation has decreased dramatically since 2015 according to reports of the Water Science & Technology Institute. The urban river system belongs to a regional combined natural river and wastewater drainage system flowing along a west-east and northwest-southeast direction, that mainly transfers rainfall and effluents from Waste Water Treatment Plants (WWTPs) for agricultural irrigation and river landscaping. The Xiaotaihou River and Xinfeng Rivers flow into the Liangshui River, Han River and Chai River receiving Huangcun WWTP effluents then converge into Feng River, and Fenggangjian River finally runs into the Beiyun River (Figure 1).
2.2. Sampling and Analysis
A total of 45 groundwater samples, 25 river water samples, and five reclaimed water samples were collected over two campaigns in September 2013 and October 2014, separately. Reclaimed water samples were directly collected at the outlet of the Gaobeidian (GBD), Xiaohongmen (XHM), and Huangcun (HC) WWTPs. Surface waters were sampled from rivers and a wetland (YGZ). Groundwater samples YZG20, YGZ40 and YGZ60 were collected from 20, 40 and 60 m depth aquifers in one site, the same as groundwater samples of Fengheying (FHY20, FHY40 and FHY80). Most groundwater samples were taken from monitoring wells (depth < 80 m) located 10 m away from the rivers. TZS/G and DXS/G represents surface water and groundwater sited at Tongzhou and Daxing administrated districts, separately. Meanwhile, TG1 and TZG-01 represent groundwater collections in 2013 and 2014, respectively (Figure 1). Air temperature, humidity and monthly precipitation in September 2013 were 21 °C, 65.13% and 71 mm, which significantly greater than those in October 2014 (14.2 °C, 64.97% and 12 mm).
Physical and chemical parameters, including pH, dissolve oxygen (DO) content, oxidation reduction potential (ORP), and electrical conductivity (EC) were measured in the field using a portable meter (Single-Input Multi-Parameter Digital Meter, HACH 40D, Loveland, CO, USA) which was calibrated in the lab. Samples were collected in pre-rinsed polyethylene bottles, tightly capped and filtered through 0.45 µm membrane filters until major ions analysis. Cations (Na+, K+, Ca2+,and Mg2+) were determined by inductively coupled plasma optical emission spectrometry (ICP-OES, Optima 5300 DV, Perkin-Elmer, Chatsworth, CA, USA), and anions (F, Cl, SO42−,and NO3−) were determined by ion chromatograph (ICS-2100, Dionex, Sunnyvale, CA, USA) at the Institute of Geographic Sciences and Natural Resources Research, Chinese Academy of Sciences (IGSNRR, CAS). HCO3− and CO32− were measured by titration with 0.02 N sulfuric acid, and methyl orange endpoint titration was used with the final pH of 4.2–4.4. Total nitrogen (TN) content was determined by ultraviolet spectrophotometry. Correlation analyses were performed using statistical software package (SPSS 21.0, IBM, Armonk, NY, USA) to reveal the links between individual variables and assess the key seasonal controlling factors.
Sixteen US EPA priority PAHs in dissolved phase in the reclaimed water, surface water and groundwater were analyzed. Two groups were categorized by target ring numbers, the LMW PAHs (Nap, Acy, Ace, Fluo, Phe and Ant) and HMW PAHs (Flua, Pyr, BaA, Chry, BbF, BkF, Bap, IcdP, DBA and BghiP).
Four L water samples were stored in amber glass bottles, then transported to the laboratory. Water samples were extracted using HLB and Supelclean™ ENVI-18 SPE column (1 g, 6 mL, Supelco, Bellefonte, PA, USA) at a flow rate of 6 mL/min. Then HLB and ENvi-18 SPE column were eluted with 10 mL of methanol/methylene chloride (1:9, v/v), and n-hexane/methylene chloride (7:3, v/v), respectively. The mixed eluent was dehydrated with an anhydrous sodium sulfate, and elution fractions were concentrated to 0.2 mL under the rotary evaporate and a nitrogen stream, successively. The internal standards (100 ng) of phenanthrene-D10 and acenaphthene-D10 were added to each sample and kept 4 °C before instrumental analysis.
PAHs were detected by an 7890A GC trap 5795C mass spectrometry (GC-MS) system (Agilent, Palo Alto, CA, USA) equipped with a DB-5MS fused silica capillary column (30 m length × 0.25 mm diameter × 0.25 µm film thickness). Samples were injected in split-less mode. The carrier gas was helium and kept at a constant flow rate of 1 mL/min. The oven temperature was programmed at 40 °C initially for 2 min, then increased to 290 °C at a rate of 5 °C /min (held for 4 min). Ionization was performed in the selective ion monitoring (SIM) mode.
Quality control samples were prepared and analyzed for each batch of samples. Surrogate standards were added to each of the samples, and the recoveries were between 60% and 119%. The relative standard deviation between duplicates was below 10% for each individual PAH. Method quantification limits (MQLs) were determined based on the concentration 10 times of the signal to noise ratio (Table 1).
3. Results and Discussion
3.1. Characteristics of Dissolved PAHs Concentration in Rivers and Aquifers
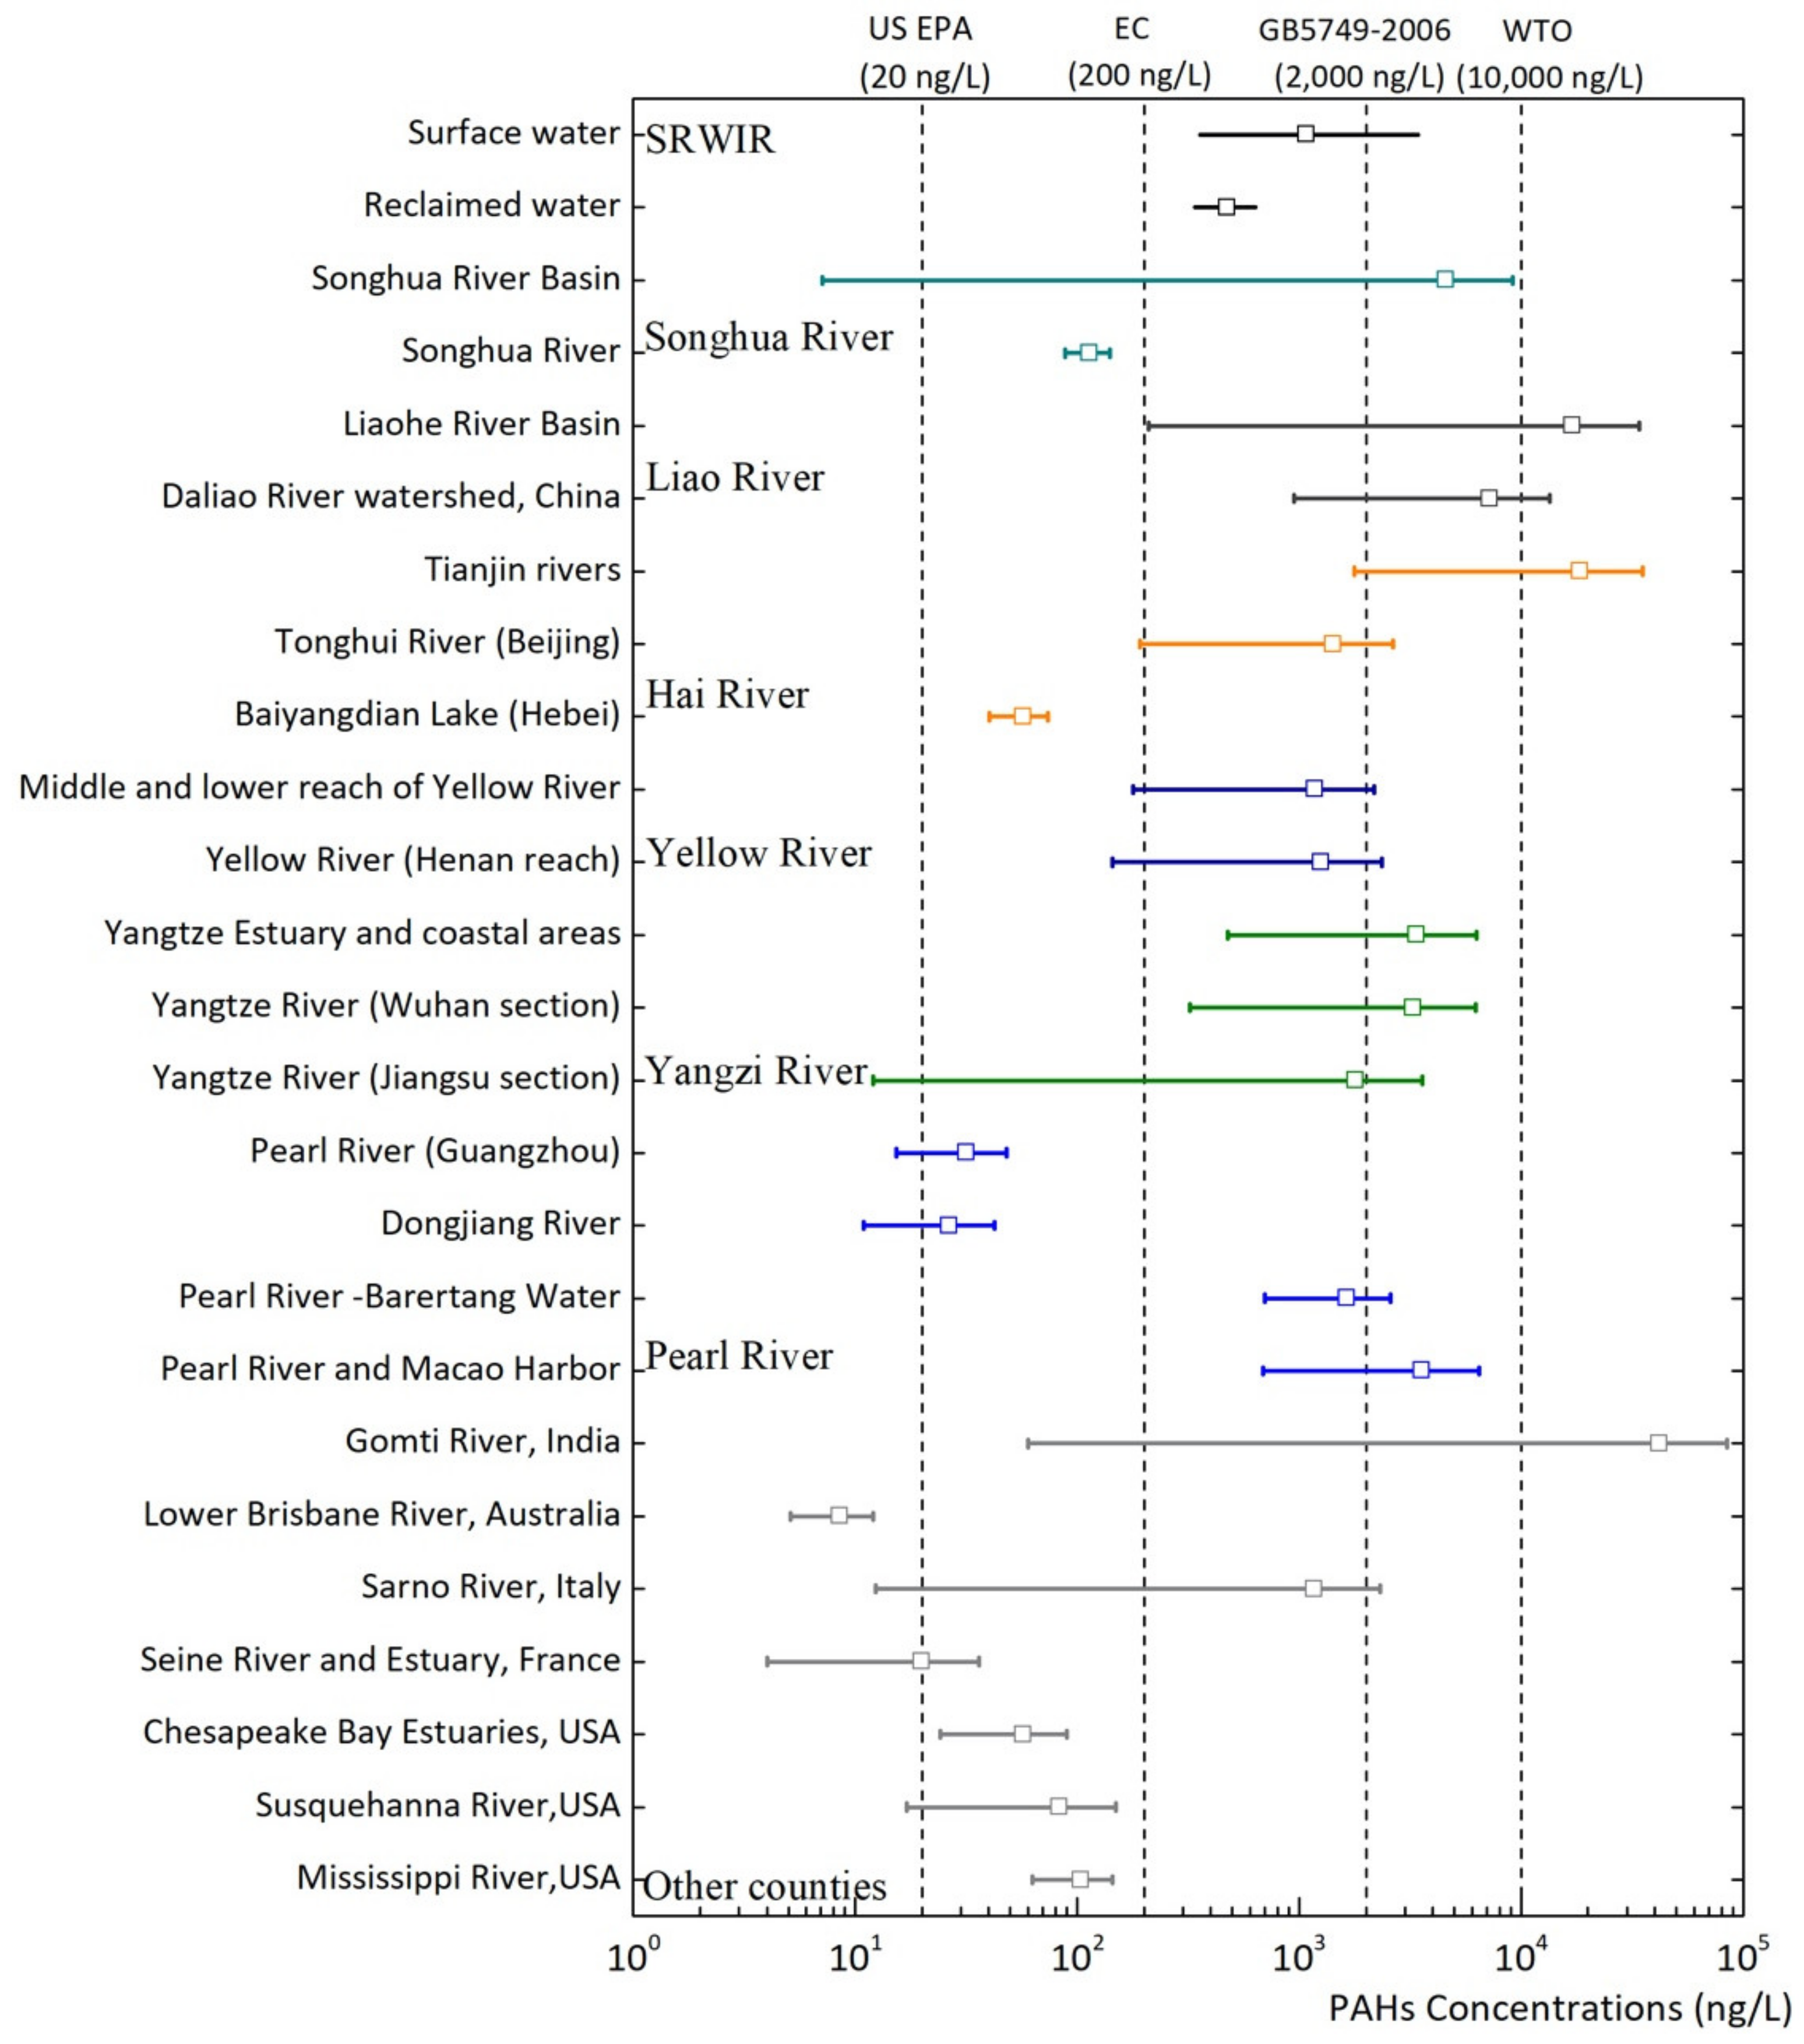
Generally, 55–70% PAHs can be removed through particle absorption, precipitation, biological degradation and/or volatilization in WWTPs [14,15], but dissolved PAHs concentrations in the range of 339.4 to 636.2 ng/L with an average value of 475.7 ng/L still could be detected in WWTPs effluents in our study. The values in receiving rivers varied between 359.1 to 3435.0 ng/L, with an average value of 1077.9 ng/L. During 2010–2015, similar PAHs concentrations (321–834 ng/L) were reported in effluent and urban rivers in Beijing [15,16]. In our study, the concentrations of PAHs in reclaimed water and rivers exhibited a higher level compared with those detected in USA, France, Italy and Australia [7,17,18,19,20,21], but lower than in India [22]. Additionally, the concentrations of PAHs in Songhua River [23], Liao River [24], Yangzi River [25] and Peal River [26,27] in China showed similar but wider ranges than those in SRWIR, which can be attributed to the elevated concentrations of PAHs in their tributaries and reaches (Figure 2).
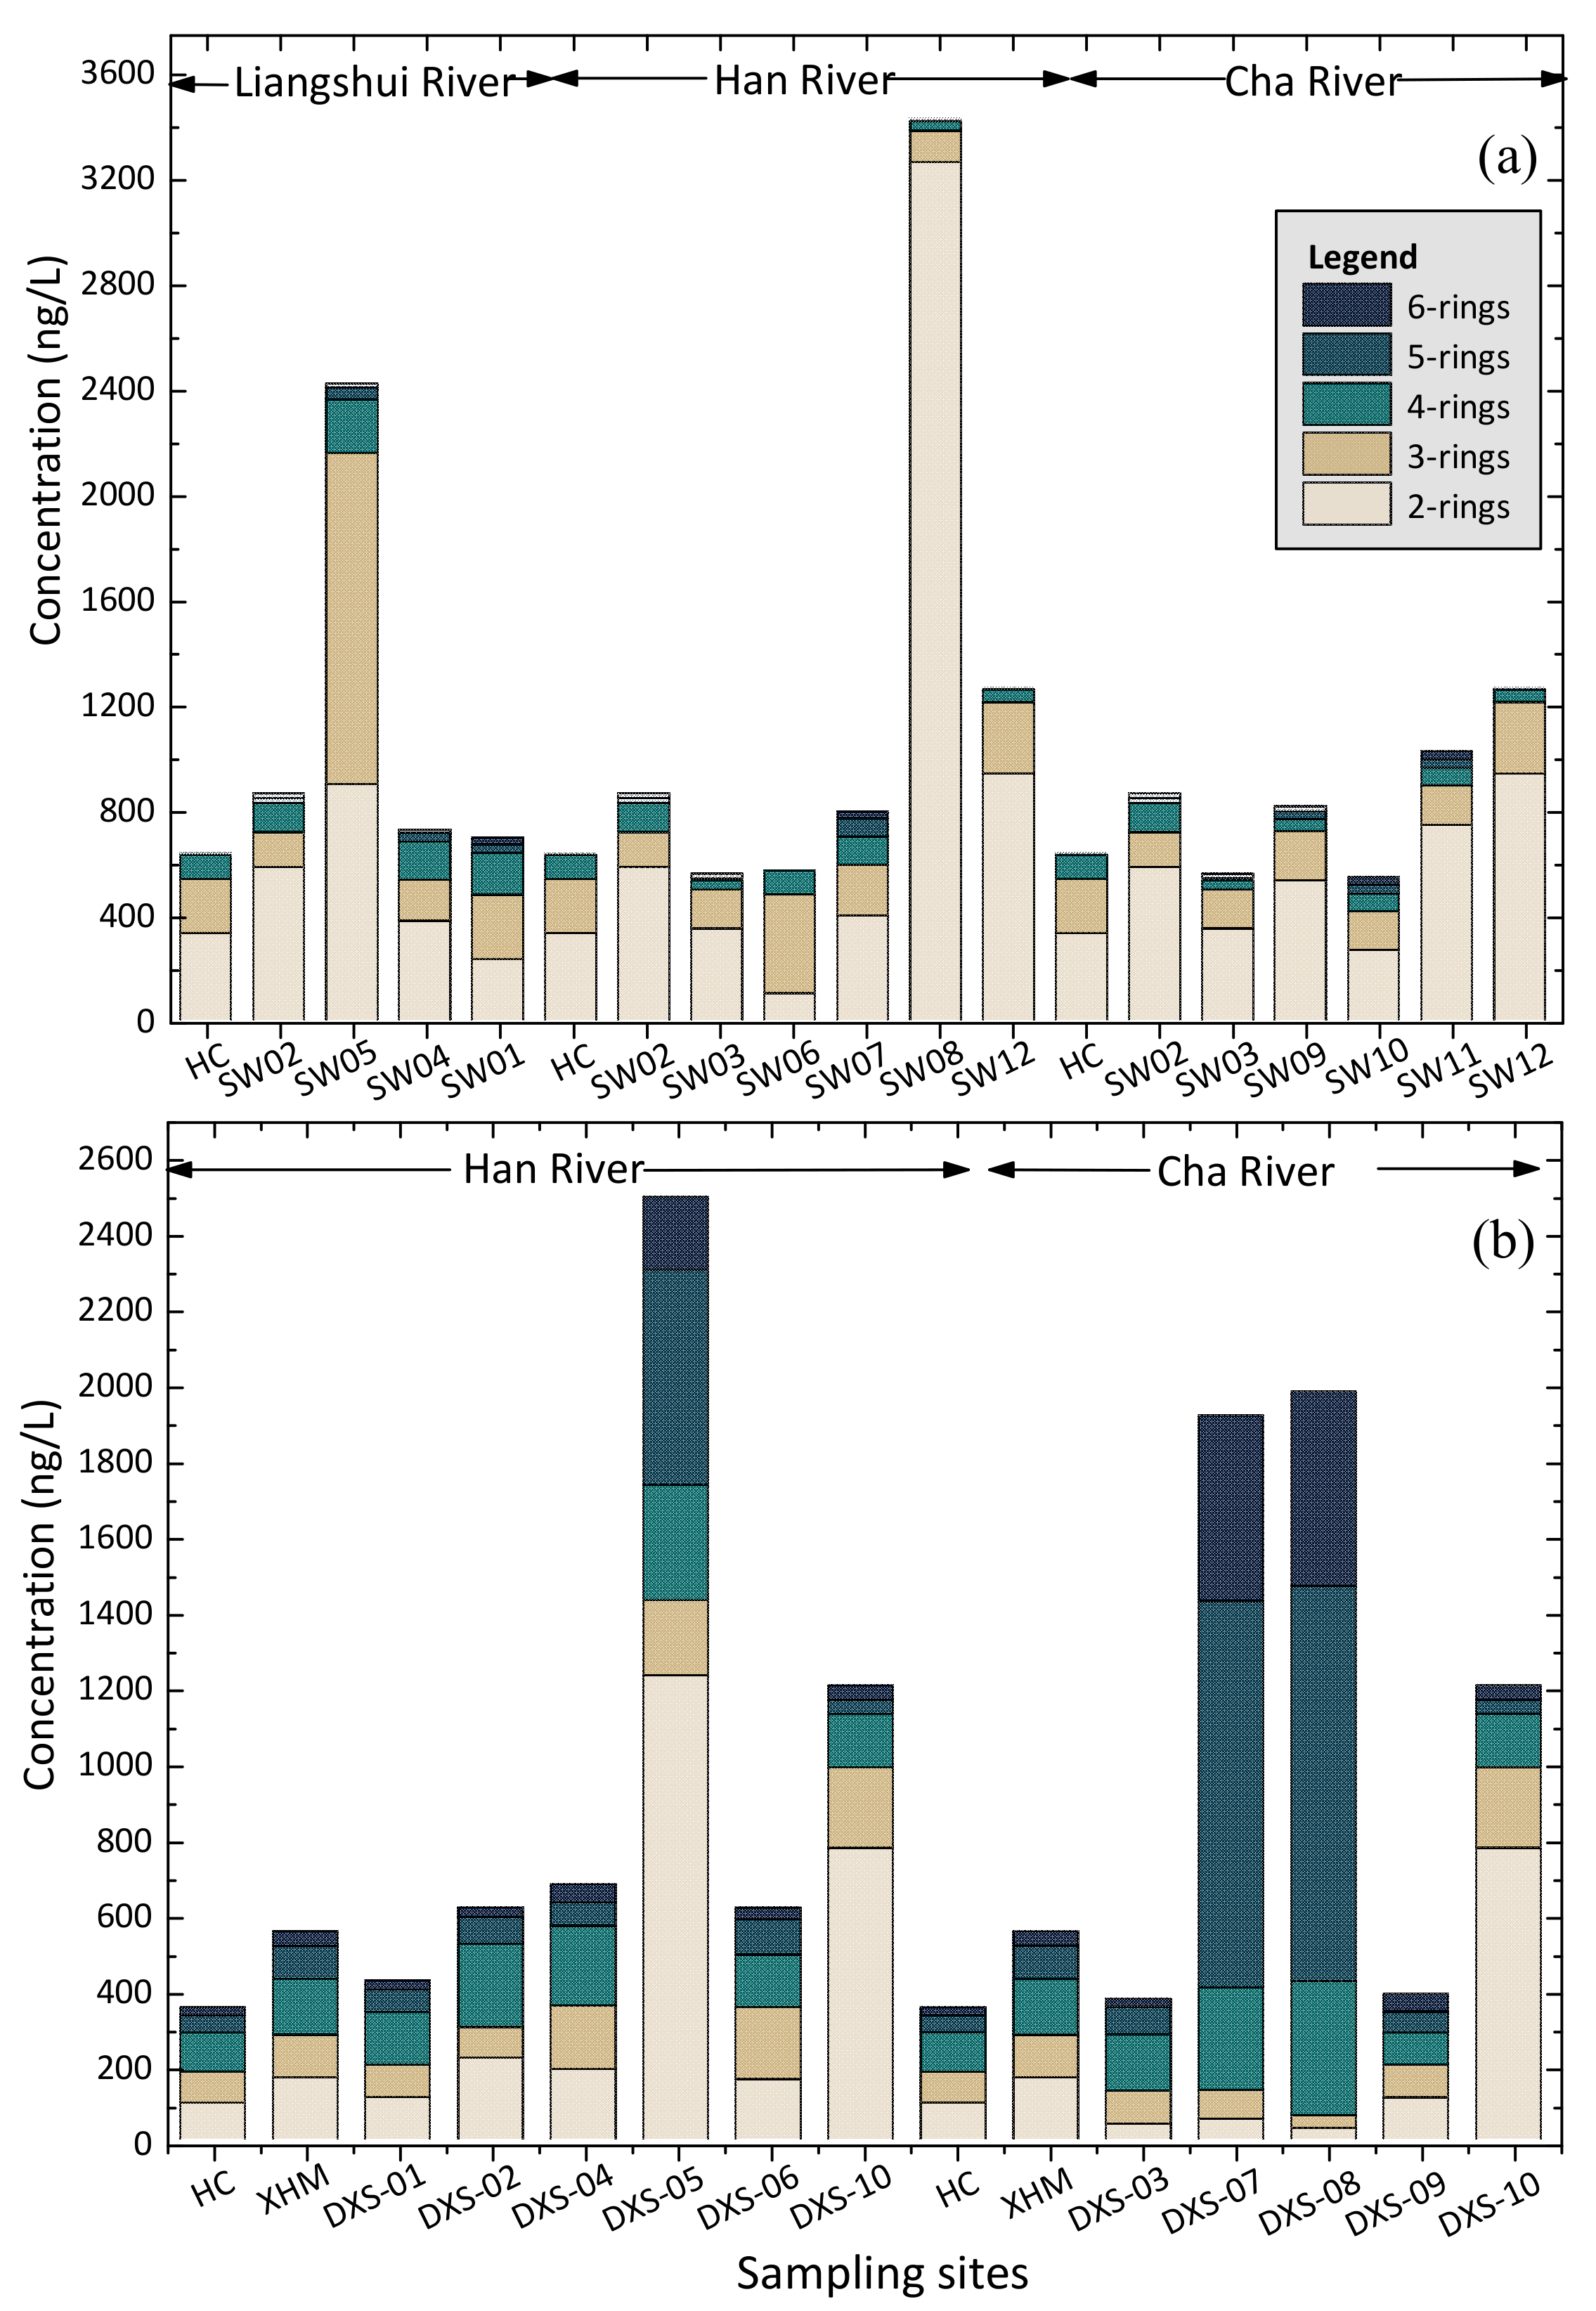
WWTP effluent was indicated to be the main contributor of PAHs to river systems in Beijing [28], the concentration of PAHs downstream would be lower than upstream or reclaimed water drainage, but in our study, similar and/or higher values of PAHs were detected downstream (SW08, SW12 and DXS-10 in Figure 3) suggesting other PAHs input sources. According to the PAHs isomeric ratios method, the higher levels of LMWs PAHs at sites SW05 and SW08 were mostly caused by biomass and coal combustion in September 2013, while in October 2014, the high concentrations of HMWs PAHs at sites DXS-05, DXS-07 and DXS-08 were caused by petroleum and/or petroleum combustion source inputs.
PAHs concentrations were remarkably high in aquifers, within a range of 216.5 to 488,205.2 ng/L and an average value of 38,010.2 ng/L, exceeding the drinking water standards of the United States Environmental Protection Agency (USEPA, 20 ng/L) and the European Commission (EC, 200 ng/L). In comparison, the concentration of PAHs decreased by one order of magnitude following the sequence of groundwater, surface water and reclaimed water.
Excluding the samples that had PAHs concentrations over 10,000 ng/L, groundwater collected at Tongzhou district showed significant higher concentrations than samples from Daxing district. According to the lower vulnerability of the aquifer in the Daxing district associated with its thicker unsaturated zone [29], we can conclude that the hydrogeologic conditions lead to the spatial heterogeneity of dissolved PAHs. Overall, groundwater PAHs contamination was on a localized scale. Higher concentrations were mainly detected at the middle areas where farmland was historically heavily irrigated with wastewater, including water samples of YGZ20/40/60, TZG08, TZG09, TZG11, TG4, TG5, TG7’, TG8, TG9, TG12, TG16 and DG8 (Figure 4).
In general, heavily PAHs-contaminated aquifers were discovered at in landfill zones, the ∑16PAHs ranged from 10 to 2190 µg/L [30], the coal gasification plant varied from N.D. to 17.3 mg/L [31], and the telecom base station within diesel spills had highest PAHs concentration of 41.03 mg/L [32]. However, the studied groundwater from the reclaimed water irrigation region had even higher PAHs concentrations than other regions, such as the Yellow River watershed (8.51–402.84 ng/L) [33,34], Hutuo River (0.01–92.15 ng/L) [13], karst groundwater system (272–13,248 ng/L) in southwestern China [35,36], etc. This phenomenon may suggest some PAHs point source pollution.
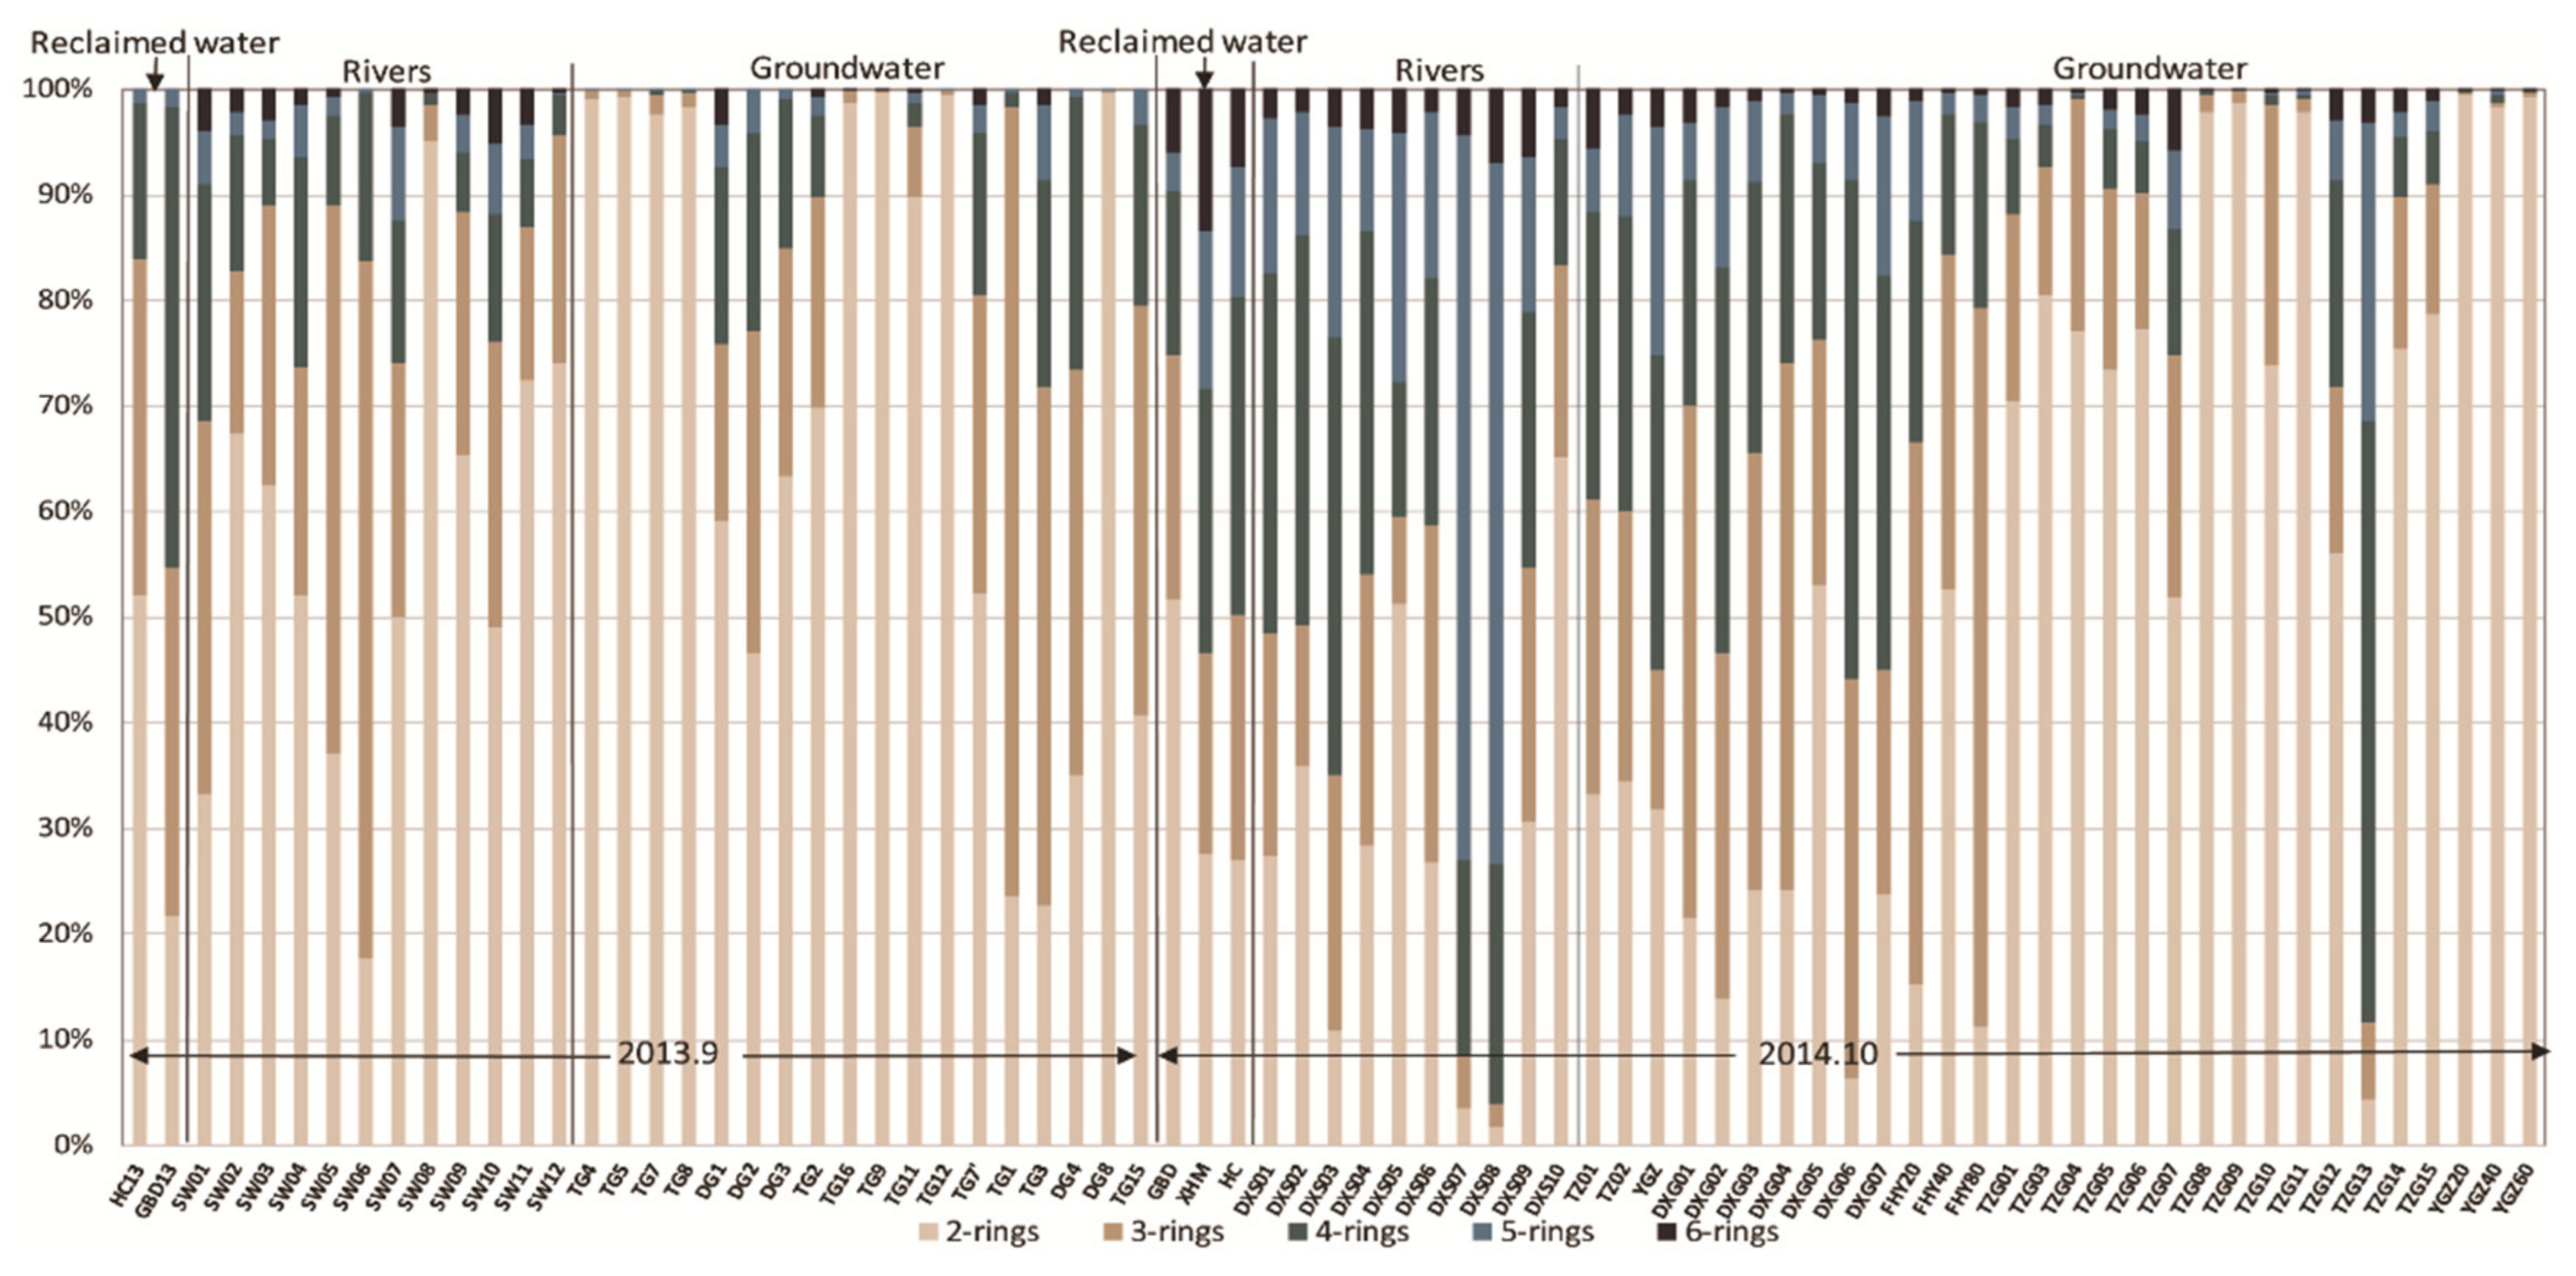
Overall, the mean concentrations of two ring, three ring, four ring and higher ring (5–6 rings) PAHs accounted for 36.0%, 26.1%, 25.8%, and 12.1% of the total PAHs in reclaimed water, 42.3%, 22.9%, 18.9%, 16% in surface water and 63.4%, 20.5%, 11.7%, 4.5% in groundwater (Figure 5 and Figure 6).
In reclaimed water, higher concentrations of four to six ring PAHs were observed compared with surface water because of a higher removal efficiency of LMW PAHs during treatment processes [15]. It was typical for surface water that LMW PAHs dominated over the HMW PAHs because HMW PAHs were prone to become absorbed on particles and sediments. A similar trend was also observed in groundwater in that LMW PAHs were prevailing and easily transported [37,38]. In soil profiles, HMW PAHs are more readily absorbed onto soil particles which could result in losses and downward migration of LMW PAHs into aquifers [39]. The dominant dissolved PAHs congener was naphthalene, especially in the aquifer loaded with a highest value of 486.6 µg/L in well TG9. The high amounts of naphthalene were found to inhibit cell growth [31]. A similar high concentration of 334 µg/L was also detected in piedmont alluvial-pluvial aquifers of Eastern China [40].
3.2. Temporal Variation of Dissolved PAHs
The concentration of dissolved PAHs varied from 216.5 to 488,205.2 ng/L with an average value of 42,462.5 ng/L in September 2013 and in a range of 274.8 to 127,636.9 ng/L in October 2014. In this study, concentrations of total PAHs and targeted PAHs in 10 pairs of surface water samples and 13 pairs of groundwater samples were evaluated by the T-test method (Table 2). The compared samples were collected from the same sites and wells in September 2013 and October 2014.
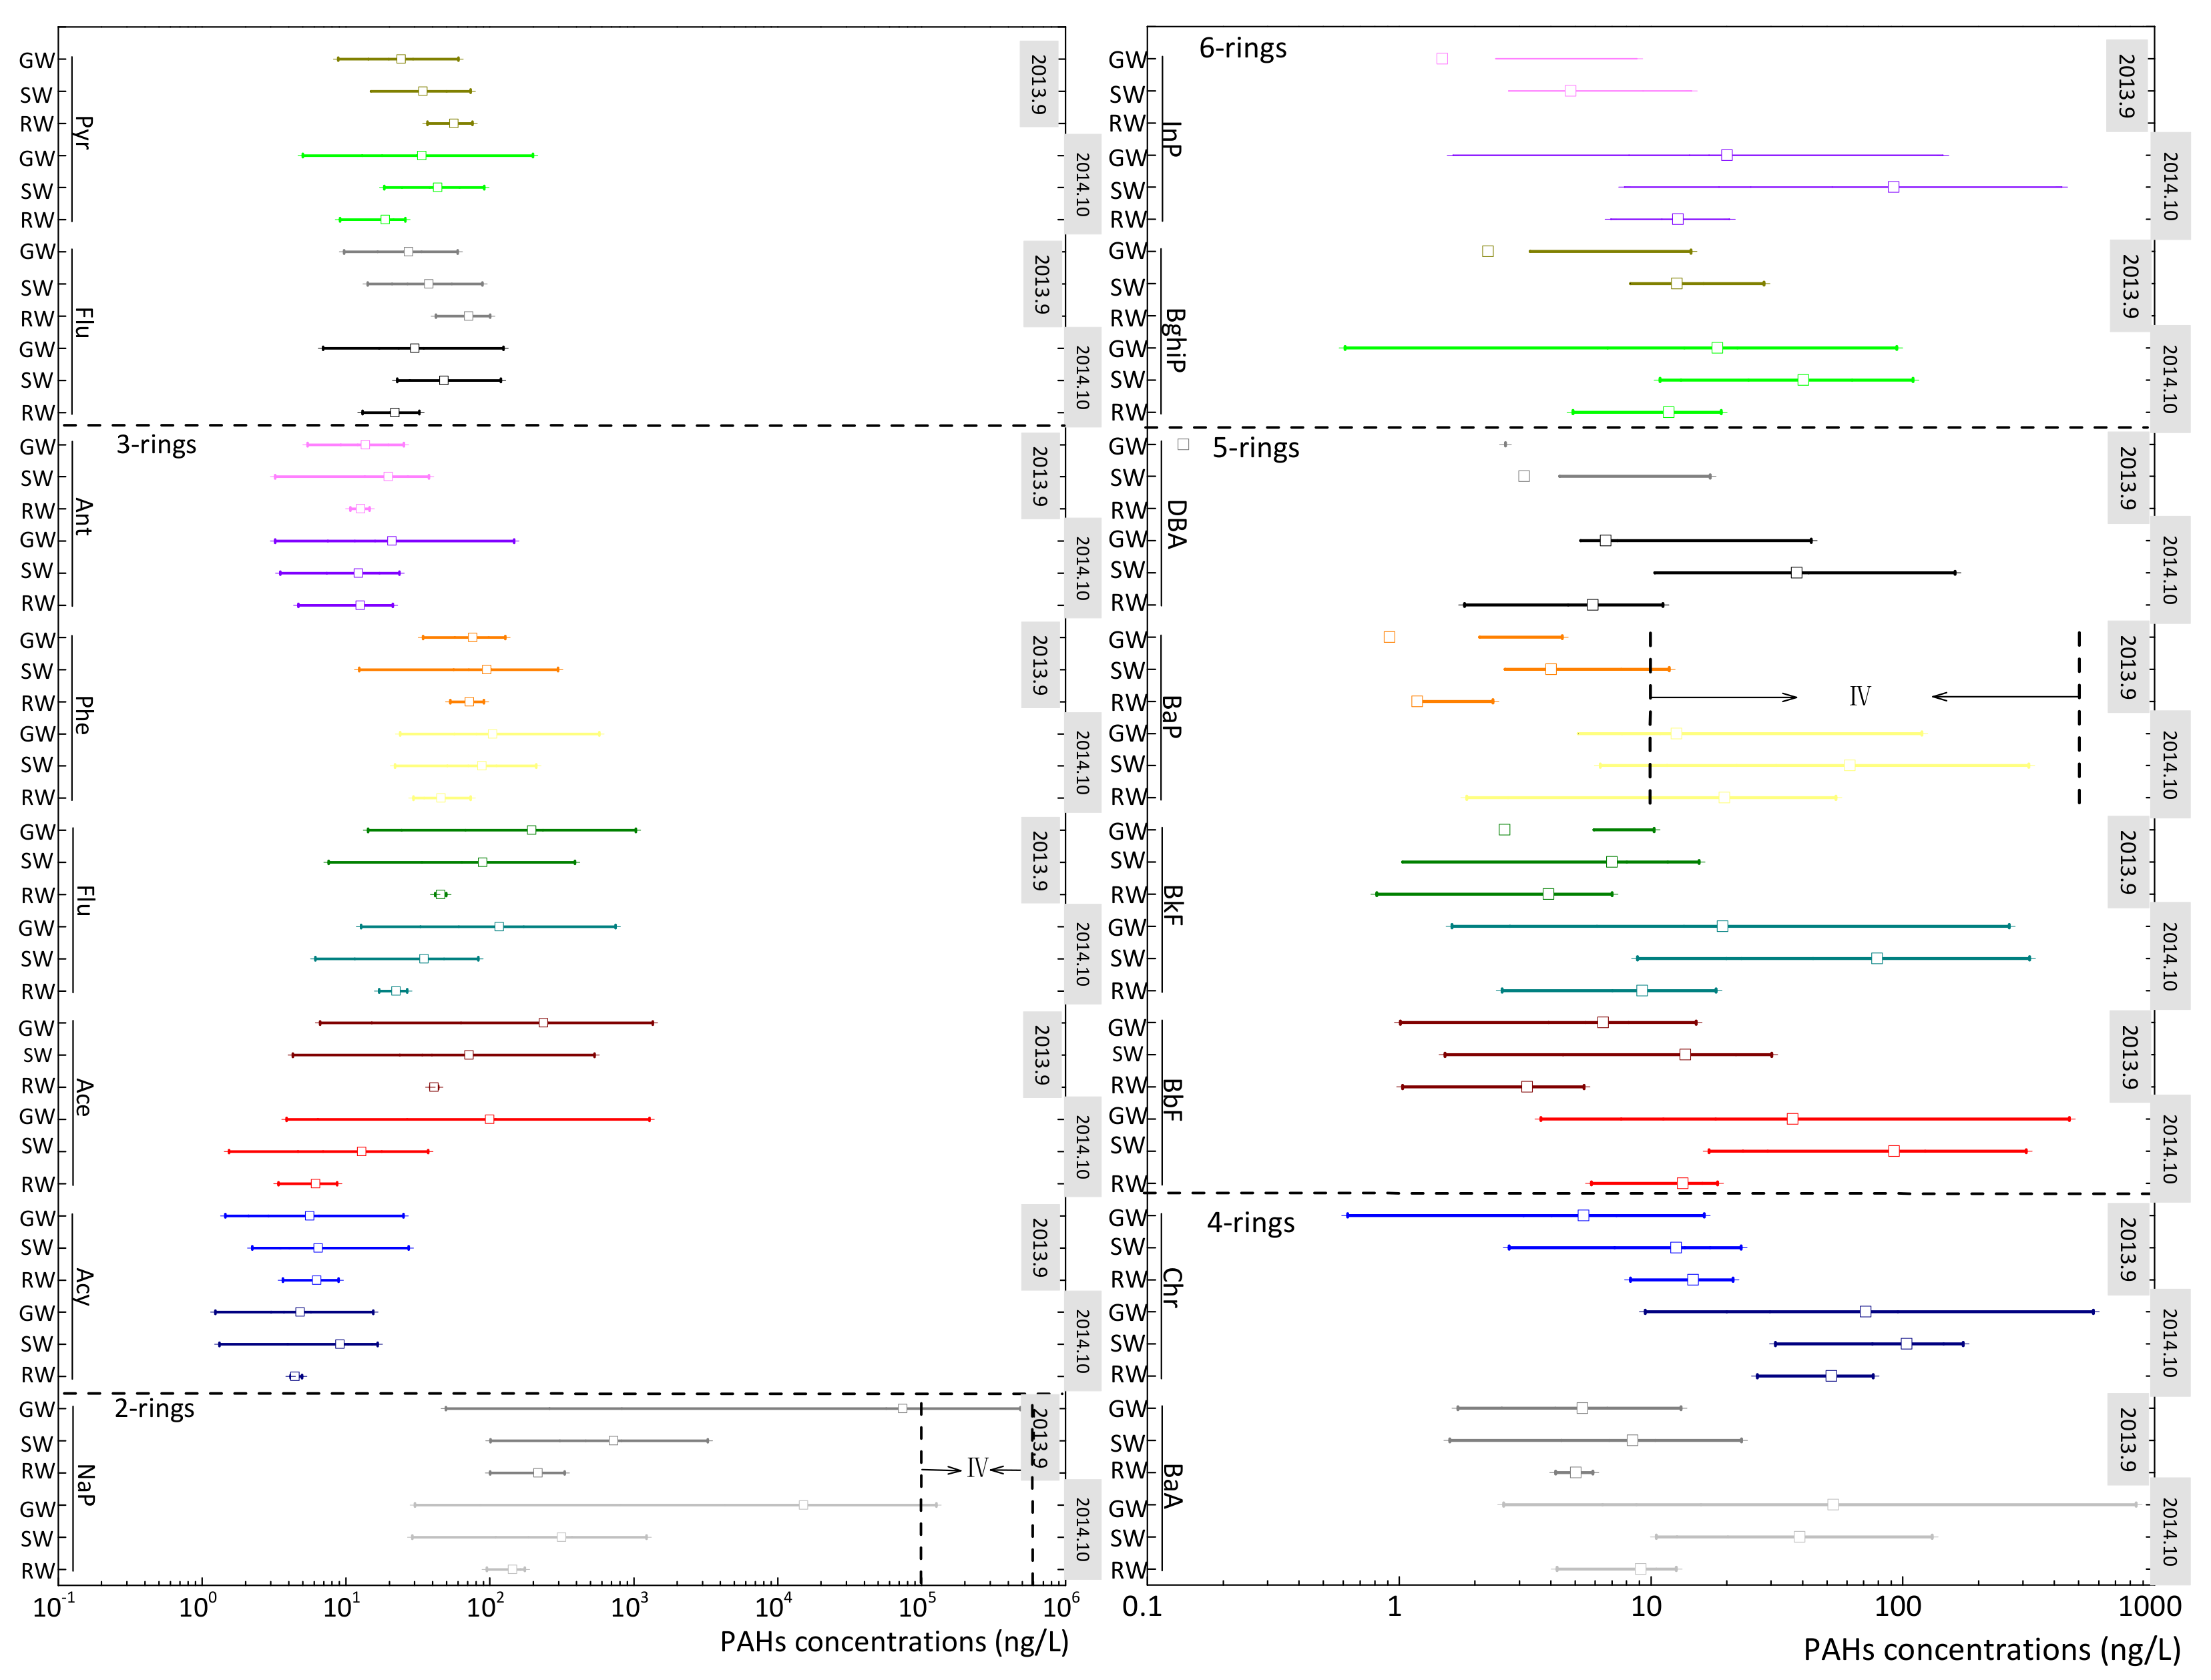
With respect to reclaimed water, no significant systematic differences of the measured mean ∑16PAHs concentrations was shown during the two sampleing periods, but Nap, Acy, Flu and Pyr (p < 0.01, p < 0.001, p < 0.01, p < 0.05) showed significantly higher contents in September 2013 than in October 2014, and higher concentrations of BaA, Chr, 5-ring and 6-ring PAHs were seen in October 2014. It was documented that the average air temperature (21.6 °C) in September 2013 was greatly higher than the 12.7 °C measured in October 2014, while rainfall and relative humidity showed no significant differences. Therefore, the higher target concentrations of Nap, Acy, Flu and Pyr may be attributed to the increasing water solubility of compounds at higher temperature, while the BaA, Chr were found to undergo net deposition, expect for during summer season [41]. Therefore, temporal variations of PAHs concentration are the consequence of multiple factors, including ambient temperature as well as the congeners’ physicochemical properties [42].
There was no significant variation (p > 0.05) observed between the mean ∑16PAHs content level in rivers in September 2013 (1142.3 ng/L) and in October 2014 (1019.5 ng/L), but significantly higher contents of 5-ring and 6-ring PAHs (p < 0.05) were observed in October 2014 (p < 0.001). The presence of high molecular weight PAHs in rivers during October 2014 might induced through untreated sewage input or other sources, such as atmospheric deposition and/or leakage from polluted sites.
In the shallow groundwater samples collected during September 2013, the concentrations of ∑16PAHs (74,666.4 ± 145,573.2 ng/L) were significantly (p < 0.01) higher than those (15,818.5 ± 32,354.9 ng/L) detected during October 2014. This disparity is mainly attributeed to significant variation in Nap. Compared with the Nap concentration in surface water, the level in groundwater increased by two orders of magnitude. Such a high concentration might indicate point pollution from gas stations or coking Nap plant, or artificial bypass routes through shallow wells [43].
3.3. Physio-Chemical Indices Associated with PAHs Concentration
Overall, the differences of PAHs concentration between two years samples can be derived from PAHs input sources and varied physio-chemical processes (adsorption, volatilization, photolysis, and chemical degradation, microbial degradation) [44]. Meanwhile, water environmental parameters (pH, oxygen, nutrients and chemical ions) might affect those PAHs transformation processes. Therefore, we conducted a correlation analysis between dissolved PAHs and water physical-chemical parameters (Table 3 and Table 4) to explore the potential factors affecting PAHs behavior.
DO concentrations ranging from 2.4 to 16.5 mg/L in October 2014 identified an aerobic environment. The negative correlation (−0.60) between DO content and 3-ring PAHs might suggest oxygen-consuming organic pollutants in the aerobic environment [45]. EC value and bicarbonate (HCO3−) showed similar correlations with PAHs, which correlated with 3-ring PAHs with a coefficient of 0.61 in October 2014 and correlated with 6-ring PAHs with a coefficient of −0.58 in September 2013 as shown in Table 3. These results support the conclusion that LWM PAHs (such as 3-ring PAHs) can be biodegraded more rapidly than HMW PAHs (such as 6-ring PAHs) [46,47], as the LWM PAHs degradation by-product, HCO3−, was probably increased [30]. It was reported that high salinity can accelerate the photodegradation of PAHs [48], but chloride as the representative ion of salinity, had a positive correlation with 2-ring PAHs and 3-ring PAHs (R2 = 0.52 and R2 = 0.82) in October 2014 for surface water, that might only manifest their coexistent sources. NO3- was negatively correlated with LMW PAHs during 2014 in surface water, which suggested LMW PAHs removal accompanied by nitrification. In September 2013, total PAHs, 2-ring PAHs, 3-ring PAHs in surface water (Table 3) and groundwater (Table 4) had a significant positive correlation with total nitrogen (TN). This was consistent with the results that the high concentration of LMW PAHs might need abundant availability of nutrients to support the microorganism activities to accelerate its own biodegradation [30].
The degradation rates of organic contaminants in aquifers was likely to be much lower than the half-lives rates reported in surface water, because of the limited microbial populations and activity, combining with restricted nutrient and oxygen availability in aquifers [43]. Significantly positive correlations between nitrate contents and HWM PAHs in groundwater were discovered (Table 4) during September 2013, can be explained that HMW PAHs were partly degraded by anaerobic nitrate-reducing bacteria [44].
3.4. The Influences of Reclaimed Water at Reclaimed Water Irrigation Region
The resistance of the PAHs from the reclaimed water makes them appropriate sewage markers. Under the long-term usage of wastewater and reclaimed water for irrigation and WWTPs effluent directly drain into rivers, the ubiquitous dissolved PAHs emphasize the important role of reclaimed water in introducing organic contaminants into aquatic environments. However, the PAHs-polluted river samples collected downstream from the WWTPs effluent emission points suggest the occurrence of unregulated sewage inputs and partial atmospheric deposition. In spite of the thick aquitards at Daxing district [49], the perennial infiltration of reclaimed water eventually reached the water table and degraded shallow groundwater quality. In particular, the high amounts of naphthalene increase the human health and ecotoxicological risks for household usage and environment. Therefore, even for the valuable efficacy as substitute water sources, reclaimed water for irrigation and landscape at SRWIR had led to local water quality deterioration. In recent years, reclaimed water from wastewater treatment plants (WWTPs) or mixtures with groundwater were still used to irrigate crop in Spain [50], Mexico [51], Iran [52], which should pay more attention to improving their WWTPs effluent quality and strict usage pattern.
4. Conclusions
During two collection campaigns at SRWIR, the dissolved PAHs concentrations in reclaimed water, rivers and groundwater increased by one order of magnitude in the range of 339.4 to 636.2 ng/L, 359.1 to 3435.0 ng/L, and 216.5 to 488,205.2 ng/L, respectively. LMW PAHs were prevailing because HMW PAHs were prone to be absorbed on organic matter and sediments. Owing to the thicker unsaturated zone at Daxing district, groundwater collected at Daxing district showed significantly lower PAHs concentrations than samples collected at Tongzhou district. Significant disparity of PAHs concentrations was detected during two years, which can likely be attributed to the difference of climate conditions (e.g., temperature and precipitation). Point-source pollution, untreated sewage input or other sources might cause the distinct concentrations of targeted PAHs. The significant correlation of PAHs with total nitrogen, nitrate, dissolved oxygen and electrical conductivity (EC) suggested these nutrients and physiochemical indices could have effects on the photodegradation and/or biodegradation of PAHs. PAHs in rivers are mainly sourced from reclaimed water, with occasional untreated wastewater discharge, while, long term irrigation using reclaimed water plays the major role in introducing the PAHs to the aquifer. The heavily polluted groundwater of TG9 was probably caused by leakage from gas stations or coking Nap plants, or artificial bypass routes through shallow wells. Understanding the spatial and temporal distribution of PAHs in the Southeast Reclaimed Water Irrigation Region (SRWIR) and the potential factors influencing PAHs levels in surface water and groundwater receptors are required to assess the potential risk and for efficient water management.
Author Contributions
Conceptualization, Y.W. and X.S.; methodology, B.L.; formal analysis, Y.W.; investigation, Y.M. and L.Y.; writing—original draft preparation, Y.W.; writing—review and editing, B.L., Y.M. and L.Y.; supervision, X.S.; project administration, X.S.; funding acquisition, X.S. All authors have read and agreed to the published version of the manuscript.
Funding
This research was funded by NATIONAL NATURAL SCIENCE FOUNDATION OF CHINA, grant number No. 41730749.
Conflicts of Interest
The authors declare no conflict of interest.
References
- Li, J.; Fu, J.; Zhang, H.; Li, Z.; Ma, Y.; Wu, M.; Liu, X. Spatial and seasonal variations of occurrences and concentrations of endocrine disrupting chemicals in unconfined and confined aquifers recharged by reclaimed water: A field study along the Chaobai River, Beijing. Sci. Total Environ. 2013, 450, 162–168. [Google Scholar] [CrossRef] [PubMed]
- Li, Z.; Xiang, X.; Li, M.; Ma, Y.P.; Wang, J.H.; Liu, X. Occurrence and risk assessment of pharmaceuticals and personal care products and endocrine disrupting chemicals in reclaimed water and receiving groundwater in China. Ecotoxicol. Environ. Saf. 2015, 119, 74–80. [Google Scholar] [CrossRef]
- Ma, W.; Nie, C.; Chen, B.; Cheng, X.; Lun, X.; Zeng, F. Adsorption and biodegradation of three selected endocrine disrupting chemicals in river-based artificial groundwater recharge with reclaimed municipal wastewater. J. Environ. Sci. 2015, 31, 154–163. [Google Scholar] [CrossRef] [PubMed]
- Wang, Y.; Song, X.; Li, B.; Ma, Y.; Zhang, Y.; Yang, L.; Bu, H.; Holm, P.E. Temporal variation in groundwater hydrochemistry driven by natural and anthropogenic processes at a reclaimed water irrigation region. Hydrol. Res. 2018, 49, 1652–1668. [Google Scholar] [CrossRef] [Green Version]
- Loganathan, B.G.; Lam, K.S. Global Contamination Trends of Persistent Organic Chemicals; CRC Press: Boca Raton, FL, USA, 2012. [Google Scholar]
- Chen, L.; Jin, S.; Liu, Y.; Liu, F. Presence of Semi-Volatile Organic Contaminants in Shallow Groundwater of Selected Regions in China. Ground Water Monit. R. 2014, 34, 33–43. [Google Scholar] [CrossRef]
- Han, D.; Currell, M.J. Persistent organic pollutants in China’s surface water systems. Sci. Total Environ. 2017, 580, 602–625. [Google Scholar] [CrossRef] [PubMed]
- Weihong, D.; Wei, X.; Xiaosi, S.; Chuanlei, W.; Zhipeng, C.; Yuyu, W. Micro-organic Contaminants in Groundwater in China. Hydrogeol. J. 2018, 26, 1351–1369. [Google Scholar]
- Manamsa, K.; Crane, E.; Stuart, M.; Talbot, J.; Lapworth, D.; Hart, A. A national-scale assessment of micro-organic contaminants in groundwater of England and Wales. Sci. Total Environ. 2016, 568, 712–726. [Google Scholar] [CrossRef] [Green Version]
- Turner, R.E.; Overton, E.B.; Meyer, B.M.; Miles, M.S.; Hooper-Bui, L. Changes in the concentration and relative abundance of alkanes and PAHs from the Deepwater Horizon oiling of coastal marshes. Mar. Pollut. Bull. 2014, 86, 291–297. [Google Scholar] [CrossRef]
- Wania, F.; Mackay, D. Tracking the distribution of persistent organic pollutants. Environ. Sci. Technol. 1996, 30, A390–A396. [Google Scholar] [CrossRef]
- Breivik, K.; Armitage, J.M.; Wania, F.; Sweetman, A.J.; Jones, K.C. Tracking the Global Distribution of Persistent Organic Pollutants Accounting for E-Waste Exports to Developing Regions. Environ. Sci. Technol. 2016, 50, 798–805. [Google Scholar] [CrossRef] [PubMed] [Green Version]
- Wang, J.; Zhao, Y.; Sun, J.; Zhang, Y.; Liu, C. The distribution and sources of polycyclic aromatic hydrocarbons in shallow groundwater from an alluvial-diluvial fan of the Hutuo River in North China. Front. Earth Sci. 2019, 13, 33–42. [Google Scholar] [CrossRef]
- Ozaki, N.; Takamura, Y.; Kojima, K.; Kindaichi, T. Loading and removal of PAHs in a wastewater treatment plant in a separated sewer system. Water Res. 2015, 80, 337–345. [Google Scholar] [CrossRef] [PubMed]
- Qiao, M.; Qi, W.; Liu, H.; Qu, J. Occurrence, behavior and removal of typical substituted and parent polycyclic aromatic hydrocarbons in a biological wastewater treatment plant. Water Res. 2014, 52, 11–19. [Google Scholar] [CrossRef]
- Qiao, M.; Bai, Y.; Cao, W.; Huo, Y.; Zhao, X.; Liu, D.; Li, Z. Impact of secondary effluent from wastewater treatment plants on urban rivers: Polycyclic aromatic hydrocarbons and derivatives. Chemosphere 2018, 211, 185–191. [Google Scholar] [CrossRef]
- Zhang, G.; Li, J.; Cheng, H.; Li, X.; Xu, W.; Jones, K.C. Distribution of organochlorine pesticides in the northern South China Sea: Implications for land outflow and air-sea exchange. Environ. Sci. Technol. 2007, 41, 3884–3890. [Google Scholar] [CrossRef]
- Gustafson, K.E.; Dickhut, R.M. Gaseous Exchange of Polycyclic Aromatic Hydrocarbons across the Air−Water Interface of Southern Chesapeake Bay. Environ. Sci. Technol. 1997, 31, 1623–1629. [Google Scholar] [CrossRef]
- Fernandes, M.B.; Sicre, M.A.; Boireau, A.; Tronczynski, J. Polyaromatic hydrocarbon (PAH) distributions in the Seine River and its estuary. Mar. Pollut. Bull. 1997, 34, 857–867. [Google Scholar] [CrossRef]
- Montuori, P.; Triassi, M. Polycyclic aromatic hydrocarbons loads into the Mediterranean Sea: Estimate of Sarno River inputs. Mar. Pollut. Bull. 2012, 64, 512–520. [Google Scholar] [CrossRef] [Green Version]
- Shaw, M.; Tibbetts, I.R.; Muller, J.F. Monitoring PAHs in the Brisbane River and Moreton Bay, Australia, using semipermeable membrane devices and EROD activity in yellowfin bream, Acanthopagrus australis. Chemosphere 2004, 56, 237–246. [Google Scholar] [CrossRef]
- Malik, A.; Verma, P.; Singh, A.K.; Singh, K.P. Distribution of polycyclic aromatic hydrocarbons in water and bed sediments of the Gomti River, India. Environ. Monit. Assess. 2011, 172, 529–545. [Google Scholar] [CrossRef] [PubMed]
- Wang, T.; Khim, J.S.; Chen, C.; Naile, J.E.; Lu, Y.; Kannan, K.; Park, J.; Luo, W.; Jiao, W.; Hu, W.; et al. Perfluorinated compounds in surface waters from Northern China: Comparison to level of industrialization. Environ. Int. 2012, 42, 37–46. [Google Scholar] [CrossRef] [PubMed]
- Guo, W.; He, M.; Yang, Z.; Lin, C.; Quan, X.; Wang, H. Distribution of polycyclic aromatic hydrocarbons in water, suspended particulate matter and sediment from Daliao River watershed, China. Chemosphere 2007, 68, 93–104. [Google Scholar] [CrossRef] [PubMed]
- Feng, C.; Xia, X.; Shen, Z.; Zhou, Z. Distribution and sources of polycyclic aromatic hydrocarbons in Wuhan section of the Yangtze River, China. Environ. Monit. Assess. 2007, 133, 447–458. [Google Scholar] [CrossRef]
- Luo, X.J.; Mai, B.X.; Yang, Q.S.; Fu, J.M.; Sheng, G.Y.; Wang, Z.S. Polycyclic aromatic hydrocarbons (PAHs) and organochlorine pesticides in water columns from the Pearl River and the Macao harbor in the Pearl River Delta in South China. Mar. Pollut. Bull. 2004, 48, 1102–1115. [Google Scholar] [CrossRef] [PubMed]
- Li, H.; Ma, H.; Lydy, M.J.; You, J. Occurrence, seasonal variation and inhalation exposure of atmospheric organophosphate and pyrethroid pesticides in an urban community in South China. Chemosphere 2014, 95, 363–369. [Google Scholar] [CrossRef]
- Qi, W.; Liu, H.; Pernet-Coudrier, B.; Qu, J. Polycyclic aromatic hydrocarbons in wastewater, WWTPs effluents and in the recipient waters of Beijing, China. Environ. Sci. Pollut. Res. 2013, 20, 4254–4260. [Google Scholar] [CrossRef] [Green Version]
- Jin, A.; He, J.; Chen, S.; Huang, G. Distribution and transport of PAHs in soil profiles of different water irrigation areas in Beijing, China. Environ. Sci. Processes Impacts 2014, 16, 1526–1534. [Google Scholar] [CrossRef]
- Han, D.M.; Tong, X.X.; Jin, M.G.; Hepburn, E.; Tong, C.S.; Song, X.F. Evaluation of organic contamination in urban groundwater surrounding a municipal landfill, Zhoukou, China. Environ. Monit. Assess. 2013, 185, 3413–3444. [Google Scholar] [CrossRef]
- Bahr, A.; Fischer, A.; Vogt, C.; Bombach, P. Evidence of polycyclic aromatic hydrocarbon biodegradation in a contaminated aquifer by combined application of in situ and laboratory microcosms using 13C-labelled target compounds. Water Res. 2015, 69, 100–109. [Google Scholar] [CrossRef]
- Ugochukwu, U.C.; Ochonogor, A. Groundwater contamination by polycyclic aromatic hydrocarbon due to diesel spill from a telecom base station in a Nigerian City: Assessment of human health risk exposure. Environ. Monit. Assess. 2018, 190, 249. [Google Scholar] [CrossRef] [PubMed]
- Li, J.; Li, F.; Liu, Q. PAHs behavior in surface water and groundwater of the Yellow River estuary: Evidence from isotopes and hydrochemistry. Chemosphere 2017, 178, 143–153. [Google Scholar] [CrossRef] [PubMed]
- Li, J.; Li, F. Polycyclic aromatic hydrocarbons in the Yellow River estuary: Levels, sources and toxic potency assessment. Mar. Pollut. Bull. 2017, 116, 479–487. [Google Scholar] [CrossRef] [PubMed]
- Alam, M.J.; Yuan, D.; Jiang, Y.J.; Sun, Y.; Li, Y.; Xu, X. Sources and transports of polycyclic aromatic hydrocarbons in the Nanshan Underground River, China. Environ. Earth Sci. 2014, 71, 1967–1976. [Google Scholar] [CrossRef] [Green Version]
- Lan, J.; Sun, Y.; Xiao, S.; Yuan, D. Polycyclic aromatic hydrocarbon contamination in a highly vulnerable underground river system in Chongqing, Southwest China. J. Geochem. Explor. 2016, 168, 65–71. [Google Scholar] [CrossRef]
- Wu, C.; Zhu, H.; Luo, Y.; Wang, J. Concentrations and potential health hazards of polycyclic aromatic hydrocarbon in shallow groundwater of a metal smelting area in Southeastern China. Sci. Total Environ. 2016, 569, 1561–1569. [Google Scholar] [CrossRef]
- Shao, Y.; Wang, Y.; Xu, X.; Wu, X.; Jiang, Z.; He, S.; Qian, K. Occurrence and source apportionment of PAHs in highly vulnerable karst system. Sci. Total Environ. 2014, 490, 153–160. [Google Scholar] [CrossRef]
- Jin, A.; He, J.; Chen, S.; Huang, G. Impact of reclaimed water irrigation on PAHs in agricultural soil and groundwater. AIP Conf. Proc. 2010, 1251, 37–40. [Google Scholar]
- Bi, E.; Liu, Y.; He, J.; Wang, Z.; Liu, F. Screening of Emerging Volatile Organic Contaminants in Shallow Groundwater in East China. Ground Water Monit. R. 2012, 32, 53–58. [Google Scholar] [CrossRef]
- Wang, L.; Yang, Z.; Niu, J. Temperature-dependent sorption of polycyclic aromatic hydrocarbons on natural and treated sediments. Chemosphere 2011, 82, 895–900. [Google Scholar] [CrossRef]
- Wu, X.; Wang, Y.; Zhang, Q.; Zhao, H.; Yang, Y.; Zhang, Y.; Xie, Q.; Chen, J. Seasonal variation, air-water exchange, and multivariate source apportionment of polycyclic aromatic hydrocarbons in the coastal area of Dalian, China. Environ. Pollut. 2019, 244, 405–413. [Google Scholar] [CrossRef] [PubMed]
- Sorensen, J.P.R.; Lapworth, D.J.; Nkhuwa, D.C.W.; Stuart, M.E.; Gooddy, D.C.; Bell, R.A.; Chirwa, M.; Kabika, J.; Liemisa, M.; Chibesa, M.; et al. Emerging contaminants in urban groundwater sources in Africa. Water Res. 2015, 72, 51–63. [Google Scholar] [CrossRef] [PubMed] [Green Version]
- Haritash, A.K.; Kaushik, C.P. Biodegradation aspects of Polycyclic Aromatic Hydrocarbons (PAHs): A review. J. Hazard. Mater. 2009, 169, 1–15. [Google Scholar] [CrossRef] [PubMed]
- Bi, C.; Wang, X.; Jia, J.; Chen, Z. Spatial variation and sources of polycyclic aromatic hydrocarbons influenced by intensive land use in an urbanized river network of East China. Sci. Total Environ. 2018, 627, 671–680. [Google Scholar] [CrossRef]
- Hinga, K.R. Degradation rates of low molecular weight PAH correlate with sediment TOC in marine subtidal sediments. Mar. Pollut. Bull. 2003, 46, 466–474. [Google Scholar] [CrossRef]
- Rothermich, M.M.; Hayes, L.A.; Lovley, D.R. Anaerobic, sulfate-dependent degradation of polycyclic aromatic hydrocarbons in petroleum-contaminated harbor sediment. Environ. Sci. Technol. 2002, 36, 4811–4817. [Google Scholar] [CrossRef]
- Shang, J.; Chen, J.; Shen, Z.; Xiao, X.; Yang, H.; Wang, Y.; Ruan, A. Photochemical degradation of PAHs in estuarine surface water: Effects of DOM, salinity, and suspended particulate matter. Environ. Sci. Pollut. Res. 2015, 22, 12374–12383. [Google Scholar] [CrossRef]
- Xiao, Y.; Gu, X.; Yin, S.; Pan, X.; Shao, J.Y. Investigation of Geochemical Characteristics and Controlling Processes of Groundwater in a Typical Long-Term Reclaimed Water Use Area. Water 2017, 9, 800. [Google Scholar] [CrossRef] [Green Version]
- Renau-Pruñonosa, A.; García-Menéndez, O.; Ibáñez, M.; Vázquez-Suñé, E.; Boix, C.; Ballesteros, B.B.; Hernández García, M.; Morell, I.; Hernández, F. Identification of Aquifer Recharge Sources as the Origin of Emerging Contaminants in Intensive Agricultural Areas. La Plana de Castellón, Spain. Water 2020, 12, 731. [Google Scholar] [CrossRef] [Green Version]
- Mendoza-Espinosa, L.G.; Daesslé, L.W. Consolidating the use of reclaimed water for irrigation and infiltration in a semi-arid agricultural valley in Mexico: Water management experiences and results. J. Water Sanit. Hyg. Dev. 2018, 8, 679–687. [Google Scholar] [CrossRef]
- Deh-Haghi, Z.; Bagheri, A.; Fotourehchi, Z.; Damalas, C.A. Farmers’ acceptance and willingness to pay for using treated wastewater in crop irrigation: A survey in western Iran. Agric. Water Manag. 2020, 239, 106262. [Google Scholar] [CrossRef]
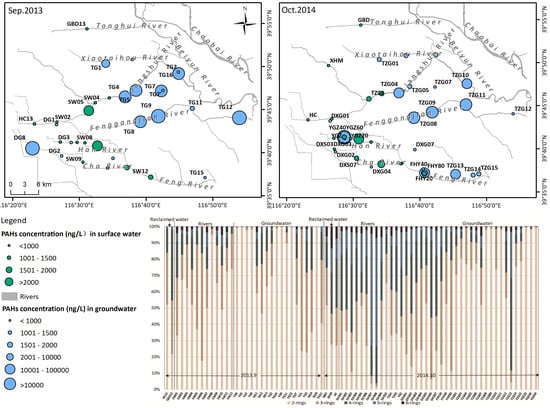
Figure 1.
Location of the study area and sampling sites.

Figure 2.
PAHs concentration ranges and values in water as dissolved phase (ng/L) from different surface water bodies including rivers, estuaries, lake in China and in other countries, modified from [7]. The guideline values adopted by United States Environmental Protection Agency (US EPA), European Union (EU), World Health Organization (WTO) and Chinese standards for drinking water quality (GB5749-2006).

Figure 3.
PAHs concentration and composition pattern in rivers in September 2013 (a), and in October 2014 (b).
Figure 3.
PAHs concentration and composition pattern in rivers in September 2013 (a), and in October 2014 (b).

Figure 4.
Spatial distribution of PAHs concentrations in surface water and groundwater during September 2013 (a) and October 2014 (b).
Figure 4.
Spatial distribution of PAHs concentrations in surface water and groundwater during September 2013 (a) and October 2014 (b).

Figure 5.
PAHs concentration ranges and mean value in reclaimed water (RW), surface water (SW) and groundwater (GW) as dissolved phase in September 2013 and October 2014.
Figure 5.
PAHs concentration ranges and mean value in reclaimed water (RW), surface water (SW) and groundwater (GW) as dissolved phase in September 2013 and October 2014.

Figure 6.
Composition pattern of ∑16PAHs in reclaimed water, surface water and groundwater in September 2013 and October 2014.
Figure 6.
Composition pattern of ∑16PAHs in reclaimed water, surface water and groundwater in September 2013 and October 2014.


Table 1.
Quality control information.
| Compounds | MQL (ng·L−1) | Recovery% | SD% (n = 6) |
|---|---|---|---|
| Nap | 0.02 | 65.3 | 2.03 |
| Acy | 0.01 | 60.2 | 5.38 |
| Ace | 0.07 | 65.8 | 9.41 |
| Fluo | 0.20 | 77.2 | 8.57 |
| Phe | 0.34 | 96.6 | 6.33 |
| Ant | 0.70 | 80.2 | 6.72 |
| Flua | 0.88 | 106.1 | 0.69 |
| Pyr | 1.00 | 110.8 | 1.66 |
| BaA | 3.20 | 115.6 | 1.39 |
| Chry | 3.41 | 112.5 | 3.40 |
| BbF | 1.85 | 100.3 | 2.50 |
| BkF | 3.32 | 89.5 | 0.41 |
| BaP | 2.90 | 88.5 | 3.86 |
| IcdP | 3.68 | 118.4 | 2.56 |
| DBA | 4.50 | 119.2 | 0.46 |
| BghiP | 3.56 | 101.7 | 2.51 |
Table 2.
p values of paired-samples t-test of PAHs concentration in reclaimed water, surface water and groundwater at same sampling sites in September 2013 and October 2014.
Table 2.
p values of paired-samples t-test of PAHs concentration in reclaimed water, surface water and groundwater at same sampling sites in September 2013 and October 2014.
| p Values | Nap | Acy | Ace | Fl | Phe | Ant | 3-Rings | Flu | Pry | BaA | Chr |
| RW | 0.006 | 0.000 | 0.551 | 0.793 | 0.907 | 0.344 | 0.089 | 0.008 | 0.016 | 0.165 | 0.372 |
| SW | 0.267 | 0.822 | 0.547 | 0.421 | 0.574 | 0.383 | 0.344 | 0.603 | 0.372 | 0.016 | 0.002 |
| GW | 0.004 | 0.069 | 0.001 | 0.152 | 0.796 | 0.030 | 0.004 | 0.633 | 0.045 | 0.207 | 0.014 |
| p Values | 4-rings | BbF | BKF | BaP | DBA | 5-rings | InP | BghiP | 6-rings | ∑16PAHs | |
| RW | 0.339 | 0.219 | 0.346 | 0.061 | 0.110 | 0.168 | 0.108 | 0.190 | 0.057 | 0.601 | |
| SW | 0.014 | 0.000 | 0.000 | 0.002 | 0.002 | 0.000 | 0.002 | 0.000 | 0.000 | 0.840 | |
| GW | 0.640 | 0.037 | 0.127 | 0.073 | 0.001 | 0.015 | 0.078 | 0.019 | 0.016 | 0.004 |
Table 3.
Pearson correlation coefficient of PAHs compositions with physical-chemical parameter and ionic concentrations in river water.
Table 3.
Pearson correlation coefficient of PAHs compositions with physical-chemical parameter and ionic concentrations in river water.
| Oct. 2014 | 2-Rings | 3-Rings | 4-Rings | 5-Rings | 6-Rings | ∑16PAHs | Sep.2013 | 2-Rings | 3-Rings | 4-Rings | 5-Rings | 6-Rings | ∑16PAHs |
|---|---|---|---|---|---|---|---|---|---|---|---|---|---|
| pH | 0.19 | −0.03 | 0.19 | 0.46 | 0.49 | 0.47 | pH | −0.22 | −0.23 | −0.09 | 0.18 | 0.44 | −0.28 |
| DO | −0.37 | −0.60 * | −0.15 | 0.11 | 0.09 | −0.18 | DO | −0.26 | 0.21 | −0.32 | −0.34 | −0.03 | −0.28 |
| EC | 0.38 | 0.61 * | −0.21 | −0.28 | −0.28 | 0.01 | EC | 0.10 | 0.23 | 0.15 | −0.03 | −0.58 * | 0.17 |
| Cl− | 0.56 * | 0.82 ** | −0.04 | −0.16 | −0.16 | 0.23 | Cl− | 0.16 | −0.10 | −0.17 | −0.10 | −0.27 | 0.09 |
| SO42− | 0.07 | 0.16 | −0.51 | −0.44 | −0.40 | −0.32 | SO42− | −0.02 | −0.03 | 0.07 | −0.07 | −0.22 | −0.03 |
| HCO3− | 0.49 | 0.61 * | −0.11 | −0.12 | −0.10 | 0.20 | HCO3− | 0.09 | 0.07 | −0.19 | −0.18 | −0.58 * | 0.08 |
| NO3− | −0.53 * | −0.74 ** | 0.16 | 0.19 | 0.15 | −0.18 | NO3− | −0.22 | 0.02 | 0.06 | −0.16 | −0.31 | −0.21 |
| TN | −0.41 | −0.22 | 0.18 | 0.10 | 0.03 | −0.16 | TN | 0.51 * | 0.51 * | 0.47 * | 0.27 | 0.14 | 0.69 ** |
** Correlation is significant at the 0.01 level. * Correlation is significant at the 0.05 level.
Table 4.
Pearson correlation coefficient of PAHs compositions with physic-chemical parameter and ionic concentrations in groundwater.
Table 4.
Pearson correlation coefficient of PAHs compositions with physic-chemical parameter and ionic concentrations in groundwater.
| Oct. 2014 | 2-Rings | 3-Rings | 4-Rings | 5-Rings | 6-Rings | ∑16PAHs | Sep.2013 | 2-Rings | 3-Rings | 4-Rings | 5-Rings | 6-Rings | ∑16PAHs |
|---|---|---|---|---|---|---|---|---|---|---|---|---|---|
| pH | 0.28 | 0.39 * | 0.17 | 0.04 | −0.13 | 0.28 | pH | −0.07 | −0.15 | 0.14 | −0.31 | −0.40 | −0.07 |
| EC | −0.37 | −0.20 | −0.04 | 0.00 | −0.02 | −0.38 | EC | 0.31 | 0.25 | −0.09 | 0.12 | 0.48 * | 0.31 |
| Cl− | 0.00 | −0.15 | 0.09 | 0.12 | 0.09 | 0.00 | Cl− | 0.32 | 0.17 | −0.07 | 0.10 | 0.39 | 0.32 |
| SO42− | −0.32 | −0.11 | −0.12 | −0.08 | −0.09 | −0.32 | SO42− | 0.02 | 0.16 | −0.24 | −0.04 | 0.18 | 0.02 |
| HCO3− | −0.36 | −0.25 | −0.09 | −0.02 | −0.01 | −0.36 | HCO3− | 0.23 | 0.25 | −0.38 | 0.00 | 0.23 | 0.23 |
| NO3− | −0.25 | −0.29 | 0.27 | −0.16 | −0.47 | −0.26 | NO3− | −0.05 | 0.07 | 0.26 | 0.64 ** | 0.72 ** | −0.05 |
| TN | −0.19 | 0.22 | −0.18 | −0.15 | −0.14 | −0.19 | TN | 0.53 * | 0.59 * | −0.01 | −0.01 | 0.10 | 0.53 * |
** Correlation is significant at the 0.01 level. * Correlation is significant at the 0.05 level.
© 2020 by the authors. Licensee MDPI, Basel, Switzerland. This article is an open access article distributed under the terms and conditions of the Creative Commons Attribution (CC BY) license (http://creativecommons.org/licenses/by/4.0/).
Share and Cite
MDPI and ACS Style
Wang, Y.; Li, B.; Ma, Y.; Yang, L.; Song, X. Characterizing the Variation of Dissolvable PAHs in Receiving Water in a Reclaimed Water Irrigation Region. Water 2020, 12, 2766. https://doi.org/10.3390/w12102766
AMA Style
Wang Y, Li B, Ma Y, Yang L, Song X. Characterizing the Variation of Dissolvable PAHs in Receiving Water in a Reclaimed Water Irrigation Region. Water. 2020; 12(10):2766. https://doi.org/10.3390/w12102766
Chicago/Turabian StyleWang, Yajun, Binghua Li, Ying Ma, Lihu Yang, and Xianfang Song. 2020. "Characterizing the Variation of Dissolvable PAHs in Receiving Water in a Reclaimed Water Irrigation Region" Water 12, no. 10: 2766. https://doi.org/10.3390/w12102766
Note that from the first issue of 2016, this journal uses article numbers instead of page numbers. See further details here.