Assessment of Restorative Maintenance Practices on the Infiltration Capacity of Permeable Pavement


U.S. Geological Survey—Upper Midwest Water Science Center, 8505 Research Way, Middleton, WI 53562, USA
*
Author to whom correspondence should be addressed.
Water 2020, 12(6), 1563; https://doi.org/10.3390/w12061563
Submission received: 15 April 2020
/
Revised: 26 May 2020
/
Accepted: 27 May 2020
/
Published: 30 May 2020
(This article belongs to the Section Urban Water Management)
Abstract
:Permeable pavement has the potential to be an effective tool in managing stormwater runoff through retention of sediment and other contaminants associated with urban development. The infiltration capacity of permeable pavement declines as more sediment is captured, thereby reducing its ability to treat runoff. Regular restorative maintenance practices can alleviate this issue and prolong the useful life and benefits of the system. Maintenance practices used to restore the infiltration capacity of permeable pavement were evaluated on three surfaces: Permeable interlocking concrete pavers (PICP), pervious concrete (PC), and porous asphalt (PA). Each of the three test plots received a similar volume of runoff and sediment load from an adjacent, impervious asphalt parking lot. Six different maintenance practices were evaluated over a four-year period: Hand-held pressure washer and vacuum, leaf blower and push broom, vacuum-assisted street cleaner, manual disturbance of PICP aggregate, pressure washing and vacuuming, and compressed air and vacuuming. Of the six practices tested, five were completed on PICP, four on PC, and two on PA. Nearly all forms of maintenance resulted in increased average surface infiltration rates. Increases ranged from 94% to 1703% for PICP, 5% to 169% for PC, and 16% to 40% for PA. Disruption of the aggregate between the joints of PICP, whether by simple hand tools or sophisticated machinery, resulted in significant (p ≤ 0.05) gains in infiltration capacity. Sediment penetrated into the solid matrix of the PC and PA, making maintenance practices using a high-pressure wash followed by high-suction vacuum the most effective for these permeable pavement types. In all instances, when the same maintenance practice was done on multiple surfaces, PICP showed the greatest recovery in infiltration capacity.
1. Introduction
As urban areas expand and develop, effective stormwater management becomes increasingly difficult. Historically, stormwater management strategies have focused on routing runoff to localized or regional green infrastructure (e.g., bioretention, rain gardens), many of which are primarily intended to reduce the volume of runoff, with water-quality treatment a secondary benefit. In developed areas, available land for stormwater control practices can be scarce, making large-scale practices such as detention ponds less feasible. Practices that can be used in small areas and easily integrated into the urban landscape are becoming an increasingly attractive option for managing runoff. Permeable pavement is one such green infrastructure practice that maintains these qualities while offering additional water-quantity and quality benefits [1,2]. Unlike traditional concrete or asphalt, permeable pavement is porous, allowing direct precipitation and stormwater runoff from contributing impervious sources to pass through to an underlying aggregate base. In most cases, runoff eventually exfiltrates into underlying native soils, but runoff may also enter a stormwater system, be detained in a holding structure, or be paired with another stormwater treatment practice such as a bioretention area [3,4]. Permeable pavement systems can reduce contaminant loading, mitigate runoff volume and peak flow, and lower stormwater temperatures [5,6,7,8].
Although installations of permeable pavement date back to the early 1960s, their use has been localized and remained outside the ordinary conventions of urban design and construction [9]. Academia, government agencies, and private institutions have compared and contrasted the water-quality performance of permeable pavements; however, design features and maintenance have been left to industry organizations. It is generally acknowledged that, over time, sediment can become trapped in the pores of the pavement, thereby reducing the volume of water that can infiltrate [10,11,12]. This characteristic has prompted the need to investigate methods to restore and maintain infiltration capacity. Some of the maintenance practices that have been explored in previous studies include pressure washing, power brushing, milling, commercial street sweepers, proprietary pavement cleaning machines, and combinations of these [13,14,15,16]. Results from these studies show that most maintenance efforts are effective at improving infiltration capacity, but the degree to which the surface is restored is dependent on multiple variables. For example, three separate studies that analyzed the effectiveness of vacuum sweeping on permeable interlocking concrete pavers (PICP) showed that the efficiency was dependent on joint space, pavement age, and usage intensity [15]; vacuum sweeping was less effective at sites with high particulate load [17]; and vacuum sweeping was effective for PICP but ineffective for poured pavement like pervious concrete (PC) and porous asphalt (PA) [18]. While some of this variability could be attributed to differing permeable pavement plot age, location, and contributing drainage area, few have made side-by-side comparisons for different permeable surfaces when these factors are equal. These wide-ranging conclusions make it difficult for municipalities to integrate appropriate maintenance strategies into policy and guidance documents for permeable pavement, with many defaulting to episodic cleaning with a vacuum sweeper.
From 2014 to 2018, the U.S. Geological Survey (USGS) evaluated the water-quality and hydraulic performance of three types of permeable pavement: PICP, PC, and PA [1,2]. The research site design provided a side-by-side comparison of these surfaces under the same environmental setting. To control and quantify the input variables, the test plots received runoff from an adjacent parking lot and were not used for vehicular traffic. The objective of this study was to characterize the efficiency of maintenance practices, ranging from simple hand-held tools to sophisticated machinery, which are designed to restore the infiltrative capacity of permeable pavement. Results of this study can be used by environmental managers and owners of permeable pavement systems to better understand the clogging characteristics of permeable pavement and evaluate the potential restorative functions of a variety of maintenance practices.
2. Materials and Methods
The experimental methods used for the present study follow those established in Selbig and Buer [1] and are briefly described herein. Results from the water-quality analyses of these sites can be found in Selbig and Buer [1], Selbig [19], and Selbig et al. [2].
2.1. Site Description
In the summer of 2014, a study plot with three sections of permeable pavement was installed adjacent to a parking lot on the northeast side of Madison, Wisconsin (Figure 1). A section of the curbed asphalt lot was partitioned off using asphalt berms to create a contributing drainage boundary of known area that included parking spaces and associated driving lanes (Figure 1a). Vehicles were restricted to the parking lot and prohibited from accessing the permeable surfaces. The lot was approximately 25 years old at the time of the study and in poor condition. Runoff from the parking lot passed through a flow-splitter, where it was divided equally to each section of permeable pavement. Rubberized berms attached to the surface prevented exchange of surface flow between test plots, and concrete walls divided the cells below grade. During periods of heavy rainfall, runoff that cascaded across each permeable surface as overflow entered a surface grate along the far edge of the plot and bypassed the system. The thicknesses of the PICP, PC, and PA surfaces were 7.9, 15.2, and 7.6 cm, respectively. The porosity of each permeable surface varied from approximately 5%–10% for PICP to approximately 20% for PC and PA. Below each permeable pavement surface were various gradations of washed aggregate to a total depth of 0.53 m. Further details of the study design can be found in Selbig and Buer [1].
2.2. Changes to Study Site
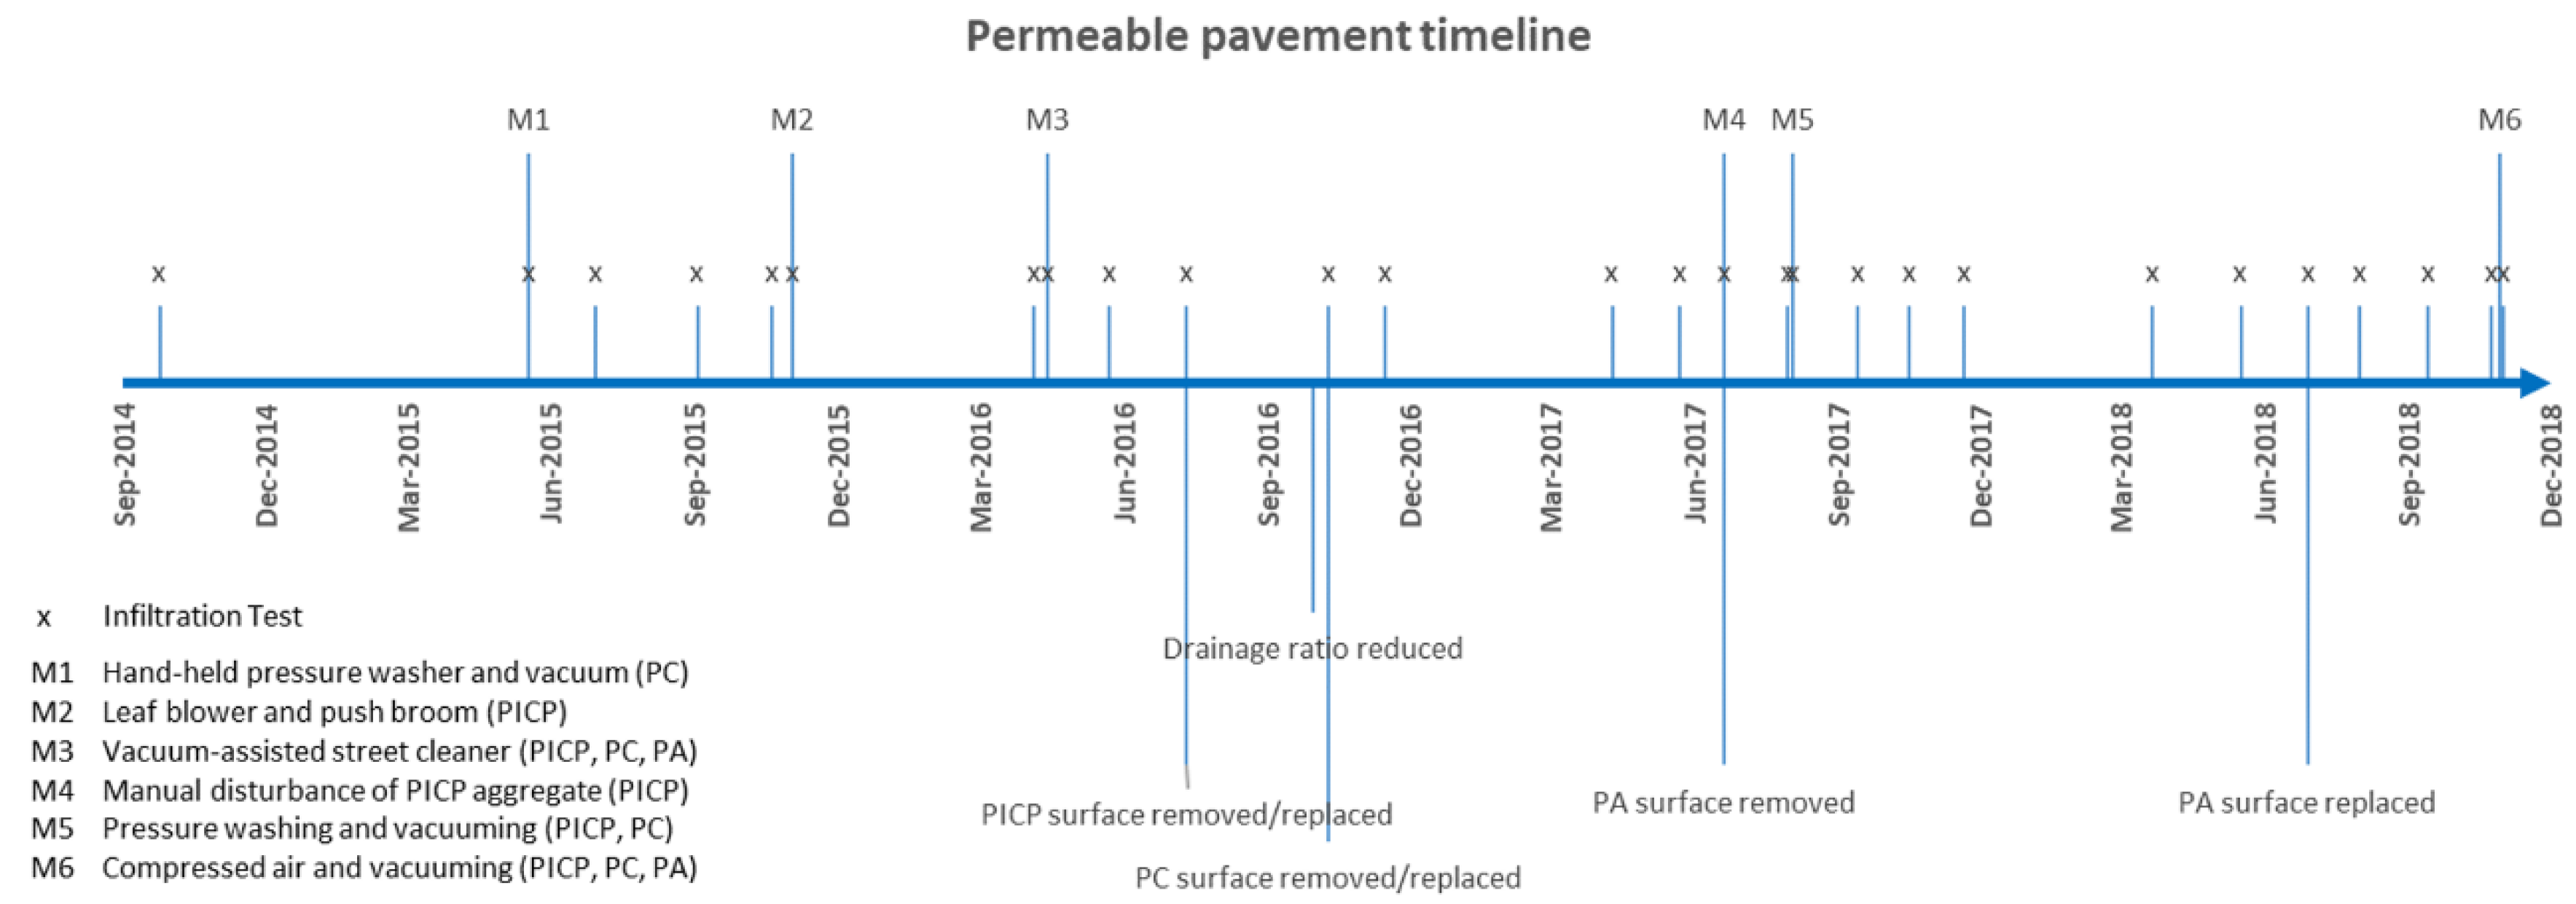
Two variations in drainage ratio, defined as the ratio of impervious run-on area to permeable pavement surface area, were evaluated throughout the study period. From August 2014 to September 2016, the drainage ratio was approximately 9:1, almost twice the amount suggested by the Wisconsin Department of Natural Resources (WDNR). In September 2016, the drainage ratio was reduced to 5:1 to meet the WDNR guidelines, which suggest a drainage ratio be less than or equal to 5:1 for drainage from surfaces such as parking lots, rooftops, and driveways to extend the life of permeable pavement and minimize risk of accelerated surface clogging [20].
Over the course of the study, each pavement surface was removed and replaced once. The PICP surface was replaced in July 2016, the PC surface was replaced 2 months later (September 2016), and the PA surface was removed the following summer in July 2017 and re-installed 11 months later in June 2018 (Figure 2).
2.3. Measurement and Reporting of Infiltration Rate
Infiltration rates were measured using a modified version of the ASTM (American Society of Testing and Material) standard test method C1701/1701M [21]. Although designed for PC, the method was applied to all three permeable surfaces in this study. This method measures the time required to infiltrate a known volume of water through a ring of known area sealed to the permeable surface. Further details of the device are found in Selbig and Buer [1].
Surface infiltration rates were measured before and after the completion of each maintenance practice. They were additionally measured at all three permeable surfaces approximately once per month for the duration of the study, except winter (typically December through March) (Figure 2). Each surface infiltration measurement was an average of nine discrete tests distributed in a three-by-three matrix spaced evenly across each 7.6 by 6.1 m permeable pavement plot (Figure 3). Each surface infiltration measurement was done in the exact same manner using the exact same discrete test locations. Each discrete test was initially performed using 3.8 L of water. If complete infiltration occurred within 30 s, a second test was done using 18.9 L of water to provide a more accurate assessment of the infiltration rate. In some cases, the duration of the 3.8 L test would exceed 45 min (infiltration rate of less than 7.6 cm/h), making additional tests time-prohibitive. Therefore, if the 3.8 L test did not fully infiltrate after 15 min, the test was ended as the location was considered clogged (infiltration rate of less than 23 cm/h). This numeric threshold was chosen based on the language used in WDNR Conservation Practice 1008, which suggests permeable pavements with surface infiltration rates less than 25 cm/h require action to restore infiltration rates by at least 50% [20]. Although the actual infiltration rate was not determined in these instances, for purposes of quantification, clogged discrete test locations were assigned a rate of 23 cm/h.
2.4. Description of Maintenance Practices
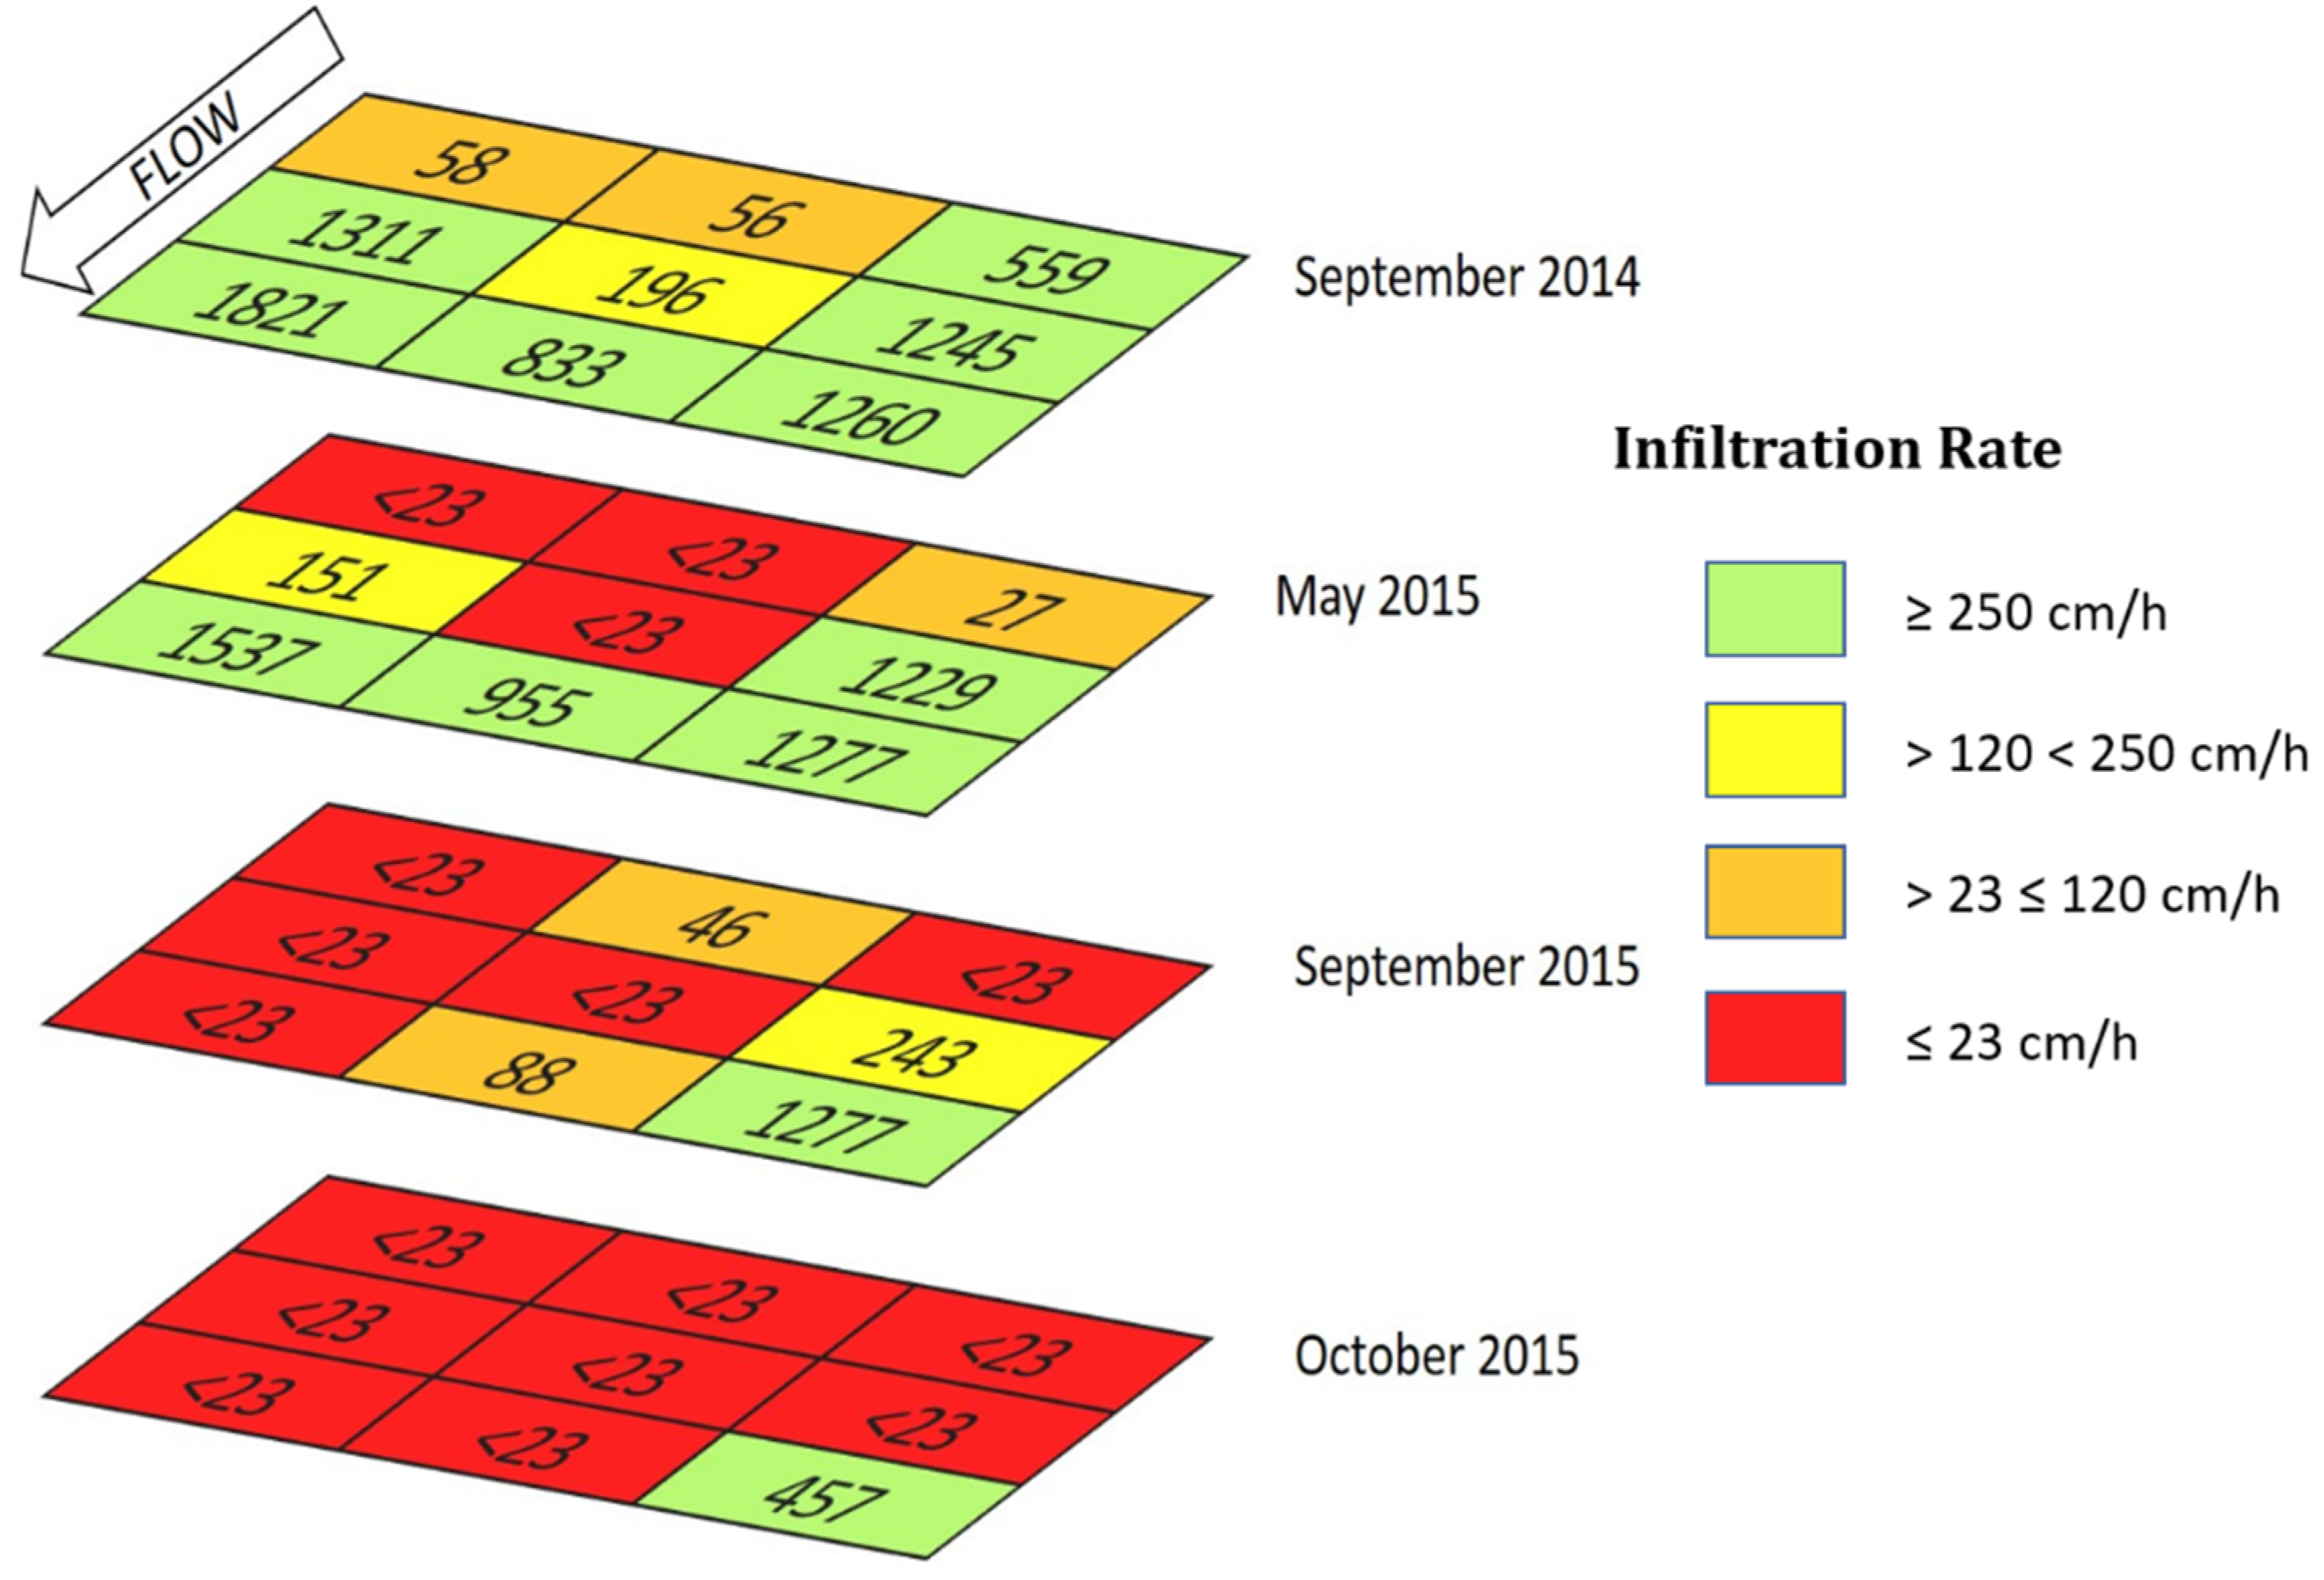
The decision to perform maintenance was made when the surface reached clogged status. The surface was considered clogged when six of the nine discrete infiltration tests resulted in a value of less than 23 cm/h. As runoff was not uniformly applied across the entire permeable surface, some areas of each permeable surface received less volume (and, therefore, sediment) than others. Infiltration tests generally showed clogging to first occur where runoff enters each permeable surface, with clogging occurring later at the downslope side. Figure 4 shows the progression of clogging across the PICP surface over the first 14 months of the study, when no maintenance was completed. In some cases, maintenance practices were scheduled based on study objectives. Figure 2 details the type and frequency of maintenance practices throughout the study period. In total, PICP received five maintenance practices, PC received four, and PA received two.
2.4.1. Hand-Held Pressure Washer and Vacuum
In May 2015, the high-powered pressure washer followed by high-powered vacuum suction features of a Ditch Witch FX30® (Charles Machine Works, Perry, OK, USA) vacuum excavator were applied to a portion of the PC surface to remove any dislodged material (Figure 5, M1). The angle of the washer spray was applied at approximately 90° to the PC surface with a pressure of 207 bar (3000 psi). The suction velocity of the vacuum was 15.3 m3/min. The machinery used for this exercise is typically meant for removal of accumulated sediment from catch basins and sumps and not restoration of permeable pavement; however, this cleaning targeted a 1.8 m swath on the north edge of the plot that clogged rapidly due to an installation defect, creating preferential flow across a narrow band of the PC test plot. The maintenance area included the discrete test locations 1, 4, and 7, as illustrated in Figure 3.
2.4.2. Leaf Blower and Push Broom
In November 2015, a manual cleaning was done on the PICP surface only. This process involved the clearing of surface debris using a high-powered leaf blower (Figure 5, M2). Any dislodged aggregate was removed using a bristled push broom and dustpan and replaced with new aggregate. The intent was to replicate what a typical homeowner may do to maintain their own PICP.
2.4.3. Vacuum-Assisted Street Cleaner
In April 2016, maintenance on all three permeable surfaces was done by use of an Elgin Whirlwind® vacuum-assisted street cleaner (Elgin Sweeper Company, Elgin, Ill, USA) (Figure 5, M3). The sweeper operator passed across each surface twice using only the vacuum feature of the street cleaner. The entire surface of PC and PA was treated; however, the concrete wall bordering the PICP test site prevented the vacuum portion of the sweeper from reaching approximately one-third of the PICP surface (discrete location numbers 1, 4, and 7 in Figure 3).
2.4.4. Manual Disturbance of PICP Aggregate
In June 2017, all the joints between pavers in the PICP were scraped by use of a 0.6 cm masonry trowel (Figure 5, M4). Any aggregate loosened by the scraping action of the trowel was removed by use of a push broom and dustpan and replaced with new aggregate. This method was very labor-intensive but was done to further confirm clogging of PICP due to shallow penetration of the sediment into joint aggregate, as described by Selbig and Buer [1]. It was also done to test if a non-mechanical means of PICP maintenance could result in similar improvements to infiltration rates as demonstrated by more sophisticated technologies.
2.4.5. Pressure Washing and Vacuuming
In August 2017, a Cyclone Industries® CY5500® (Cyclone Technology, Tempe, AZ, USA) pressure washing machine was used to clean PICP and PC surfaces (Figure 5, M5). PA was not cleaned, due to removal of the surface 1 month prior. The Cyclone® uses a cleaning and recovery head that simultaneously pressure-washes the surface and recovers waste and water. Water heated to 71 °C was applied to the permeable surface in a circular motion within a surrounding chamber at 29,647 kilopascals. The Cyclone® passed over PICP and PC surfaces each three times. Any dislodged aggregate in the PICP test plot was removed with the wastewater and stored within the Cyclone®.
2.4.6. Compressed Air and Vacuuming
In October 2018, all three surfaces were treated with the TYPHOON® and PAVEVAC® by PaveTech® (PaveTech Inc., Prior Lake, MN, USA) (Figure 5, M6). The TYPHOON® is primarily intended to be used as an excavator of PICP joint aggregate by use of compressed air. Once the aggregate was dislodged, it was removed by the PAVEVAC®, which uses a high-lift vacuum to remove the excavated material in preparation to refill the joints [22]. Although designed for restoration of PICP, both the TYPHOON® and PAVEVAC® were applied to PC and PA to determine the restoration potential for other permeable pavements. A portion of the PC surface received two passes of the PaveTech machinery (discrete location numbers 1, 2, 4, and 5 in Figure 3) to determine if the number of passes provided additional improvement over a single pass.
2.5. Statistical Evaluation
Calculation of efficiency was based on a comparison of infiltration rates measured before and after each maintenance activity. Pre- and post-discrete infiltration values were first evaluated for normality by use of the Shapiro–Wilk test. When results of the test indicated a normal distribution in both pre- and post-data, they were evaluated by use of paired t-tests [23]. All non-normal pre- and post-datasets were evaluated by use of the nonparametric Wilcoxon signed-rank test [23]. All statistical tests were first conducted using a two-tailed test in which the null hypothesis assumed that the pre- and post-infiltration rates were not different. If the null was rejected, tests were repeated to determine if the post-maintenance infiltration rate was statistically greater than or less than the pre= maintenance infiltration rate. All tests used a 95% confidence level (α = 0.05). All analyses were performed using the software package XLSTAT.
3. Results
3.1. Surface Heterogeneity
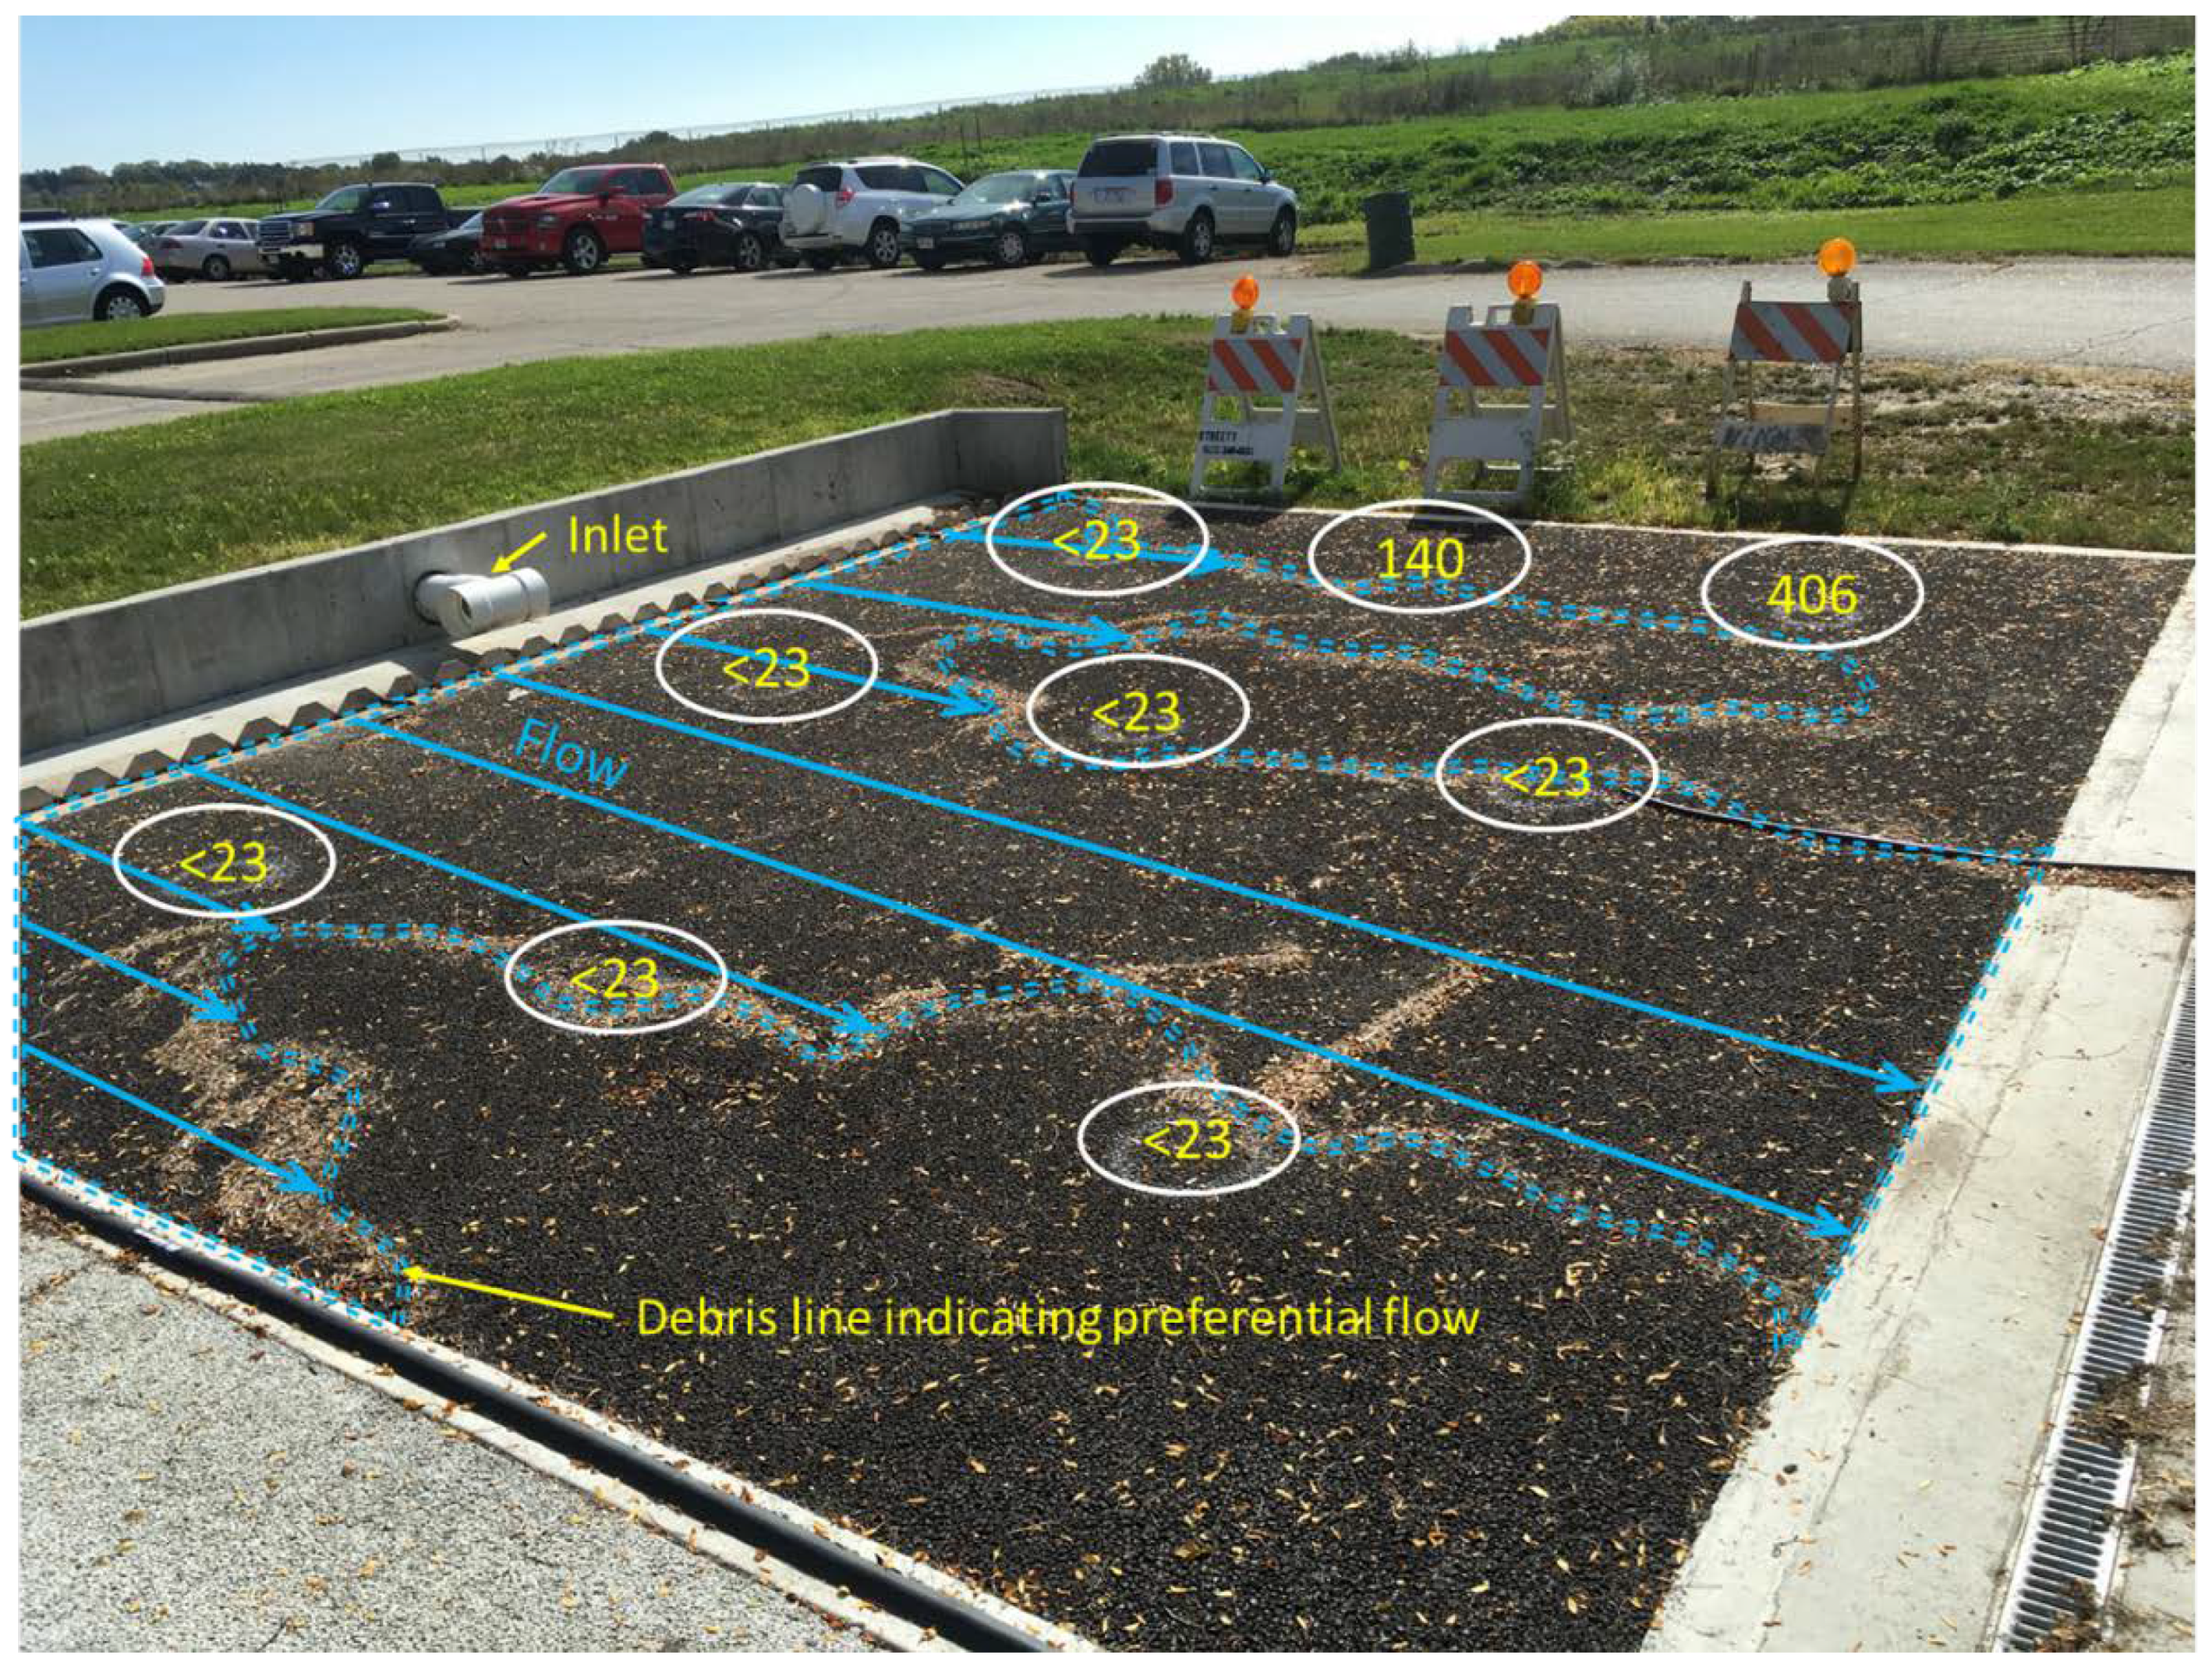
Discrete measurement results showed that infiltration was not uniform across the surface of each plot. This variability is typical of permeable pavement surfaces [11,15,24]. In the current study, variability was largely due to irregular flow patterns across the permeable surface. Measurement locations closest to the influent typically clogged earlier than those farther away (Figure 4). In addition, despite attempts to evenly distribute runoff across the entire permeable surface, preferential flowpaths emerged depending on rainfall intensity. Flowpaths were more pronounced during low-intensity rainfall events where influent runoff was slowly applied to the permeable surface. Discrete test locations within these paths tend to show clogging earlier than those that remained outside the flowpaths. For example, on 21 June 2017, PA had an average surface infiltration rate of 79 cm/h; however, seven of the nine values used to determine the average were assigned as 23 cm/h, the remaining two being 140 and 406 cm/h (Figure 6). The discrete test location that resulted in 406 cm/h was in the corner furthest from the inflow. Evidence of flowpaths on the surface indicated that runoff most likely did not reach that section except during larger events. Without knowing when all or part of the permeable surface received runoff, the average value of the nine discrete test results was decided as the best representation of surface infiltration rates.
3.2. Surface Clogging
The first infiltration measurements were performed on 24 September 2014, approximately 1 month after installation. At that time, the surface infiltration rates for PICP and PC were 815 and 374 cm/h, respectively (Figure 7); PA results are not reported, due to measurement error. The first PA infiltration test recorded was 807 cm/h on 18 May 2015. These initial infiltration rates are above the rate of 254 cm/h (100 in/h) required by the WDNR conservation technical standard [20], but lower than findings reported from other studies, which, in many cases, exceeded 2500 cm/h [25,26]. This discrepancy may, in part, be due to clogging that occurred between installation and measurement; during this 1 month period for PC and PA, the site received 5 cm of rainfall distributed over seven events, two of which were greater than 1.27 cm.
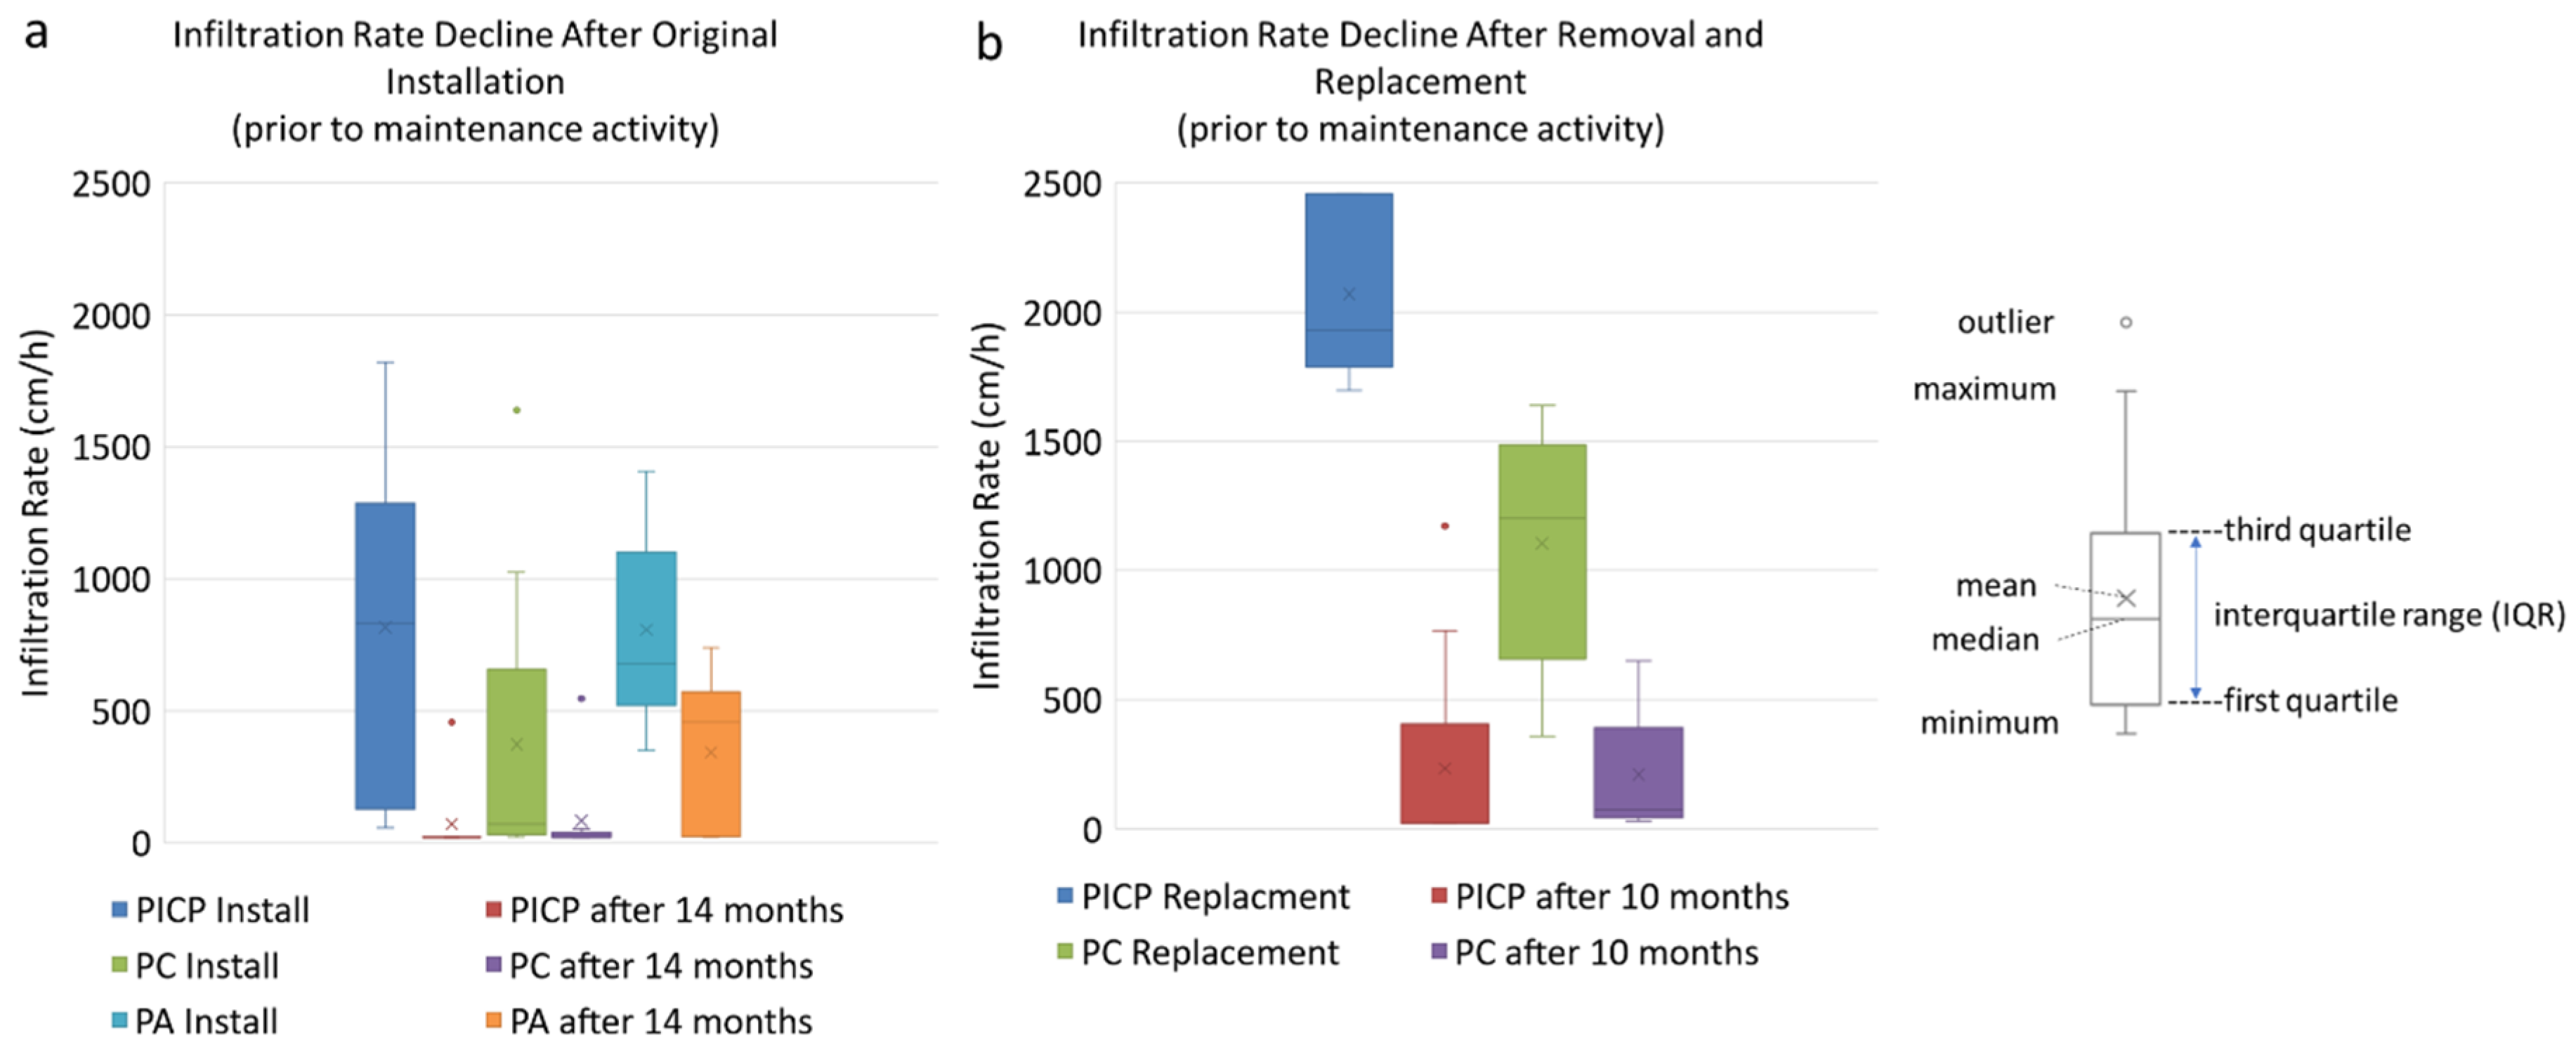
Within 14 months of installation, prior to any maintenance activity, both PICP and PC had reached clogged status (six or more of the nine discrete infiltration test locations showed a rate of less than 23 cm/h). The PICP and PC average infiltration rates dropped to 71 and 84 cm/h, respectively (Figure 8). PA did not reach clogged status until one year later in October 2016, at which time its surface infiltration rate was 218 cm/h.
In the summer of 2016, the surfaces of the PICP and PC were removed and replaced. The replacement of these surfaces was to coincide with the reduction in watershed area, bringing the drainage ratio from 9:1 down to 5:1. This replacement brought the surface infiltration rate of PICP to 2070 cm/h and PC to 1103 cm/h (Figure 7). In the 11 month period between the new installation and the first maintenance effort, the average PICP infiltration rate reduced by 89% to 235 cm/h (Figure 8). For PC, during the 10 month period between the new installation and the first maintenance practice, the average infiltration rate reduced by 81% to 210 cm/h. The replacement of the PA in June 2018 resulted in a new surface infiltration rate of 1539 cm/h. Additional information on surface clogging at this site can be found in Selbig et al. [2] and Selbig and Buer [1].
3.3. Maintenance Practice Results
Nearly all types of maintenance resulted in improved infiltration rates; however, the improvements were highly variable between the maintenance practices, pavement surface types, and discrete locations within the permeable surface (Table 1). For all maintenance practices, except the April 2016 street cleaner (M3) at PC, a statistically significant (p ≤ 0.05) change was seen between pre- and post-surface infiltration tests.
3.3.1. Hand-Held Pressure Washing and Vacuuming
The pressure wash and vacuum cleaning (M1) of a portion of the PC improved infiltration in the affected discrete testing locations (Table 1). Before cleaning, discrete locations 1, 4, and 7 had infiltration rates of < 23, 30, and 36 cm/h, respectively. After cleaning, these infiltration rates increased to 33, 66, and 109 cm/h; an improvement of 44%, 117%, and 207%, respectively (an average of 123%). When combined with the remainder of the PC surface that was not cleaned, this maintenance technique improved the average surface infiltration rate by 5% (from 279 to 292 cm/h).
3.3.2. Leaf Blower and Push Broom
The manual leaf blower and broom cleaning (M2) of PICP showed variable improvement at discrete locations and a moderate increase in overall average infiltration rate. Prior to maintenance, eight out of nine discrete locations were clogged (Table 1). Four discrete tests showed no improvement after maintenance, but one discrete test showed an increase in rate of more than 1600% (post-maintenance rate of 393 cm/h). The remaining four discrete tests reported variable improvements with post-maintenance values ranging from 58 to 546 cm/h. Overall, the average surface infiltration rate improved 94% with pre- and post-maintenance surface infiltration rates measuring 71 and 138 cm/h, respectively.
3.3.3. Vacuum-Assisted Street Cleaning
Maintenance by use of an Elgin Whirlwind® vacuum-assisted street cleaner (M3) showed improved infiltration rates at all treated discrete locations in the PICP test plot, no change or a slight reduction at most of the discrete tests in the PC test plot, and very slight improvements in the PA test plots. As expected, three discrete sites within the PICP area not treated by the street cleaner (due to interference with the retaining wall) showed minimal improvement (discrete location numbers 1, 4, and 7) (Table 1). Of the remaining PICP discrete sites, four that were clogged (<23 in/h) prior to treatment increased dramatically, ranging from 437 to 1967 cm/h after treatment (Table 1). The average infiltration rate for PICP improved significantly from 77 to 488 cm/h (a 535% increase). If only the area of PICP treated by the street cleaner were considered, the improvement would be 595%, from 104 to 721 cm/h. The average infiltration rate for PC decreased slightly from 84 to 58 cm/h (a 38% decrease); however, this change was not statistically significant at a 95% confidence level. A minor but statistically significant average infiltration rate improvement was observed at PA with the average infiltration rate increasing from 294 to 341 cm/h, a 16% change.
3.3.4. Manual Disturbance of PICP Aggregate
Removal and replacement of the aggregate by hand (M4) at PICP resulted in substantial increases in infiltration rates at all discrete locations. This effort was completed 11 months after the surface was replaced when six of the nine test plots had become clogged (Table 1, Figure 7). After completion, the lowest infiltration rate for any discrete location was 468 cm/h. The average infiltration rate increased from 235 to 888 cm/h, a 278% increase.
3.3.5. Pressure Washing and Vacuuming
Pressure washing and vacuuming using the Cyclone CY5500® (M5) were performed on PICP and PC; the PA surface had previously been removed and not yet replaced. At the time of maintenance, both PICP and PC surfaces were, on average, above the threshold for prescribed maintenance (385 and 210 cm/h, respectively); however, two discrete test locations in PICP were clogged, and five in PC were considered moderately clogged (<120 cm/h) (Table 1). After maintenance, the average infiltration rate for PICP increased to 1049 cm/h (172 percent) with a minimum rate of 707 cm/h for all discrete locations. The average infiltration rate for PC also increased, from 210 to 405 cm/h (a 92% increase). The minimum rate for discrete locations in PC was 129 cm/h.
3.3.6. Compressed Air and Vacuuming
Prior to maintenance with the TYPHOON® and PAVEVAC® equipment (M6), PICP was clogged at seven of the nine discrete test locations and had an average infiltration rate of 85 cm/h (Table 1). PC also had an average infiltration rate of 85 cm/h with five of the nine clogged discrete sites. PICP showed considerable improvement after maintenance with all discrete sites having infiltration rates greater than 1100 cm/h and an average of 1531 cm/h, a 1703% improvement. PC also responded to treatment by the PaveTech equipment, although not to the same degree as PICP. The average infiltration rate increased to 227 cm/h, a gain of 169% over the pre-maintenance value. The additional pass on locations 1, 2, 4, and 5 of the PC resulted in an average improvement of 342% for that section of the PC test plot, compared to only 121 percent for the remainder of PC having only a single pass. Despite the difference in percent improvement between one and two passes with the TYPHOON® and PAVEVAC®, it is difficult to assess whether the additional pass was worthwhile. A closer review of the discrete test locations in PC showed some to have a similar response whether served by one or two passes. For example, locations 1 and 7 were both clogged prior to treatment. The post-maintenance infiltration rate at location 1 after two passes was 307 cm/h, nearly the same as location 7 after only one pass. Additional research is needed to determine the ability to restore the infiltration capacity of PC based on the number of passes by the TYPHOON® and PAVEVAC®. As the PA surface was relatively new, average infiltration rates were already high prior to treatment with only minor clogging measured at a few discrete sites (Table 1). Regardless, PA responded to treatment with an average infiltration rate of 1463 cm/h prior to maintenance and 2047 cm/h after maintenance, a 40% increase.
4. Discussion
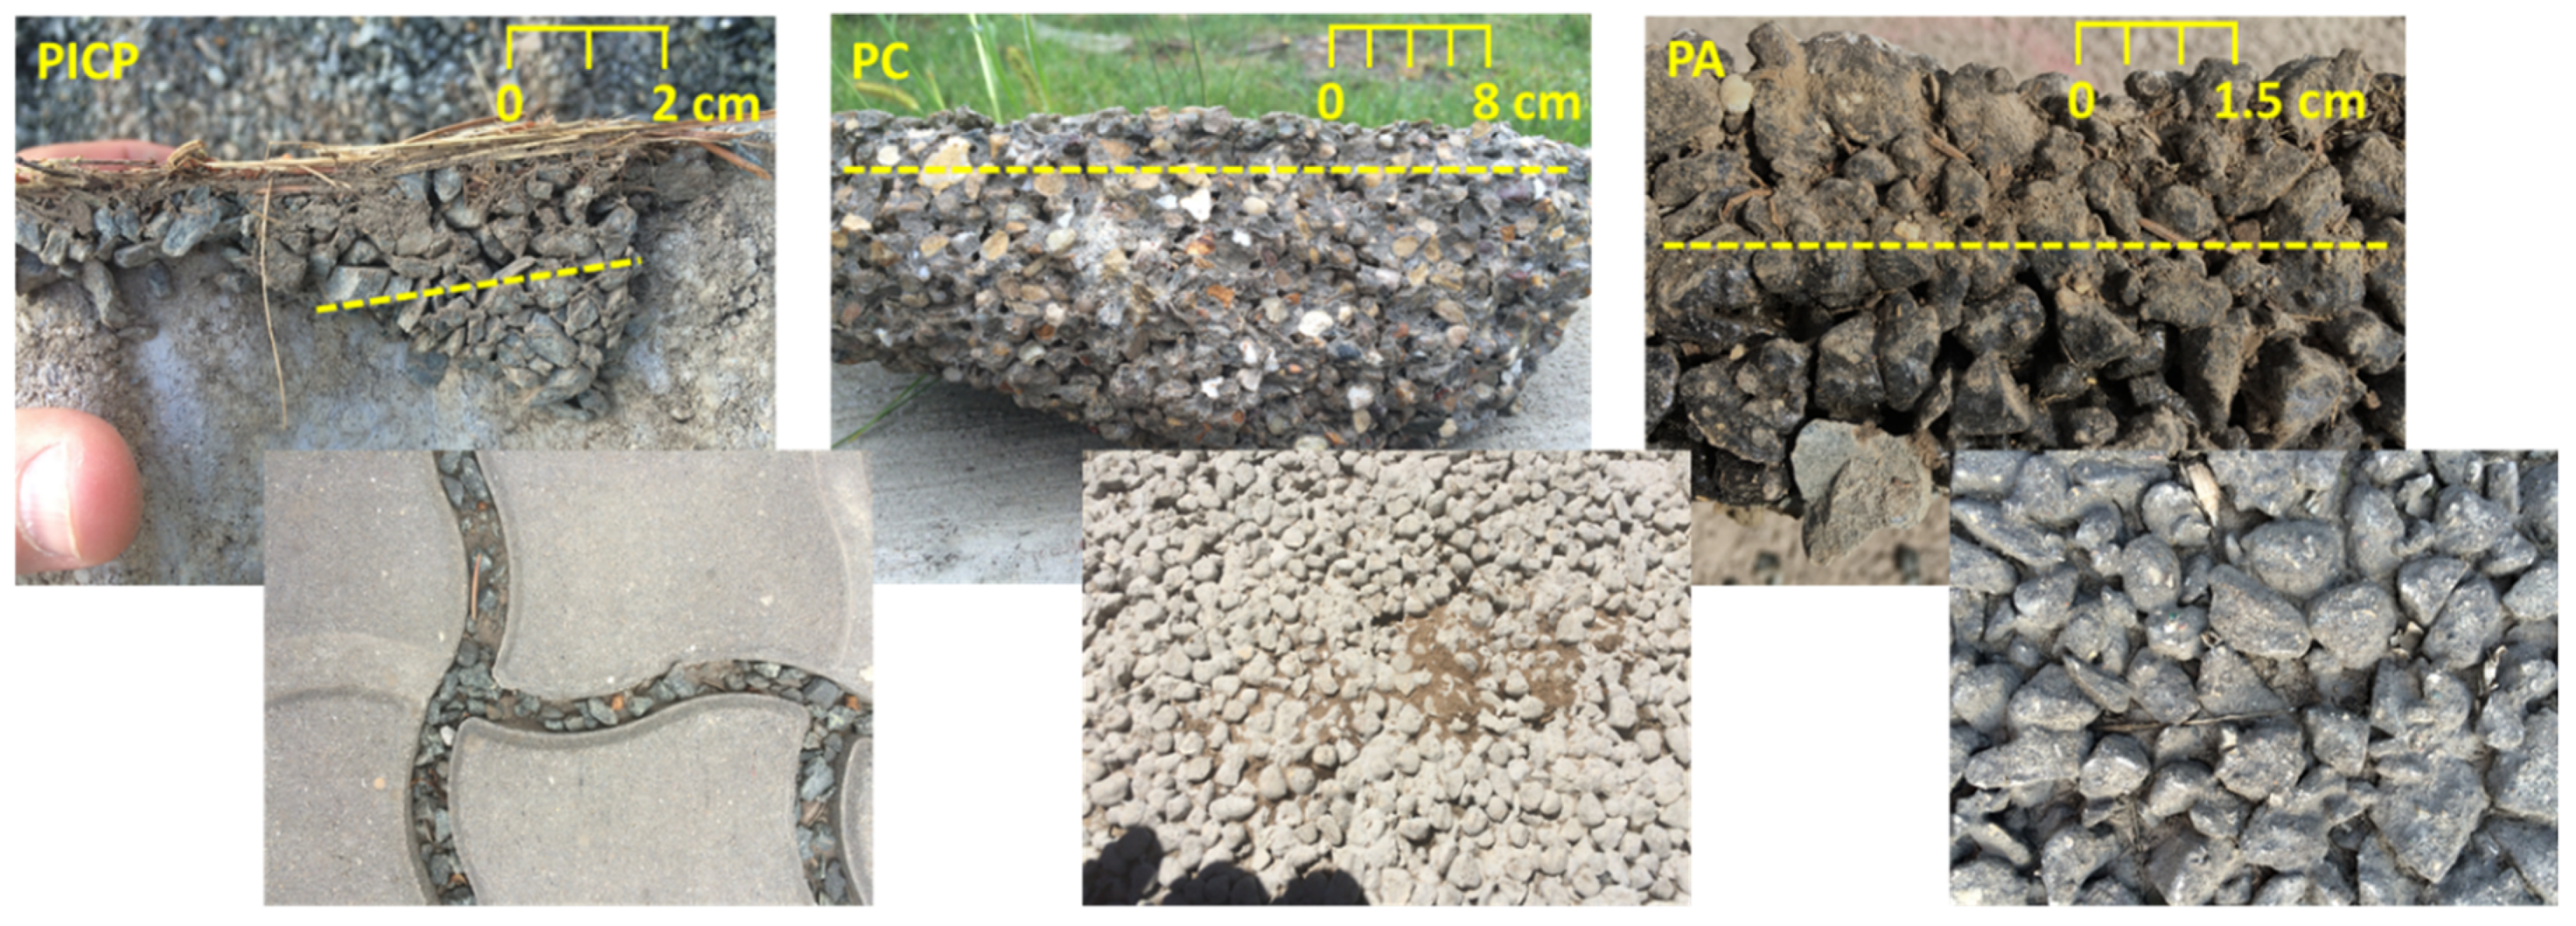
The surface structure of individual pavement types can influence the advancement of clogging, as well as the response to maintenance. Despite varying thickness during the construction process, the majority of clogging for permeable pavements has been shown to occur within the top 1.5 to 2.5 cm [1,17]. This was verified at each plot by visual examination of pavement surfaces and profiles upon removal (Figure 9). These findings were further confirmed by Kayhanian et al. [27] who scanned cores from 20 PC parking lots and found that clogging generally appeared to be limited to the upper 2.5 cm. Winston et al. [17] reported that milling of a 21 year old porous asphalt surface to a depth of 2.5 cm nearly restored the infiltrative capacity to like-new conditions. Results from this study and others [1,17,27] indicate that maintenance practices that penetrate deeper into a permeable surface will have a greater likelihood of restoring the infiltrative capacity.
In all instances where the same maintenance was performed on multiple surfaces, PICP showed the greatest recovery response. The design of the PICP allows the aggregate to easily be removed along with any associated clogged material. If all or most of the aggregate is removed and replaced, the infiltration capacity is restored to nearly new conditions. Dislodging or disrupting the aggregate also unbinds clogged material, allowing it to become more available for removal. This finding is supported by other studies documenting rehabilitation of PICP by removal of aggregate material; with the success of restoration being dependent on the degree of clogging, joint size, and type of aggregate material [11,15,17,24]. For all five maintenance practices, PICP responded with significant increases in average infiltration rates. The greatest response was observed for treatments where the aggregate was aggressively dislodged, removed, and replaced. The three treatments that performed this action were the pressure washing and vacuuming (Cyclone CY5500®) (M5), compressed air and vacuuming (PaveTech TYPHOON® and PAVEVAC®) (M6), and manual disturbance of the aggregate (M4), all resulting in post-maintenance average infiltration values that were above 800 cm/h (Table 1). Gerrits and James [11] similarly observed that disturbing the aggregate of PICP with a hand trowel resulted in increased infiltration rates; the aggregate was removed to varying depths and improvements were seen at all levels of removal, the degree of which was dependent on the amount of traffic the tested area received. Few studies have measured the effectiveness of the compressed air technology used by the PaveTech TYPHOON® and PAVEVAC®. One study in Louisville, Kentucky reported that 5 months after installation of a PICP system without aggregate, the use of compressed air was able to restore infiltration capacity to original median infiltration rates at five of the seven measured locations; however, 5 months later, the same maintenance was less effective [28].
The vacuum-assisted street cleaner (M3) was also effective at improving infiltration rates in PICP, although the resulting average infiltration rate (488 cm/h) was not as high as the rates achieved by the other evaluated maintenance practices. Additional passes by the vacuum-assisted street cleaner may have further dislodged joint aggregate, allowing more trapped sediment to be removed. A PICP study in Sweden found that vacuum sweeping restored infiltration rates more than mechanical sweeping, but the improvements were moderate when compared to pressure washing [17]. Another study found that a leaf blower was effective at scouring out the PICP joint aggregate in an unclogged state to a depth of 75 mm, which out-performed the removal capabilities of a regenerative-air street cleaner [29]. The leaf blower method, however, proved to be time- and labor-intensive compared to the automation of a machine. Despite the success of the vacuum-assisted street cleaner on PICP, the same level of treatment was not effective on other pavement types. A study of PC in Florida similarly concluded that vacuum sweeping may not be able to dislodge and extract strongly trapped materials [14].
Although the PICP had a lower porosity (5–10%) than the PC and PA (around 20%), the void spaces for PC and PA are fixed within the concrete or asphalt matrix and material must be extracted via pathways to the surface. The potential for clogging, and subsequent response to maintenance, is related to the tortuosity of the interconnected pores created during manufacturing [30]. In this study, PC had smaller pore sizes than PA, which may have increased tortuosity, as well as kept the clogging nearer to the surface. Two of the treatments were concurrently performed on all three surfaces: Vacuum-assisted street cleaning (M3) and compressed air and vacuuming (M6). For both treatments, the infiltration rates improved by a larger percentage for the PA than the PC, but the response was not as great as seen at PICP (Table 1). Although PC showed significant improvement for three of the four treatments it received, the percentage improvement and resulting infiltration rates were not as large as those observed in PICP. The larger pore spaces of PA allowed sediment to penetrate beyond the surface more than the other pavement types. Once clogged, however, recovery of sediment deeper within PA became more difficult. PC and PA responded best to practices that utilized pressure washing (either by compressed air or water) followed by vacuuming. Evidence from this study indicates that both PA and PC can be effective at trapping sediment in subsurface voids but, due to the fixed nature of their design, are limited in the amount of sediment that can be removed, thereby limiting restoration of infiltration capacity. Chopra et al. [31] conducted nine tests of pressure wash and vacuuming on PC and each showed significant improvements, with an average rejuvenation ratio (post-infiltration rate divided by pre-infiltration rate) of 66.9, with the highest increase in infiltration rate going from 5 to 963 cm/h. Al-Rubaei et al. [32] observed that average infiltration capacities at one PA residential street recovered from 30 to 209 cm/h after pressure wash and vacuuming but observed little-to-no improvement at a second PA street, the difference potentially being due to regular maintenance at the site that saw improvement but little-to-no maintenance at the other. Vehicular or pedestrian traffic and frequency of cleaning could affect maintenance efforts. The use of compressed air on PA or PC does not seem to have been studied previously.
5. Conclusions
Use of the following maintenance practices: (1) Hand-held pressure washer and vacuum, (2) leaf blower and push broom, (3) vacuum-assisted street cleaner, (4) manual disturbance of PICP aggregate, (5) pressure washing and vacuuming, and (6) compressed-air and vacuuming were evaluated on up to three pavement types over a four-year period. In general, results show that the effectiveness of each maintenance practice is somewhat dependent on pavement type. With the exception of a vacuum-assisted street cleaner on PC, all pavement types responded positively to all treatments. However, the degree of response was variable; PICP had the highest response to activities where the aggregate was aggressively dislodged, removed, and replaced; PC and PA had the greatest response to treatments more capable of penetrating deeper into the permeable surface such as high-pressure water or air followed by a high-suction. PICP had the lowest response to a manual cleaning using a standard leaf blower and push broom. The lowest response at PC and PA was a treatment using a vacuum-assisted street cleaner. In all instances where the same maintenance was completed on multiple surfaces, PICP showed the greatest recovery response. In this study, PICP and PC surfaces clogged within a year of installation and PA clogged within two years, indicating that developing a maintenance plan to regularly restore infiltration capacity is a critical step in the planning process for permeable pavement design. Results of this study agree with conclusions from prior research that maintenance is needed to ensure long-term performance of permeable pavements, and selection of maintenance practices warrants tailoring to individual pavement types. Information on how various maintenance practices perform on different permeable surfaces can assist environmental managers and owners of private permeable pavement instalments develop focused management strategies.
Author Contributions
Conceptualization, W.R.S. and N.H.B.; Data curation, M.E.D.; Formal analysis, M.E.D., W.R.S. and N.H.B.; Funding acquisition, W.R.S.; Investigation, M.E.D., W.R.S. and N.H.B.; Methodology, W.R.S. and N.H.B.; Project administration, W.R.S.; Supervision, W.R.S.; Visualization, M.E.D. and N.H.B.; Writing—original draft, M.E.D.; Writing—review & editing, W.R.S. All authors have read and agreed to the published version of the manuscript.
Funding
The Wisconsin Department of Natural Resources, Wisconsin Department of Transportation, County Materials Corporation, and the International Concrete Pavement Institute provided the financial support necessary to complete this paper.
Acknowledgments
The authors would like to thank Roger Bannerman of the Wisconsin Department of Natural Resources, Bob Roehrig and Jennifer Schaff of County Materials Corporation, John McCarthy of Graef Engineering, Chris Homburg of Homburg Construction, Greg Fries and Tim Troester of the city of Madison and David Smith of the International Concrete Pavement Institute. The authors would also like to thank Oldcastle Inc., Unilock, County Materials Corporation, Rock Roads, and Homburg Construction for donating materials and labor to install the permeable interlocking pavers, porous asphalt, and pervious concrete. The Wisconsin Department of Natural Resources, Wisconsin Department of Transportation, County Materials Corporation, and Interlocking Concrete Pavement Institute provided financial support. Without the cooperation and effort of these individuals, agencies, and companies, this study would not have been possible. Any use of trade, firm, or product names is for descriptive purposes only and does not imply endorsement by the U.S. Government.
Conflicts of Interest
The authors declare no conflict of interest.
References
- Selbig, W.R.; Buer, N. Hydraulic, Water-Quality, and Temperature Performance of Three Types of Permeable Pavement under High Sediment Loading Conditions; U.S. Geol. Surv. Sci. Investig. Rep. 2018–5037; US Geological Survey: Reston, VA, USA, 2018. [CrossRef]
- Selbig, W.R.; Buer, N.; Danz, M.E. Stormwater-quality performance of lined permeable pavement systems. J. Environ. Manag. 2019, 251, 109510. [Google Scholar] [CrossRef] [PubMed]
- Fassman, E.A.; Blackbourn, S. Urban runoff mitigation by a permeable pavement system over impermeable soils. J. Hydrol. Eng. 2010, 15, 475–485. [Google Scholar] [CrossRef]
- Rushton, B.T. Low-Impact Parking Lot Design Reduces Runoff and Pollutant Loads. J. Water Resour. Plan. Manag. 2001, 127, 172–179. [Google Scholar] [CrossRef]
- Pratt, C.J.; Mantle, J.D.G.; Schofield, P.A. UK research into the performance of permeable pavement, reservoir structures in controlling stormwater discharge quantity and quality. Water Sci. Technol. 1995, 32, 63–69. [Google Scholar] [CrossRef]
- Watanabe, S. Study on Stormwater Control by Permeable Pavement and Infiltration Pipes. Water Sci. Technol. 1995, 32, 25–32. [Google Scholar] [CrossRef]
- Drake, J.; Bradford, A.; Van Seeters, T. Evaluation of Permeable Pavements in Cold Climates—Kortright Centre, Vaughan; Toronto and Region Conservation Authority: Toronto, ON, Canada, 2012. Available online: https://sustainabletechnologies.ca/app/uploads/2013/02/KPP-Final-2012.pdf (accessed on 20 April 2020).
- Wardynski, B.; Winston, R.; Hunt, W. Enhancement of exfiltration and thermal load reduction from permeable pavement with internal water storage. In Proceedings of the World Environmental and Water Resources Congress 2012: Crossing Boundaries, Albuquerque, NM, USA, 20–24 May 2012; pp. 349–359. [Google Scholar] [CrossRef]
- Eisenberg, B.; Lindow, K.C.; Smith, D.R. Permeable Pavements; American Society of Civil Engineers: Reston, VA, USA, 2015; p. 249. [Google Scholar] [CrossRef]
- Pezzaniti, D.; Beecham, S.; Kandasamy, J. Influence of clogging on the effective life of permeable pavements. Proc. Inst. Civ. Eng. Water Manag. 2009, 162, 211–220. [Google Scholar] [CrossRef] [Green Version]
- Gerrits, C.; James, W. Restoration of Infiltration Capacity of Permeable Pavers. In Global Solutions for Urban Drainage; American Society of Civil Engineers (ASCE) Publication Division: Reston, VA, USA, 2002; pp. 1–16. [Google Scholar] [CrossRef]
- Brattebo, B.O.; Booth, D.B. Long-term stormwater quantity and quality performance of permeable pavement systems. Water Res. 2003, 37, 4369–4376. [Google Scholar] [CrossRef]
- Baladès, J.D.; Legret, M.; Madiec, H. Permeable Pavements: Pollution Management Tools. Water Sci. Technol. 1995, 32, 49–56. [Google Scholar] [CrossRef]
- Chopra, M.; Stuart, E.; Wanielista, M.P. Pervious Pavement Systems in Florida—Research Results. In Proceedings of the 2010 International Low Impact Development Conference—Redefining Water in the City, San Francisco, CA, USA, 11–14 April 2010; American Society of Civil Engineering: Reston, VA, USA, 2010; pp. 193–206. [Google Scholar] [CrossRef]
- Sehgal, K.; Drake, J.; Van Seters, T.; Vander Linden, W.K. Improving restorative maintenance practices for mature permeable interlocking concrete pavements. Water 2018, 10, 1588. [Google Scholar] [CrossRef] [Green Version]
- Smith, D.R.; Rissmeyer, D. Can One Machine Clean All Permeable Pavements? Available online: https://runoffreducer.com/wp-content/uploads/2017/08/SWM-PAVE-Cyclone-CY5500.pdf (accessed on 4 January 2020).
- Winston, R.J.; Al-Rubaei, A.M.; Blecken, G.T.; Viklander, M.; Hunt, W.F. Maintenance measures for preservation and recovery of permeable pavement surface infiltration rate—The effects of street sweeping, vacuum cleaning, high pressure washing, and milling. J. Environ. Manag. 2016, 169, 132–144. [Google Scholar] [CrossRef] [PubMed]
- Drake, J.; Bradford, A. Assessing the potential for restoration of surface permeability for permeable pavements through maintenance. Water Sci. Technol. 2013, 68, 1950–1958. [Google Scholar] [CrossRef] [PubMed]
- Selbig, W.R. Storm Characteristics, Concentrations, and Loads Measured at the Permeable Pavement Research Facility, Madison, Wisconsin (2014–2016); US Geological Survey: Reston, VA, USA, 2018. [CrossRef]
- Wisconsin Department of Natural Resources Stormwater Post-Construction Technical Standards for Permeable Pavement 2016, Conservation Practice Standard 1008. Available online: http://dnr.wi.gov/topic/Stormwater/standards/postconst_standards.html (accessed on 20 April 2020).
- American Society of Testing and Materials ASTM C33–02a—Standard Test Method for Infiltration Rate of in Place Pervious Concrete 2009, ASTM C33–02a. Available online: https://www.astm.org/DATABASE.CART/HISTORICAL/C33-02.htm (accessed on 20 April 2020).
- Pave Tech Inc. Available online: https://www.pavetech.com/typhoon-picp-maintenance-solutions (accessed on 4 January 2020).
- Helsel, D.R.; Hirsch, R.M. Statistical Methods in Water Resources: U.S. Geological Survey Techniques of Water Resources Investigations; Version 1; U.S. Geological Survey: Reston, VA, USA, 2002; ISBN 04-A3.
- Bean, E.Z.; Hunt, W.F.; Bidelspach, D.A. Field survey of permeable pavement surface infiltration rates. J. Irrig. Drain. Eng. 2007, 133, 249–255. [Google Scholar] [CrossRef]
- Collins, K.A.; Hunt, W.F.; Hathaway, J.M. Hydrologic Comparison of Four Types of Permeable Pavement and Standard Asphalt in Eastern North Carolina. J. Hydrol. Eng. 2008, 13, 1146–1157. [Google Scholar] [CrossRef]
- Roseen, R.M.; Ballestero, T.P.; Houle, J.J.; Avellaneda, P.; Briggs, J.; Fowler, G.; Wildey, R. Seasonal performance variations for storm-water management systems in cold climate conditions. J. Environ. Eng. 2009, 135, 128–137. [Google Scholar] [CrossRef]
- Kayhanian, M.; Anderson, D.; Harvey, J.T.; Jones, D.; Muhunthan, B. Permeability measurement and scan imaging to assess clogging of pervious concrete pavements in parking lots. J. Environ. Manag. 2012, 95, 114–123. [Google Scholar] [CrossRef] [PubMed]
- Brown, R.A.; Borst, M. Evaluation of Surface and Subsurface Processes in Permeable Pavement Infiltration Trenches. J. Hydrol. Eng. 2015, 20, 04014041. [Google Scholar] [CrossRef]
- James, W.; Von Langsdorff, H.; McIntyre, M. Permeable pavers designed for rapid renewal by considering sweeper mechanics: Initial field tests. J. Water Manag. Model. 2018, 26, 1–13. [Google Scholar] [CrossRef] [Green Version]
- Kia, A.; Wong, H.S.; Cheeseman, C.R. Clogging in permeable concrete: A review. J. Environ. Manag. 2017, 193, 221–233. [Google Scholar] [CrossRef] [PubMed]
- Chopra, M.; Kakuturu, S.; Ballock, C.; Spence, J.; Wanielista, M. Effect of rejuvenation methods on the infiltration rates of pervious concrete pavements. J. Hydrol. Eng. 2010, 15, 426–433. [Google Scholar] [CrossRef]
- Al-Rubaei, A.M.; Stenglein, A.L.; Viklander, M.; Blecken, G.T. Long-Term hydraulic performance of porous asphalt pavements in Northern Sweden. J. Irrig. Drain. Eng. 2013, 139, 499–505. [Google Scholar] [CrossRef]
Figure 1.
Images of the permeable pavement research facility in Madison, Wisconsin showing (a) schematic of drainage area and orientation of permeable pavements, and (b) photograph of the permeable interlocking pavers (PICP), pervious concrete (PC), and porous asphalt (PA) test plots. Adapted from Selbig and Buer [1].

Figure 2.
Timeline showing the occurrence of restorative maintenance activities, infiltration tests, and site activity for permeable interlocking pavers (PICP), pervious concrete (PC), and porous asphalt (PA) test plots.
Figure 2.
Timeline showing the occurrence of restorative maintenance activities, infiltration tests, and site activity for permeable interlocking pavers (PICP), pervious concrete (PC), and porous asphalt (PA) test plots.

Figure 3.
Layout of discrete test locations for a surface infiltration test at the permeable pavement test site (pervious concrete shown; numbers indicate the designated label for each discrete location).
Figure 3.
Layout of discrete test locations for a surface infiltration test at the permeable pavement test site (pervious concrete shown; numbers indicate the designated label for each discrete location).

Figure 4.
Heat map illustrating the progression of clogging across the permeable interlocking pavers surface over the first 14 months of the study when no restorative maintenance occurred. Adapted from Selbig and Buer [1] (cm/h, centimeters per hour).
Figure 4.
Heat map illustrating the progression of clogging across the permeable interlocking pavers surface over the first 14 months of the study when no restorative maintenance occurred. Adapted from Selbig and Buer [1] (cm/h, centimeters per hour).

Figure 5.
Images of the six different maintenance practices that were evaluated for use on permeable interlocking pavers (PICP), pervious concrete (PC), and porous asphalt (PA) test plots.
Figure 5.
Images of the six different maintenance practices that were evaluated for use on permeable interlocking pavers (PICP), pervious concrete (PC), and porous asphalt (PA) test plots.

Figure 6.
Infiltration values (cm/h) for nine discrete test locations on 21 June 2017. Average surface infiltration rate was 79 cm/h.
Figure 6.
Infiltration values (cm/h) for nine discrete test locations on 21 June 2017. Average surface infiltration rate was 79 cm/h.

Figure 7.
Response of average infiltration rates to restorative maintenance practices and surface replacement at the permeable interlocking pavers (PICP), previous concrete (PC), and porous asphalt (PA) test plots (the dashed line intersects the date and identifies the type of maintenance practice tested).

Figure 8.
Decline in infiltration rates during the period without maintenance activity following (a) initial surface installation and (b) surface replacement of the permeable interlocking pavers (PICP), pervious concrete (PC), and porous asphalt (PA) test plots (cm/h, centimeters per hour).
Figure 8.
Decline in infiltration rates during the period without maintenance activity following (a) initial surface installation and (b) surface replacement of the permeable interlocking pavers (PICP), pervious concrete (PC), and porous asphalt (PA) test plots (cm/h, centimeters per hour).

Figure 9.
Photographs of the sediment captured in the profiles and on the surfaces of the permeable interlocking pavers (PICP), pervious concrete (PC), and porous asphalt (PA) (the dashed line indicates sediment penetration depth; lower images not to scale).
Figure 9.
Photographs of the sediment captured in the profiles and on the surfaces of the permeable interlocking pavers (PICP), pervious concrete (PC), and porous asphalt (PA) (the dashed line indicates sediment penetration depth; lower images not to scale).


Table 1.
Infiltration rates before and after each restorative maintenance practice as measured at the discrete locations and the results of average surface infiltration rate and percent change at the permeable interlocking pavers (PICP), pervious concrete (PC), and porous asphalt (PA) test plots (-, no tests done; * no treatment performed on discrete location; ** treatment duplicated on discrete location; values in bold indicate a significant increase in infiltration capacity at the 95% confidence level; a negative value indicates a decrease in infiltration capacity; cm/h, centimeters per hour).
| Discrete Location | M1 | M2 | M3 | M4 | M5 | M6 | |||||||
|---|---|---|---|---|---|---|---|---|---|---|---|---|---|
| Pre | Post | Pre | Post | Pre | Post | Pre | Post | Pre | Post | Pre | Post | ||
| PICP | 1 | - | - | <23 | <23 | <23 | <23* | <23 | 660 | <23 | 1130 | <23 | 1185 |
| 2 | - | - | <23 | 58 | <23 | 437 | <23 | 468 | <23 | 1311 | <23 | 1537 | |
| 3 | - | - | <23 | 393 | 74 | 128 | <23 | 1185 | 38 | 1214 | <23 | 1725 | |
| 4 | - | - | <23 | <23 | <23 | <23* | 45 | 688 | 108 | 1171 | <23 | 1130 | |
| 5 | - | - | <23 | <23 | <23 | 1967 | 768 | 793 | 540 | 886 | 262 | 1513 | |
| 6 | - | - | <23 | 87 | <23 | 437 | <23 | 1118 | 723 | 902 | <23 | 1513 | |
| 7 | - | - | <23 | <23 | <23 | <23* | <23 | 697 | 375 | 707 | <23 | 1725 | |
| 8 | - | - | <23 | 66 | <23 | 468 | <23 | 1105 | 422 | 768 | <23 | 1696 | |
| 9 | - | - | 457 | 546 | 457 | 886 | 1171 | 1277 | 1214 | 1347 | 345 | 1756 | |
| Average | - | - | 71 | 138 | 77 | 488 | 235 | 888 | 385 | 1049 | 85 | 1531 | |
| % change | - | 94% | 535% | 278% | 172% | 1703% | |||||||
| p-value | - | 0.02 | 0.02 | <0.01 | <0.01 | <0.01 | |||||||
| PC | 1 | <23 | 33 | - | - | <23 | <23 | - | - | 32 | 378 | <23 | 307** |
| 2 | <23 | <23* | - | - | <23 | <23 | - | - | 50 | 129 | <23 | 49** | |
| 3 | 41 | 41* | - | - | <23 | <23 | - | - | 58 | 428 | <23 | 113 | |
| 4 | 30 | 66 | - | - | <23 | <23 | - | - | 41 | 562 | <23 | 199** | |
| 5 | 36 | 36* | - | - | <23 | <23 | - | - | 262 | 386 | 91 | 154** | |
| 6 | 1118 | 1118* | - | - | 53 | <23 | - | - | 209 | 378 | 66 | 226 | |
| 7 | 36 | 109 | - | - | <23 | 25 | - | - | 73 | 468 | <23 | 317 | |
| 8 | 109 | 109* | - | - | <23 | <23 | - | - | 518 | 298 | 91 | 191 | |
| 9 | 1092 | 1092* | - | - | 546 | 333 | - | - | 651 | 618 | 401 | 492 | |
| Average | 279 | 292 | - | - | 84 | 58 | - | - | 210 | 405 | 85 | 227 | |
| % change | 5% | - | −32% | - | 92% | 169% | |||||||
| p-value | 0.05 | - | 0.86 | - | 0.02 | <0.01 | |||||||
| PA | 1 | - | - | - | - | 25 | 46 | - | - | - | - | 1214 | 1756 |
| 2 | - | - | - | - | <23 | <23 | - | - | - | - | 1130 | 1667 | |
| 3 | - | - | - | - | 25 | <23 | - | - | - | - | 1425 | 1855 | |
| 4 | - | - | - | - | 518 | 518 | - | - | - | - | 1639 | 2399 | |
| 5 | - | - | - | - | 333 | 393 | - | - | - | - | 1788 | 2658 | |
| 6 | - | - | - | - | 492 | 615 | - | - | - | - | 1696 | 2138 | |
| 7 | - | - | - | - | 452 | 562 | - | - | - | - | 1667 | 2235 | |
| 8 | - | - | - | - | 56 | 84 | - | - | - | - | 1405 | 2049 | |
| 9 | - | - | - | - | 719 | 806 | - | - | - | - | 1199 | 1667 | |
| Average | - | - | - | - | 294 | 341 | - | - | - | - | 1463 | 2047 | |
| % change | - | - | 16% | - | - | 40% | |||||||
| p-value | - | - | 0.02 | - | - | <0.01 | |||||||


This work was authored as part of the Contributor’s official duties as an Employee of the United States Government and is therefore a work of the United States Government. In accordance with 17 U.S.C. 105, no copyright protection is available for such works under U.S. Law. This is an Open Access article that has been identified as being free of known restrictions under copyright law, including all related and neighboring rights (https://creativecommons.org/publicdomain/mark/1.0/). You can copy, modify, distribute and perform the work, even for commercial purposes, all without asking permission.
Share and Cite
MDPI and ACS Style
Danz, M.E.; Selbig, W.R.; Buer, N.H. Assessment of Restorative Maintenance Practices on the Infiltration Capacity of Permeable Pavement. Water 2020, 12, 1563. https://doi.org/10.3390/w12061563
AMA Style
Danz ME, Selbig WR, Buer NH. Assessment of Restorative Maintenance Practices on the Infiltration Capacity of Permeable Pavement. Water. 2020; 12(6):1563. https://doi.org/10.3390/w12061563
Chicago/Turabian StyleDanz, Mari E., William R. Selbig, and Nicolas H. Buer. 2020. "Assessment of Restorative Maintenance Practices on the Infiltration Capacity of Permeable Pavement" Water 12, no. 6: 1563. https://doi.org/10.3390/w12061563
Note that from the first issue of 2016, this journal uses article numbers instead of page numbers. See further details here.