Article

Distributive Characteristics of Riverine Nutrients in the Mun River, Northeast Thailand: Implications for Anthropogenic Inputs

1
Institute of Earth Sciences, China University of Geosciences (Beijing), Beijing 100083, China
2
Tianjin Key Laboratory of Water Resources and Environment, Tianjin Normal University, Tianjin 300387, China
3
The Institute of Hydrogeology and Environmental Geology, Chinese Academy of Geological Sciences, Shijiazhuang 050061, China
4
Institute of Geographic Sciences and Natural Resources Research, Chinese Academy of Sciences, Beijing 100101, China
*
Author to whom correspondence should be addressed.
Water 2019, 11(5), 954; https://doi.org/10.3390/w11050954
Submission received: 27 March 2019 / Revised: 29 April 2019 / Accepted: 4 May 2019 / Published: 7 May 2019
(This article belongs to the Section Hydrology)

Abstract

:
The nutrient contents of Mun River water in northeast Thailand during the dry season were measured to investigate the effect of human activities on dissolved load species. Dissolved organic carbon (DOC) values varied from 2.5 to 17.1 mg/L, averaging 9.0 mg/L; dissolved inorganic nitrogen (DIN) ranged between 0.12 and 0.11 mg/L; Cl values ranged from 1.7 to 668.6 mg/L, with an average value of 84.8 mg/L; dissolved silicon (DSi) varied from 1.7 to 9.9 mg/L; and SO42 values averaged 8.9 mg/L. DOC, Cl, and SO42 contents decreased with the flow direction. The high concentrations of DOC, K+, Cl, and SO42 in the upper reaches were closely related to anthropogenic inputs, specifically industrial sewage. The covariation demonstrated that these dissolved loads may have the same sources. In other regions, Cl contents were derived from weathering products. DIN contents maintained the same level on the river, and few sampling sites with high concentrations of DIN were influenced by point source pollution. The extremely low P concentrations limited algal growth, and the DSi showed no clear relationship with N and K, indicating that DSi in the Mun River was controlled by the weathering input rather than biological effects. The exact reverse spatial distributions of DOC between the wet and dry seasons (which increased with the flow direction in the wet season) were due to different precipitation rates, and the rare rainfall in the dry season had difficulty flushing the soil and transporting soil organic matter into the rivers. The local government should control sewage discharge and optimize farming methods.

1. Introduction

River waters, though constituting only a fairly small proportion of the hydrosphere, are the fundamental links between territorial matters and the ocean [1,2,3]. Rivers transfer both natural weathering products and anthropogenic materials to the sea and influence the seawater composition [4,5,6]. The river chemistry can be affected by numerous natural geochemical processes, such as climate, tectonics, weathering, vegetation cover, and so forth [7,8,9,10], among which the dominant factor is clearly the lithology (i.e., rock weathering), because rocks are the main source of the dissolved loads in river waters [11,12]. Human activities also play an important role in river water chemistry. On the one hand, the waste inputs (e.g., industrial sewage, agricultural fertilizers, and domestic and urban sewage) discharged into rivers directly raise the contaminant contents and result in environmental problems, which may threaten water quality and become a potential health risk [13,14,15]. On the other hand, the land-use type may disturb the natural geochemical processes and accelerate the weathering processes [16,17]. Therefore, studies on river water chemistry can reveal the geochemical processes and provide policy considerations for comprehensive watershed management.
Nutrient elements include C, S, N, K, P, Si, and so on, which are closely related to life activities [18]. The dissolved organic carbon (DOC), as the index of the organic matter level, can reflect the organic pollution degree of rivers and is closely correlated with water quality [19,20]. DOC is mainly derived from soil organic matter, biological production, and anthropogenic inputs [5,21,22]. The DOC contents can influence aquatic communities [23] and are conducive to the transference of heavy metals in river waters by forming organic complexes [24,25], which may lead to the enrichment of toxic metals [26]. DOC is an important component of the global carbon cycle and is related to environmental and climate changes [5,27,28]. The inorganic dissolved loads in river waters are derived from different sources: rock dissolution, precipitation, and anthropogenic inputs [29]. It is well known that Cl, dissolved inorganic nitrogen (DIN), and SO42− are mostly derived from anthropogenic inputs [6,29], so examining the spatial distributions of dissolved loads can help us understand the pollution sources. Few research works have systematically examined the distribution of these nutritive elements under typical human disturbances. In this study, the coupling of these nutrient elements was employed to determine the relationship between these dissolved loads and the impact of anthropogenic inputs.
With the rapid development of industry and agriculture in recent years, the Mun River Basin, located in northeast Thailand, has been threatened by environmental problems [30,31,32]. Our previous study [31] reported the dissolved carbon and nitrogen species in the wet season, which emphasized that agricultural activities have a significant impact on organic matter contents and that the Mun River water chemistry was influenced by human activities. The aim of this study was to report and investigate (1) the spatial distributions of nutritive elements and their potential sources in the dry season, (2) the relationship between the nutrients, and (3) the impact of human activities on the nutrients.

2. Study Area and Method

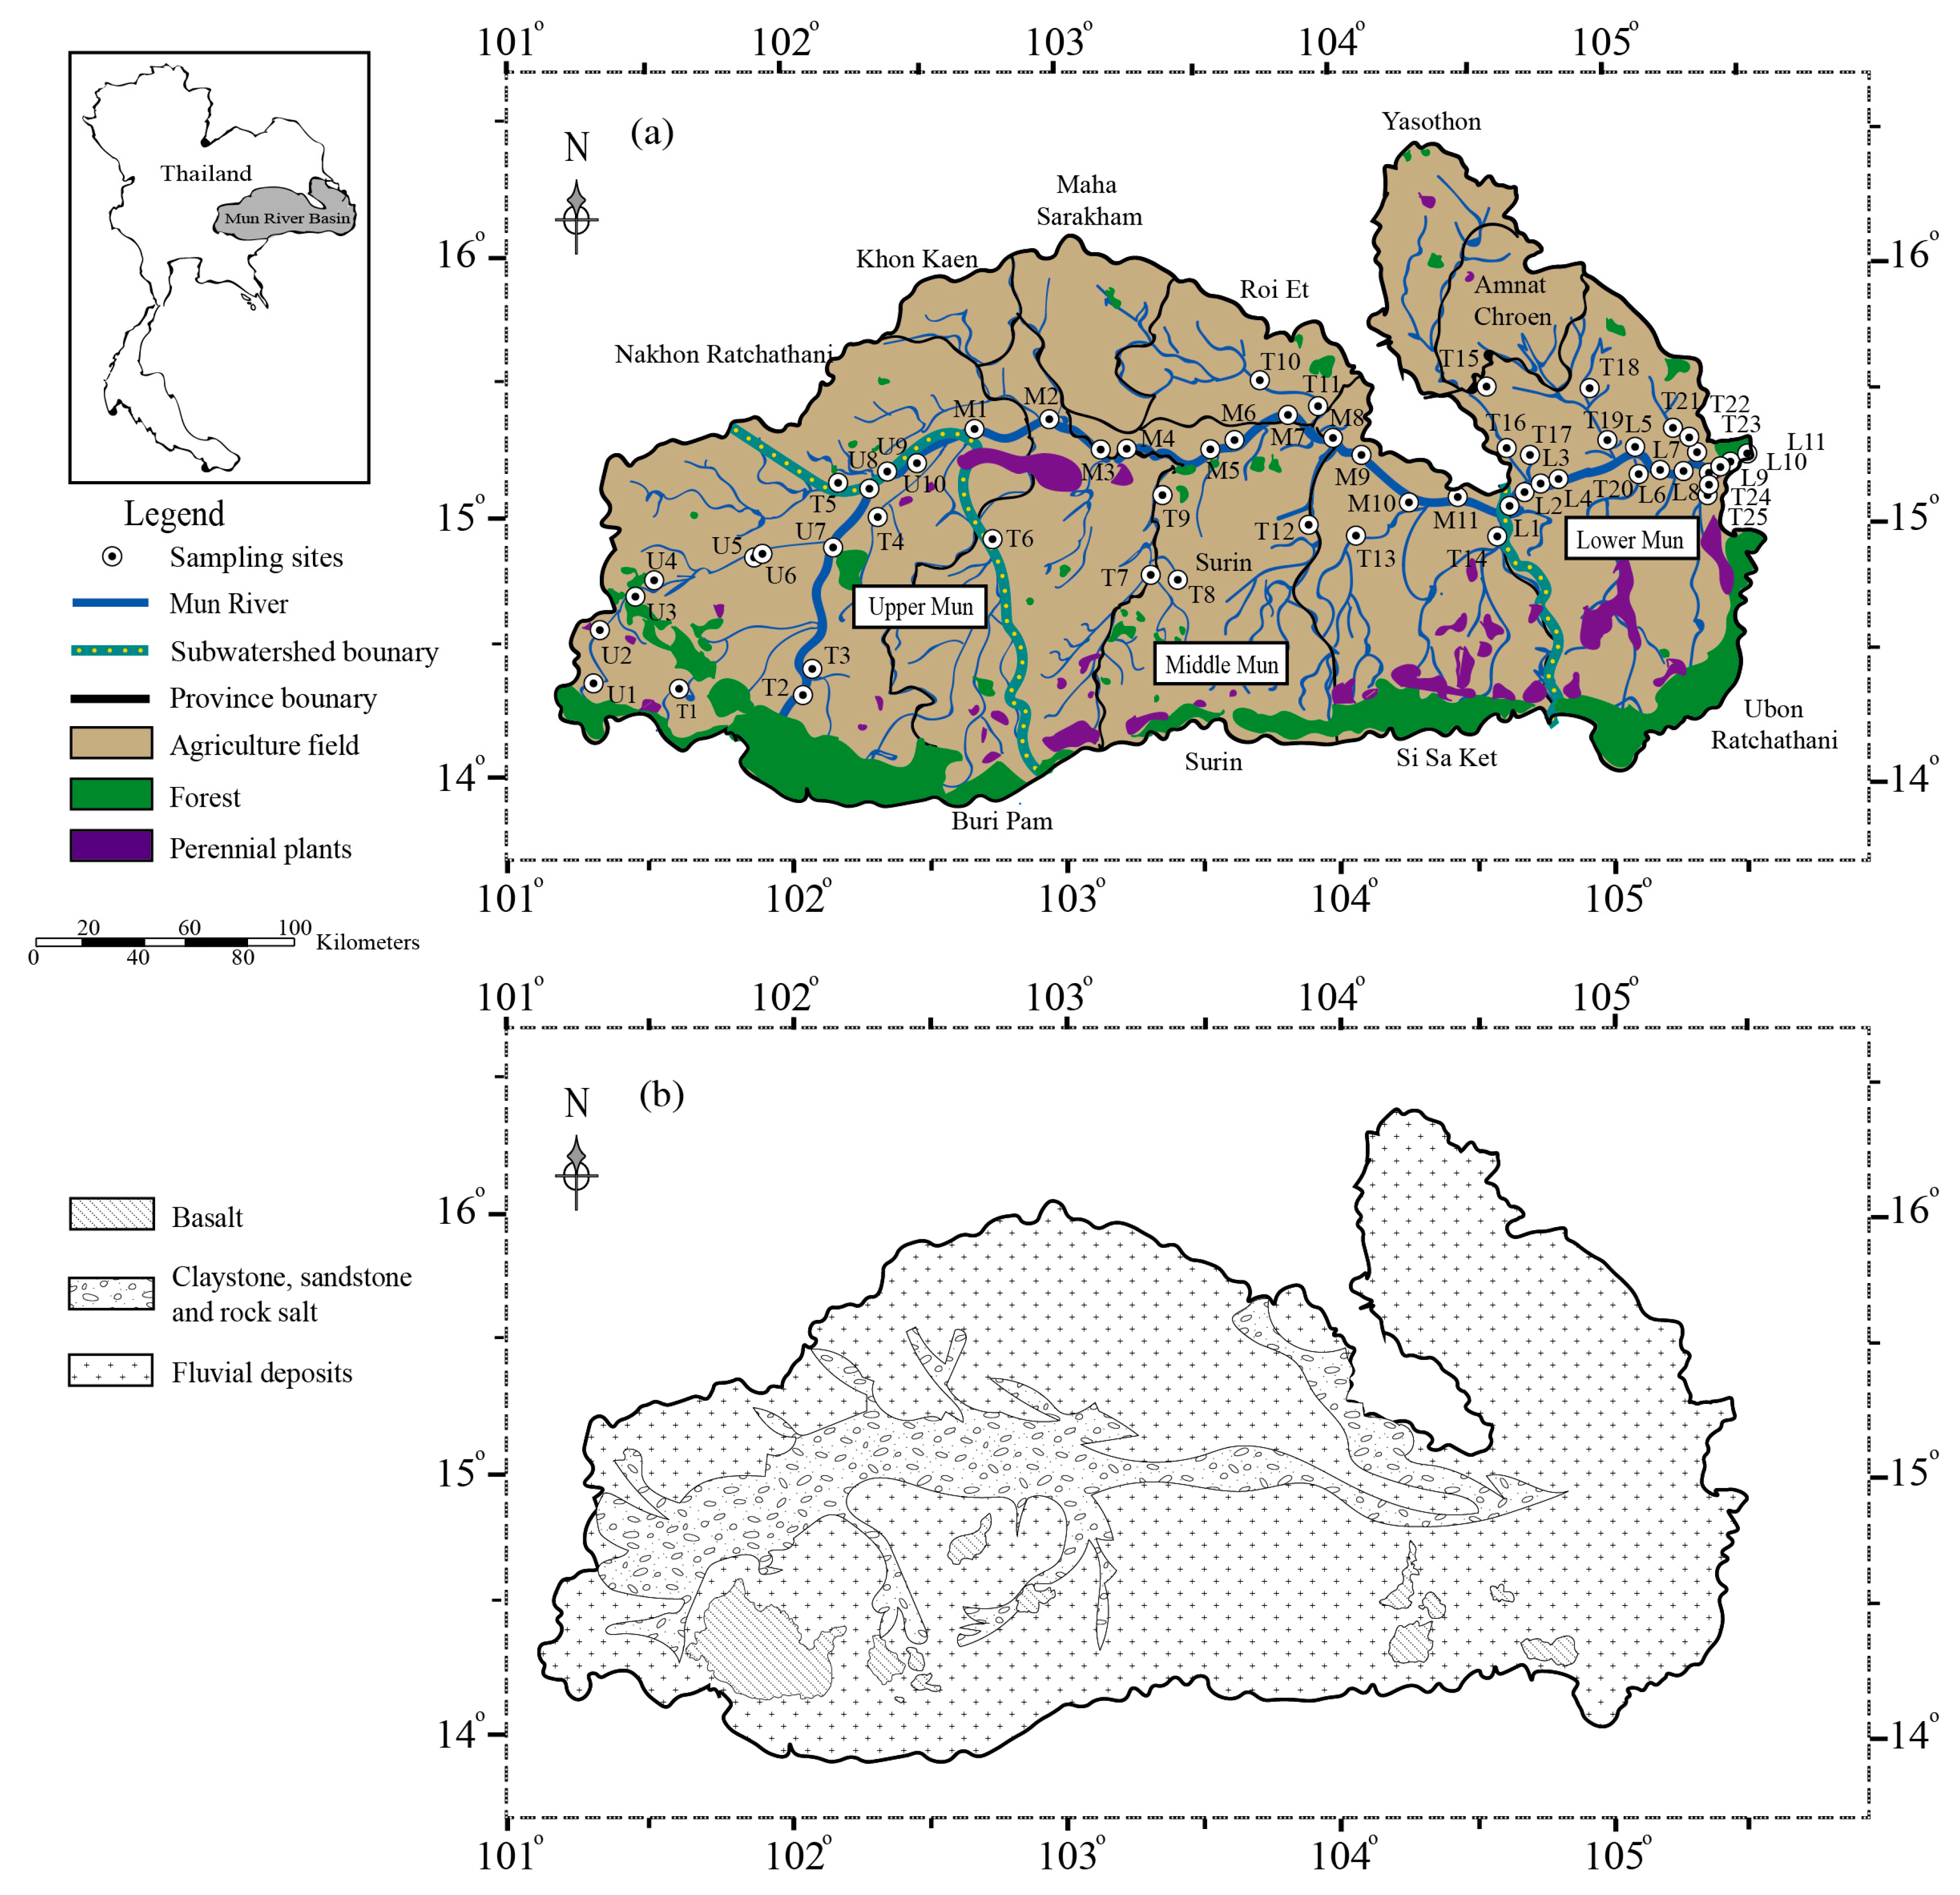
2.1. Study Area Location

The 673-km-long Mun River, situated in northeastern Thailand, originates from Nakhon Ratchasima Province, drains 10 provinces, and discharges into the Mekong River (Figure 1a). Its drainage basin covers 71,060 km2 (14° N–16° N and 101°30′ E–105°30′ E) [33]. Under the influence of a typical humid subtropical climate, the Mun River Basin has a high rate of rainfall in the wet season (from May to October) and a low rainfall rate in the dry season (from November to April). The average annual precipitation is between 1300 and 1500 mm, and the average runoff of the Mun River in the dry season is ≈367 m3/s and ≈959 m3/s during the wet season. The annual mean volume of water discharge is 2.5 × 10¹⁰ m3, which is equal to an annual runoff of 210 mm or 800 m3/s [33,34]. The mean air temperature is about 18 °C. The elevation in the watershed decreases from the west to the east. The central and eastern areas are relatively flat, while the southwestern area is mostly mountainous. The terrains where the Mun River flows through are mainly fluvial deposit areas, and the whole watershed is dominated by cretaceous claystone and sandstone, although some evaporites such as halite and gypsum are scattered throughout the study area (Figure 1b). Tertiary basalt is distributed in the south of the river basin, with a small coverage area of less than 10% [30]. According to previous studies, the Mun watershed can be divided into three subwatersheds: the Upper Mun (101°30′ E–102°30′ E), the Middle Mun (102°30′ E–104°30′ E), and the Lower Mun (104°30′ E–105°30′ E) [34].

2.2. Sampling Procedure and Analytical Methods

River water samples were collected in March 2018 (during the dry season). The 57 sampling sites extended from the lower reaches of the Mun River to the upstream area. The longitude and latitude data of the sites were recorded by global positioning system (GPS). The geographical locations of the sampling sites are shown in Figure 1. Each water sample was collected at a depth of about 10 cm midstream of the river on a bridge or in a ferry. High-density polyethylene (HDPE) bottles and glass bottles were soaked with 10% HCl and rinsed with Milli-Q water (18.2 MΩ·cm) in the laboratory. Each container was rinsed three times with the corresponding sample. The samples for DOC analysis were immediately filtered through a 0.7-μm filter (Whatman GF/F, precleaned, General Electric Company (GE), Boston, MA, USA) and stored in the glass bottles. Then, they were acidified with ultrapurified HCl to keep pH < 2. All the samples for ions analysis were filtered through a precleaned 0.22-μm Millipore membrane (Merck KGaA, Darmstadt, Germany), a portion of which was directly stored in the HDPE bottles for measuring anions, while another portion was acidified with ultrapurified HCl to pH < 2 for measuring cations and then kept in the HDPE bottles. All collected samples were refrigerated at approximately 4 °C prior to analysis.
The measurements of water temperature, pH, total dissolved solids (TDS), and dissolved oxygen (DO) were determined in by using a YSI water quality analyzer 6920 (Xylem Inc., Yellow Springs, OH, USA). HCO3 was titrated by HCl (0.03 M) in the field. The cations (Na+, K+, Ca2+, and Mg2+) and anions (Cl and SO42−) were analyzed by ion chromatography (DIONEX, Sunnyvale, CA, USA) at the Institute of Geographic Sciences and Natural Resources Research, CAS. DIN was examined by a continuous flow analyzer (AA3, SEAL Analytical GmbH, Norderstedt, Germany) at Tianjin Normal University. Dissolved silicon (DSi) was examined by UV–Vis spectrophotometry (Metash, Shanghai, China), and concentrations of DOC were measured by an Elementar Vario TOC (Elementar, Hanau, Germany) at the Laboratory of Surficial Environmental Geochemistry, China University of Geosciences (Beijing). Replicate samples were employed to achieve accurate analysis. The results of the measurements are shown in Table S1.

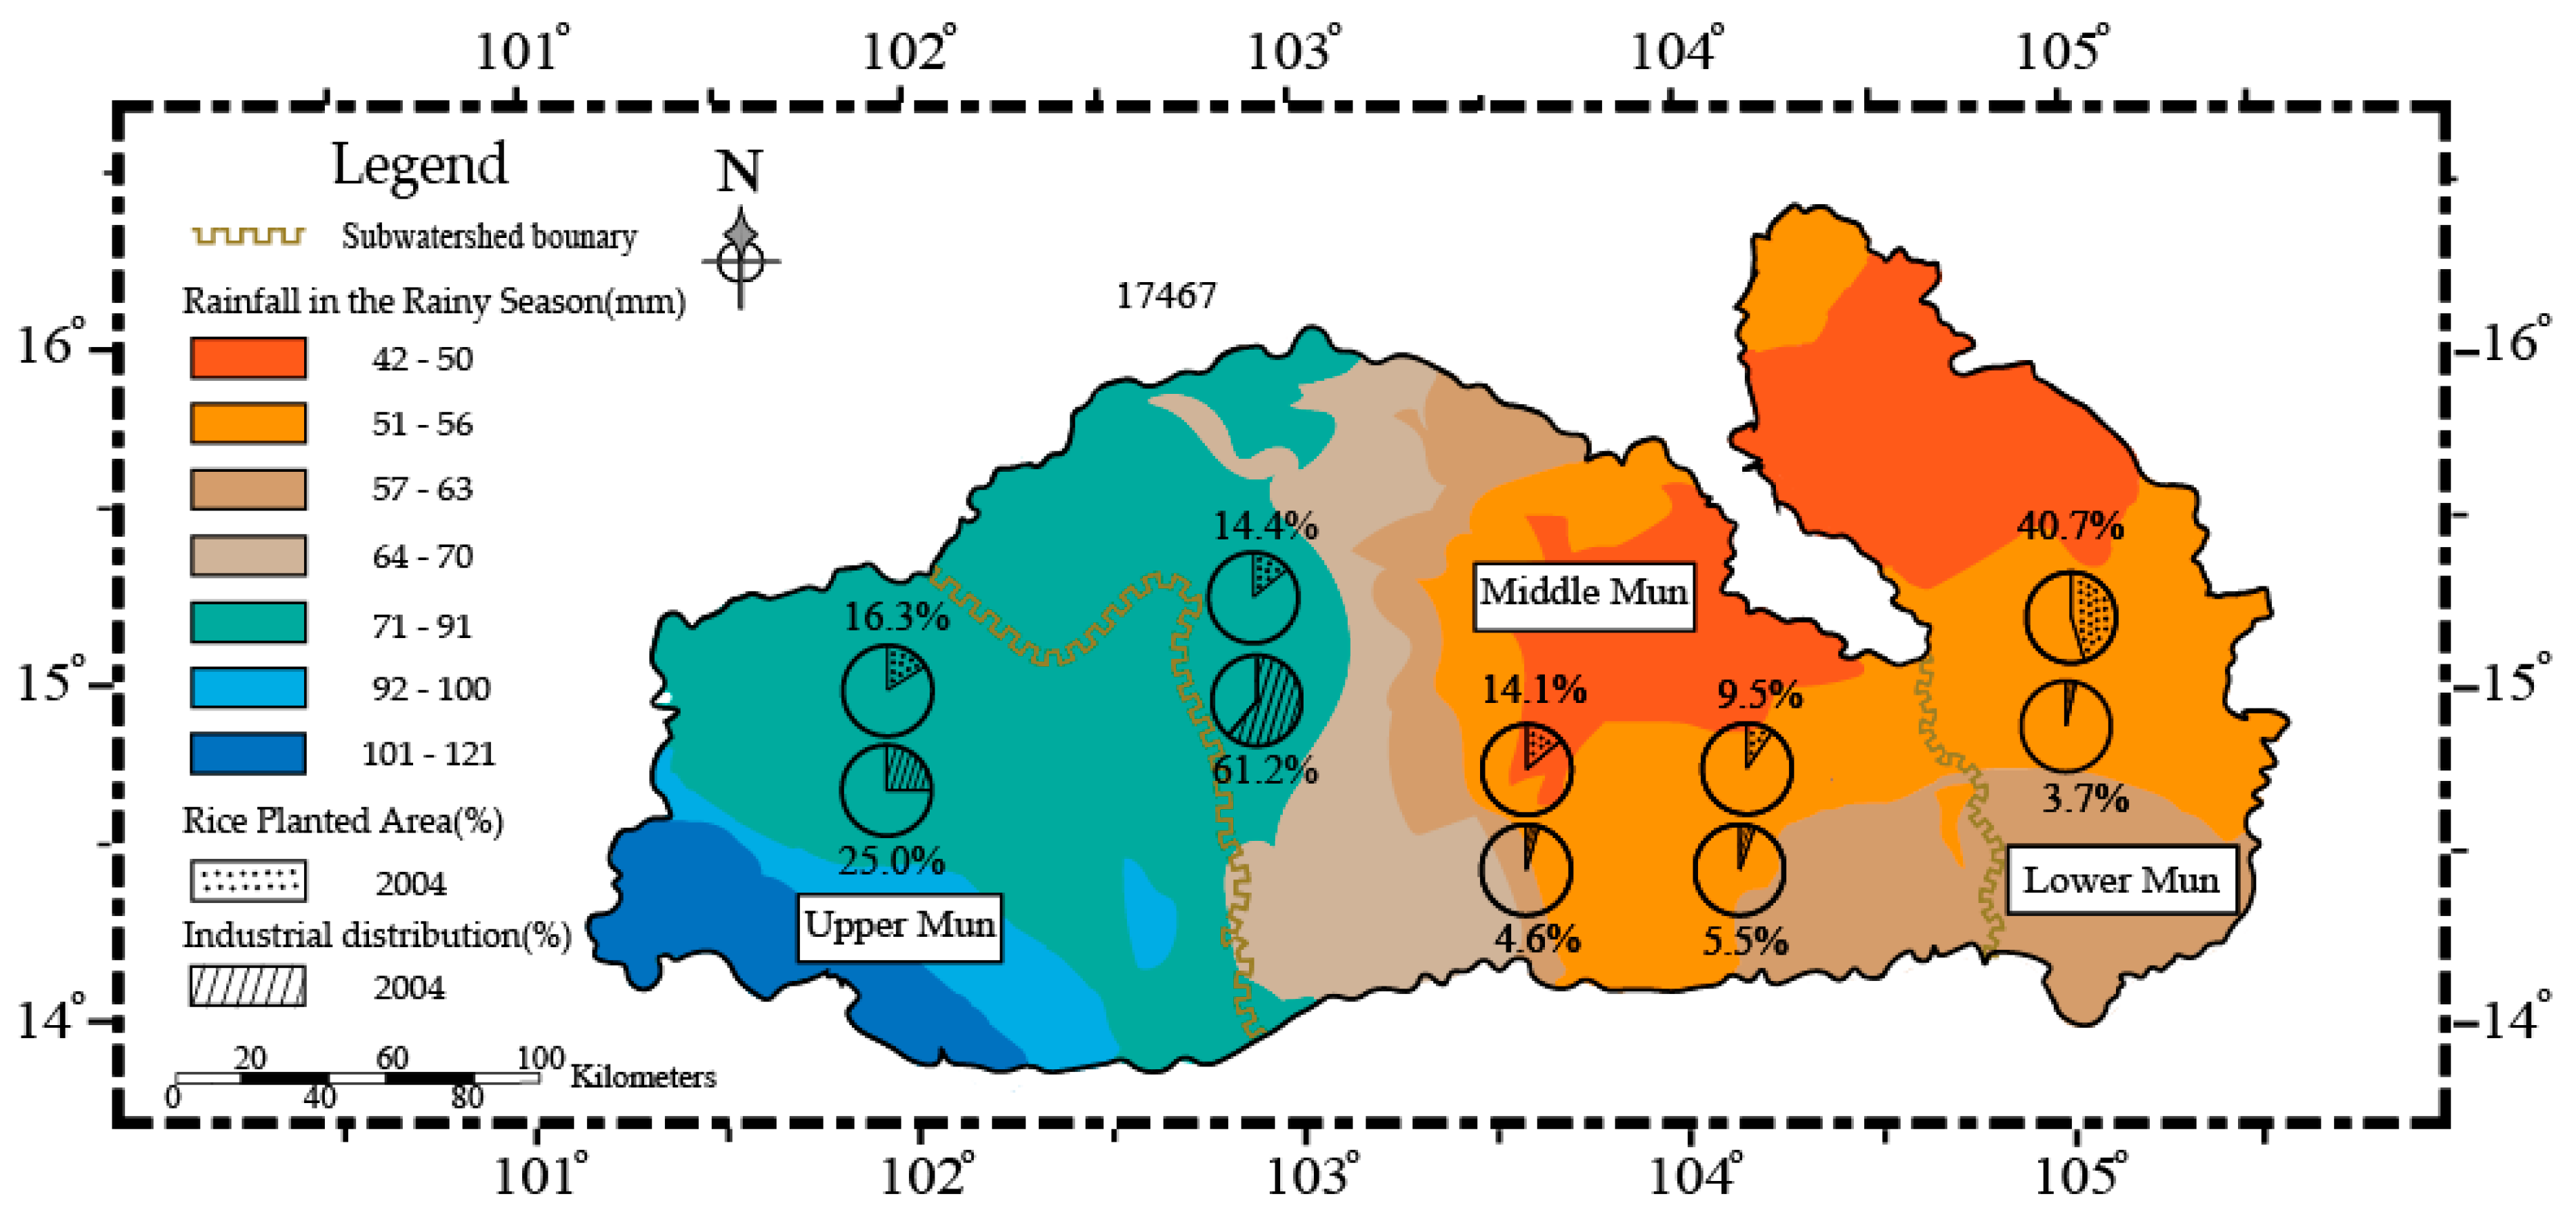
2.3. Land-Use Type and Precipitation Distributions

Detailed descriptions of the land use in the Mun River Basin were given in previous studies [31,32]. In short, agricultural land is dominant land-use type, which takes up nearly 80% of the total area, as shown in Figure 1. Agricultural land is mainly concentrated in the Middle-Lower Mun River. The intensive agricultural activities affect soil nutrient contents, thereby resulting in poor water quality in the Lower Mun. The factories and workshops, as point source pollution, are grouped in the Upper-Middle Mun (Figure 2) and influence the chemical composition of Mun River water. Thus, land-use type in the Mun River Basin provides an excellent opportunity to examine the impacts of anthropogenic inputs from different sources on the river water.
The spatial distributions of precipitation in the dry season are exhibited in Figure 2. The precipitation varies from 42 to 121 mm and decreases along the flow direction. The higher elevation and forest cover in the upper reaches, in comparison with the lower reaches, are favorable for precipitation. Vegetation distribution and topographic factors may account for the spatial distribution of precipitation [30].

3. Results and Discussion

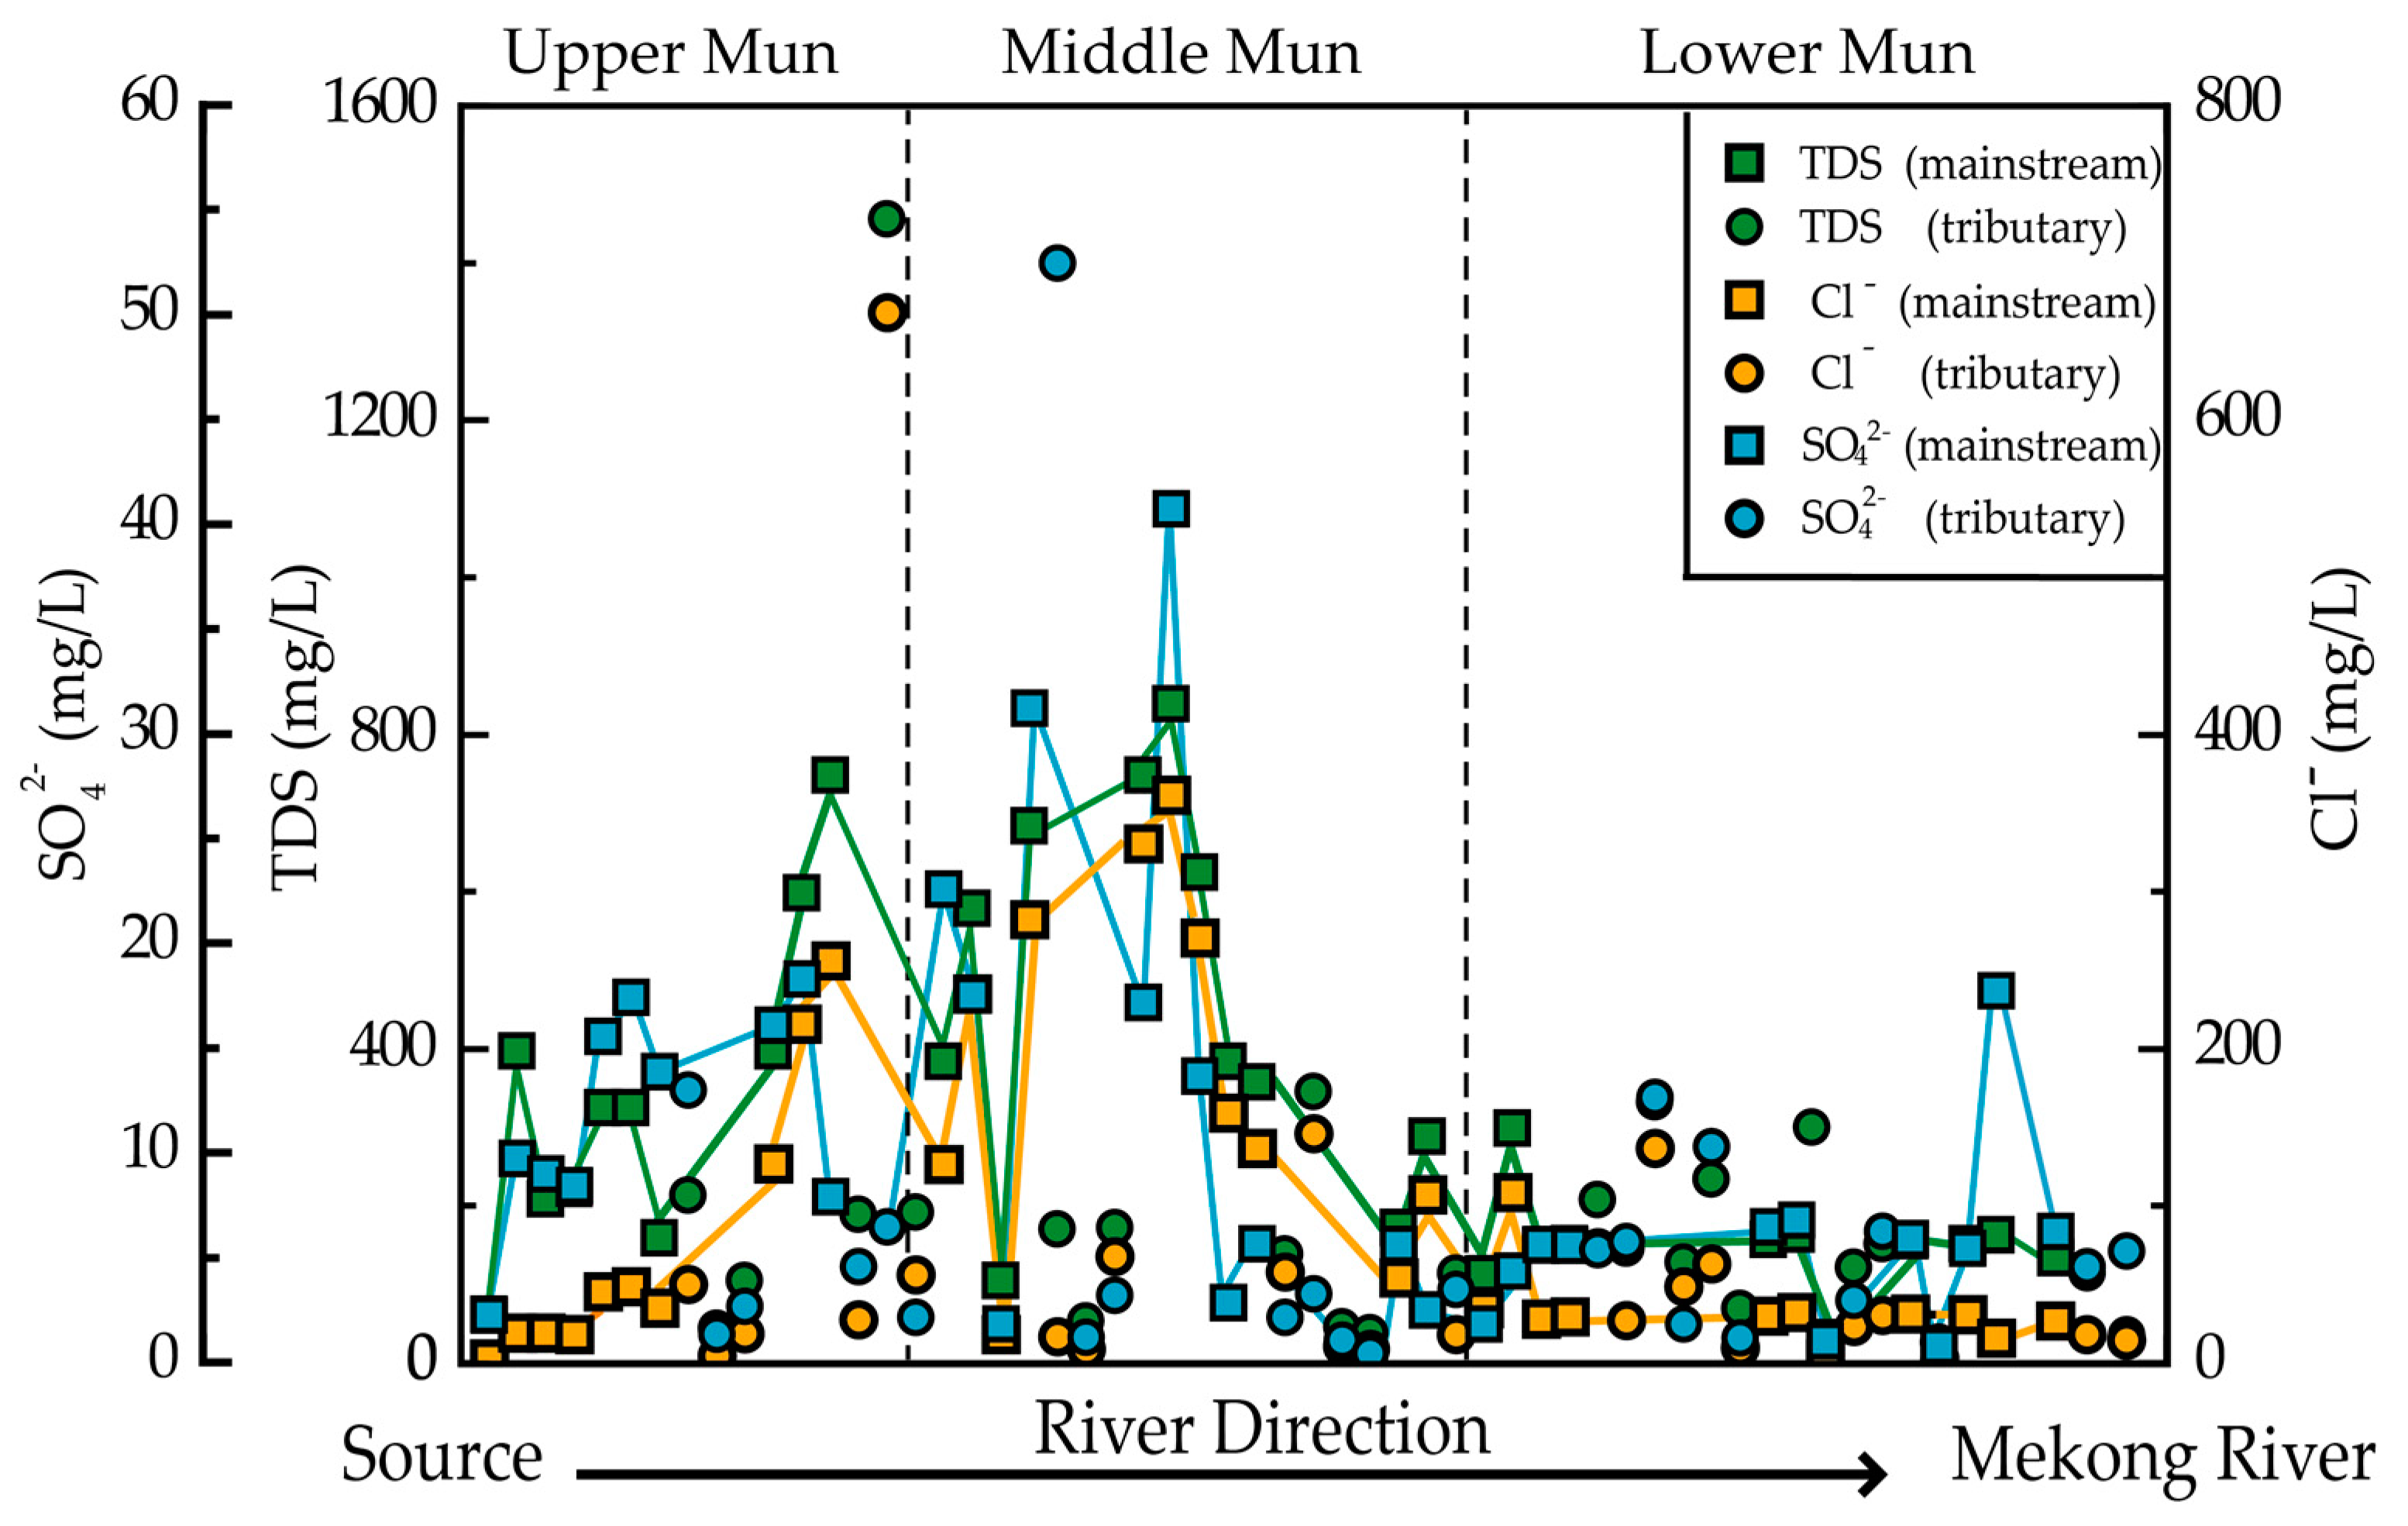
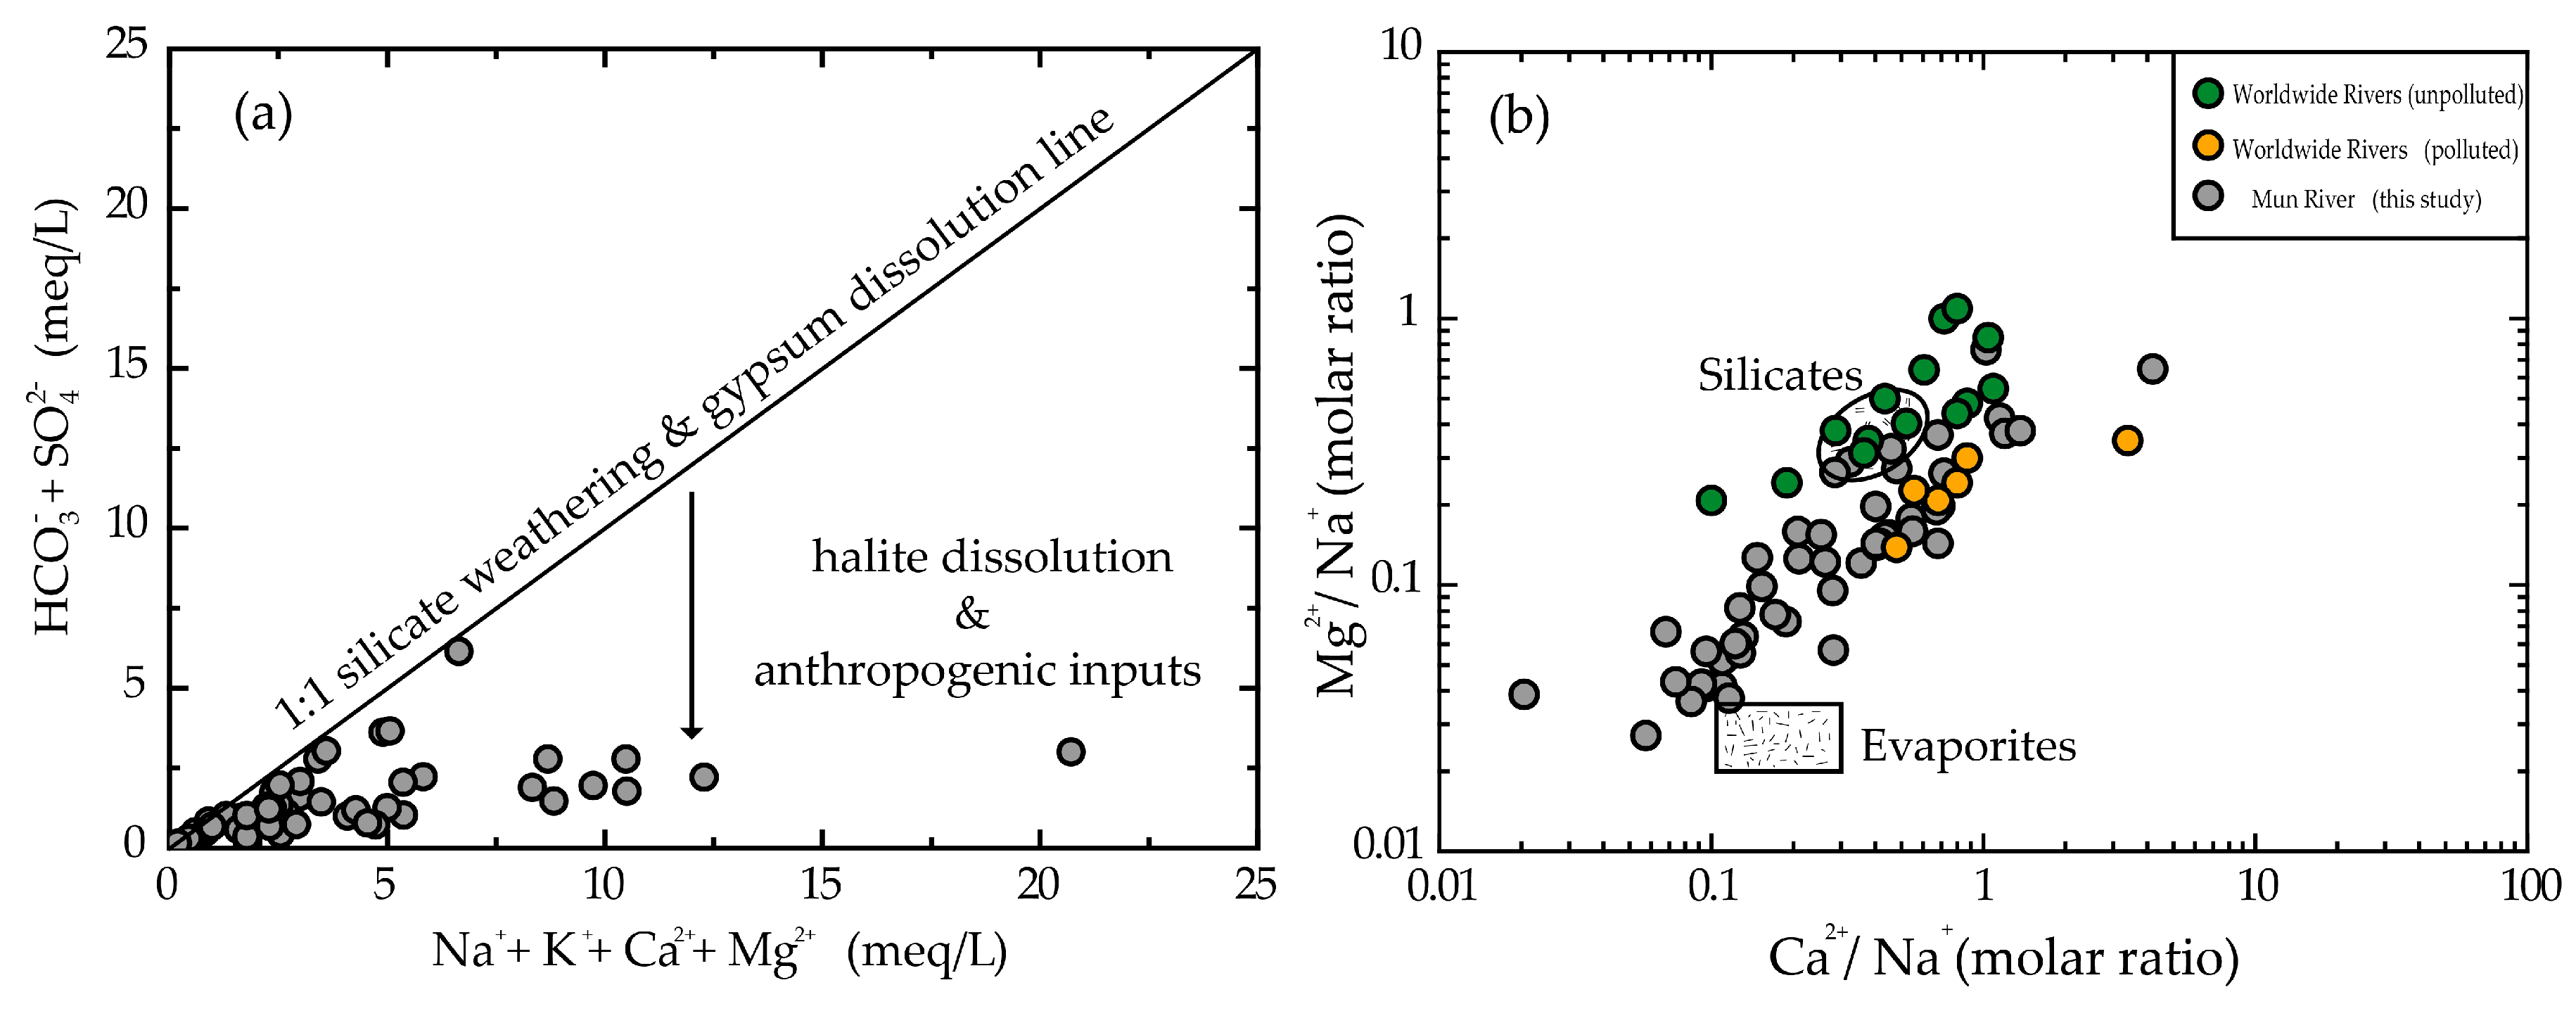
3.1. Sources of Major Anions

The river water chemistry can be controlled by both natural geochemical processes and anthropogenic perturbations [35]. It is well known that the riverine ions Cl, SO42, and DIN are closely related to anthropogenic inputs (agricultural and industrial inputs) [29,36]. The potential sources of these ions are listed as follows:
[Cl]riv = [Cl]atm + [Cl]anthro + [Cl]evap
[NO3]riv = [NO3]atm + [NO3]anthro
[SO42−]riv = [SO42−]evap+ [SO42−]anthro
where riv = river, atm = atmosphere, anthro = anthropogenic inputs, and evap = evaporite weathering input (the anthropogenic inputs of SO42 consist of atmospheric and waste inputs). In order to estimate the contributions of the rain, the lowest concentration of Cl (1.73 mg/L) and NO3 (0.02 mg/L) in pristine areas was assumed to represent the atmospheric input [37]. The calculation results demonstrated that the contributions of atmospheric inputs on Cl and NO3 accounted for less than 5% of the total dissolved ions.
The spatial distributions of dissolved loads in the Mun River are exhibited in Figure 3 and Table 1.
The Mun River had TDS values ranging between 14 and 1456 mg/L and exhibited the clear spatial distribution of decreasing along the flow direction. TDS values are mainly derived from weathering products and anthropogenic inputs [11,38]. The Mun River flows over basement rocks consisting of silicate and a small amount of evaporite. As a typical small watershed, the weathering rates should be at the same level, and the sampling period was during the dry season, when the scarce precipitation and low temperature are not conducive to chemical weathering [39]. Therefore, the great variation of TDS should not be attributed to the weathering process. The higher TDS values in the Upper-Middle Mun were most likely related to the concentrated industrial facilities. The molar ratio of Cl/Na+ corroborated this. If the chemical weathering controlled the dissolved load, the Cl/Na+ ratio should be lower than 1 (the Cl/Na+ derived from evaporite dissolution should be equal to 1:1, while silicate weathering would add more Na+ into the water, leading to a lower ratio) [29]. In the Upper-Middle Mun, the TDS values were always accompanied by high Cl/Na+ ratios (greater than 1), revealing that anthropogenic inputs have a significant impact on Mun River water.
The Cl contents displayed higher values in the Upper-Middle Mun (Figure 3). The sampling site T5, located at the juncture of the Upper and Middle Mun, had the highest Cl content (668.5 mg/L) in conjunction with the highest NO3-N (0.99 mg/L), TDS (1456 mg/L), and Na+ (369.6 mg/L) contents. These dissolved loads were closely correlated with anthropogenic inputs; however, the absolute concentrations can be disturbed by the runoff [11]. As a consequence, the molar ratios were considered, which can eliminate the effects of runoff dilution and evaporation processes and reflect relatively accurate information about the geochemical processes. The molar ratio of Cl/Na+ in T5 was 1.18 and that of Cl/HCO3 was 6.5, indicating that the river water was obviously impacted by human activities. The Cl contents in the upper reaches of the Upper Mun (U1–U4) and the Lower Mun showed relatively lower values. The average Cl/Na+ ratio was 0.84 (averaging 1.10 in the Middle Mun), which suggests that anthropogenic inputs contributing to the Cl contents in the upper reaches of the Upper and Lower Mun were limited. The weathering input of halite was the potential source (discussed in Section 3.2).
SO42 also showed higher concentrations in the Upper-Middle Mun, which were similar to Cl and TDS. However, the sampling site T7 with the highest SO42 concentration had fairly low Cl (16.8 mg/L) and TDS (170 mg/L) concentrations, while there was a clear correlation between SO42− and Cl (R2 = 0.69; p < 0.01) in other sampling sites located in the Middle Mun. The SO42− contents in T7 were not derived from the gypsum dissolution. Based on the forward method [37,40], riverine Ca2+ is mainly derived from carbonate and silicate weathering, and dissolved Mg2+ comes from carbonate and silicate weathering. There was no carbonate in the Mun River Basin, and as a consequence, the riverine Mg2+ was roughly derived from silicate weathering. Previous studies have reported that the Ca2+/Mg2+ ratio for silicate weathering varied from 2.5 to 4 [6,29,37]. Thus, the following mass balance equation was used:
[SO42]gyp = [Ca2+]gyp = [Ca2+]riv − [Ca2+]sil = [Ca2+]riv − (Ca2+/Mg2+)sil × [Mg2+]sil
where gyp = gypsum weathering input, sil = silicate weathering input, and riv = riverine concentration. The calculation result showed that the contribution of gypsum weathering input in T7 took up less than 30% of the total SO42− contents. As a consequence, the highest SO42− concentrations in T7 resulted from anthropogenic inputs, which contained little Cl.
DSi contents in the Mun River varied between 1.7 and 9.9 mg/L, similar to the range of worldwide rivers (from 3.9 to 6.1 mg/L), and decreased slightly along the flow direction [41,42]. The DSi contents in river waters are controlled by various factors (silicate weathering inputs, biological effects, and sewage inputs, among which the biological effects are considered the dominant factor, and sewage inputs lead to biological effects). The diatoms can convert the DSi to BSi (Biological Silicon) and then be buried in riverbed, which can significantly reduce the DSi contents in river waters [43,44]. In general, the input of N, P, and K can lead to eutrophication and then accelerate the growth of aquatic organisms, including diatoms [45]. Here, the P species did not achieve the detection limit (the correlation between DSi and N and K is discussed in the next section).
The DIN-N values ranged between 0.12 and 3.69 mg/L and maintained the same level throughout the whole watershed (Figure 4). As a common inorganic pollutant, DIN is mostly derived from fertilizers, sewage waste, and industrial sewage [46]. A few sampling sites with high DIN concentrations in Mun River waters should be close to the point pollution sources, as the Cl/Na+ values were greater than 1 (ranging from 1.10 to 1.32). The biological effects may also be influenced by DIN contents: phytoplankton and microorganisms can uptake the riverine DIN and convert it to organic matter [47,48], while bacterial ammonification and nitrification reverse these processes and generate DIN [49]. However, in Mun River waters, these processes should be limited because of the low concentrations of P species.
K+ contents had clearly high values in the Upper Mun. It is well known that K+ is mainly from silicate weathering and anthropogenic inputs. Here, the poor correlation between Na+ and K+ suggests that silicate weathering was not the dominant factor (R2 = 0.14). Previous studies [29] estimated the K+ derived from urban and industrial sewage has a K+/Na+ ratio of about 0.16. The K+/Na+ ratio of the sampling sites with high K concentrations varied from 0.04 to 0.18, and the relatively lower values resulted from the evaporite-derived Na+ contents. Consequently, the high K+ contents in Mun River water were related to anthropogenic inputs.

3.2. Weathering Processes

The ionic equivalent ratio of SO42 + HCO3/(Na+ + K++ Ca 2++ Mg2+) is a proxy commonly related to weathering processes:
Cax(Mg)1−xAl2(Si3O8)2 + H2SO4 → xCa2++ (1 − x)Mg2+ +SO42− + 6SiO2+2AlOOH
2Nax(K)1xAl2Si3O8 + H2SO4 → 2xNa++ 2(1 − x)K++ SO42− + 6SiO2+2AlOOH
Cax(Mg)1−xAl2(Si3O8)2+ 2CO2 + 2H2O → xCa2++ (1 − x)Mg2+ +2HCO3 + 6SiO2+2AlOOH
Nax(K)1xAlSi3O8 + CO2 + H2O → xNa++ (1 − x)K++ HCO3 + 3SiO2+ AlOOH
CaSO4 → Ca2+ + SO42−.
In the Mun River, the ratios obviously deviated from the silicate weathering and gypsum dissolution line (Figure 5), indicating that silicate weathering and gypsum dissolution were not the controlling factors of the dissolved loads. As discussed before, Cl is the dominant anion compared with SO42− and HCO3, so the deviation resulted from the high Cl content, namely, from anthropogenic inputs and rock salt dissolution. Consequently, anthropogenic inputs, especially those derived from the grouped factories in the Upper-Middle Mun, have a significant impact on the river water. The correlation between Mg2+/Na+ and Ca2+/Na+ can reveal the mixing of different lithologic weathering processes [11]. As shown in Figure 5, Mun River water came closer to worldwide polluted rivers (orange points) and deviated from the two lithologic end-members. It is widely accepted that riverine Ca2+ and Mg2+ are free from anthropogenic inputs, while Na+ is related to pollution and water quality [6,33]. As anthropogenic inputs may also bring a considerable amount of Na+, Mg2+/Na+ and Ca2+/Na+ values were lower than the simple mixing of weathering products. This result is in line with the discussion regarding anthropogenic inputs having significant impacts on the chemical composition of water.

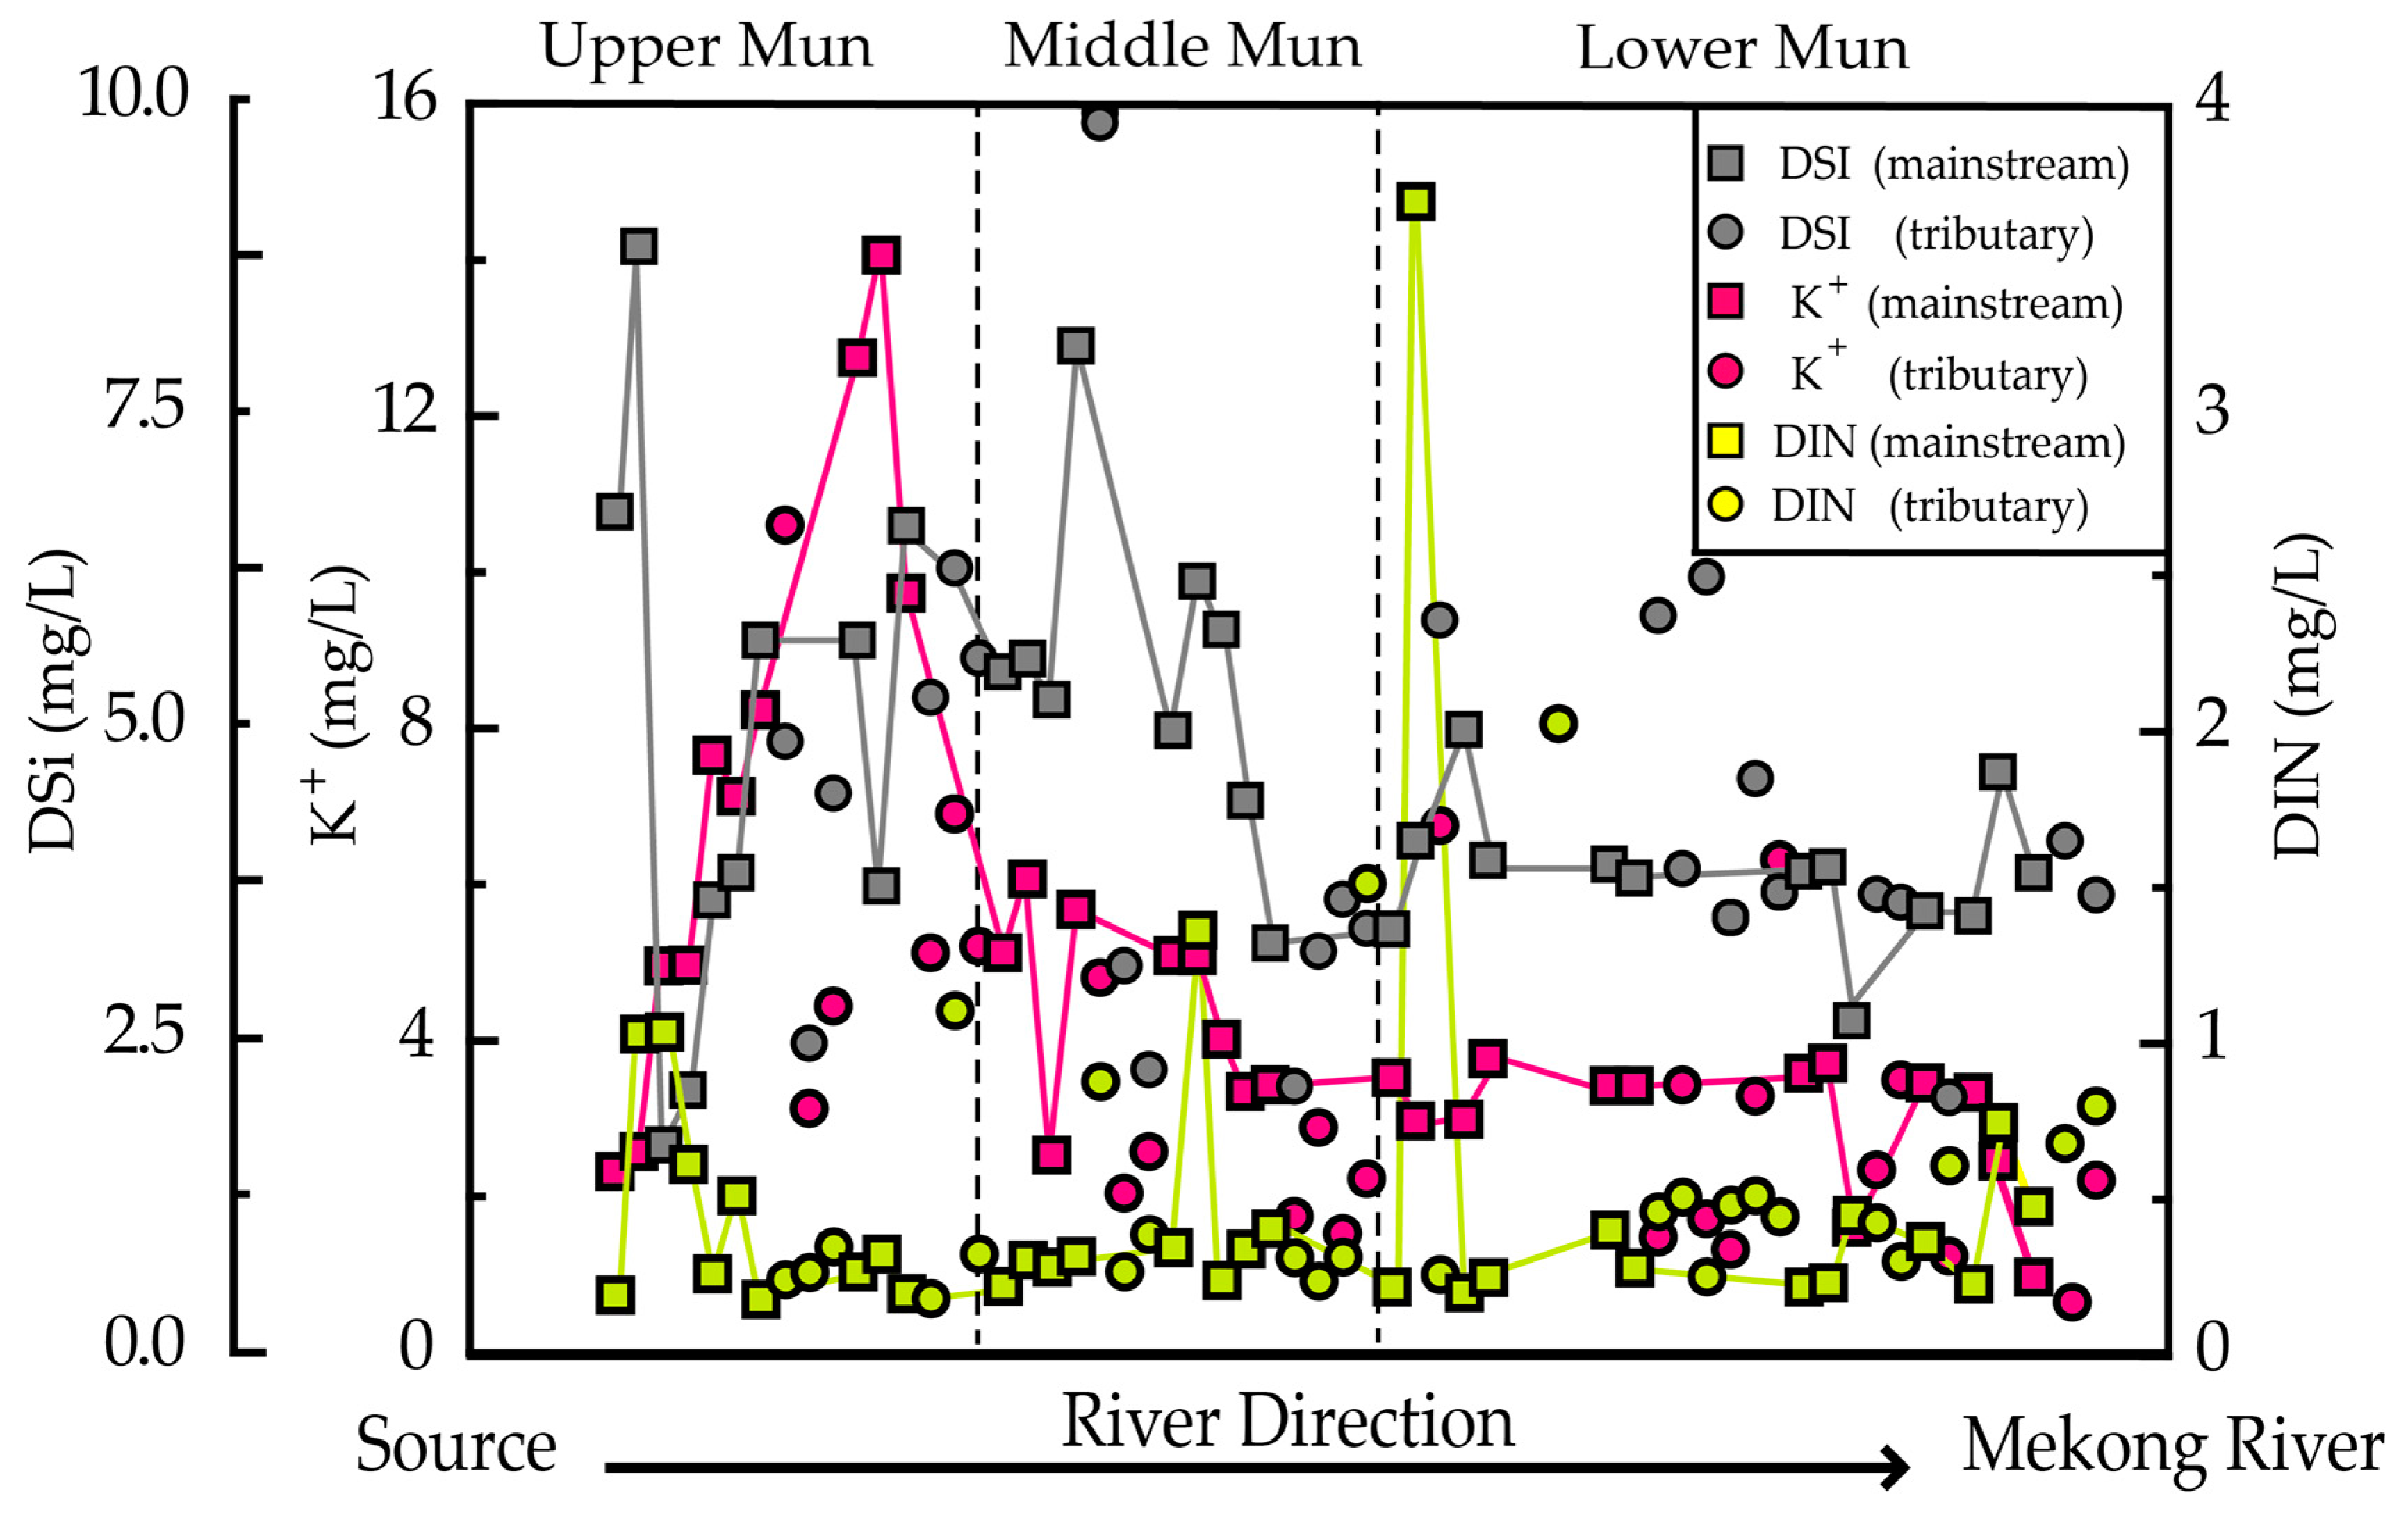
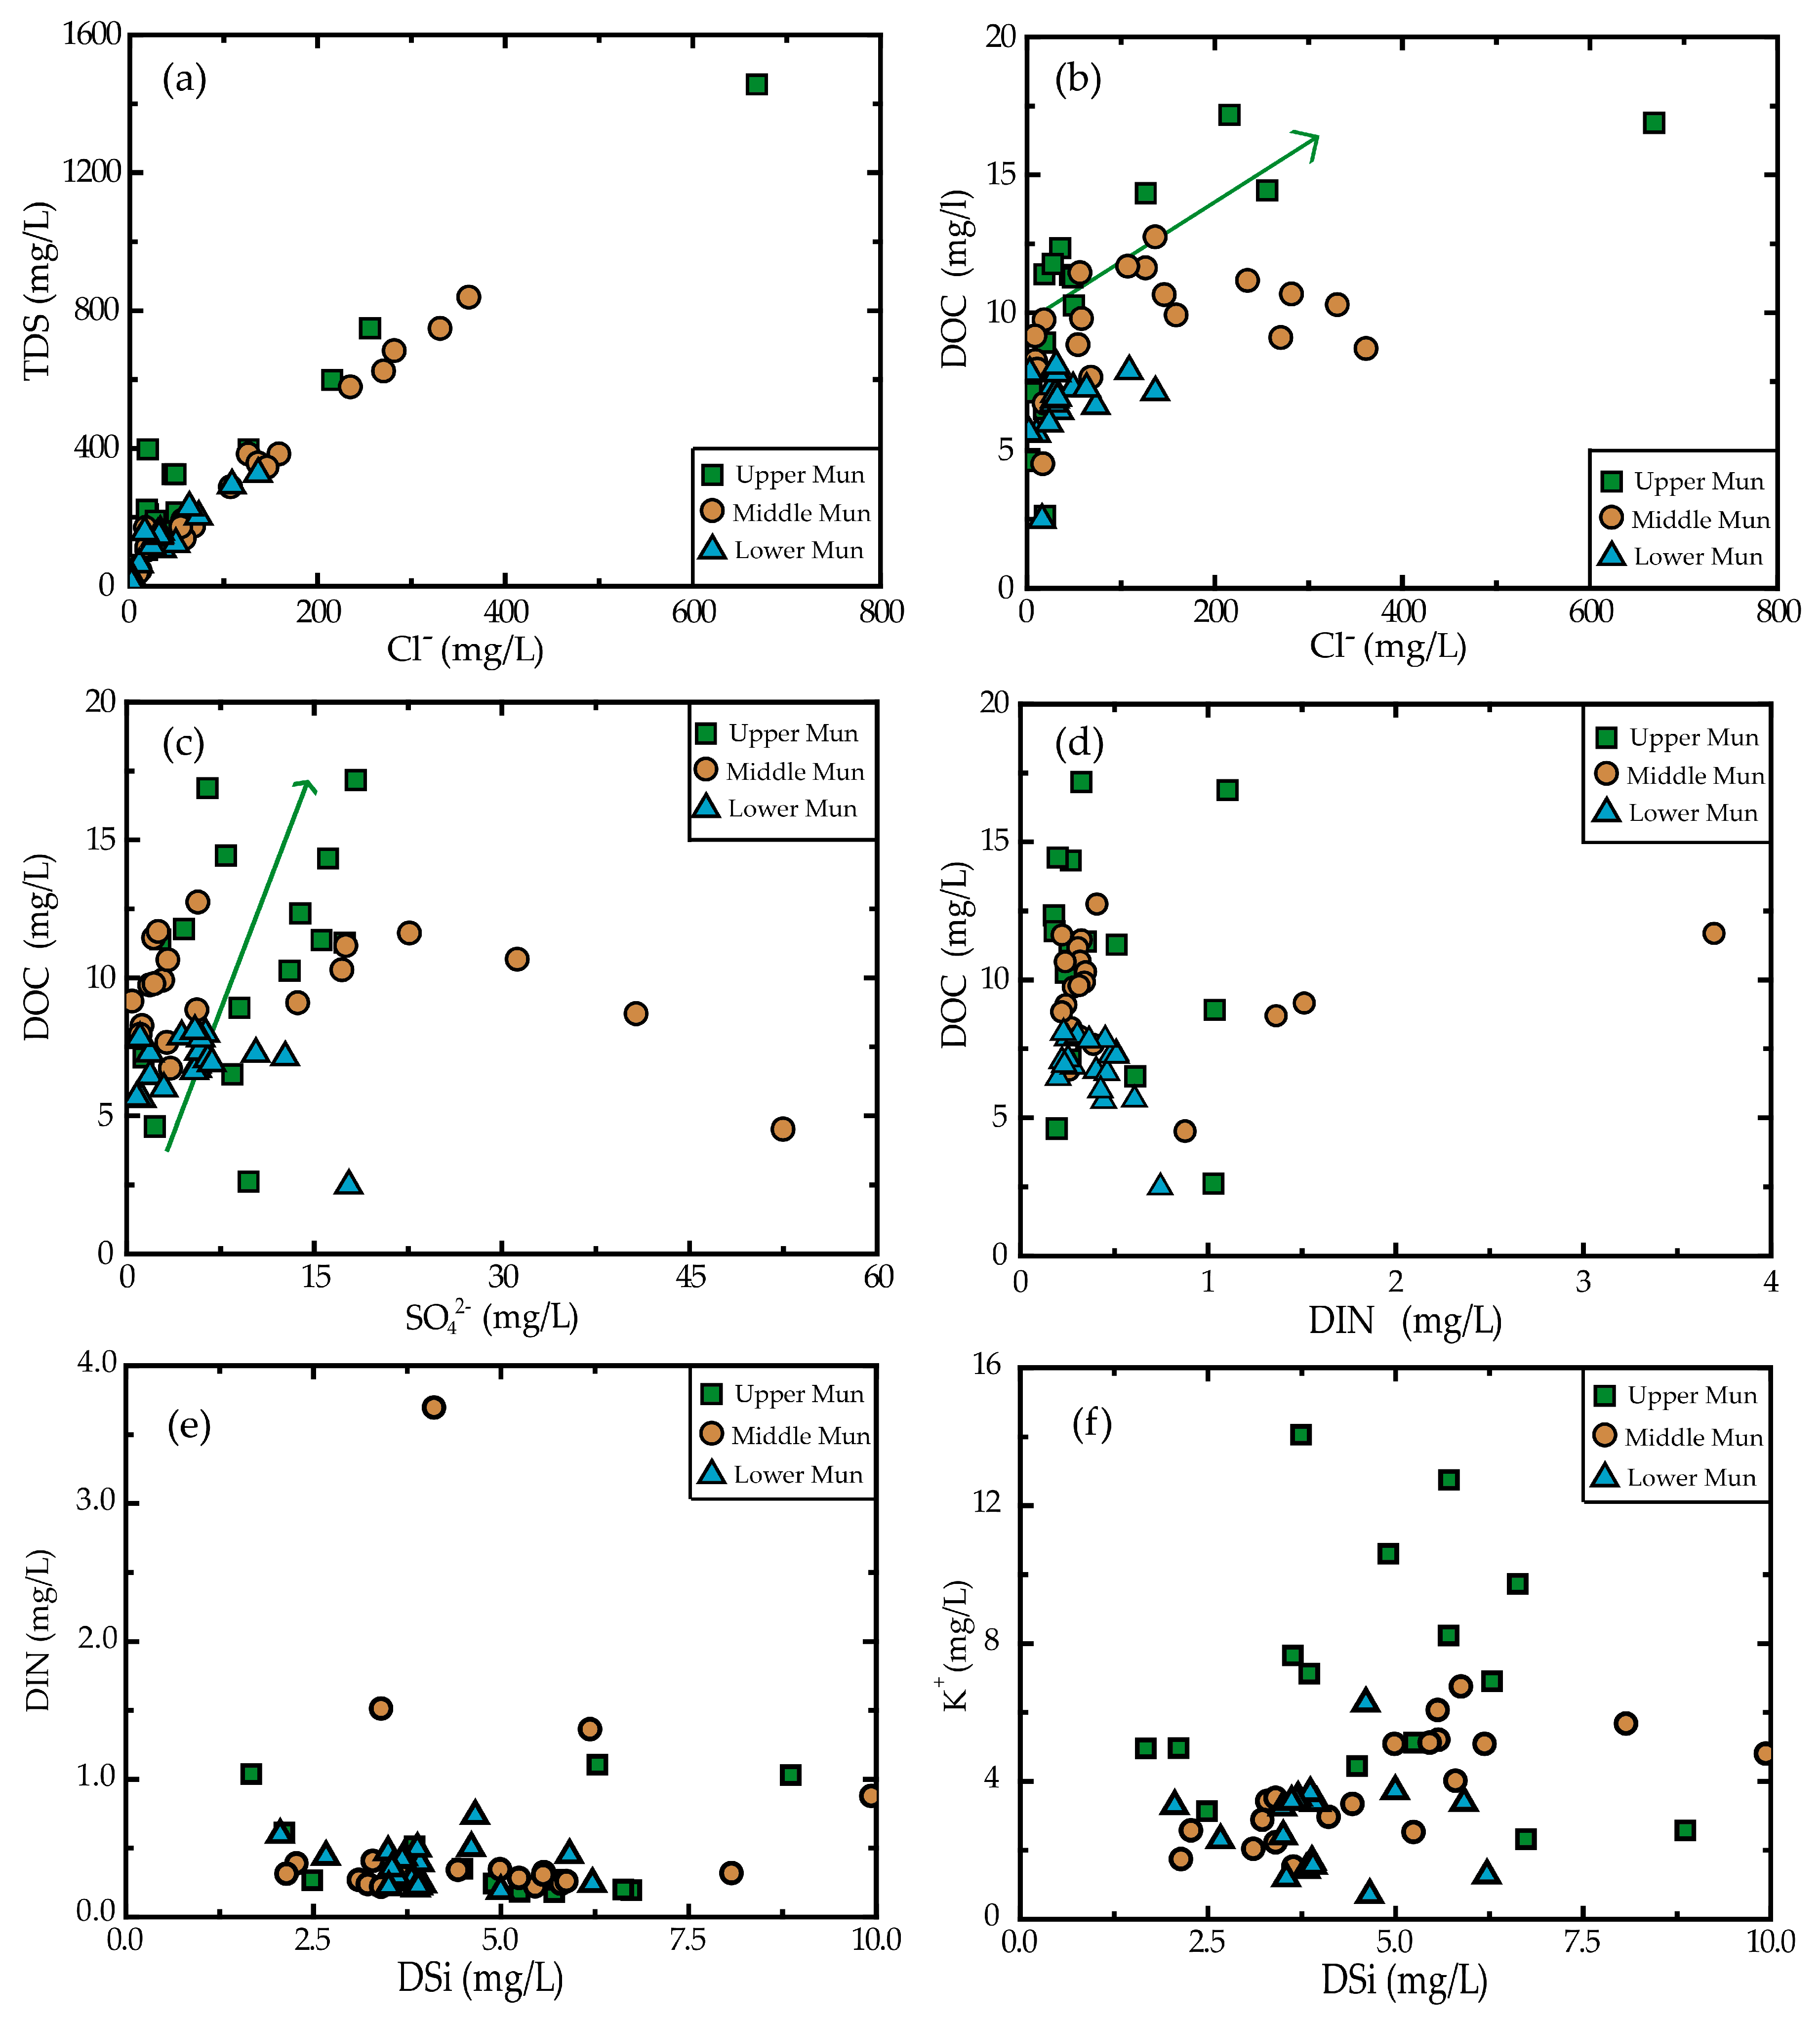
3.3. Relationship between Dissolved Loads

TDS exhibited strong correlations with Cl contents (Figure 6). The covariations were clearly observed at the sites with high Cl and TDS contents. In these areas, the dissolved loads were most likely derived from anthropogenic inputs. This result can be corroborated by: (1) the potential sources of TDS and Cl, though TDS and Cl may be from both the weathering process and anthropogenic inputs. Clearly high contents are, in general, related to anthropogenic inputs [6,11,29]. (2) The ratios of TDS/Cl were almost constant, which means there should be a single source of TDS and Cl, because once there are other sources, the ratio should be altered, as the ratio of TDS/Cl for anthropogenic sources are unlikely equal to the natural sources. In the sites with low TDS and Cl contents, the poor correlation resulted from the mixing of anthropogenic and weathering inputs. As discussed before, evaporites can also be a source of TDS and Cl. The distinct ratio of TDS/Cl between these two sources and the different mixed proportions consequently led to the weak relationship. DOC increased with Cl and SO42− in the Upper Mun (Figure 6), which suggests that these dissolved loads have the same source, which is consistent with the previous discussion. However, because of the lack of detailed data about industrial types, it was difficult to discern the precise relationships between these dissolved loads on a small scale. So, in this paper, we investigated the relationships from the watershed scale.
There were no significant correlations between the DSi and DIN and K+, which have been observed in many regional studies [45,50]. The low concentrations of P in Mun River waters limit the growth of aquatic plants such as algae, so the DSi contents were not largely consumed by algae or released from the BSi. Thus, the variations of DSi contents in the Mun River mainly represent the silicate weathering input.

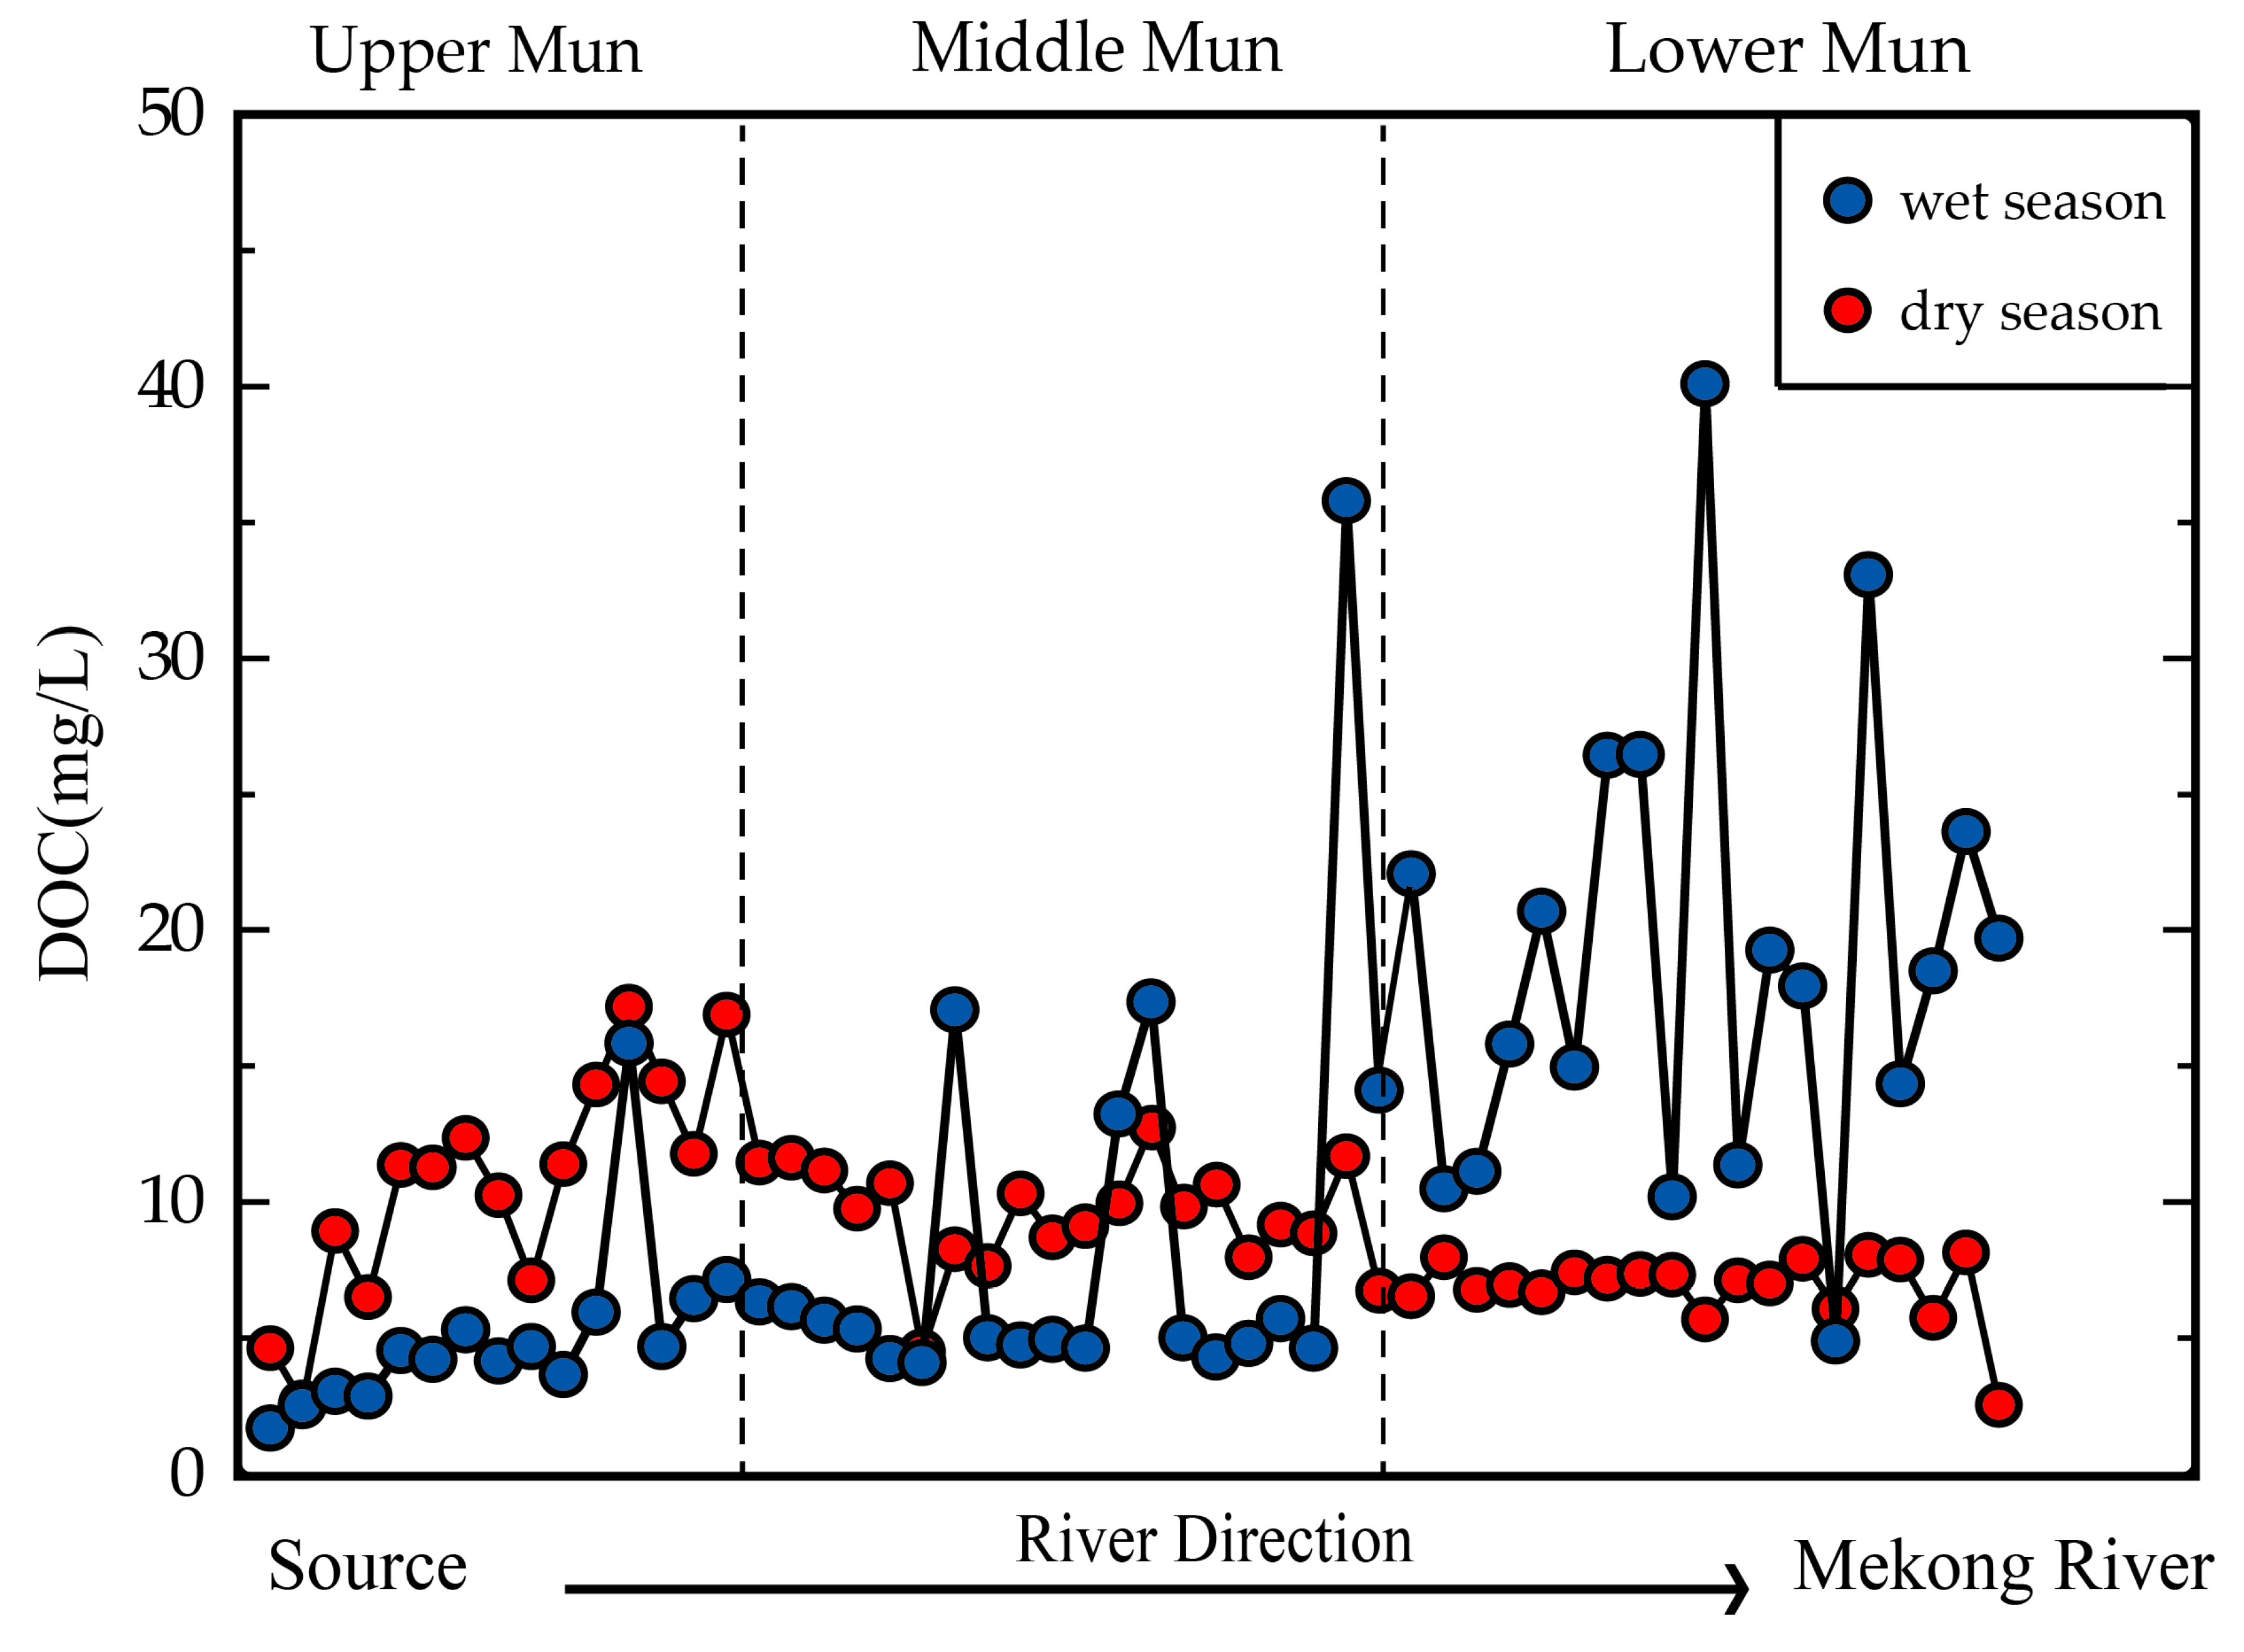
3.4. The Impact of Precipitation and Soil Erosion

The dissolved loads in the Mun River were closely related to the land-use type and anthropogenic inputs, and the high concentrations of Cl, K+, and SO42− were derived from industrial sewage. However, in the Lower Mun, the concentrations of common pollutants derived from agricultural activities (DIN, P, and K) did not significantly increase. It seemed that the intensive agricultural activities had no clear effect on the dissolved loads in the dry season. In reality, the industrial inputs were mostly from sewage, which means that the pollutant can directly discharge into the rivers, while the pollutants from agricultural activities, such as the application of fertilizers, firstly enter the soil; undergo complex physical, chemical, and biologic processes; and then transfer into the rivers by soil erosion or the groundwater. Considering the occurrence, quantities, and connectivity of overland flow [51,52], the majority of the influence factors were similar between the wet and dry seasons. The difference in rainfall should be the dominant factor of the flow, and the high precipitation in the wet season increased the overland flow connectivity [53]. However, the low precipitation in the dry season weakened the effect of overland flow while limiting soil erosion and recharge infiltration. If these soil matters accumulate in the soil and aeration zone, the concentrations in rivers will be relatively low [54]. The seasonal variation of DOC accorded with this assumption: DOC contents exhibited a clearly spatial distribution, which decreased along the direction and was relatively higher on the juncture of the Upper and Middle Mun (Figure 7). Bacteria production and phytoplankton exudation can be important sources of riverine DOC [55]. However, the DOC contents in the Mun River were greater than the world riverine average (5.35 mg/L) [56]. Riverine DOC contents can hardly reach 5 mg/L only by biological effects, and the high DOC contents observed in world rivers are closely related to anthropogenic inputs and soil-leaching processes from wetlands [57,58]. Since little wetland exists in the Mun River Basin, and industrial sewage and agricultural activities can obviously increase the organic contents in river waters [19,59], DOC contents were most likely derived from anthropogenic inputs. The Lower Mun is dominated by vast rice fields, so agricultural activities should be considered as the main source of DOC contents, while the DOC in the Upper Mun was most likely derived from industrial inputs. The sources of DOC are consistent with our previous study which examined the distributions of DOC in the wet season [31]. The distributions are in complete contrast: DOC increased with the flow direction in the wet season but decreased along the direction. The average DOC contents of the whole river were similar (9.01 mg/L in the dry season and 11.14 mg/L in the wet season). In the Upper Mun, the concentrations of DOC averaged 5.10 mg/L in the wet season and 10.73 mg/L in the dry season, but in the Lower Mun, the contents averaged 17.41 mg/L—nearly three times higher than that in the dry season (6.84 mg/L). The distinct precipitation in different seasons should be the key factor. The precipitation in the dry season ranged between 40 and 120 mm, while it varied from 900 to 1600 mm in the wet season. The supply of runoff in the Mun River Basin during the wet season should be from precipitation. The high rainfall washes fertilized fields and soil in the Lower Mun, so the effects of scouring can transport more organic matter into rivers. Contrariwise, the low amount of precipitation in the dry season makes it difficult to achieve such an effect, as the organic matters are kept in the soil. This assumption accords with the previous data [30] showing that the soil organic matters were higher in the dry season than that in the wet season. In the Upper Mun, the industrial sewage discharged into the river waters, and the higher precipitation in the wet season most likely diluted DOC contents. Thus, the DOC contents displayed lower values in the wet season.
This result implies that the farming methods presently used in the Mun River Basin need to be optimized. The effect of precipitation should be considered because the high rainfall in the wet season flushes the soil and may lead to the loss of soil organic matters, and the excessive amount of organic matters transported into the rivers is hazardous to the water quality and aquatic ecosystem. For industrial sewage, improving sewage treatment technology is necessary, as sewage has significantly influenced the chemical composition of the Mun River.

4. Conclusions

This paper reported the nutrient contents in the Mun River during the dry season (March 2018). Clear spatial distributions were observed in the DOC, Cl, K+, and SO42− contents during the dry season. High concentrations of these dissolved loads were found in the Upper Mun River, which is the industrial area of the watershed. The elemental ratios and the stoichiometry revealed that the weathering processes were not the sources of the DOC, Cl, K+, and SO42−. These dissolved loads in Mun River water were mainly derived from industrial sewage. The covariation of DOC, Cl, and SO42− in the upper reaches is in line with this discussion. DIN remained at the same level throughout the whole river basin and was affected by biological processes, precipitation, and point source pollution. Because of the low concentration of P, the biological effects were limited in the Mun River. The DSi in the river water showed no clear relationship with the DIN and K+ and was dominated by silicate weathering inputs.
Though both are anthropogenic inputs, industrial and agricultural inputs exhibited different effects on the river water. The industrial input was mainly sewage, which can directly increase the concentrations of pollutants in river waters, while the agricultural inputs were controlled by soil erosion and precipitation. The DOC concentrations in the wet and dry seasons were obviously higher than in unpolluted rivers. Based on the land-use type, the high contents were mainly derived from industrial sewage in the upper reaches and agricultural activities in the lower reaches. The high amount of rainfall in the wet season diluted the industrial sewage, flushed the cultivated soil, and scoured more organic matter into the river water—something which was impossible in the dry season. Consequently, in the wet season, the Mun River had high concentrations from agricultural field drainage and low concentrations flowing from the industrial areas.

Supplementary Materials

The following are available online at https://www.mdpi.com/2073-4441/11/5/954/s1. Table S1: The sampling locations, water parameters, and chemical compositions of Mun River water.

Author Contributions

Conceptualization, G.H. and J.L.; Methodology, J.L.; Validation, J.L. and K.Y.; Formal analysis, J.L. and G.H.; Investigation, G.H., C.S., Q.Z., X.L., and M.L.; Data curation, J.L.; Writing—original draft preparation, J.L. and G.H.; Writing—review and editing, J.L., G.H., and X.L.; Project administration, G.H.; Funding acquisition, G.H.

Funding

This research was funded by the National Natural Science Foundation of China (Nos. 41661144029; 41325010).

Acknowledgments

The authors gratefully acknowledge Fairda Malem from the Ministry of Natural Resources and Environment of Thailand for assistance with field sampling, as well as Yupeng Tian from the China University of Geosciences for laboratory analysis.

Conflicts of Interest

The authors declare no conflict of interests.

References

  1. Meybeck, M. Global geochemical weathering of surficial rocks estimates from river dissolved loads. Am. J. Sci. 1987, 287, 401–428. [Google Scholar] [CrossRef]
  2. Suchet, P.A.; Probst, J.L.; Ludwig, W. Worldwide distribution of continental rock lithology: Implications for the atmospheric/soil CO2 uptake for continental weathering and alkalinity river transport to the oceans. Glob. Biogeochem. Cycles 2003, 17. [Google Scholar] [CrossRef]
  3. Sharples, J.; Middelburg, J.J.; Fennel, K.; Jickells, T.D. What proportion of riverine nutrients reaches the open ocean? Glob. Biogeochem. Cycles 2017, 31, 39–58. [Google Scholar] [CrossRef] [Green Version]
  4. Teng, F.Z. Magnesium Isotope Geochemistry. Rev. Mineral. Geochem. 2017, 82, 219–287. [Google Scholar] [CrossRef]
  5. Leach, J.A.; Larsson, A.; Wallin, M.B.; Nilsson, M.B.; Laudon, H. Twelve year interannual and seasonal variability of stream carbon export from a boreal peatland catchment. J. Geophys. Res. Biogeosci. 2016, 121, 1851–1866. [Google Scholar] [CrossRef]
  6. Chetelat, B.; Liu, C.Q.; Zhao, Z.Q.; Wang, Q.L.; Li, S.L.; Li, J.; Wang, B.L. Geochemistry of the dissolved load of the Changjiang Basin rivers: Anthropogenic impacts and chemical weathering. Geochim. Cosmochim. Acta 2008, 72, 4254–4277. [Google Scholar] [CrossRef]
  7. Blum, J.D.; Gazis, C.A.; Jacobson, A.D.; Chamberlain, C.P. Carbonate versus silicate weathering in the Raikhot watershed within the High Himalayan Crystalline Series. Geology 1998, 26, 411–414. [Google Scholar] [CrossRef]
  8. West, A.J.; Galy, A.; Bickle, M. Tectonic and climatic controls on silicate weathering. Earth Planet. Sci. Lett. 2005, 235, 211–228. [Google Scholar] [CrossRef]
  9. White, A.F.; Blum, A.E. Effects of climate on chemical weathering in watersheds. Geochim. Cosmochim. Act 1995, 59, 1729–1747. [Google Scholar] [CrossRef]
  10. Riebe, C.S.; Kirchner, J.W.; Finkel, R. Erosional and climatic effects on long-term chemical weathering rates in granitic land-scapes spanning diverse climate regimes. Earth Planet. Sci. Lett. 2004, 224, 547–562. [Google Scholar] [CrossRef]
  11. Gaillardet, J.; Dupré, B.; Louvat, P.; Allegre, C.J. Global silicate weathering and CO2 consumption rates deduced from the chemistry of large rivers. Chem. Geol. 1999, 159, 3–30. [Google Scholar] [CrossRef]
  12. Tipper, E.T.; Galy, A.; Bickle, M.J. Riverine evidence for a fractionated reservoir of Ca and Mg on the continents: Implications for the oceanic Ca cycle. Earth Planet. Sci. Lett. 2006, 247, 267–279. [Google Scholar] [CrossRef]
  13. Wu, Y.; Bao, H.Y.; Unger, D.; Herbeck, L.S.; Zhu, Z.Y.; Zhang, J.; Jennerjahn, T.C. Biogeochemical behavior of organic carbon in a small tropical river and estuary, Hainan, China. Cont. Shelf Res. 2013, 57, 32–43. [Google Scholar] [CrossRef]
  14. Christophe, R.; Fred, T.M.; Leah, M.V. Influence of the human perturbation on carbon, nitrogen, and oxygen biogeochemical cycles in the global coastal ocean. Geochim. Cosmochim. Act 2001, 65, 3615–3641. [Google Scholar] [CrossRef]
  15. Zhang, S.; Lu, X.X.; Sun, H.; Han, J.; Laurence, D. Major ion chemistry and dissolved inorganic carbon cycling in a human-disturbed mountainous river (the Luodingjiang River) of the Zhujiang (Pearl River), China. Sci. Total Environ. 2009, 407, 2796–2807. [Google Scholar] [CrossRef] [PubMed]
  16. Kaushal, S.S.; Duan, S.; Doody, T.R.; Haq, S.; Smith, R.M.; Newcomer, T.A.; Delaney, K.; Gorman, J.; Bowman, N.; Mayer, P.M.; et al. Human-accelerated weathering increases salinization, major ions, and alkalinization in fresh water across land use. Appl. Geochem. 2017, 83, 121–135. [Google Scholar] [CrossRef] [PubMed]
  17. Han, G.; Li, F.; Tan, Q. Effects of land use on water chemistry in a river draining karst terrain, southwest China. Hydrol. Sci. J. 2014, 59, 1063–1073. [Google Scholar] [CrossRef] [Green Version]
  18. Kronvang, B.; Hoffmann, C.C.; Svendsen, L.M.; Windolf, J.; Jensen, J.P.; Dørge, J. Retention of nutrients in river basins. Aquat. Ecol. 1999, 33, 29–40. [Google Scholar] [CrossRef]
  19. Lorite-Herrera, M.; Hiscock, K.; Jiménez-Espinosa, R. Distribution of dissolved inorganic and organic nitrogen in river water and groundwater in an agriculturally-dominated catchment, south-East Spain. Water. Air. Soil Pollut. 2009, 198, 335–346. [Google Scholar] [CrossRef]
  20. Evans, C.D.; Monteith, D.T.; Cooper, D.M. Long-term increases in surface water dissolved organic carbon: Observations, possible causes and environmental impacts. Environ. Pollut. 2005, 137, 55–71. [Google Scholar] [CrossRef]
  21. Gorham, E.; Underwood, J.K.; Janssens, J.A.; Freedman, B.; Maass, W.; Waller, D.H.; Ogden, J.G. The chemistry of streams in southwestern and central Nova Scotia, with particular reference to catchment vegetation and the influence of dissolved organic carbon primarily from wetlands. Wetlands 1998, 8, 115–132. [Google Scholar] [CrossRef]
  22. Shang, F.; Ren, S.; Yang, P.; Li, C.; Ma, N. Effects of different fertilizer and irrigation water types, and dissolved organic matter on soil C and N mineralization in crop rotation farmland. Water. Air. Soil Pollut. 2015, 226, 396. [Google Scholar] [CrossRef]
  23. Eshleman, K.N.; Hemond, H.F. The role of organic acids in the acid-base status of surface waters at Bickford Watershed, Massachusetts. Water Resour. Res. 1985, 21, 1503–1510. [Google Scholar] [CrossRef]
  24. Roy, R.L.; Campbell, P.G.C. Decreased toxicity of Al to juvenile atlantic salmon (Salmo salar) in acidic soft water containing natural organic matter: A test of the free-ion model. Environ. Toxicol. Chem. 1997, 16, 1962–1969. [Google Scholar] [CrossRef]
  25. Lawlor, A.J.; Tipping, E. Metals in bulk deposition and surface waters at two upland locations in northern England. Environ. Pollut. 2003, 121, 153–168. [Google Scholar] [CrossRef]
  26. McCartney, A.G.; Harriman, R.; Watt, A.W.; Moore, D.W.; Taylor, E.M.; Collen, P.; Keay, E.J. Long-term trends in pH, aluminium and dissolved organic carbon in Scottish fresh waters; implications for brown trout (Salmo trutta) survival. Sci. Total Environ. 2003, 310, 133–141. [Google Scholar] [CrossRef]
  27. Thomas, G.H.; William, B.; George, R.A.; Justin, S.; Li, F.L.; Collin, S.R.; Philip, C. Climate change and dissolved organic carbon export to the Gulf of Mainecarbon export to the Gulf of Maine. J. Geophys. Res.-Biogeosci. 2016, 2700–2716. [Google Scholar] [CrossRef]
  28. Barth, J.A.C.; Cronin, A.A.; Dunlop, J.; Kalin, R.M. Influence of carbonates on the riverine carbon cycle in an anthropogenically dominated catchment basin: Evidence from major elements and stable carbon isotopes in the Lagan River (N. Irel.). Chem. Geol. 2003, 200, 203–216. [Google Scholar] [CrossRef]
  29. Xu, Z.; Liu, C. Chemical weathering in the upper reaches of Xijiang River draining the Yunnan–Guizhou Plateau, Southwest China. Chem. Geol. 2007, 239, 83–95. [Google Scholar] [CrossRef]
  30. Zhao, Z.; Liu, G.; Liu, Q.; Huang, C.; Li, H. Studies on the spatiotemporal variability of river water quality and its relationships with soil and precipitation: a case study of the Mun River Basin in Thailand. Int. J. Environ. Res. Public Health 2018, 15, 2466. [Google Scholar] [CrossRef]
  31. Liu, J.; Han, G.; Liu, X.; Liu, M.; Song, C.; Zhang, Q. Impacts of anthropogenic changes on the Mun River water: insight from spatio-distributions and relationship of C and N species in Northeast Thailand. Int. J. Environ. Res. Public Health 2019, 16, 659. [Google Scholar] [CrossRef] [PubMed]
  32. Liang, B.; Han, G.; Man, L.; Xiaoqiang, L. Spatial and temporal variation of dissolved heavy metals in the Mun River, Northeast Thailand. Water 2019, 11, 380. [Google Scholar] [CrossRef]
  33. Prabnakorn, S.; Maskey, S.; Suryadi, F.X.; de Fraiture, C. Rice yield in response to climate trends and drought index in the Mun River Basin, Thailand. Sci. Total Environ. 2018, 621, 108–119. [Google Scholar] [CrossRef]
  34. Akter, A.; Babel, M.S. Hydrological modeling of the Mun River basin in Thailand. J. Hydrol. 2012, 452–453. [Google Scholar] [CrossRef]
  35. Ahearn, D.S.; Sheibley, R.W.; Dahlgren, R.A.; Anderson, M.L.; Johnson, J.; Tate, K.W. Land use and land cover influence on water quality in the last free-flowing river draining the western Sierra Nevada, California. J. Hydrol. 2005, 313, 234–247. [Google Scholar] [CrossRef]
  36. Jiang, Y. The contribution of human activities to dissolved inorganic carbon fluxes in a karst underground river system: Evidence from major elements and δ 13C-DIC in Nandong, Southwest China. J. Contam. Hydrol. 2013, 152, 1–11. [Google Scholar] [CrossRef]
  37. Moon, S.; Huh, Y. Chemical weathering in the Hong (Red) River basin: Rates of silicate weathering and their controlling factors. Geochim. Cosmochim. Acta 2007, 71, 1411–1430. [Google Scholar] [CrossRef]
  38. Han, G.; Tang, Y.; Xu, Z. Fluvial geochemistry of rivers draining karst terrain in southwest China. J. Asian Earth Sci. 2010, 38, 65–75. [Google Scholar] [CrossRef]
  39. Tipper, E.T.; Bickle, M.J.; Galy, A.; West, A.J.; Pomiès, C.; Chapman, H.J. The short-term climatic sensitivity of carbonate and silicate weathering fluxes: Insight from seasonal variations in river chemistry. Geochim. Cosmochim. Acta 2006, 70, 2737–2754. [Google Scholar] [CrossRef]
  40. Galy, A.; France-Lanord, C. Weathering processes in the Ganges–Brahmaputra basin and the riverine alkalinity budget. Chem. Geol. 1999, 159, 31–60. [Google Scholar] [CrossRef]
  41. Conley, D.J. Terrestrial ecosystems and the global biogeochemical silica cycle. Glob. Biogeochem. 2002, 16, 61–68. [Google Scholar] [CrossRef]
  42. Beusen, A.H.W.; Bouwman, A.F.; Durr, H.H.; Dekkers, A.L.M.; Hartmann, J. Global patterns of dissolved silica export to the coastal zone: Results from a spatially explicit global model. Glob. Biogeochem. 2009, 23. [Google Scholar] [CrossRef] [Green Version]
  43. Conley, D.J. Riverine contribution of biogenic silica to the oceanic silica budget. Limnol. Oceanogr. 1997, 42, 774–777. [Google Scholar] [CrossRef] [Green Version]
  44. Admiraal, W.; Breugem, P.; Jacobs, D.; Steveninck, E. Fixation of dissolved silicate and sedimentation of biogenic silicate in the lower river Rhine during diatom blooms. Biogeochemistry 1990, 9, 175–185. [Google Scholar] [CrossRef]
  45. Dokkum, H.P.; Hulskotte, J.H.J.; Kramer, K.J.M.; Wilmot, J. Emission, fate and effects of soluble silicates (waterglass) in the aquatic environment. Environ. Sci. Technol. 2004, 38, 515–521. [Google Scholar] [CrossRef]
  46. Yan, W.; Mayorga, E.; Li, X.; Seitzinger, S.P.; Bouwman, A.F. Increasing anthropogenic nitrogen inputs and riverine DIN exports from the Changjiang River basin under changing human pressures. Glob. Biogeochem. Cycles 2010, 24. [Google Scholar] [CrossRef] [Green Version]
  47. Keller, D.P.; Hood, R.R. Modeling the seasonal autochthonous sources of dissolved organic carbon and nitrogen in the upper Chesapeake Bay. Ecol. Modell. 2011, 222, 1139–1162. [Google Scholar] [CrossRef] [Green Version]
  48. Alkhatib, M.; Del Giorgio, P.A.; Gelinas, Y.; Lehmann, M.F. Benthic fluxes of dissolved organic nitrogen in the lower St. Lawrence estuary and implications for selective organic matter degradation. Biogeosciences 2013, 10, 7609–7622. [Google Scholar] [CrossRef] [Green Version]
  49. Kerner, M.; Spitzy, A. Nitrate regeneration coupled to degradation of different size fractions of DON by the picoplankton in the Elbe estuary. Microb. Ecol. 2001, 41, 69–81. [Google Scholar] [CrossRef]
  50. Hartmann, J.; Levy, J.; Kempe, S. Increasing dissolved silica trends in the rhine river: An effect of recovery from high Ploads? Limnology 2011, 12, 63–73. [Google Scholar] [CrossRef]
  51. Keesstra, S.; Nunes, J.P.; Saco, P.; Parsons, T.; Poeppl, R.; Masselink, R.; Cerdà, A. The way forward: Can connectivity be useful to design better measuring and modelling schemes for water and sediment dynamics? Sci. Total Environ. 2018, 644, 1557–1572. [Google Scholar] [CrossRef] [PubMed]
  52. Keesstra, S.D.; Davis, J.; Masselink, R.H.; Casalí, J.; Peeters, E.T.; Dijksma, R. Coupling hysteresis analysis with sediment and hydrological connectivity in three agricultural catchments in Navarre, Spain. J. Soil Sediment. 2019, 19, 1598–1612. [Google Scholar] [CrossRef]
  53. Masselink, R.J.; Heckmann, T.; Temme, A.J.; Anders, N.S.; Gooren, H.P.; Keesstra, S.D. A network theory approach for a better understanding of overland flow connectivity. Hydrol. Process. 2017, 31, 207–220. [Google Scholar] [CrossRef]
  54. Górski, J.; Dragon, K.; Kaczmarek, P.M.J. Nitrate pollution in the Warta River (Poland) between 1958 and 2016: Trends and causes. Environ. Sci. Pollut. Res. 2019, 26, 2038–2046. [Google Scholar] [CrossRef] [PubMed]
  55. Keller, D.P.; Hood, R.R. Comparative simulations of dissolved organic matter cycling in idealized oceanic, coastal, and estuarine surface waters. J. Mar. Syst. 2013, 109–110, 109–128. [Google Scholar] [CrossRef]
  56. Meybeck, M. Carbon, nitrogen, and phosphorus transport by world rivers. Am. J. Sci. 1982, 282, 401–450. [Google Scholar] [CrossRef]
  57. Wiegner, T.N.; Seitzinger, S.P. Seasonal bioavailability of dissolved organic carbon and nitrogen from pristine and polluted freshwater wetlands. Limnol. Oceanogr. 2004, 49, 1703–1712. [Google Scholar] [CrossRef] [Green Version]
  58. Aitkenhead-Peterson, J.A.; Steele, M.K.; Nahar, N.; Santhy, K. Dissolved organic carbon and nitrogen in urban and rural watersheds of south-central Texas: Land use and land management influences. Biogeochemistry 2009, 96, 119–129. [Google Scholar] [CrossRef]
  59. Panizza, M.; Cerisola, G. Removal of organic pollutants from industrial wastewater by electrogenerated Fenton’s reagent. Water Res. 2001, 35, 3987–3992. [Google Scholar] [CrossRef]
Figure 1. Geographic information of the Mun River Basin: (a) distribution of sampling sites and land-use types; (b) lithological characteristics.
Water 11 00954 g001
Figure 2. Spatial patterns of annual precipitation in the dry season and the distributions of industry and rice-planted areas. Precipitation data and land-use data are from previous studies [30,34].
Water 11 00954 g002
Figure 3. Evolution of contents of TDS, Cl, and SO42 from the upper to the lower reaches.
Water 11 00954 g003
Figure 4. Evolution of contents of K+, DSi, and DIN from the upper to the lower reaches.
Water 11 00954 g004
Figure 5. The elemental ratios in Mun River water: (a) The covariation of the equivalent ratios of (SO42− + HCO3) vs. (Na+ + K++ Ca 2++ Mg2+); (b) mixing diagrams using (Mg2+/Na+) vs. (Ca2+/Na+). The gray points are the Mun River waters (this paper). The green points represent the world rivers with good water quality, while the orange points are polluted rivers. The world rivers are the 60 largest rivers of the world, and the polluted rivers have high TDS values (greater than 500 mg/L; [11]). The silicate and evaporite end-members are the rivers’ drain monolithology [11].
Water 11 00954 g005
Figure 6. Relationships between the dissolved loads: (a) TDS vs. Cl; (b) DOC vs. Cl; (c) DOC vs. SO42−; (d) DOC vs. DIN; (e) DIN vs. DSi; and (f) K+ vs. DSi.
Water 11 00954 g006
Figure 7. Temporal and spatial distributions of DOC in Mun River waters.
Water 11 00954 g007
Table 1. Distributions of DOC and major ions in the Mun River.
Dissolved LoadThe Upper MunThe Middle MunThe Lower Mun
RangeMean ValueRangeMean ValueRangeMean Value
mg/Lmg/Lmg/L
TDS44–145636338–83932114–332154
DOC2.6–17.110.74.5–12.79.52.5–8.16.8
Cl2.7–668.5103.78.7–361.5123.61.7–136.839.9
K+2.3–14.16.91.7–6.83.81.2–6.32.9
SO42−1.4–18.39.80.5–52.511.50.8–12.75.7
DIN-N0.12–1.110.450.24–3.690.610.20–0.740.39
DSi1.7–8.94.82.3–9.94.92.1–6.24.7
Note: TDS: total dissolved solids; DOC: dissolved organic carbon; DIN: dissolved inorganic nitrogen; DSi: dissolved silicon.

