Article

Sensing the Submerged Landscape of Nisida Roman Harbour in the Gulf of Naples from Integrated Measurements on a USV

1
Department of Science and Technology, Parthenope University Naples, 80143 Naples, Italy
2
Department of Asia, Africa and Mediterranean, L’Orientale University, 80134 Naples, Italy
*
Author to whom correspondence should be addressed.
Water 2018, 10(11), 1686; https://doi.org/10.3390/w10111686
Submission received: 11 October 2018 / Revised: 13 November 2018 / Accepted: 15 November 2018 / Published: 19 November 2018
(This article belongs to the Special Issue Landscapes and Landforms of Terrestrial and Marine Areas)

Abstract

:
This paper shows an interesting case of coastal landscape reconstruction by using innovative marine robotic instrumentation, applied to an archaeological key-site in the Campi Flegrei (Italy), one of the more inhabited areas in the Mediterranean during the Roman period. This active volcanic area is world famous for the ancient coastal cities of Baiae, Puteoli, and Misenum, places of military and commercial excellence. The multidisciplinary study of the submerged Roman harbour at Nisida Island was aimed at reconstructing the natural and anthropogenic underwater landscape by elaborating a multiscale dataset. The integrated marine surveys were carried out by an Unmanned Surface Vehicle (USV) foreseeing the simultaneous use of geophysical and photogrammetric sensors according to the modern philosophy of multi-modal mapping. All instrumental measurements were validated by on-site measurements performed by specialised scuba divers. The multiscale analysis of the sensing data allowed a precise reconstruction of the coastal morpho-evolutive trend and the relative sea level variation in the last 2000 years by means of a new type of archaeological sea-level marker here proposed for the first time. Furthermore, it provided a detailed multidimensional documentation of the underwater cultural heritage and a useful tool for evaluating the conservation state of archaeological submerged structures.

Graphical Abstract

1. Introduction

The understanding of landscape changes plays a fundamental role in the comprehension of the human occupation. In the history of human settlements along the Mediterranean coasts, an important moment is the foundation of harbours and coastal urbanisation, when the coastal landscapes started to be transformed by human activities [1]. As most of these ancient coastal settlements are today submerged due to relative sea level variations occurring over the last millennia, the challenge of coastal geoarchaeological research is to thoroughly study these submerged archaeological structures [2,3,4,5,6,7]. This cutting-edge information leads to understanding the impacts of past climate changes on modern populations and the effects of Earth processes at the social level [8]. Moreover, by integrating the results of the geological and geomorphological analysis, geophysical and geomatic survey, and archaeological investigations, a twofold target can be efficiently achieved:
  • The protection of the underwater archaeological sites exposed to the waves action after its recent submersion.
  • The management of the underwater cultural heritage as a witness of the effects of the ongoing climate changes on the ancient settlements as well as on the coastal modifications.
The interdisciplinary nature of underwater geoarchaeological studies leads to operate at multi-scale levels during both the data acquisition and interpretation phases. In the past, the data acquisition phase was mainly carried out by direct surveys of scuba divers, geologists and archaeologists, as the main operating problem during the coastal surveys was the difficulty navigating close to the shoreline, especially in presence of submerged archaeological remains. Thanks to the innovative technology applied to the miniaturisation of geophysical instruments, the use of small crafts carrying out measurements in very shallow waters areas had a remarkable development. These marine systems, including Unmanned Surface Vessels (USV), are revolutionising our ability to map and monitor the marine environment [9,10,11].
In the last few years, numerous specific crafts have been designed for surveying in shallow waters. As reported in the literature, they have been equipped with several geophysical instruments to reconstruct the seabed and sub-bottom morphology [9,12]. In [13], a prototype USV (MicroVEGA) ia presented, as a direct result of many years of experience in marine geophysical surveys applied to underwater archaeology. MicroVeGA is a drone conceived to operate in very shallow water where traditional boats have several manoeuvring problems. This vessel is equipped with a GPS, a single beam echosounder, an inertial platform and emerged and submerged cameras.
In this paper, we present a second evolutive step of MicroVEGA project including the installation of an underwater photogrammetric system and the development of multidisciplinary procedures optimised for geoarchaeological studies. In fact, the photogrammetric methods applied to underwater archaeology have significantly improved the deductions around ancient landscapes. The three-dimensional reconstruction of an archaeological site provides relevant information to formulate hypotheses about the main morphological characteristics of the ancient anthropic landscape [14,15,16]. 3D representations of an underwater site provide an important benefit to archaeologists on the study of a three-dimensional overall picture, which is otherwise difficult to obtain in underwater environments [17,18,19]. In addition, this representation is a modern instrument to appreciate the underwater cultural heritage not accessible to everyone.
The aim of this study was to reconstruct the submerged geoarchaeological landscape in a Roman harbour of Naples Gulf (Nisida, southern Italy) and to evaluate the main morphometric characteristics of the submerged archaeological site, by using a USV equipped with geophysical and photogrammetric sensors. The research targets are as follows:
  • assessing the main coastal changes of Nisida Roman harbour that occurred in the last 2000 years mainly due to the relative sea level variation by means of a multiscale elaboration of a transdisciplinary dataset;
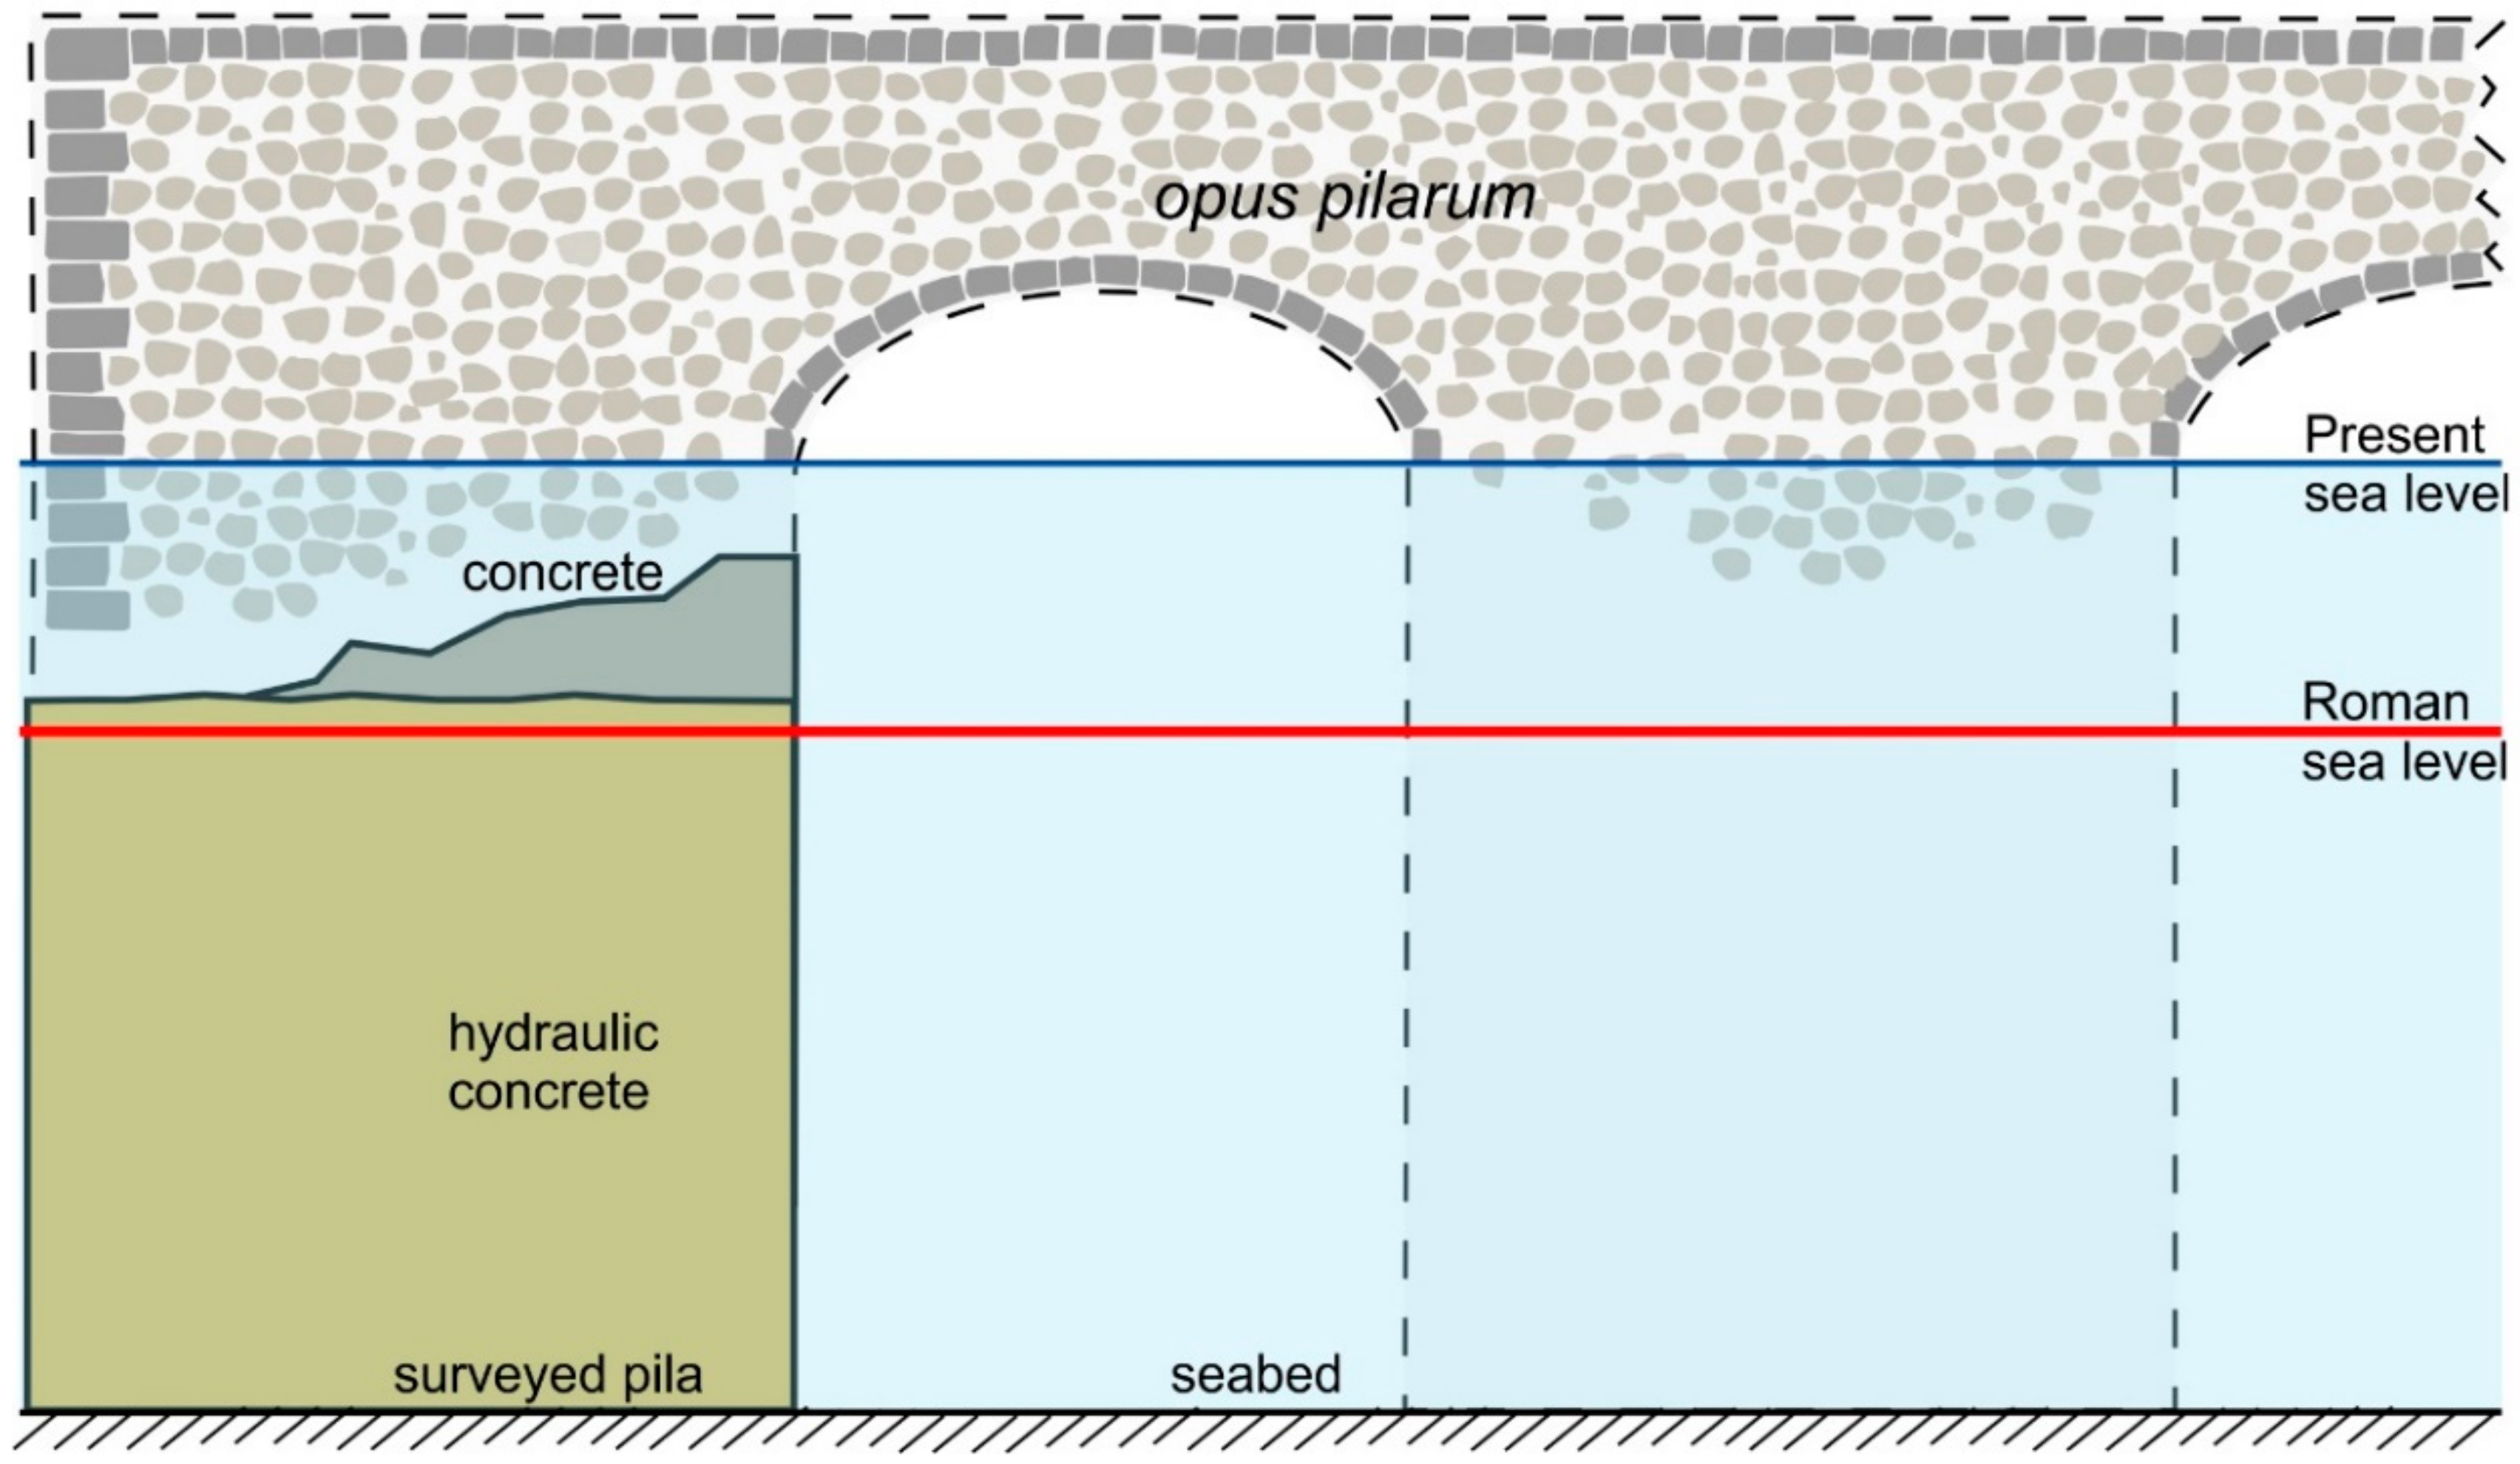
  • the detection of a new type of archaeological sea level marker in the case of port-like structures made in hydraulic concrete; and
  • the detailed documentation of a submerged archaeological site in the Gulf of Naples with a high cultural value and not accessible to everyone.

2. Geoarchaeological Background

The coasts of the Gulf of Naples have been inhabited since the ancient times and shaped by the continued interplay between anthropogenic and volcanic forcing [5,6,7,20,21,22]. It is a half-graben characterised by an NE-trending faults system and totally covered by volcanic units related to Campi Flegrei and Vesuvius volcanoes [5,23]. It is structurally controlled by numerous Quaternary fault systems, NE–SW trending SE-dipping and NW–SE trending SW dipping, related with the last stages of the opening of the Tyrrhenian Sea [24,25,26].
Between the Middle and Upper Pleistocene, the fault systems were responsible for the development of the half-graben of the Gulf of Naples and Sorrento Peninsula fault block ridge [6,23]. During the Late Holocene, this area was modified by volcanic activity and volcano-tectonic vertical ground movements related to Campi Flegrei and Vesuvius [4,5,6,7,20,21,22,27]. However, the most recent extreme event that profoundly modified the Gulf of Naples coasts certainly was the 79 AD eruption of Vesuvius [28] and the subsequent adverse marine weather conditions [7].
Furthermore, despite the subsiding trend that affected the coasts of Naples Gulf after the emplacement of the Campanian Ignimbrite deposits [5,20,21,29,30,31], the landscape evolution of this coastal sector in the last 2000 years was mainly controlled by the anthropogenic activity and the construction of several maritime infrastructures. During the Greek times, several colonies were founded on its coasts, such as Pithekoussai (on the island of Ischia), Kymae, Dicearchia and Neapolis. Instead, during the Roman period, this territory was densely occupied by towns with a maritime vocation, such as Puteoli and Neapolis, and other coastal cities, such as Aenaria, Cumae, Herculaneum, Pompeii, Stabiae and Surrentum. In fact, the Greek geographer Strabo described the Gulf (mentioned with the name of Crater) as an uninterrupted sequence of luxurious villas and gardens [32].
This coastal sector is known worldwide for the commercial ports that in Roman times represented a hub for trade with the East and Africa and for the arrival and redistribution of wheat and food for the needs of Rome. In this study, we focused our attention on a minor port, little known from historical sources but of considerable cultural interest as it preserves the founding remains of a pier that is the largest in the Gulf of Naples.
The Roman harbour of Nisida was built in the first century BC and mainly protected by two piers, of which nowadays only some totally submerged witnesses remain (Figure 1), though well-preserved and not buried by recent sediments.
The ancient piers and coastal defence structures during the Roman period—since the first century BC—were mainly composed of alignments of pilae—large or tall cubes. The pilae are a typical maritime construction evolved along with the development of hydraulic concrete in the Gulf of Naples [33,34,35,36]. The use of hydraulic concrete revolutionised the design of harbour and other maritime structures during this period and was well described by Strabo in Geographia, Vitruvius in De Architectura, Seneca in De Rerum Natura, and Plinius in Naturalis Historia.
Roman hydraulic concrete consists of large irregular stone or tuff aggregate set into a mortar of lime and sand-like volcanic ash rich in chemically reactive aluminosilicates [37,38,39]. It is mainly made in pulvis puteolanus (powder from Puteoli), so-called by these historians to identify the area around Puteoli, in the Gulf of Naples, as the source of this volcanic ash. Pozzolana is the modern term to define this volcanic ash. This material, which could be cast and set underwater, began to be used in harbour structures in the second century BC [40]. Since its discovery, this precious powder was exported throughout the Roman Empire because of its owner characteristic to be cast and set underwater and—as Vitruvius said—to be hardened by the sea to a strength “which neither the waves nor the force of the water can dissolve”. In fact, when seawater infiltrates in the concrete, it dissolves some of the ash and rather than undermining the structure, the alkali fluid that is left allows minerals to strengthen it [37].
The pilae made in Roman concrete were grouped together in a single line (sometimes connected by arches, as at the breakwater at Nisida and Puteoli) or in two overlapping rows to form discontinuous breakwaters or sea defences for a shoreline or at the entrance to a harbour [39]. These cubic structures were built on the seabed with the cofferdam technique. Vitruvius precisely describes this technique in De Architectura (2.6.1, 5.12.2–3), but there are several useful shorter comments in Strabo, Pliny, and Dionysios of Halikarnassos [37,41]. The cofferdam sides were formed of oaken stakes (catenae and destinae, as shown in Figure 2), and filled up with hydraulic concrete.
This manner of construction can be seen in the ancient representations of the harbours of Puteoli and Baiae on several wall paintings and on a series of engraved glass souvenir vessels found at various sites around the empire [42,43,44]. As built directly at the sea, these port facilities are also studied as markers of ancient sea levels [45,46,47,48].
In this study, the better-preserved pila of the Nisida Roman harbour was surveyed with high detail, identifying the traces of the ancient cofferdam, used here to propose a new type of measuring point—valid in the case of port-like structures built in hydraulic concrete cast and set underwater.

Surveyed Area

The Nisida Roman harbour was built in the first century BC—probably around 37 BC—when numerous maritime infrastructures were realised in the Gulf of Pozzuoli with the same building techniques [49]. It was located at the footslope of Nisida Island (Naples City), a tuff cone (3.9 ky BP [21]) partially dismantled by the waves, leaving a passage inside the crater and drawing a small bay (so-called Porto Paone) inhabited since the Roman period. This island, according to the tradition [50], was the otium residence of the Roman politician Marcus Iunius Brutus (85 BC–42 BC) and was connected with the land by a tunnel about 4.5 m high (Figure 3a,b), now partially submerged (Figure 3b). The Roman harbour of Nisida was characterised by an opus pilarum almost totally destroyed, except for three pilae making up the ancient pier nowadays submerged [51] (Figure 3a). Considering the remarkable size of the pilae (with edges up to 15 m) and the bathymetry in the area of about 10 m, the harbour probably represented a commercial hub for the suburban sector of Posillipo [49,52].
In the last centuries, the main coastal modifications have been caused by the construction of the bridge connecting the Nisida Island to Posillipo hill, as well as the piers in the southern sector of the island (Figure 3c). Two of these piers were built on the remains of Roman port structures, which remained mostly intact up to 1635, as shown in Figure 3a, where the Roman opus pilarum is clearly visible. In Figure 3b, instead, it can be observed that the pillars (pilae) composing the piers were still intact and emerged, while the connecting arcs had already collapsed. The modern bridge in Figure 3c was built above the semi-submerged Roman tunnel that connected the islet with the mainland.
The investigated area is located in the island SE sector, close to the bridge and the northernmost pier. In detail, it includes the remains of three submerged pilae composing the ancient pier; the other pilae have been recently covered by the modern cliff.

3. Materials and Methods
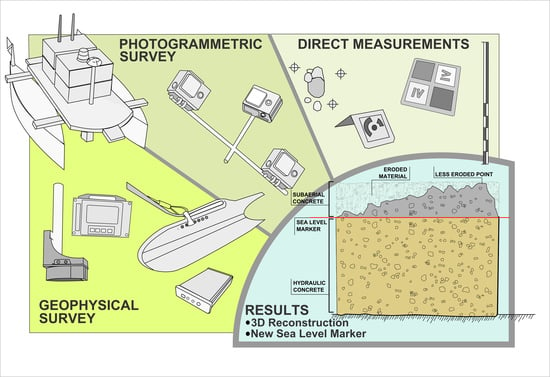
3.1. Survey

The study area extends for about 200 m parallel to the coast, and for about 150 m perpendicular to the coast. The bathymetry in this area ranges between the coastline and the isobath of −10 m.
The area is exposed to the southern winds, which create a strong wave motion. In addition, the summer period is often characterised by adverse marine weather conditions (such as algal blooms) that cause high water turbidity. For this reason, the marine surveys were carried out in the winter months, when northern winds create calm sea conditions and good visibility.
The major operational difficulties were caused by the proximity of a marina and the presence of a passage for small boats used to avoid the circumnavigation of the island of Nisida, located right near the investigated area. This condition has made indispensable the support of the Italian Coast Guard to regulate tourist maritime traffic. The aims of the survey were:
  • precise reconstruction of the Roman structures still visible;
  • evaluation of the conservation state of the more intact pila;
  • 3D reconstruction of the underwater landscape in the study area; and
  • detection of the measuring point for the evaluation of the relative sea level variations in the last 2000 years.
The coastal sector was mainly surveyed by remote sensing methods and the measurements were validated by direct surveys. A small USV was used during the marine surveys (Figure 4a,b,d,e), for both operational and technological reasons. The operative reason derives from the USV manoeuvrability, a characteristic necessary to carry out the planned survey with short and close navigation lines (lines spacing < 2 m) in a small area (15 m × 15 m). The technical reason derives from the equipment of the USV with photogrammetric and geophysical sensors.
The integrated marine survey carried out in the study area included:
  • a bathymetric survey;
  • a Side scan sonar morphological survey;
  • a photogrammetric survey;
  • a topographic survey of two submerged Ground Control Points (GCPs, Figure 4c); and
  • a direct underwater survey (Figure 4f).
The morpho-bathymetric survey—including a single-beam echo sounder (SBES) and a side scan sonar (SSS) survey—was carried to reconstruct the seabed morphology [53] as well as to precisely map the underwater archaeological structures. To obtain this twofold result, the navigation was planned in two phases (Figure 5):
  • A large grid composed of 10 navigation lines perpendicular to the coast and 5 lines parallel, with a linear extension of 2500 m was created (Figure 5a).
  • A small grid composed of 12 × 12 navigation lines 24 m long and 2 m spaced, with a linear extension of 600 m was also created (Figure 5a).
During the navigation with a large grid, the side scan sonar and bathymetric data were recorded to characterise and map the seabed morphology by analysing the acoustic signals. During this phase, the underwater cameras recorded georeferenced videos used in post-processing to validate the interpretations of the morpho-acoustic data.
During the navigation with the small grid, the bathymetric and photogrammetric data were recorded. The integration between the bathymetric and photogrammetric measurements provided a 3D reconstruction of the underwater archaeological structure.
As MicroVeGA USV is inspired to the multi-modal mapping operating philosophy, it acquired both acoustic and optical data during the same survey.
In detail, during the integrated marine survey, MicroVeGA USV collected:
  • 3100 m of bathymetric data;
  • 30,000 m2 of SSS sonographs; and
  • 62 min of high definition videos.
The topographic survey was carried out by a scuba diver of the 2nd Divers Team—Italian Coast Guard of Naples. A GPS fast-static technique was applied in each ground control point to obtain a precise positioning of two markers placed on the submerged pila and the mutual distance with two other markers (Figure 4c and Figure 6).
A team of scuba divers, archaeologist and geologists carried out the direct survey to validate the indirect measurements and to video-survey areas of archaeological interest to characterise the submerged structure. The GPS receiver was installed on a graduated range pole positioned on each GCP for a period of 10 min (Figure 4c) to collect single-frequency phase measurements.
The two GPS baselines between a reference ground station located at a distance of about 5 km from the study area and the two GCPs stations had a fixed solution that guaranteed an uncertainty of less than 2 cm in both planimetry and altimetry.
Moreover, spatial distances between the two GCPs positioned during the fast-static GPS survey and other two markers located in the archaeological structure’s corners were measured during the survey, and used as constraints in the photogrammetric bundle adjustment procedure.

3.2. USV

The study area was surveyed with both direct and indirect methods. The USV (MicroVeGA) used during the indirect surveys—designed exclusively for the geoarchaeological task—is the result of many years of experience in marine geophysical surveys applied to underwater archaeology.
This operational experience has led to the creation of a vehicle with a simple and robust structure but able to effectively carry out the necessary long working sessions at low speed typical of this kind of survey.
MicroVeGA applies the multimodal mapping technique that involves the use of multiple on-board sensors for mapping, localisation, and data collection. All data are broadcast in real time both to a base station and to all operators involved in the research (geophysicist, archaeologist, geomorphologist, etc.).
The main task is the acquisition of data related to the morphology of the seabed to realise three-dimensional landscape models, using geophysical (Single Beam Echo Sounder and Side Scan Sonar) and optical (underwater cameras) instruments.
MicroVeGA platform is a catamaran-type vessel with an overall length of 135 cm, a width of 86 cm and a height of 80 cm (Figure 7, Table 1).
The two hulls are joined by two aluminium crossbars that support a rectangular base of synthetic material (70 cm × 80 cm) on which the payload is positioned.
The payload is divided into four IP-68 waterproof containers, each containing a different type of instrumentation to guarantee the modularity of the survey planning. The operating weight is about 30 kg, although it may vary depending on the operational configuration and the mission profile. The propulsion is entrusted to two brushless electric motors; the vehicle has a maximum speed greater than 2 Knots, while the speed during the data acquisition phase is less than 1 Knots. Operating autonomy with a battery pack is 2 h.
The catamaran design was chosen for good stability and optimal loading space for sensors on-board. The low power suggests its use in the very shallow waters and with good weather.

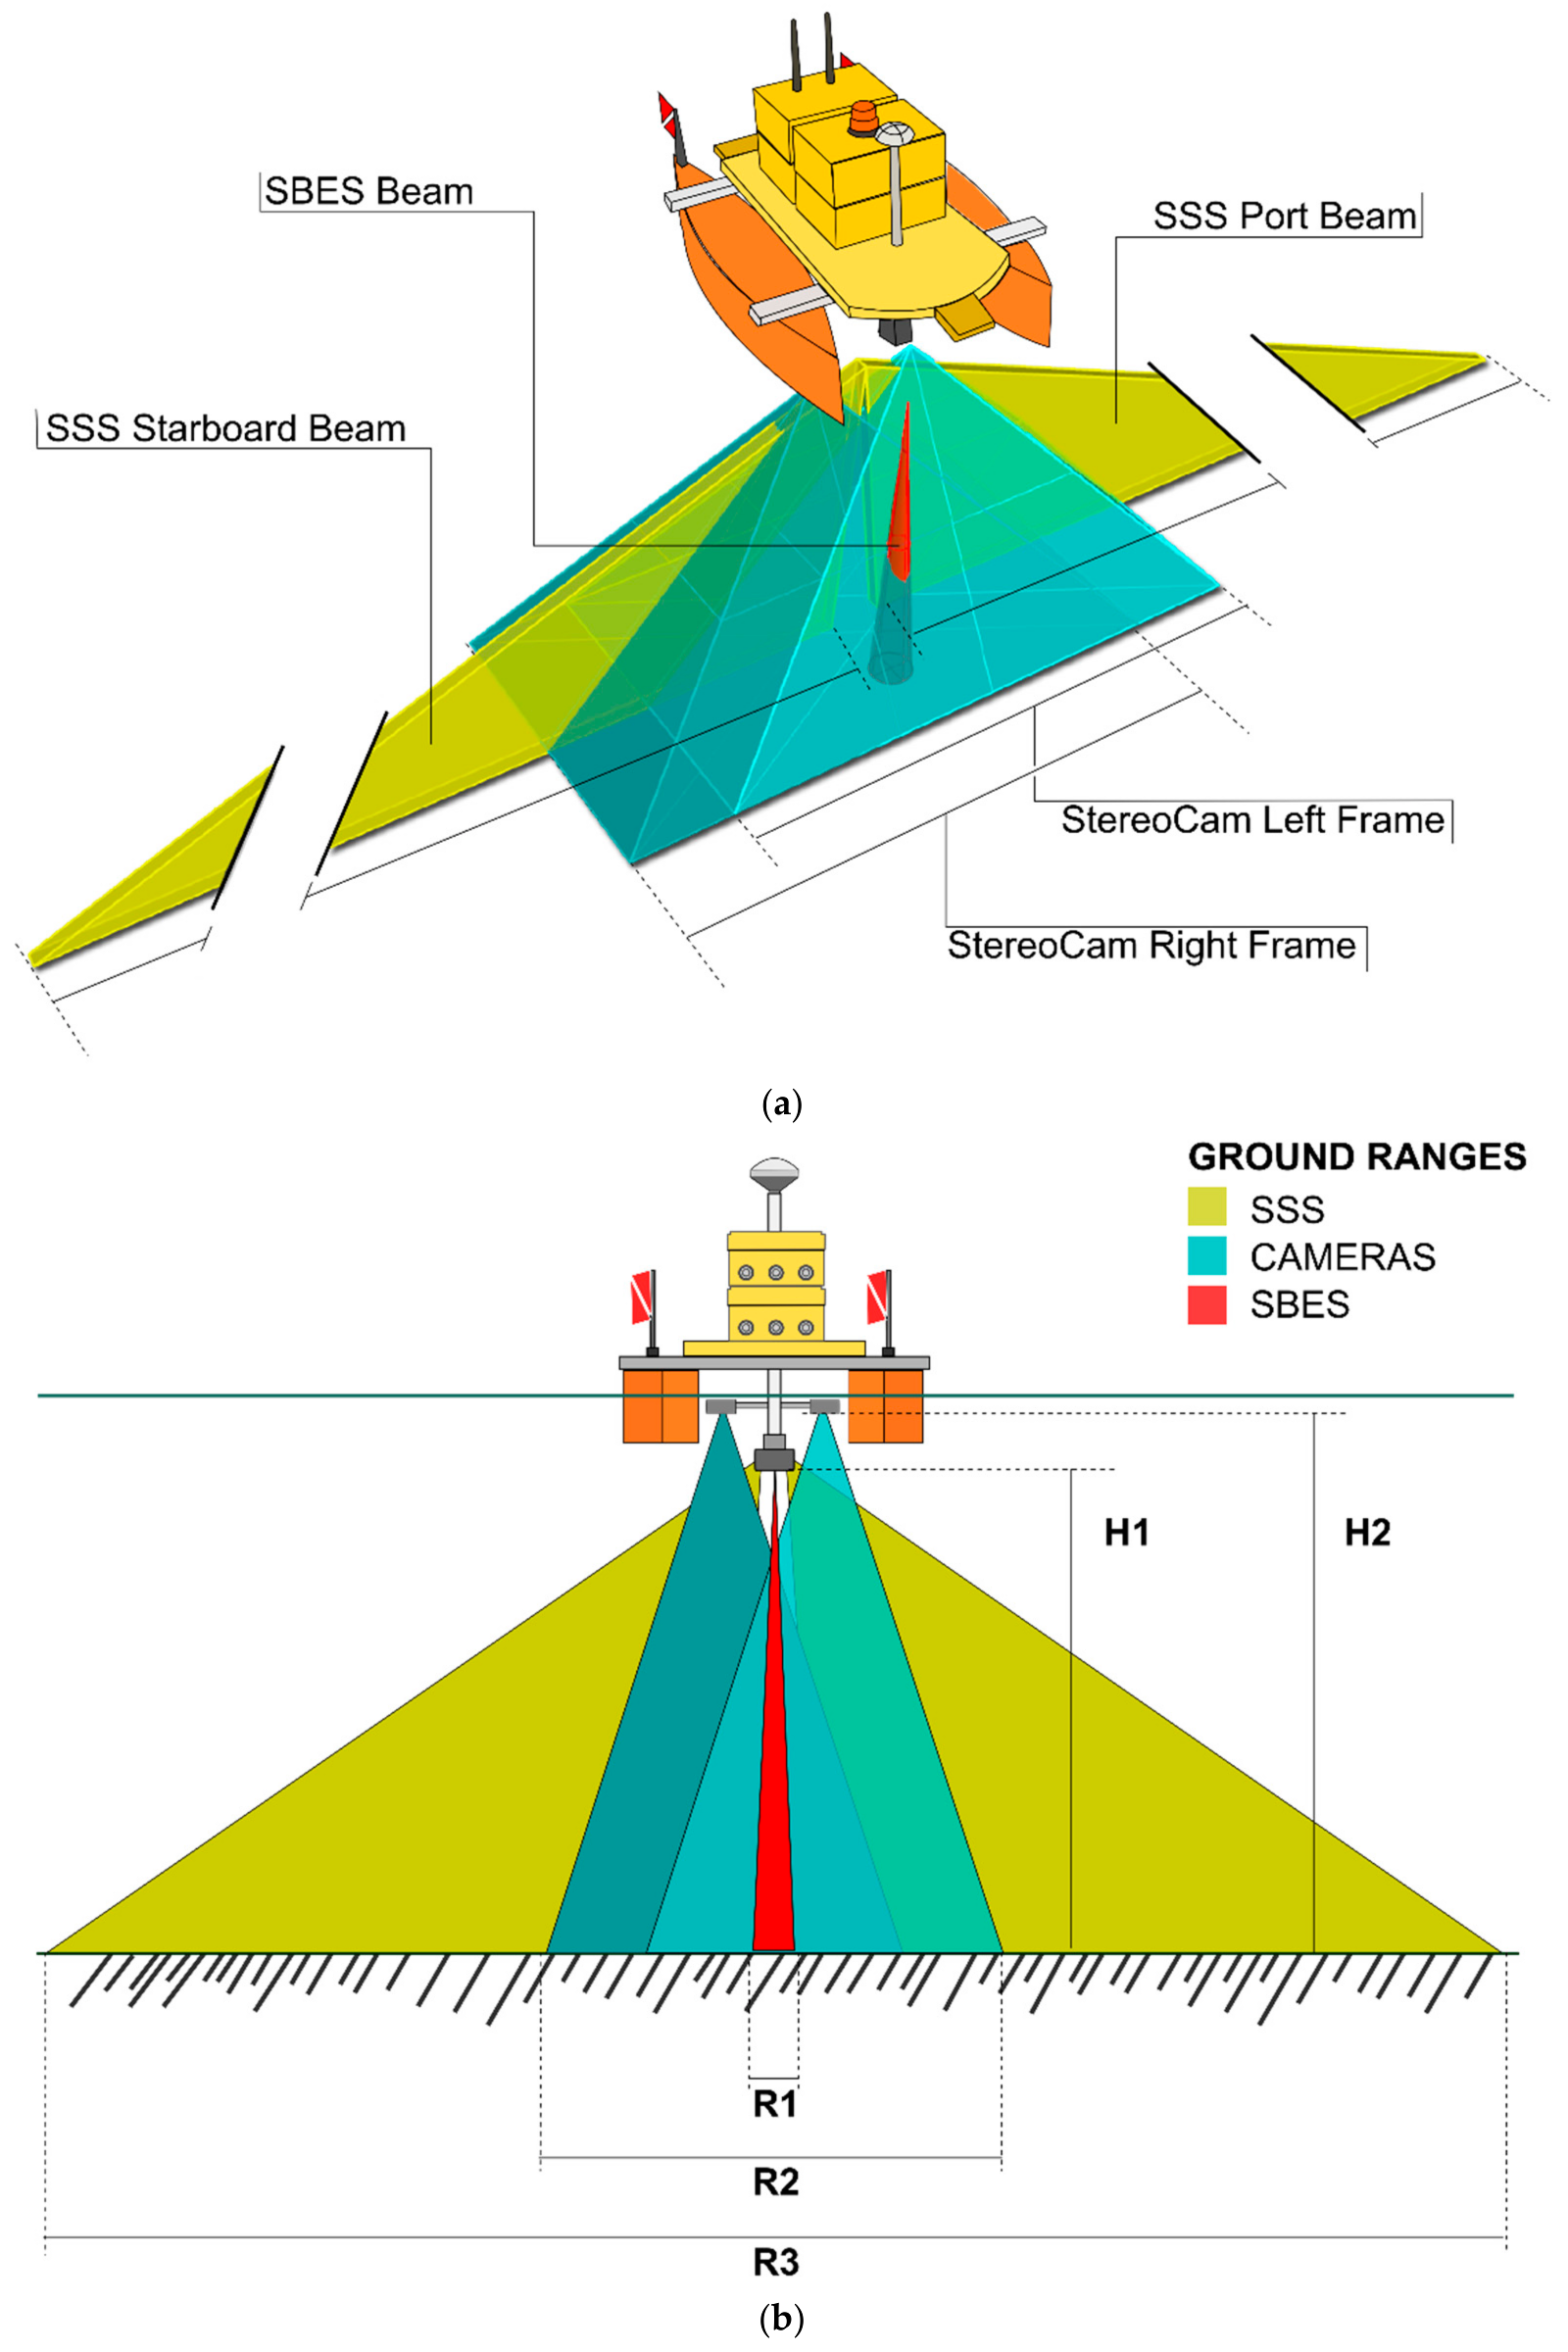
3.2.1. Acquisition Module

MicroVEGA has a payload of sensors able to perform both large- and small-scale geomorphological surveys of submerged coastal environments, in addition to the positioning sensors (GPS, IMU, RC).
The data acquisition payload consists of:
  • A 200 KHz digital echosounder;
  • A 450 KHz digital side scan sonar; and
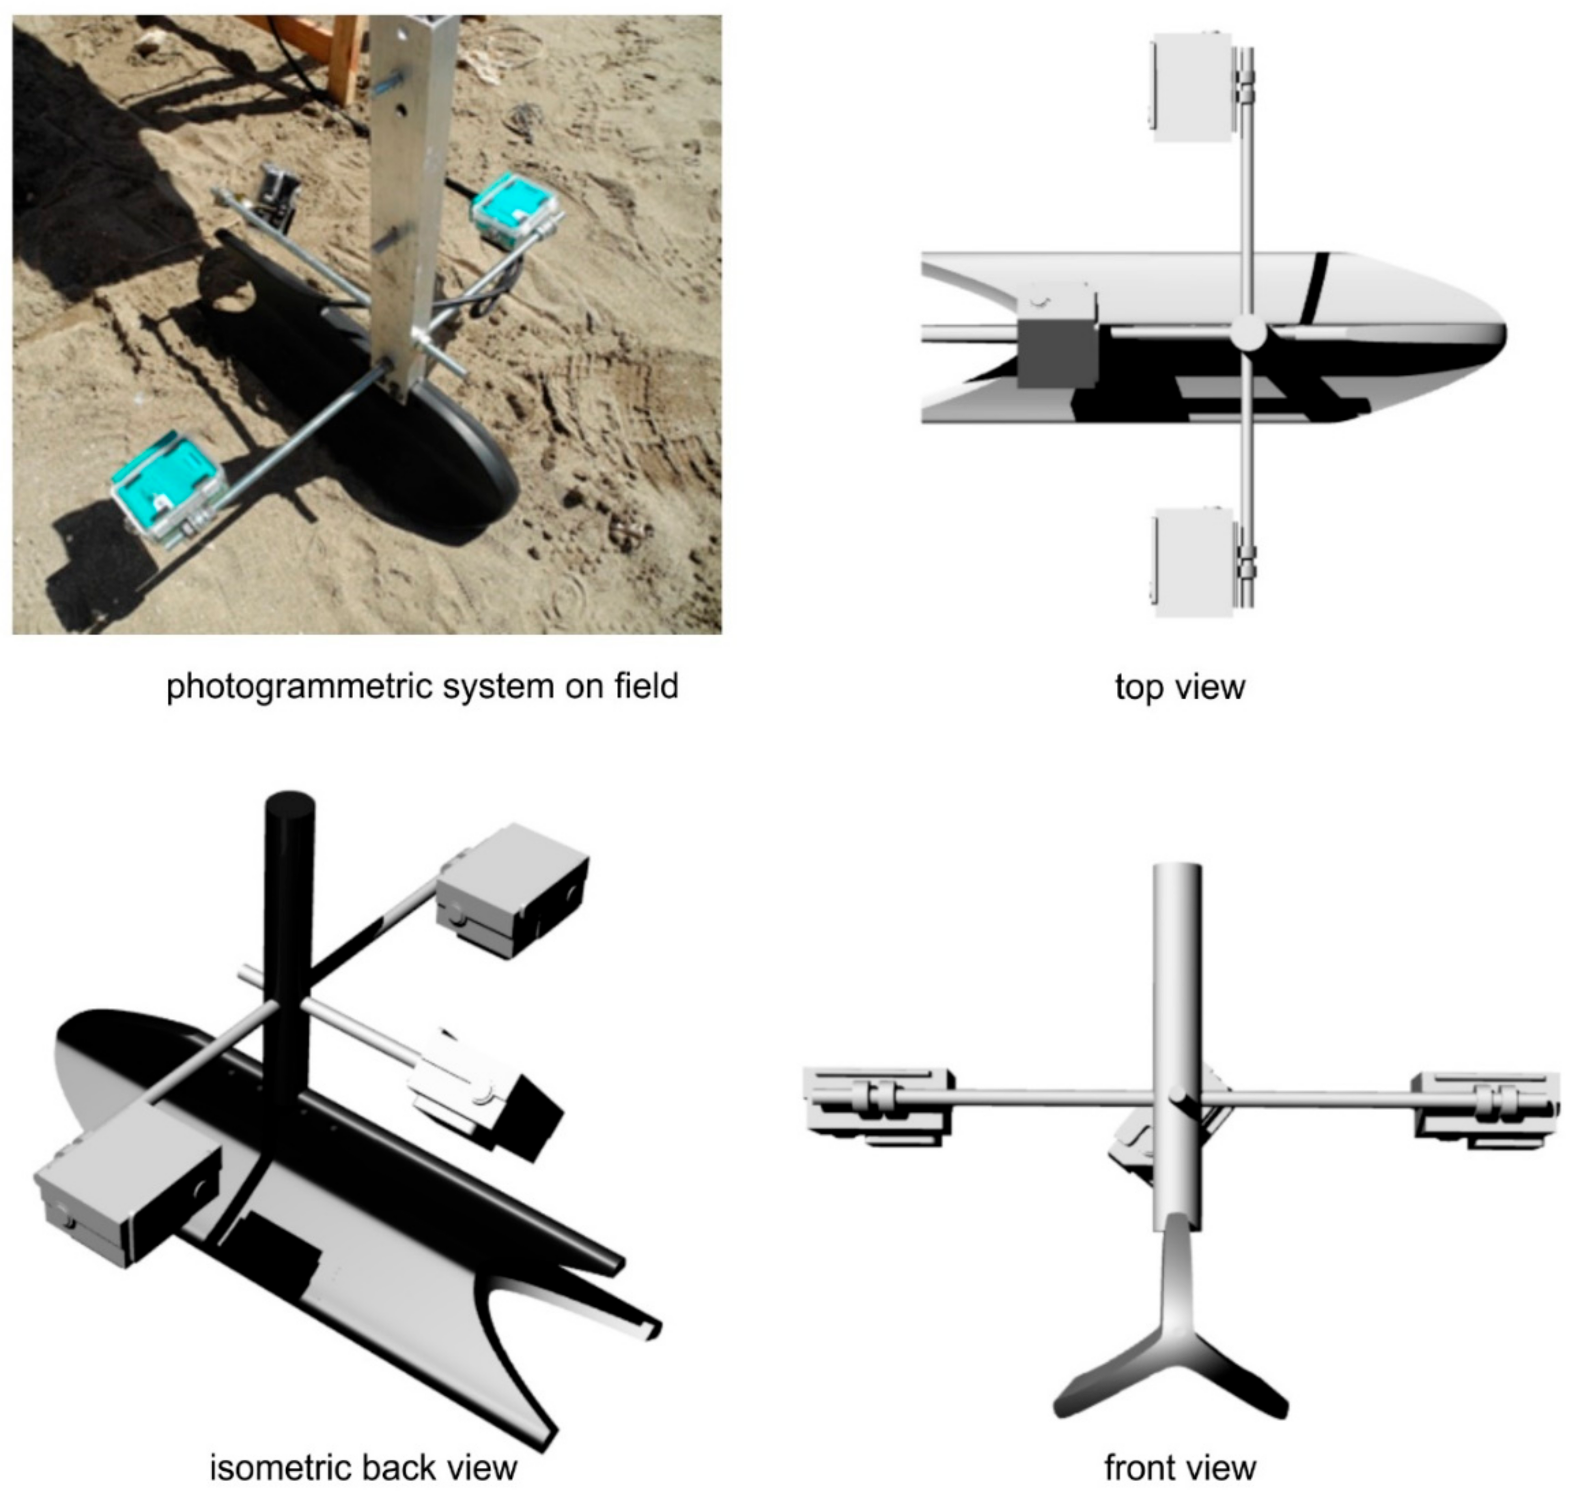
  • A high definition 3 cam photogrammetric system.
The Single-Beam Echo Sounders (SBES) is an Ohmex with 200 KHz acquisition frequency and 60 m as maximum measured depth, therefore optimised for coastal bathymetric measurements.
The Sonar Tritech Side-Scan StarFish 450C is a small instrument (0.378 m long), optimised for coastal waters (450 KHz CHIRP transmission). The slant range used during the survey is 50 m. The instrument is embedded in the USV and has an offset of a few centimetres from the GPS. Under optimal conditions, the instrument is able to discriminate an object of 0.0254 m (1 inch). The side scan sonar is used to acquire the morphology of both the target and the seabed.
The photogrammetric system installed on-board of MicroVeGA consists of two Xiaomi YI Action cameras and a GoPro Hero 3. Two of them are placed parallel with the vertical axis, with a variable stereoscopic base (b) chosen in relation to the bathymetry of the study area. With our setting for the cameras, ensuring a minimum overlap of 80% during the survey. The third camera (GoPro Hero3) is placed with its axis that forms an angle of about 30° with the seabed. It acquires data from non-covered sectors (Figure 8 and Figure 9).
Videos are synchronised using an acoustic device integrated into the on-board system. It emits sound pulses (beeps) at regular intervals, which are memorised by the cameras’ microphone. These acoustic events are stored in the datafile as flags and associated with the position, attitude and depth. During the post-processing phase, the videos captured by the three on-board cameras are synchronised using video editing software. This setup optimised the survey duration, allowing a multi-modal and multidisciplinary interpretation of the target—also thanks to the real-time sharing of all information.

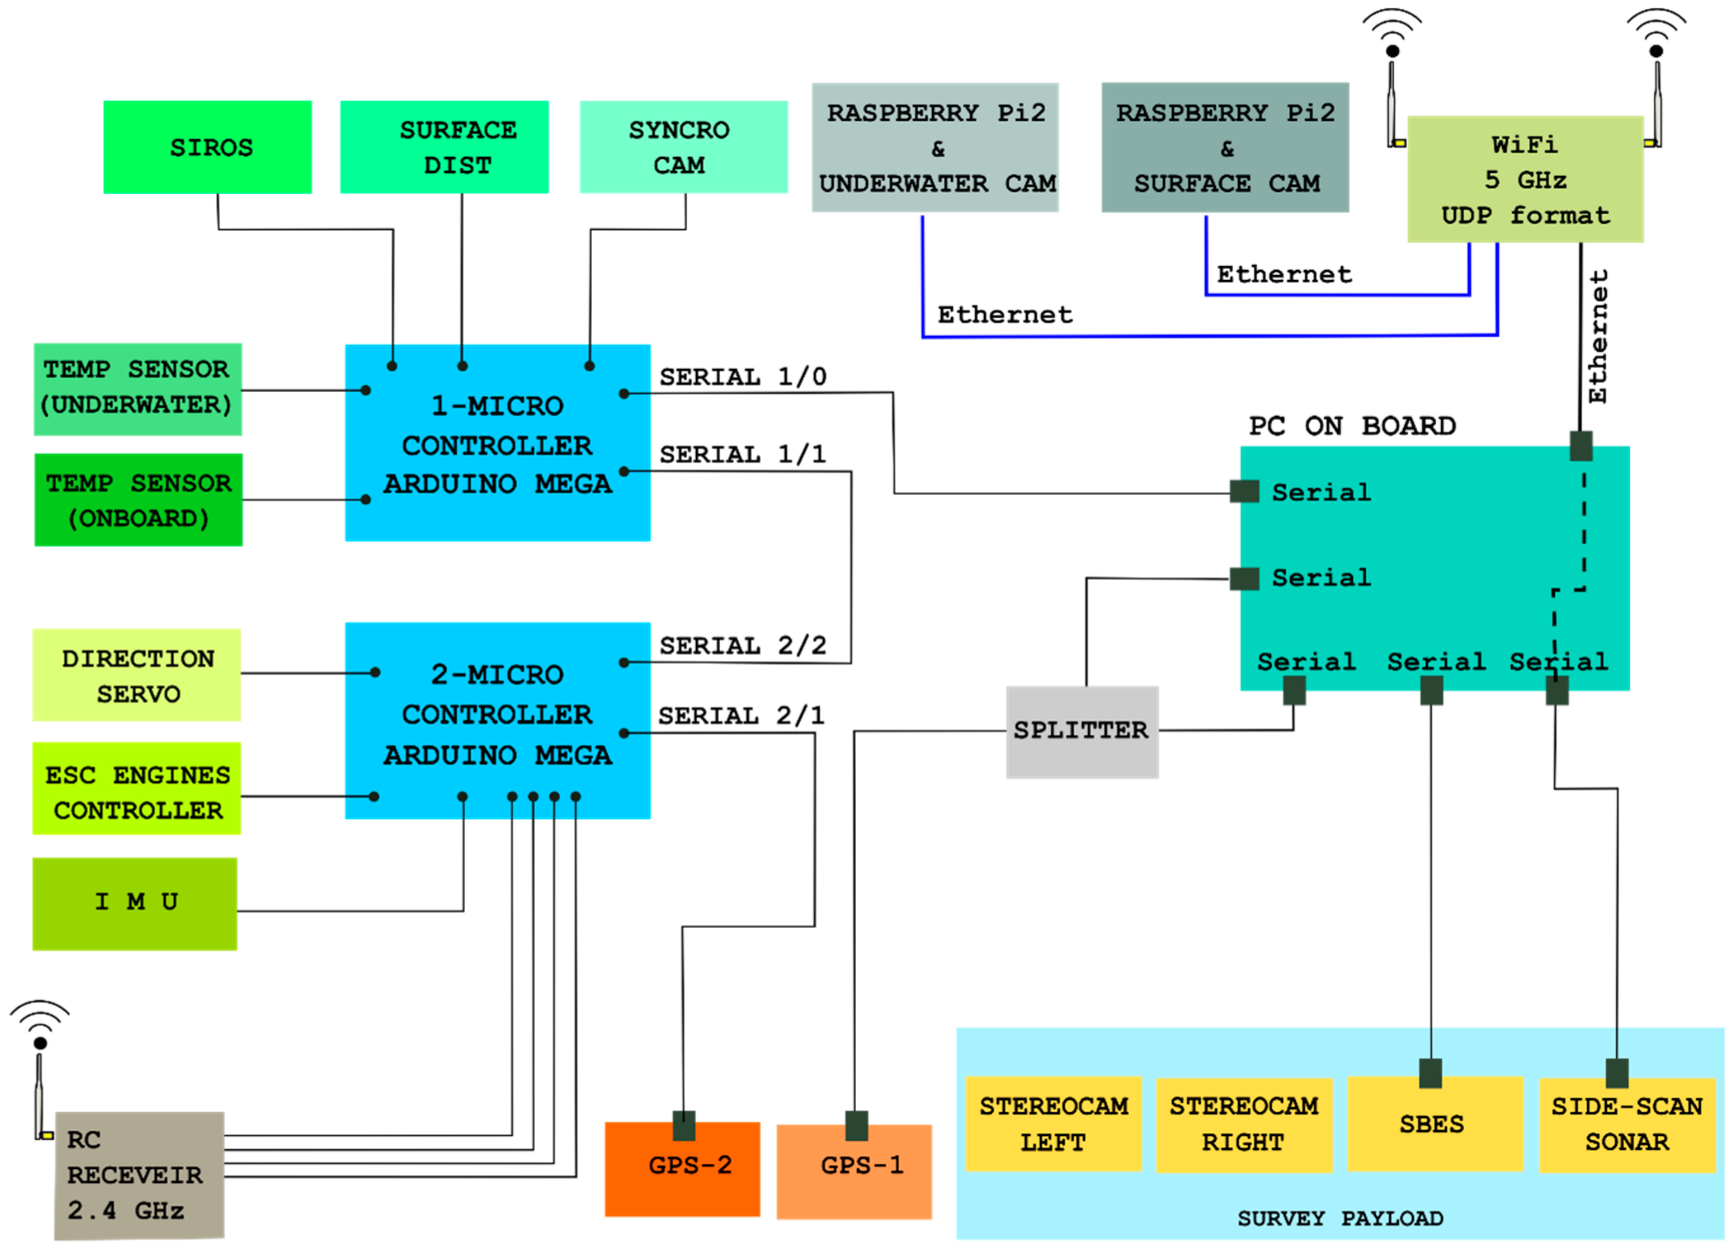
3.2.2. On-Board Computer System and Communications

The core of the MicroVeGA USV is the platform management system (PMS, Figure 10), a customised framework of software applications (Microsoft VB, Linux, and C++) aimed at the full control of data and information flow. The PMS is based on a Mini IT low power single board computer VB7008 x86 with VIA C7-D 1.6 GHz processor, two Arduino MEGA 10-bit microcontrollers and two RaspBerry Pi2 micro-boards, connected via communication ports with the on-board systems (GPS, IMU, Gyro, side scan sonar, echosounder, obstacle detection sensors, temperature control sensors, engine and rudder management system, and survey cameras).
The decision to use a customised system led to full control of the data flow. This choice also facilitated the implementation of several self-built sensors. The PMS has therefore enabled the implementation of new operating methods for the on-site experimentation of low-cost components in the geo-technological field.
The data transmission module is based on a local 5 GHz Wi-Fi network that allows broadcasting in real time all data on multiple devices (PC, tablet, and smartphone). This feature is crucial to carry out a multidisciplinary integrated survey. The Wi-Fi network has an operating range of about 2 km even if during the survey the distances were always within 500 m.
The datafile is recorded on the base station laptops, although a backup of both RAW and pre-formatted data is saved on a mass memory on-board of the USV, normally a 1 TB hard disk. During the surveys, this technological solution proved to be efficient without ever compromising the navigation, data acquisition and video streams of the cameras.

3.2.3. Correction and Quality-Control Module

The quality control module of the acquired data uses a series of components made ad hoc using off-the-shelf components, such as Arduino and Raspberry, and open-source libraries integrated with the appropriate C++ software code.
This module has been designed to evaluate the data precision in order to eliminate in post-processing all data affected by perturbations. Specific threshold values have been set to alerts in real time when the acquired data have a poor quality.
The module mainly evaluates the USV attitude and is based on two components: an acoustic system for the draught measuring and an IMU platform.
The acoustic system for the draught measuring calculates in real time the sinking of the hull and the echosounder’s transducer. This value may vary during the survey mainly for two reasons:
  • payload changes and therefore variations in the vessel draught; and
  • changes in USV attitude during the survey due to meteo-marine forcings.
The limited displacement of the hull makes the USV sinking sensitive even to small variations of loaded cargo. In particular, the MicroVeGA sinking increases by 1 cm for every 2 kg of loaded cargo. The payload variations, frequent in a modular system such as MicroVEGA, can produce noticeable draught differences.
Further variations in the draught can be due to changes in the speed and to weather and sea conditions.
The acoustic system for the draught measuring, therefore, contributes to increasing the bathymetric measurement as well as to improve the navigation of the USV.
This system uses an ultrasonic sensor with a frequency of 1 Hz to measure in real time the distance between the sensor itself and the sea surface, i.e., the sinking of the drone (D1 in Figure 11); it is mounted on a structure parallel to the sea surface.
An Arduino microprocessor connected to the ultrasonic sensor sends by a specific routine the draught measurements to the mission software. Draught data are recorded in the integrated datafile, and then broadcasted to the base station in real time
The Nisida survey was carried out in optimal weather conditions (calm sea and no wind). Nevertheless, during a marine survey, occasional events—such as the passage of a vessel—can influence the acquired measurements. Such events, generating waves, can alter the acquired bathymetric measurement.
To evaluate such events, a control system has been developed. This system includes an Arduino MeGA microprocessor, a mass memory on microSD and a 9-axis inertial platform, integrated to the platform management system (PMS).
This system acquires the attitude information of the USV (pitch and roll), allowing discarding bathymetric measurements affected by errors introduced by attitude anomalies.
The device is based on The Pololu MinIMU-9 v3, an inertial measurement unit (IMU) that packs an L3GD20H 3-axis gyro and an LSM303D 3-axis accelerometer and three-axis magnetometer onto a tiny 2.03 × 1.27 cm board, an Arduino MeGA microprocessor and related software.
The embedded software developed in C++ allows the calibration, the setting of the sampling frequency, the data acquisition and the sharing.
The acquired data are stored both on the mass memory of the device (a 16 GB microSD), and transmitted in real time to the base station (datafile).

4. Post-Processing and Data Elaboration

By using MicroVeGA drone, a multimodal mapping of a multidisciplinary dataset has been obtained in the surrounding area of Nisida Roman harbour.

4.1. Bathymetric Data Post-Processing

The bathymetric system was used to measure the depth of archaeological remains and to reconstruct the detailed seabed bathymetry [53]. The depths (D) were referred to the vertical datum of mean sea level (MSL), correcting each measurement (M) with respect to tidal height (ht) and barometric value (Δhp) obtained from the Naples tide gauge of the National Tide Gauge System because of its close proximity of the survey area:
D = M + h t + Δ h p
where ht is the tidal height value at the time of measuring, and the barometric correction Δhp is:
Δ h p = ( 1013 P ) × 1.023557761
where P is the barometric value at the time of measuring.
Finally, the depth measurement was corrected with respect to the transducer submersion, measured by the acoustic system for the draught measuring (see Section 3.2.3).
The bathymetric data were elaborated in a GIS environment to reconstruct the seabed morphology, as described in Section 5.1.

4.2. SSS Data Post-Processing

The side scan sonar system, performing the acoustic mapping of the seabed in shallow waters sectors, is optimised to detect the archaeological remains lying on the seabed and to define the seabed landforms [53], by discriminating the sandy bottom from the rocky one.
In the first instance, all sonographs were processed by using Chesapeake Sonar Web Pro 3.16 software to create a GeoTIFF mosaic and obtain the sonar coverage of the whole area.
This mosaic was elaborated in ArcGIS ArcScene obtaining a 3D view of the submerged acoustical landscape (See Section 5.1).
The analysis of the backscattering signal carried out in this research allows the evaluation of the characteristics of the acoustic reflectors identified: archaeological remains, rocky bottom, and sandy bottom. This analysis was made possible thanks to the automatic use on the SSS of a Time-Varying Gain (TVG) filter, which emphasises the gain for acoustic signals reflected by the structures positioned on the borders of the sonograph.
The trend of the backscattering along a horizontal line (sweep) was analysed since the radiometric values contained in a specific sweep correspond to the intensity of the backscattering recorded by the instrument. To graph the trend of the most significant sweeps, each sonograph was exported in a grey scale image, thus obtaining that the amplitude of the backscattering signal varies between 0 and 255 (See Section 5.1).

4.3. Photogrammetric Data Post-Processing

The photogrammetric survey was carried out simultaneously with the acoustic one, by using the photogrammetric system installed on-board of MicroVeGA.
The photogrammetric 3D model of the upper part of the pila was obtained in three steps:
  • The videos at 30 fps recorded by the two Xiaomi cameras (previously calibrated in an underwater environment close to the study area to achieve the inner orientation parameters [54]) were synchronised using the trigger system and the images were extracted using every sixth frame. More than eight-thousand 1920 × 1080 images were thus obtained.
  • The alignment procedure of the images was performed by Agisoft Photoscan software, subdividing them into several strips to reduce calculation times. For each strip, a dense point cloud was extracted and georeferenced by using the coordinates of the markers positioned on the pila that were determined by GPS Fast static procedure.
  • The different point clouds were subsequently assembled in a single cloud using the open-source software CloudCompare through the classic ICP procedure [18].
  • The whole point cloud, of almost 10 million points, can be decimated and exported in different formats compatible with GIS applications; the subsampling process was necessary to avoid visualisation problems with poor performance computers.

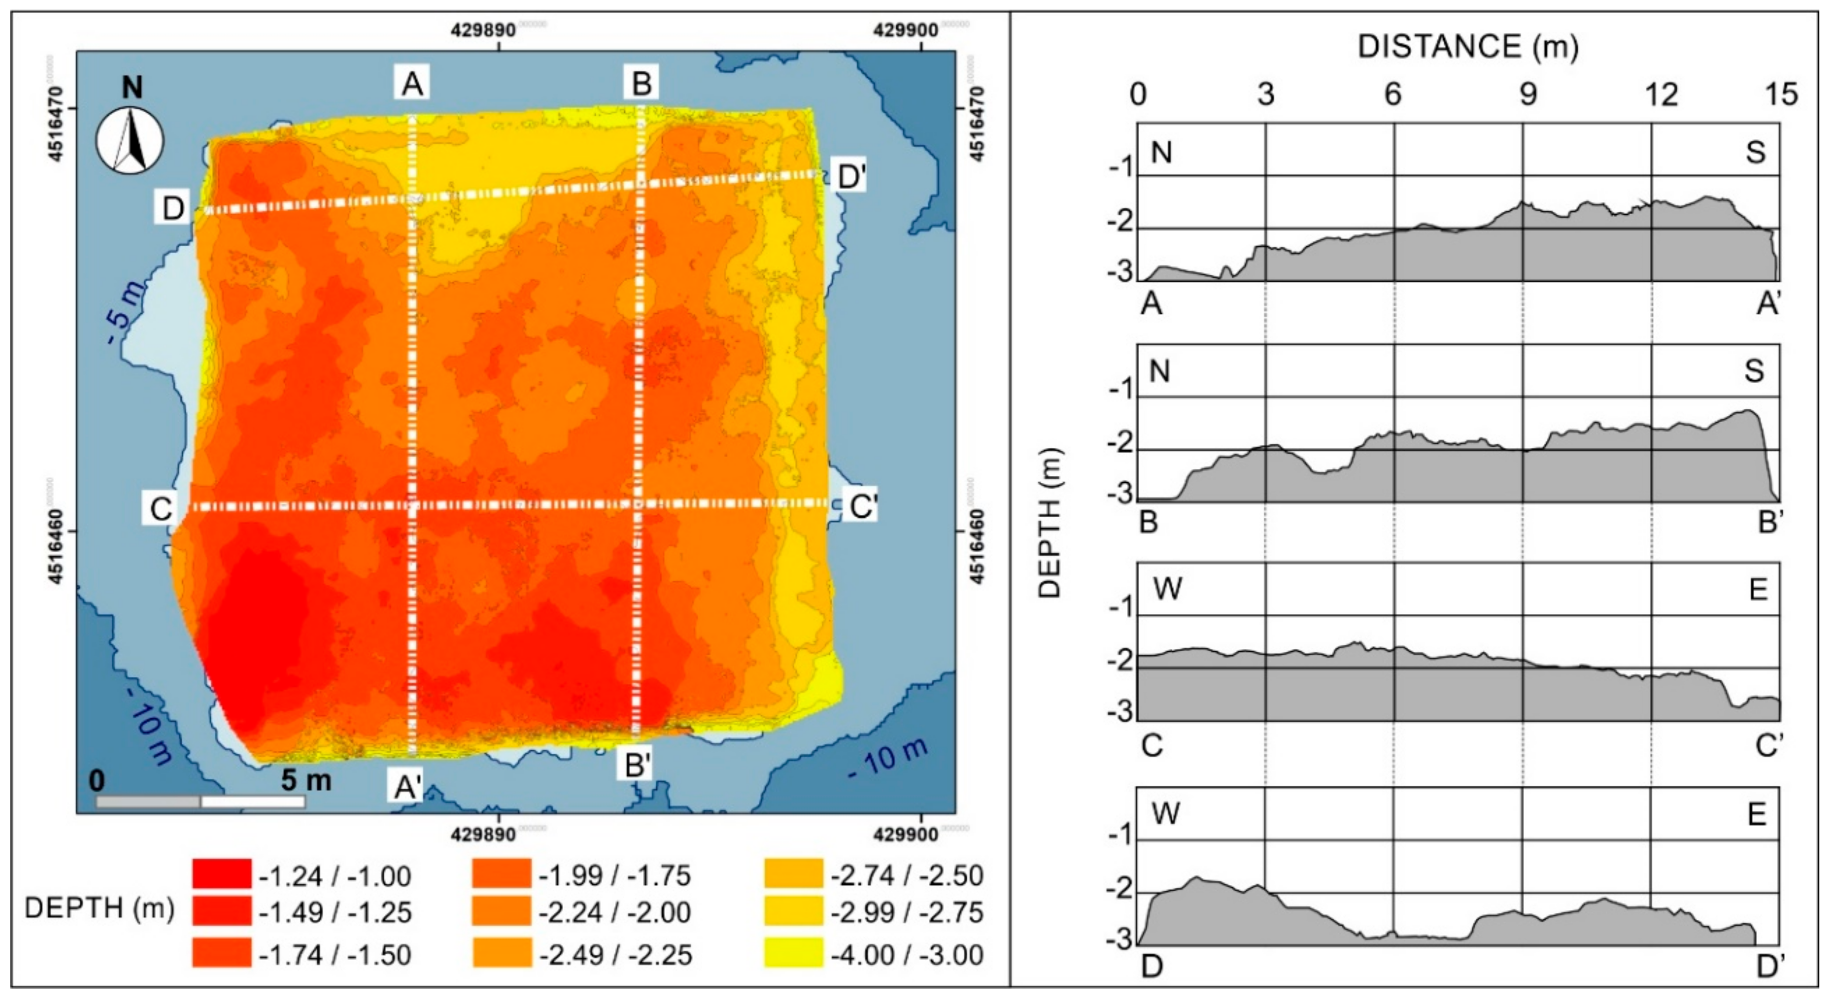
4.4. Morphometric Analysis of Three-Dimensional Data

The 3D elaboration was applied both to the bathymetric and photogrammetric data in order to obtain a multi-scale reconstruction of the underwater archaeological landscape.
The small-scale data processing was applied to the bathymetric measurements by obtaining a high-resolution sea-bottom digital terrain model (seaDTM), with a spatial grid of 0.1 m × 0.1 m.
The seaDTM was calculated using an ordinary Kriging interpolator of ArcGIS 3D Analyst tool, with a variable search radius.
The large-scale 3D data processing was applied to the photogrammetric point cloud obtaining the precise morphological reconstruction of the upper face of the submerged pila (pilaDTM), with a spatial grid 0.01 m × 0.01 m. The pilaDTM (See Section 5.2) was calculated using an inverse distance weighted (IDW) interpolator of ArcGIS 3D Analyst tool, with a variable search radius of the 12 nearest points.
Finally, a slope analysis was applied to the pilaDTM to make a first evaluation of the erosion degree. This analysis followed four steps:
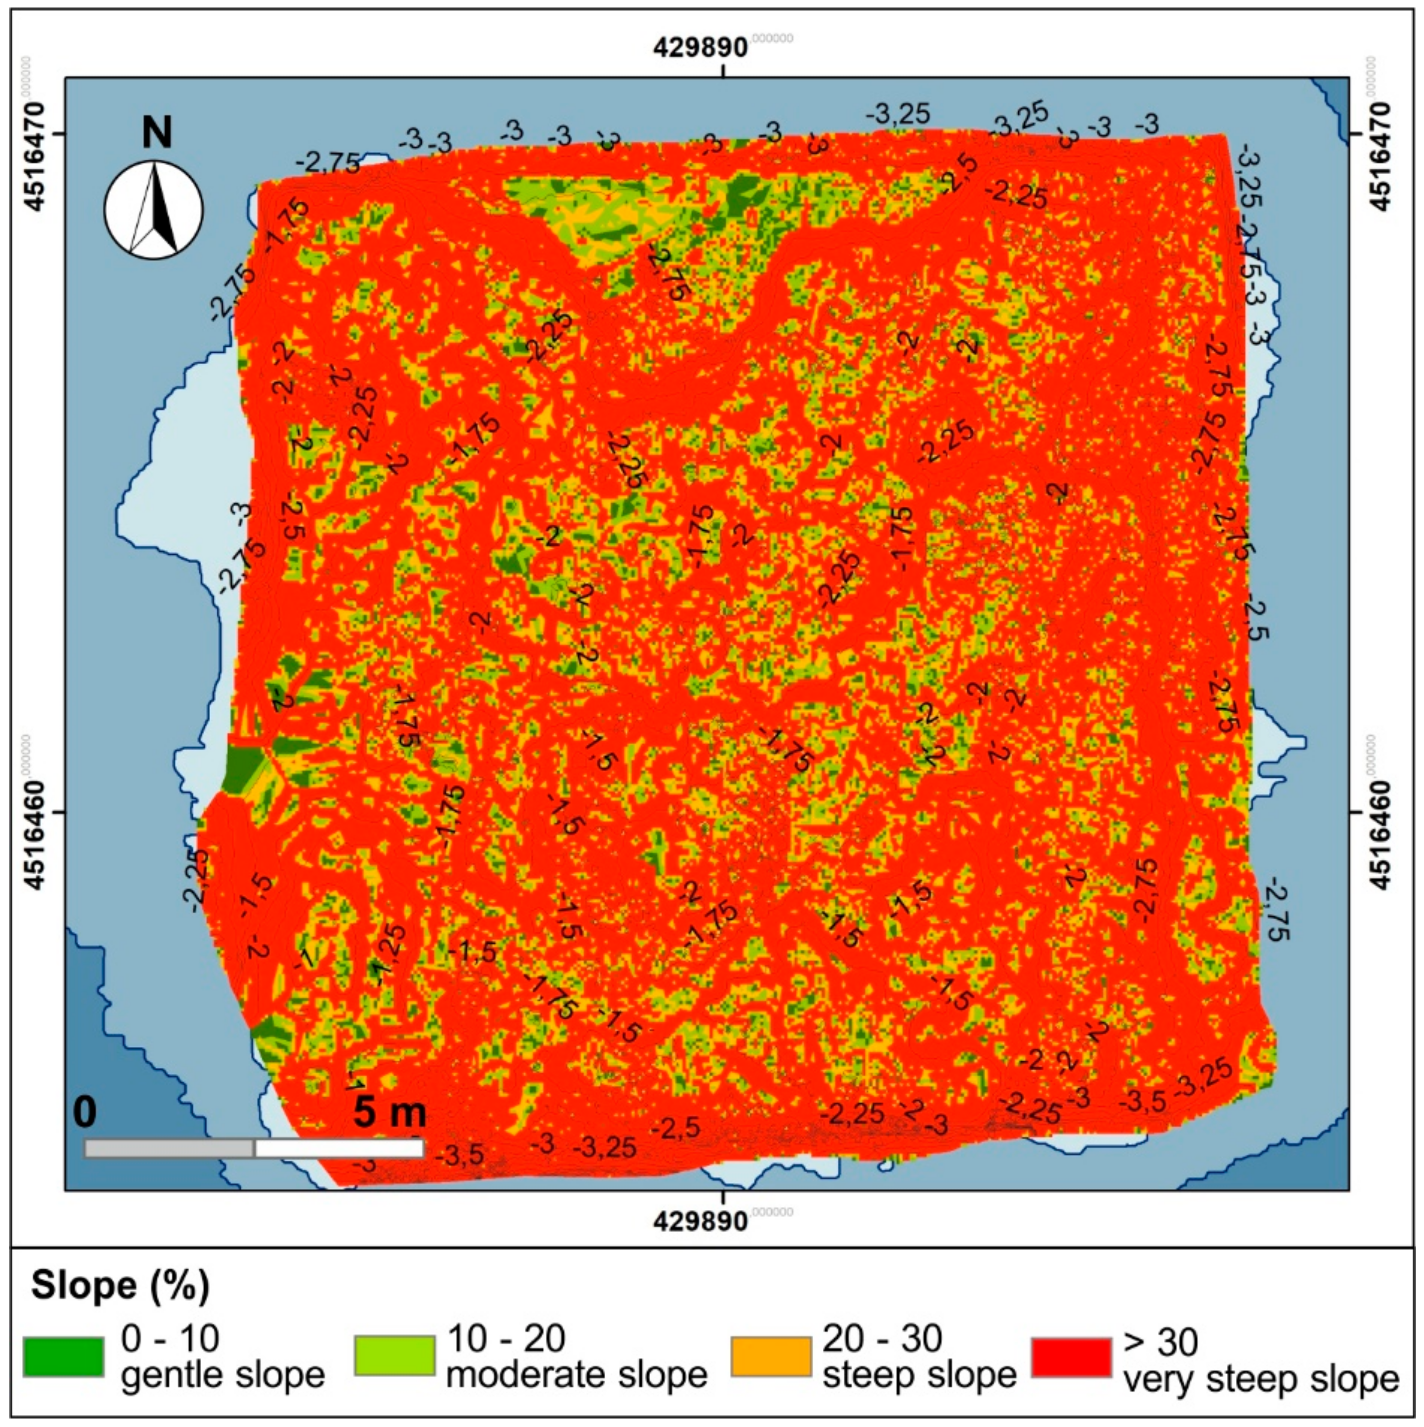
  • Calculate slop in per cent of the pilaDTM.
  • Reclassify slope into four classes (gentle slope, moderate slope, steep slope and very steep slope).
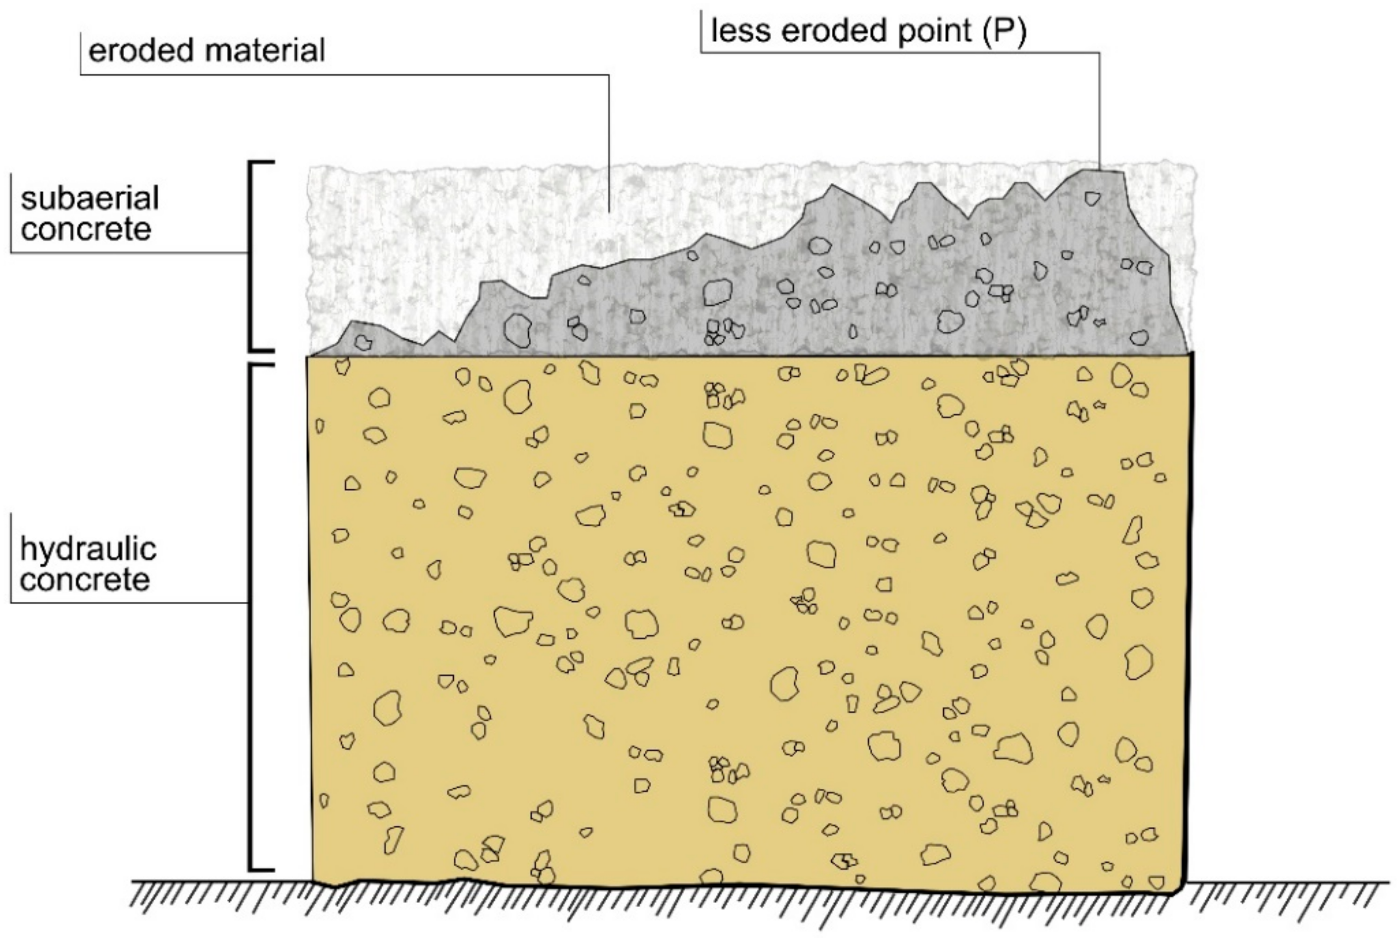
  • Reconstruct a flat surface (topDTM) representing the top of the pilae before the action of the erosion processes.
  • Calculate eroded volume between topDTM and pilaDTM.

5. Results

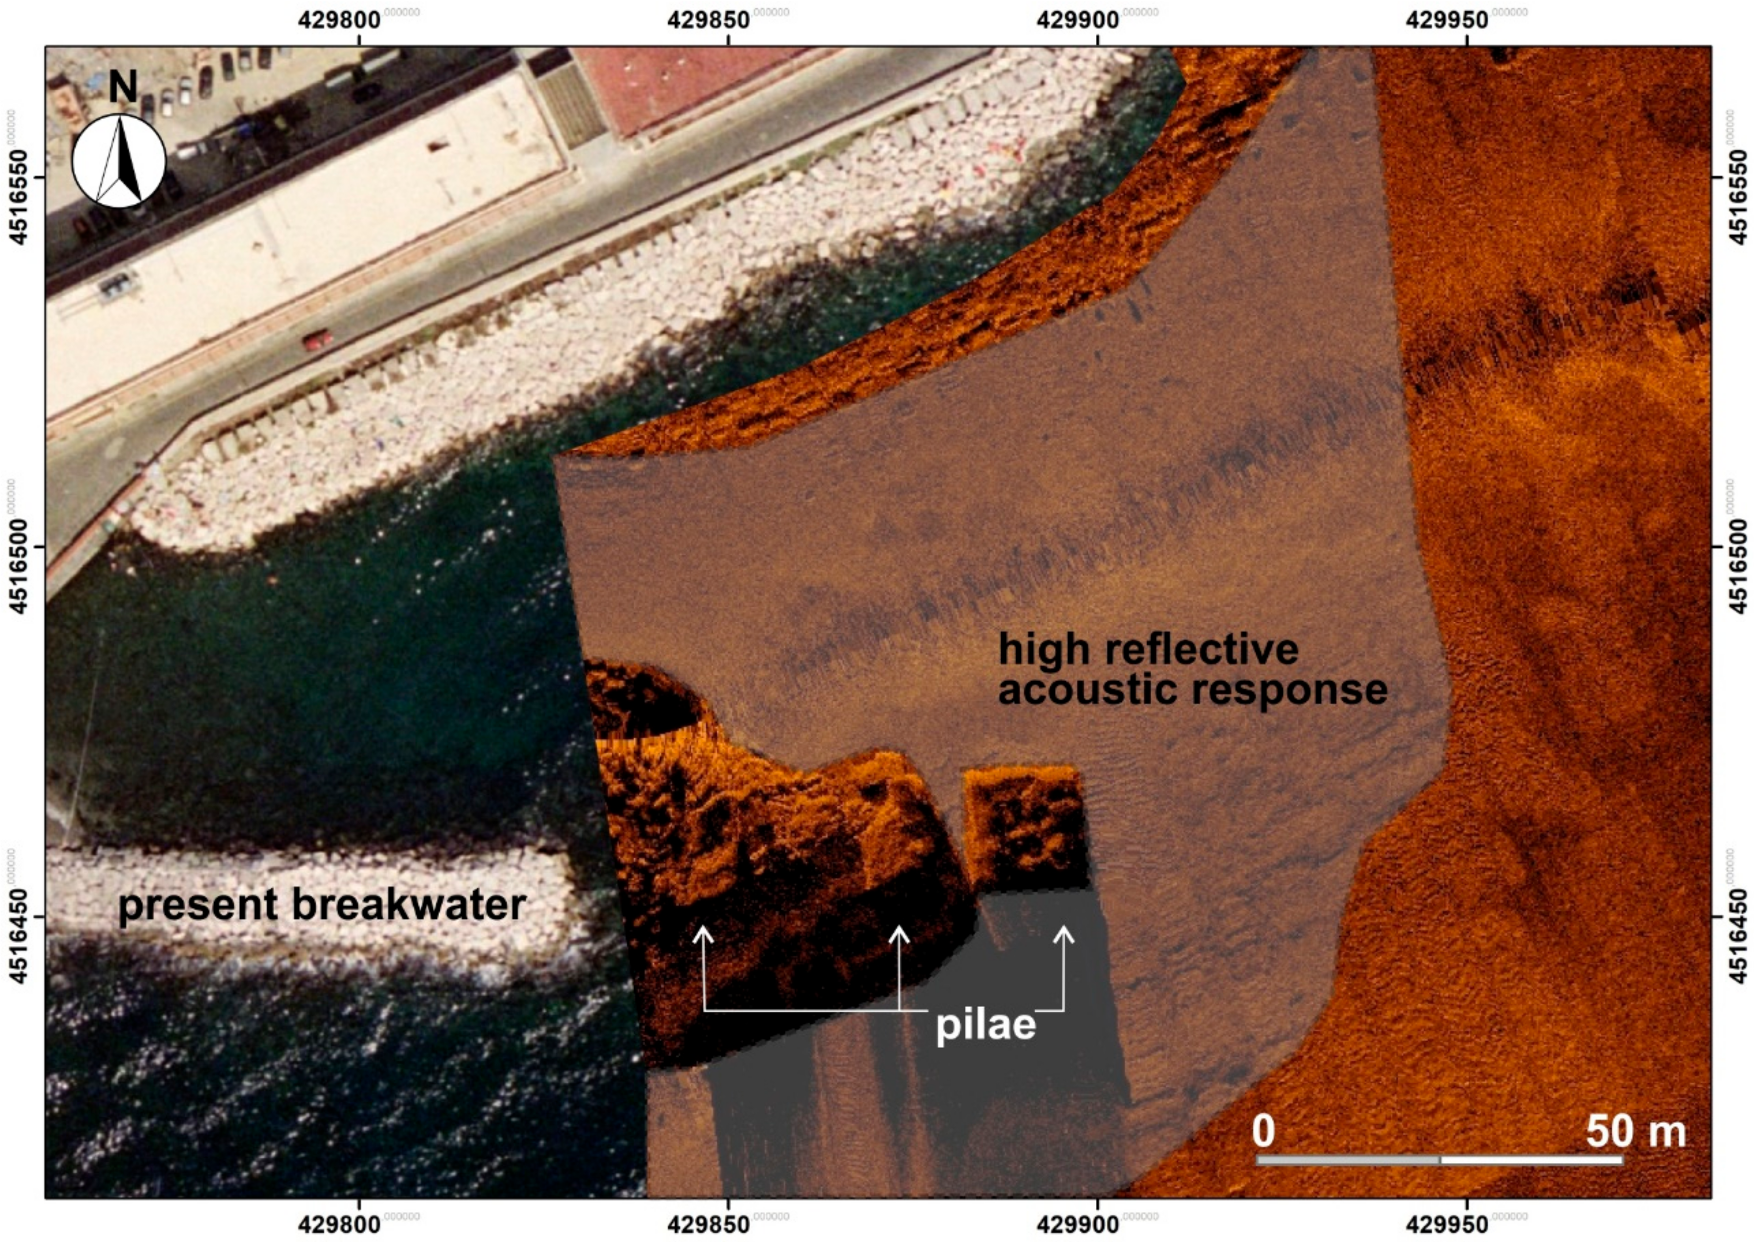
5.1. Small-Scale Data Elaboration

The small-scale data elaboration was applied both to bathymetric and SSS data to obtain a landscape reconstruction of the coastal sector (Figure 12). The seaDTM can be divided into a gentle slope sector between 0 and −10 m and a steeper slope sector with a bathymetry higher than −10 m. On the sub-horizontal seabed, the remains of two pilae were precisely georeferenced. However, while the inner pila resulted almost completely destroyed, the outer one preserves its original shape. As can be seen in Figure 12, the other five pilae represented in the historical maps (Figure 3b) were buried by the modern breakwater.
The SSS mosaic is a realistic picture of the submerged landscape, with several qualitative information on the seabed typology and the conservation state of the archeo-structures (Figure 13 and Figure 14).
By a numerical point of view, the backscattering analysis of each sonograph allowed an acoustical characterisation of the archaeo-targets and the seabed typology.
As shown in Figure 13, the highest backscattering values are associated with the edges of the archaeological structures (value 140 in the grey scale), which in this case have reflected about 60% of the acoustic signal emitted by the SSS transducer.
The highly reflective acoustic response (max value 80 in the grey scale) of the sub-horizontal surface on which the submerged pilae are laid (Sector 4 in Figure 13) can be interpreted as a rocky bottom, covered by a thin sediments layer. The sediment coverage was testified also by the presence of well-aligned ripples (Sector 3 in Figure 13) at the foot of the better-preserved pila.
The backscattering signal of the archeo-structures ranges between 10 and 140 amplitude values. This variability is clear evidence of the roughness of the pilae upper face due to the erosive effects of the wave’s action (Sector 1 in Figure 13).
Finally, the area in Figure 13 between Samples 135 and 155 (on x-axis) is characterised by very low values of signal amplitude, as it is a sector of acoustic shadow, but presents a structure (amplitude value 45 in the grey scale) that emerges from the bottom almost at the same height of the pila. This structure can be interpreted as part of the nowadays-collapsed opus pilarum.
The extensive analysis of backscattering along with the three-dimensional reconstruction of the seabed morphology allowed a precise mapping of the sub-horizontal surface on which the pier was built during the Roman period with a high reflective acoustic response that can be interpreted as the tufa abrasion platform formed during the Holocene high stand (Figure 14, [21]).

5.2. Large-Scale Data Elaboration

The large-scale data elaboration—by interpreting bathymetric and photogrammetric data—had a twofold target:
  • the reconstruction of the archaeological structures to evaluate the conservation state of the better-preserved pila composing the ancient pier as well as to discriminate the erosive effects due to the waves action.
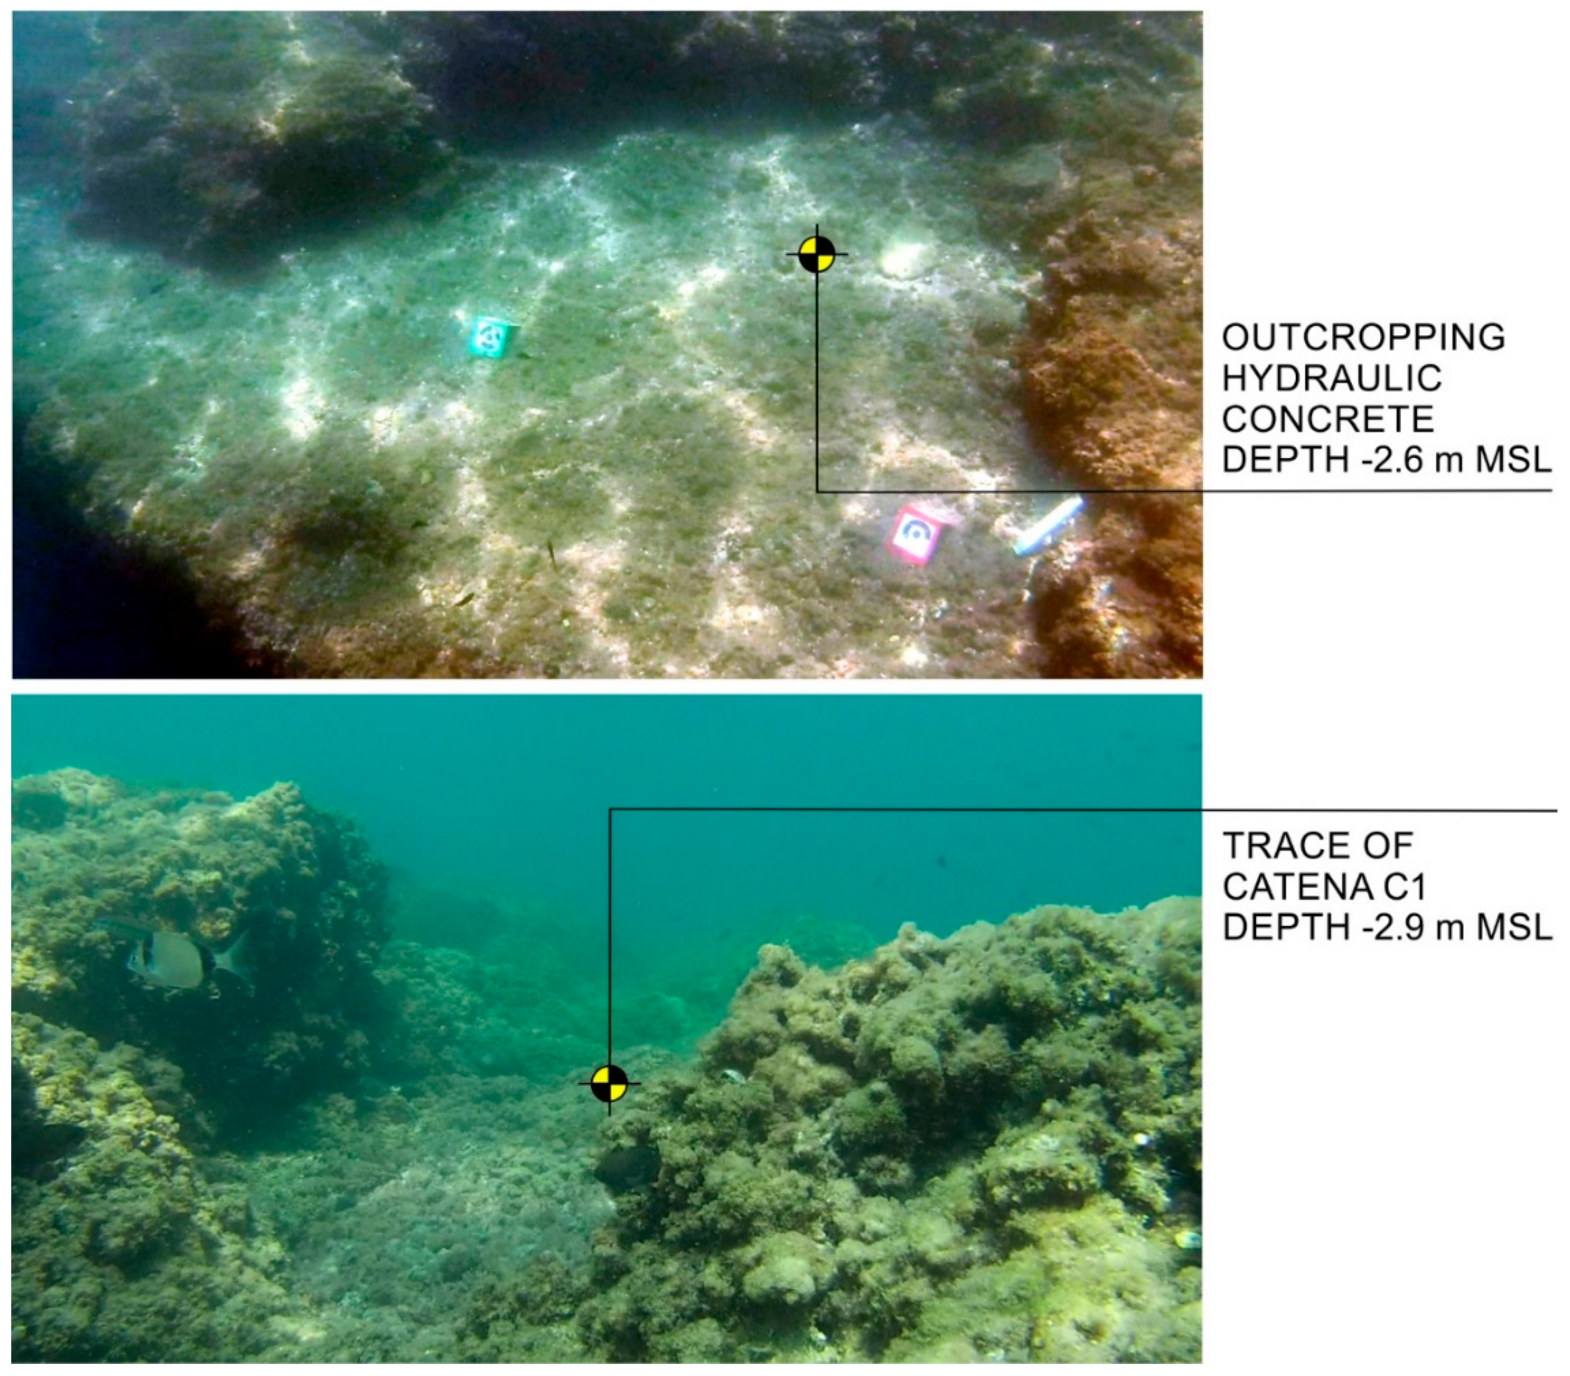
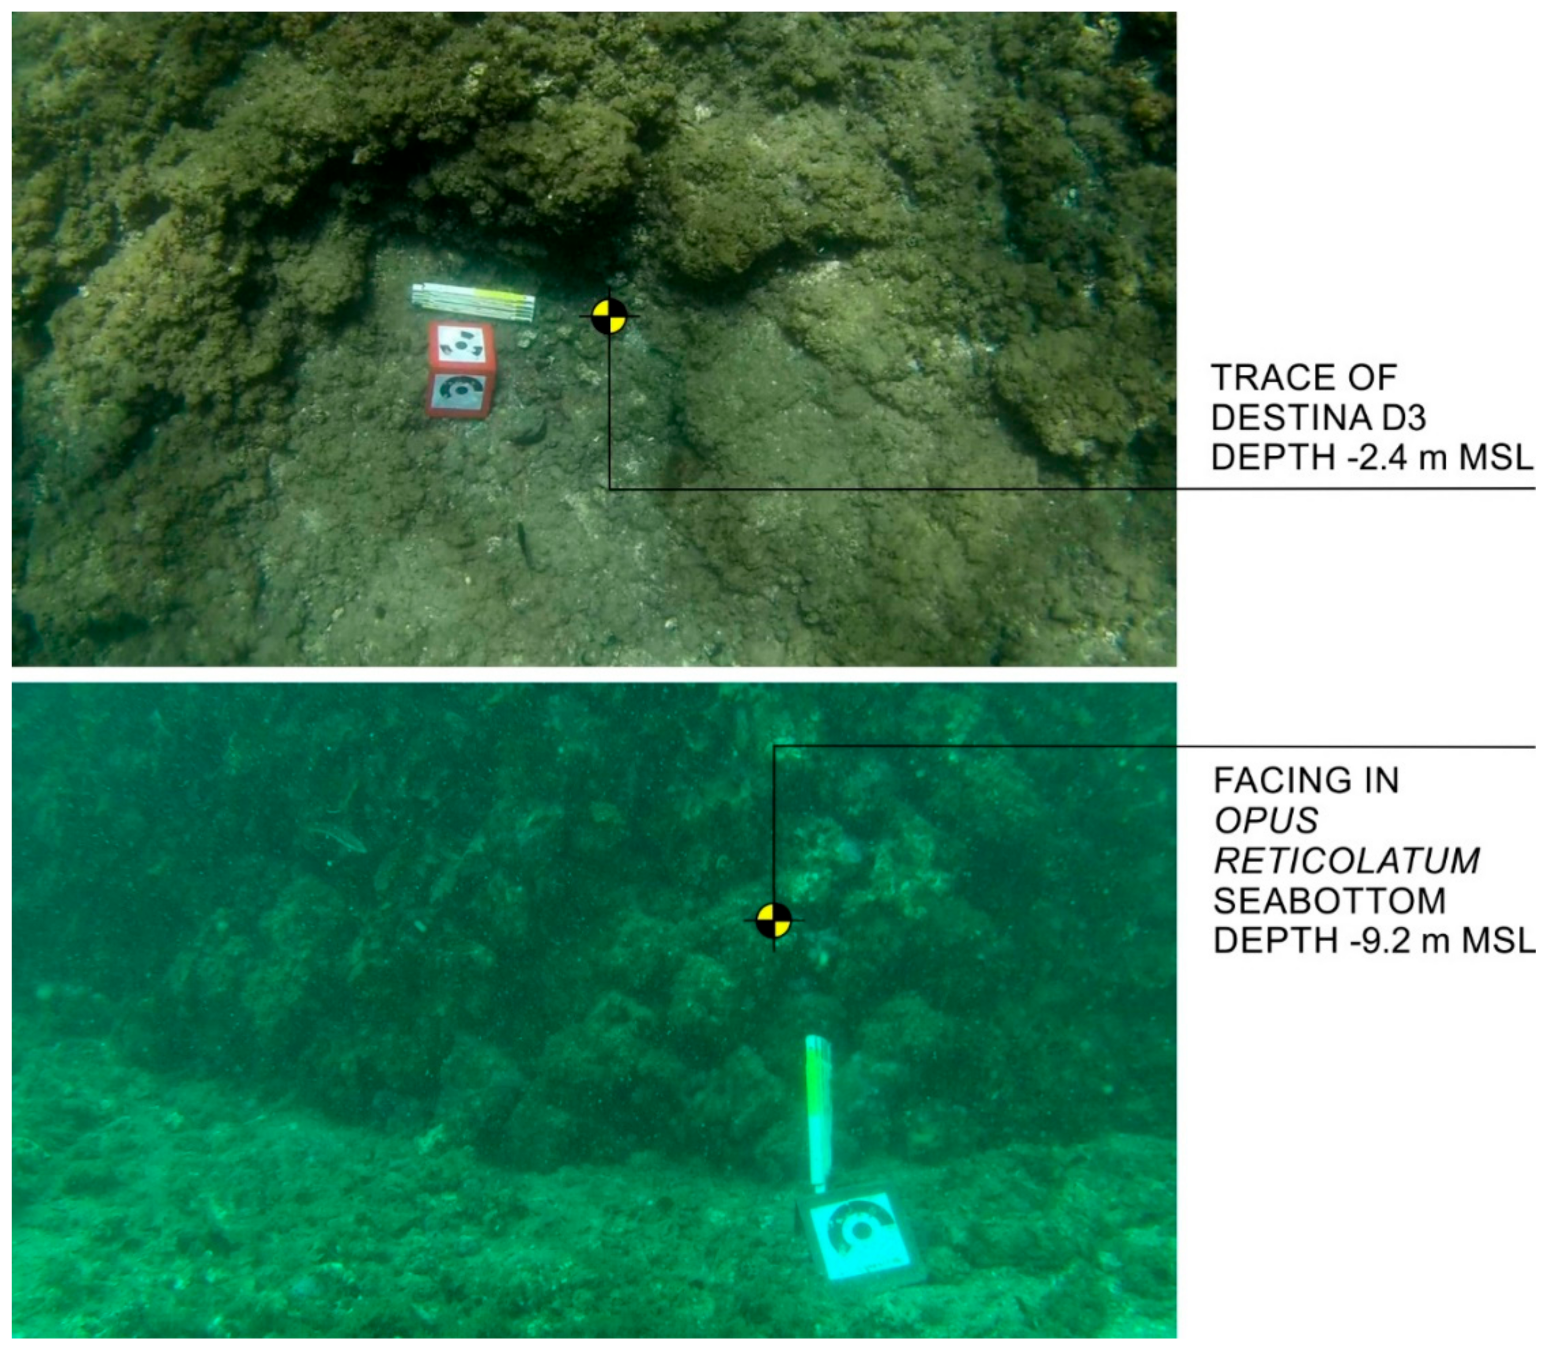
  • the detection of a new type of sea level marker measuring point, useful in the case of port-like structures built in the hydraulic concrete cast and set underwater.
The three-dimensional reconstruction of the upper surface of the pila (pilaDTM)—deriving from the photogrammetric data interpolation—has clearly demonstrated the more eroded condition of the sectors between N and SE (Figure 15).
The deeper area reaches a depth of −3.0 m in the NE edge of the archeo-structure, as can be observed in the profile BB’ in Figure 15. The areas with a depth range between −3.0 and −4.0 are related to the vertical borders measured during the photogrammetric survey.
By analysing pilaDTM (Figure 15), the higher areas between −1.00 m and −1.5 m of depth represent remnants of former upper face of the pila, while the deeper areas on the same face—between −2.5 and −3.5 m—appear rather flat along the N, E and SE borders and can be explained as the sectors more eroded by the sea action.
The slope analysis—here proposed as a quantitative method for the evaluation of the conservation state (Figure 16)—highlights the massive erosive effect due to the wave’s action on the top of the pila. In fact, the highest sectors—reaching −1 m of depth—are less eroded but are fitted to the less elevated areas by steep forms belonging to the third and fourth classes (steep slope and very steep slope), and occupy 84.7% (Table 2) of the total surface (222.4 m2). Instead, the more eroded sub-horizontal sectors (7.4 m2) are 3.3% of the total surface and, for the most part, rests at a depth greater than −2.6 m.
We can affirm that a large part of the upper face of the pila presents a rugged surface due to the high erosion degree of the former surface (Figure 17), as also deduced by the backscattering signal analysis of the SSS sonograph.
The volume of the materials eroded by the sea after the modern submersion of the pila (Figure 17)—after 1838 AD—was evaluated in at least 240 m3. It was calculated by using the Cut-Fill tool of ArcGIS, between the pilaDTM and a horizontal surface (topDTM) at −1 m of depth and with the same planar extension of the pilaDTM. The obtained horizontal surface is the surface passing through the less eroded and more elevated point (P). Since in P the cement is covered by a thin vegetation stratum of about 0.14 m (sV), the real submersion of the surveyed pila in P (sP) was calculated by a correction:
s P = Depth s V
However, we have also detected several sectors laying at a depth of −2.6 m and presenting a flat morphology. These small flat elements mark the maximum deepening of the erosive processes. Furthermore, they point out the interface between the more erodible concrete laid in subaerial environment (submerged in the last centuries due to the relative sea level rise [20]) and the more cemented and less erodible hydraulic concrete cast and set underwater during the Roman period (Figure 17 and Figure 18a,b).
According to Vitruvius and Lechtman et al. [55], the main characteristic of the pozzolanic hydraulic concrete is to harden in contact with sea water, due to its highly reactive aluminosilicate component (pumice and volcanic ash) that when mixed with lime generates reaction products (gels, rods, fibres and plates) that give strength and bind all the materials together [55].
The subaerial concrete layer here identified overlays the part of the pila made in hydraulic concrete—cast and set underwater—that is visible only in the deeper sectors where the subaerial concrete was totally eroded. These low flat areas of the pilaDTM can be interpreted as the top face of the hydraulic concrete hardly erodible by the wave’s action and then almost intact.
This interpretation was endorsed by the 3D visualisation of the photogrammetric point cloud in RGB colour (Figure 18a). The three areas in the N, NE and SE sectors, previously classified as sub-horizontal surfaces resting at a depth greater than −2.6 m, clearly appeared flat and lighter in colour with respect to the adjacent steep sectors.
The detection of the upper surface of the hydraulic concrete structure—well preserved at a depth of 2.6 m b.s.l. was the second important result of the large-scale analysis.
In fact, we propose a new type of measuring point (Figure 19), useful in the case of port-like structures built with the cofferdam technique: the limit between the areas in concrete cast and set underwater (hydraulic concrete) and the area in concrete totally laid in subaerial environment (subaerial concrete).
As described by Vitruvius in the famous De Architectura treaty in 15 BC, the cofferdams—filled with hydraulic concrete—emerged from the sea level by an amount equal to a wooden board (about 0.5 m). This amount can be used as indicative meaning—the elevation where the RSL indicator was formed or was built with respect to the palaeo-sea level including its uncertainty [45]. Ultimately, by correcting the submersion measurement of the upper limit of the hydraulic concrete with the indicative meaning value, the Roman sea level can be evaluated with a high precision (Figure 19).
In the case of Nisida Roman harbour, the submersion of hydraulic concrete limit at 2.6 m b.s.l. was corrected with respect to the aforesaid indicative meaning (0.5 m) obtaining a Roman sea level at −3.1 m (Figure 20). The uncertainty can be estimated in 0.2 m that is the mean tidal range for this coastal sector. Instead, the uncertainty due to the construction features of the port facilities, its conservation state and its emersion during the Roman period have been almost zeroed.
We can affirm that this new type of measuring point for ports-like structures built in hydraulic concrete allows for increasing the reliability of this kind of sea level marker.
The 3D point cloud interpolation (pilaDTM) provided another very interesting result, as the detection of several areas of interest by an archaeological point of view. In particular, five traces of the oaken stakes (catenae and destinae) composing the cofferdam were precisely mapped (Figure 21), four of which are vertical and one is horizontal.
The planar dimensions and the depth of each target were measured (Table 3), with centimetre precision.
The surveyed pila resulted with a well-preserved squared shape with the following dimension: 14.3 m on the N side; 14.4 m on the E side; 14.5 m on the W side; 14.8 m on the S side; 9.3 m of max height; and 7.1 m in height of the concrete structure.
A direct survey (Figure 22 and Figure 23) of a scuba diver validated the main indirect measurements and integrated the dataset with information on the vertical sides of the pila. On the W vertical side, an alignment of seven well-preserved catenae traces was detected at a depth of 3.1 m b.s.l. These shapes represent the highest line of catenae composing the cofferdam, so they are at a depth greater than the upper limit of the hydraulic concrete (see also Figure 20 and Figure 21) of about 0.6 m.
The vertical sides did not undergo significant erosive effects, preserving the facing in opus reticolatum up to the base of the structure at about 10 m b.s.l. In particular, the NW corner of the pila, the opus reticulatum is well preserved and clearly visible at the base due to the absence of algal vegetation. The cubilia composing the opus reticolatum are small cubes with sides of about 15 cm (Figure 23).

6. Discussion

The multiscale approach used in this research turned out to be very efficient to reconstruct the underwater archaeological and natural landscape as well as its evolution. The integration between acoustic and photogrammetric data allowed a morphometric analysis of the landscape characteristics as well as a precise mapping of the submerged archaeological structures that can be efficiently used as sea level markers.
The detection of past sea levels represents a challenge for the modern scientific community that studies the coastal changes due to relative sea level variations and the ongoing climate changes. The precise measurement of the height or depth of specific markers of former sea levels is the goal of this kind of studies. The concept “relative” includes both the eustatic sea level variations [56] and the vertical ground movements that have affected a specific area since the construction or formation of sea level markers [57,58,59].
These studies have a significant impact on both the understanding of coastal evolutive dynamics and the assessment of the ongoing climate changes effects. The main operative problem during the surveys finalised to detect and measure a relative sea level marker is to establish its indicative meaning [60,61]. The indicative meaning is the elevation on which the relative sea level (RSL) indicator was formed or was built with respect to the palaeo-sea level and includes an uncertainty.
The amount of the indicative meaning and its uncertainty are directly connected to the identification of a precise measuring point. In the case of the pilae, Auriemma and Solinas [47] proposed an indicative meaning range (or functional height in the specific case of an archaeological marker) between 0.6 and 1 m, depending on the measuring points identifiable on field (i.e., walkways, missing carpentry, or bollards and the mooring rings or stringcourses between building techniques and different coverings).
Thanks to the high-resolution surveys carried out on the remnant pilae of Nisida Roman harbour and the subsequent three-dimensional processing, a new type of measuring point—valid in the case of port-like structures built in hydraulic concrete cast and set underwater—is proposed. In addition, its indicative meaning correction was precisely established, according to Vitruvius, reducing the uncertainty.
The small-scale analysis applied to the geophysical data allowed a geomorphological characterisation of the seabed, useful to understand the landscape morphology when the Nisida Roman harbour was built during the first century BC. In the first instance, by interpolating the bathymetric data, the seabed morphology was reconstructed by detecting a less deep sub-horizontal sector on which the pilae were built at a depth about of 10 m b.s.l., and a steep slope sector at a depth greater than 10 m b.s.l.
This seabed was acoustically characterised by means of the backscattering signal analysis as a tufa substrate covered by a thin sediments layer. This landform was interpreted as an ancient abrasion platform cut in Nisida yellow tuff [21] used as a base to build the pilae composing the pier. It can be supposed that the hard substrate was not modified in the last 2000 years and—as the direct survey demonstrated—the external pila of the opus pilarum that made up the pier is still in its original position. Furthermore, the seabed morphology and the pila position with its base at a present depth between 9 and 10 m b.s.l., as well as the steep slope immediately off the pier, endorse the hypothesis that the Nisida harbour was used for the landing of cargo ships (according to Gianfrotta et al. [52]).
The large-scale analysis applied to the photogrammetric data allowed a precise evaluation of the pila conservation state as well as on its construction properties. Above all, it allowed to accurately measuring the palaeo- sea level during the Roman period. In fact, the morphometric analysis of the photogrammetric data led to the detection of the upper limit of the hydraulic concrete at a depth of 2.6 m b.s.l. By using this value as measuring point, the Roman sea level at −3.1 m at the time of the port construction can be deduced (Figure 20), endorsing the hypothesis that the Neapolitan coast was controlled by a subsiding trend in the last 2.0 ky [5,20,21,25,62].
The effects of this subsiding trend affecting the Neapolitan area were both the submersion of the maritime structures of Roman age, as the case of Nisida harbour (Figure 24), and a coastline retreat of several meters. However, the ancient abrasion platform here detected—cut in Nisida yellow tuff [21]—on which the archaeological structures lay, is more clear evidence of this retreating trend.
This coastal sector was also modified since 1800 AD by the intense anthropic activity, as testified by the construction of several infrastructures such as the Nisida wharf and the breakwater. These infrastructures have partially destroyed the Roman port facilities of which only the two pilae remain.
As demonstrated by the direct survey, the pilae composing the pier—coated with opus reticulatum—is still in place and in a good conservation state as shown by the various archaeological evidence here identified, such as the traces of catenae and destinae.
The large-scale elaboration also provided relevant information about the erosive effects due to the waves action—after the total submersion of the pila in the modern times—evaluating in at least 240 m3 of eroded material. On the other hand, we can affirm that the material mainly suffering the erosive effects is the concrete laid in the subaerial.
If the erosion effect was quantitatively evaluated by elaborating the z values of the point cloud, several qualitative evaluations were obtained by visualising the 3D point cloud of RGB colours. In particular, the sectors with the outcropping hydraulic concrete were bordered as shown in Figure 18a and Figure 21. Furthermore, the areas most covered by vegetation (light brown in Figure 18a) were identified. This information was very useful in the evaluation of eroded volume by using the slope analysis described in Section 5.2. In fact, the direct survey provided the precise measuring of the vegetation strata in the less eroded point (P) and, consequently, the measurement of the real submersion of the surveyed pila in P. This measurement was used to improve the evaluation of the eroded volume, as described in Section 5.2.
The RGB point cloud is also a three-dimensional documentation of this archaeological structure of considerable dimension (14 m × 15 m), hardly visible because submerged at least 2 m, but easily viewable with the software that manages the point clouds.
On the other hand, the high resolution of the 3D point cloud created a digital archive of this submerged archeo-site that represents a significant Roman harbour in the Gulf of Naples, which is little-known from historical sources. This kind of elaboration made possible the visualisation and presentation of all information in a user-friendly way. Furthermore, the processing of the point cloud made it possible to carry out a morphometric analysis of the archaeological structure that provided important information on both the construction features and the conservation state.

7. Concluding Remarks

This study—thanks to its multidisciplinary vocation—allowed carrying out a series of high-resolution analyses both on the characteristics of the natural and anthropic landscape and on its evolution. Furthermore, it provided a detailed reconstruction of the submerged remains of the Nisida Roman harbour, allowing the recording of a vast amount of four-dimensional—3D points and time—multi-source and multi-format information, with high accuracy.
Regarding operating procedures, the use of a USV during the indirect marine surveys resulted very efficiently to carry out an integrated survey inspired to the multi-modal mapping philosophy. The challenge was to integrate professional sensors, low-cost miniaturised sensors (i.e., gyroscopes, GPS, motion sensors, etc.) and innovative open hardware architecture (Arduino, Raspberry, etc.). Thanks to the excellent cost-performance ratio, this technology experimentation guaranteed a robust solution for the reconstruction of the high-definition archaeological landscape.
The integration of several instruments during the survey has reduced the time of the survey, but above all, has allowed the spatial overlay—through the GPS position—of all measurements deriving from both the acoustic and photogrammetric sensors. This feature made it possible to integrate morphometric analysis with geo-environmental qualitative assessments.
In conclusion, the multiscale approach here proposed to elaborate a transdisciplinary dataset turned out to be very efficient to obtain:
  • the qualitative and quantitative characterisation of the underwater landscape in an archaeo-site with submerged structures;
  • the morphometric analysis of an archaeological structure with a consequent assessment of its conservation state;
  • the detailed four-dimensional documentation of a submerged archaeo-site difficult to access; and
  • the definition of a new type of measuring point for a more precise evaluation of the relative sea level variation—in the last 2000 years—in the case of port-like structures built with the cofferdam technique in hydraulic concrete.

Author Contributions

Conceptualisation, G.M., S.T., P.P.C.A., G.P., F.P. and M.S.; methodology, G.M., S.T., and F.P.; investigation, G.M., F.P., and M.S.; software G.M., F.P. and S.T.; data curation, G.M., S.T., and F.P.; writing—original draft preparation, G.M. and M.S.; writing—review and editing, S.T., P.P.C.A., and G.P.; and visualisation, G.M., F.P. and S.T.

Funding

This research received no external funding.

Acknowledgments

This paper is in memory of Professor Raffaele Santamaria, the first to believe in the MicroVeGA project. The authors sincerely thank Alberto Greco, Ferdinando Sposito, Luigi De Luca and Alberto Giordano for their precious support during the marine surveys. Sincere thanks are also due to the 2nd Nucleo Operatori Subacquei of Coast Guard of Naples for the highly specialised support during all phases of the direct and indirect marine surveys. The Ministry of the Environment kindly provided the coastal LIDAR data used in this paper. The authors finally thanks the two anonymous reviewers for their critical reviews which greatly improved the manuscript.

Conflicts of Interest

The authors declare no conflict of interest. The funders had no role in the design of the study; in the collection, analyses, or interpretation of data; in the writing of the manuscript, or in the decision to publish the results.

References

  1. Goiran, J.-P.; Morhange, C. Geoarcheology of ancient Mediterranean harbours: Issues and case studies. Eng. Transl. E Willcox Topoï 2001, 11, 647–669. [Google Scholar]
  2. Parry, M.L.; Canziani, O.F.; Palutikof, J.P.; van der Linden, P.J.; Hanson, C.E. Climate change 2007: Impacts, adaptation, and vulnerability. In Contributions of Working Group II to the Fourth Assessment Report of the Intergovernmental Panel on Climate Change; Cambridge University Press: Cambridge, UK, 2007. [Google Scholar]
  3. Solomon, S.; Qin, D.; Manning, M.; Chen, Z.; Marquis, M.; Averyt, K.B.; Tignor, M.; Miller, H.L. Climate change 2007: The physical science basis. In Contributions of Working Group I to the Fourth Assessment Report of the Intergovernmental Panel on Climate Change; Cambridge University Press: Cambridge, UK, 2007. [Google Scholar]
  4. Amato, V.; Aucelli, P.P.C.; Mattei, G.; Pennetta, M.; Rizzo, A.; Rosskopf, C.M.; Schiattarella, M. A geodatabase of Late Pleistocene-Holocene palaeo sea-level markers in the Gulf of Naples. Alpine Mediterr. Quat. 2018, 31, 5–9. [Google Scholar]
  5. Aucelli, P.P.C.; Cinque, A.; Mattei, G.; Pappone, G. Late Holocene landscape evolution of the gulf of Naples (Italy) inferred from geoarchaeological data. J. Maps 2017, 13, 300–310. [Google Scholar] [CrossRef]
  6. Aucelli, P.P.C.; Cinque, A.; Mattei, G.; Pappone, G. Historical sea level changes and effects on the coasts of Sorrento Peninsula (Gulf of Naples): New constrains from recent geoarchaeological investigations. Palaeo3 2016, 463, 112–125. [Google Scholar] [CrossRef]
  7. Aucelli, P.P.C.; Cinque, A.; Giordano, F.; Mattei, G. A geoarchaeological survey of the marine extension of the Roman archaeological site Villa del Pezzolo, Vico Equense, on the Sorrento Peninsula, Italy. Geoarchaeology 2016, 31, 244–252. [Google Scholar] [CrossRef]
  8. McNamee, C.; Cyr, H.; Wilson, L. Multi-Scalar Approaches to Geoarchaeological Questions. Geoarchaeology 2013, 28, 191–194. [Google Scholar] [CrossRef]
  9. Wynn, R.B.; Huvenne, V.A.; Le Bas, T.P.; Murton, B.J.; Connelly, D.P.; Bett, B.J.; Sumner, E.J. Autonomous Underwater Vehicles (AUVs): Their past, present and future contributions to the advancement of marine geoscience. Mar. Geol. 2014, 352, 451–468. [Google Scholar] [CrossRef] [Green Version]
  10. Yoerger, D.R.; Bradley, A.M.; Jakuba, M.; German, C.R.; Shank, T.; Tivey, M. Autonomous and remotely operated vehicle technology for hydrothermal vent discovery, exploration, and sampling. Oceanography 2007, 20, 152–161. [Google Scholar] [CrossRef]
  11. German, C.R.; Yoerger, D.R.; Jakuba, M.; Shank, T.M.; Langmuir, C.H.; Nakamura, K. Hydrothermal exploration with the Autonomous Benthic Explorer. Deep Sea Res. I 2008, 55, 203–219. [Google Scholar] [CrossRef]
  12. Giordano, F.; Mattei, G.; Parente, C.; Peluso, F.; Santamaria, R. MicroVeGA (micro vessel for geodetics application): A marine drone for the acquisition of bathymetric data for GIS applications. The international archives of photogrammetry. Remote Sens. Spat. Inf. Sci. 2015, 40, 123–130. [Google Scholar]
  13. Giordano, F.; Mattei, G.; Parente, C.; Peluso, F.; Santamaria, R. Integrating sensors into a marine drone for bathymetric 3D surveys in shallow waters. Sensors 2016, 16, 41. [Google Scholar] [CrossRef] [PubMed]
  14. Eric, M.; Berginc, G.; Pugelj, M.; Stopinšek, Z.; Solina, F. The impact of the latest 3D technologies on the documentation of underwater heritage sites. In Proceedings of the Digital Heritage International Congress (DigitalHeritage), Marseille, France, 28 October–1 November 2013; Volume 2, pp. 281–288. [Google Scholar]
  15. Remondino, F.; Rizzi, A. Reality-based 3D documentation of natural and cultural heritage sites—Techniques, problems, and examples. Appl. Geomat. 2010, 2, 85–100. [Google Scholar] [CrossRef]
  16. Yastikli, N. Documentation of cultural heritage using digital photogrammetry and laser scanning. J. Cult. Herit. 2007, 8, 423–427. [Google Scholar] [CrossRef]
  17. Troisi, S.; Baiocchi, V.; Del Pizzo, S.; Giannone, F. A prompt methodology to georeference complex hypogea environments. Int. Arch. Photogramm. Remote Sens. Spat. Inf. Sci. 2017, 42, 639–644. [Google Scholar] [CrossRef]
  18. Troisi, S.; Del Pizzo, S.; Gaglione, S.; Miccio, A.; Testa, R.L. 3D models comparison of complex shell in underwater and dry environments. Int. Arch. Photogramm. Remote Sens. Spat. Inf. Sci. 2015, 40, 215–222. [Google Scholar] [CrossRef]
  19. Drap, P. Underwater Photogrammetry for archaeology. In Special Applications of Photogrammetry; Da Silva, D.D., Ed.; InTech Open: London, UK, 2012; pp. 112–135. [Google Scholar]
  20. Aucelli, P.; Cinque, A.; Mattei, G.; Pappone, G.; Rizzo, A. Studying relative sea level change and correlative adaptation of coastal structures on submerged Roman time ruins nearby Naples (southern Italy). Quat. Int. 2017. [Google Scholar] [CrossRef]
  21. Aucelli, P.P.C.; Cinque, A.; Mattei, G.; Pappone, G.; Stefanile, M. Coastal landscape evolution of Naples (Southern Italy) since the Roman period from archaeological and geomorphological data at Palazzo degli Spiriti site. Quat. Int. 2018, 483, 23–38. [Google Scholar] [CrossRef]
  22. Aucelli, P.P.C.; Cinque, A.; Mattei, G.; Pappone, G.; Stefanile, M. First results on the coastal changes related to local sea level variations along the Puteoli sector (Campi Flegrei, Italy) during the historical times. Alpine Mediterr. Quat. 2018, 31, 13–16. [Google Scholar]
  23. Cinque, A.; Aucelli, P.P.C.; Brancaccio, L.; Mele, R.; Milia, A.; Robustelli, G.; Romano, P.; Russo, F.; Russo, M.; Santangelo, N.; et al. Volcanism, tectonics and recent geomorphological change in the Bay of Napoli. Suppl. Geogr. Fis. Din. Quat. 1997, 3, 123–141. [Google Scholar]
  24. Fedele, L.; Morra, V.; Perrotta, A.; Scarpati, C.; Putignano, M.L.; Orrù, P.; Schiattarella, M.; Aiello, G.; D’Argenio, B.; Conforti, A. Note Illustrative Della Carta Geologica D’Italia Alla Scala 1:50.000, Foglio 465 Isola di Procida; Istituto Superiore per la Protezione e Ricerca Ambientale: Rome, Italy, 2015. [Google Scholar]
  25. Giordano, F.; Mattei, G.; Milia, A.; Torrente, M. Quaternary faulting off Ischia island (Italy): Preliminary results. Rend. Online Della Soc. Geol. Ital. 2013, 29, 74–77. [Google Scholar]
  26. Milia, A.; Torrente, M.M.; Russo, M.; Zuppetta, A. Tectonics and crustal structure of the Campania continental margin: Relationships with volcanism. Mineral. Petrol. 2003, 79, 33–47. [Google Scholar] [CrossRef]
  27. Di Vito, M.A.; Acocella, V.; Aiello, G.; Barra, D.; Battaglia, M.; Carandente, A.; Del Gaudio, C.; de Vita, S.; Ricciardi, G.P.; Ricco, C.; et al. Magma transfer at Campi Flegrei caldera (Italy) before the 1538 AD eruption. Sci. Rep. 2016, 6, 32245. [Google Scholar] [CrossRef] [PubMed] [Green Version]
  28. Santacroce, R.; Cioni, R.; Marianelli, P.; Sbrana, A.; Sulpizio, R.; Zanchetta, G.; Joron, J.L. Age and whole rock–glass compositions of proximal pyroclastics from the major explosive eruptions of Somma-Vesuvius: A review as a tool for distal tephrostratigraphy. J. Volcanol. Geotherm. Res. 2008, 177, 1–18. [Google Scholar] [CrossRef]
  29. Milia, A.; Torrente, M.M. The influence of paleogeographic setting and crustal subsidence on the architecture of ignimbrites in the Gulf of Naples (Italy). Earth Planet. Sci. Lett. 2007, 263, 192–206. [Google Scholar] [CrossRef]
  30. Corrado, G.; Amodio, S.; Aucelli, P.P.C.; Etro Incontri, P.; Pappone, G.; Schiattarella, M. Late Quaternary Geology and morphoevolution of the Volturno Coastal Plain, Southern Italy. Alpine Mediterr. Quat. 2018, 31, 23–26. [Google Scholar]
  31. Cinque, A.; Irollo, G.; Romano, P.; Ruello, M.R.; Amato, L.; Giampaola, D. Ground movements and sea level changes in urban areas: 5000 years of geological and archaeological record from Naples (Southern Italy). Quat. Int. 2011, 232, 45–55. [Google Scholar] [CrossRef]
  32. Strabone. Geographica, V Book, 23 AD; Loeb Classical Library Edition; Harvard University Press: Cambridge, MA, USA, 1923. [Google Scholar]
  33. Felici, E. La ricerca sui porti romani in cementizio: Metodi e obiettivi’, in Archeologia subacquea—Come opera l’archeologo sott’acqua. Storie dalle acque. In VIII Ciclo di Lezioni Sulla Ricerca Applicata in Archeologi; Volpe, G., Ed.; All’Insegna del Giglio: Firenze, Itlay, 1998; pp. 275–340. [Google Scholar]
  34. Felici, E. Costruire nell’acqua: I porti antichi. In Lezioni Fabio Faccenna, Conferenze di Archeologia Subacquea; Giacobelli, M., Ed.; Edipuglia: Bari, Italy, 2001; pp. 161–178. [Google Scholar]
  35. Felici, E. Ricerche sulle tecniche costruttive dei porti romani. J. Anc. Topogr. 2006, 16, 59–84. [Google Scholar]
  36. Stefanile, M. The Project PILAE, For an Inventory of the Submerged Roman Piers. A Preliminary Overview. Int. J. Environ. Geoinform. 2015, 2, 34–39. [Google Scholar] [CrossRef] [Green Version]
  37. Oleson, J.P.; Brandon, C.; Cramer, S.M.; Cucitore, R.; Gotti, E.; Hohlfelder, R.L. The ROMACONS Project: A Contribution to the Historican and Engineering Analysis of the Hydrauilc Concrete in Roman Maritime Structures. Int. J. Naut. Archaeol. 2004, 33, 199–229. [Google Scholar] [CrossRef]
  38. Hohlfelder, R.L.; Oleson, J.P.; Brandon, C. Building a Roman pila in the sea—Experimental Archaeology of Brindisi, Italy September 2004. Int. J. Naut. Archaeol. 2005, 34, 124–129. [Google Scholar]
  39. Brandon, C.J.; Hohlfelder, R.L.; Oleson, J.P. The concrete construction of the Roman harbours of Baiae and Portus Iulius, Italy: The ROMACONS 2006 field season. Int. J. Naut. Archaeol. 2008, 37, 374–379. [Google Scholar] [CrossRef]
  40. Gazda, E.K. Cosa’s Contribution to the Study of Roman Hydraulic Concrete: An Historiographic Commentary. In Classical Studies in Honor of Cleo Rickman Fitch; Goldman, N.W., Ed.; Peter Lang Pub Inc.: New York, NY, USA, 2001; pp. 145–177. [Google Scholar]
  41. Oleson, J.P.; Bottalico, L.; Brandon, C.; Cucitore, R.; Gotti, E.; Hohlfelder, R.L. Reproducing a Roman Maritime Structure with Vitruvian pozzolanic concrete. J. Roman Archaeol. 2006, 19, 31–52. [Google Scholar] [CrossRef]
  42. Painter, K. Roman Flasks with Scenes from Baiae and Puteoli. J. Glass Stud. 1975, 17, 54–67. [Google Scholar]
  43. Blackmann, D.J. Ancient Harbours in the Mediterranean, Part 1. Int. J. Naut. Archaeol. 1982, 11, 79–104. [Google Scholar] [CrossRef]
  44. Bejarano Osorio, M.A. Una ampolla de vidrio decorada con la planta topográfica de la ciudad de Puteoli. Mérida Excav. Arqueol. 2002, 8, 513–532. [Google Scholar]
  45. Benjamin, J.; Rovere, A.; Fontana, A.; Furlani, S.; Vacchi, M.; Inglis, R.H.; Mourtzas, N. Late Quaternary sea-level changes and early human societies in the central and eastern Mediterranean Basin: An interdisciplinary review. Quat. Int. 2017, 449, 29–57. [Google Scholar] [CrossRef]
  46. Lambeck, K.; Anzidei, M.; Antonioli, F.; Benini, A.; Esposito, A. Sea level in Roman time in the Central Mediterranean and implications for recent change. Earth Planet. Sci. Lett. 2004, 224, 563–575. [Google Scholar] [CrossRef]
  47. Auriemma, R.; Solinas, E. Archaeological remains as sea-level change markers: A review. Quat. Int. 2009, 206, 134–146. [Google Scholar] [CrossRef]
  48. Morhange, C.; Marriner, N. Archaeological and biological relative sea-level indicators. In Handbook of Sea Level Research; Shennan, I., Long, A., Horton, B.P., Eds.; Wiley: Oxford, UK, 2017; pp. 146–156. [Google Scholar]
  49. Severino, N. Recenti ricerche archeologiche sull’isola di Nisida. Orizz. Rass. Archeol. 2005, 6, 119–133. [Google Scholar]
  50. D’Arms, J. Romans on the Bay of Naples: A Social and Cultural Study of the Villas and Their Owners from 150 B.C. to A.D. 400; Harvard University Press: Cambridge, MA, USA, 1970. [Google Scholar]
  51. Gunther, R.T. Pausilypon, the Imperial Villa near Naples; Hart, H., Ed.; Oxford University Press: Oxford, UK, 1913. [Google Scholar]
  52. Gianfrotta, P.A. I porti dell’area flegrea. In Porti, Approdi e Rotte nel Mediterraneo Antico; Laudizi, G., Marangio, C., Eds.; Studi di Filologia e Letteratura 4: Galatina, Italy, 1998; pp. 155–168. [Google Scholar]
  53. Mattei, G.; Giordano, F. Integrated geophysical research of Bourbonic shipwrecks sunk in the Gulf of Naples in 1799. J. Archaeol. Sci. 2015, 1, 64–72. [Google Scholar] [CrossRef]
  54. Menna, F.; Nocerino, E.; Troisi, S.; Remondino, F. Joint alignment of underwater and above-the-water photogrammetric 3D models by independent models adjustment. Int. Arch. Photogramm. Remote Sens. Spat. Inf. Sci. 2015, 40, 143–151. [Google Scholar] [CrossRef]
  55. Lechtman, H.N.; Hobbs, L.W. Roman concrete and the Roman architectural revolution. Ceram. Civiliz. 1987, 3, 81–128. [Google Scholar]
  56. Lambeck, K.; Antonioli, F.; Anzidei, M.; Ferranti, L.; Leoni, G.; Scicchitano, G.; Silenzi, S. Sea level change along the Italian coast during the Holocene and projections for the future. Quat. Int. 2011, 232, 250–257. [Google Scholar] [CrossRef]
  57. Antonioli, F.; Ferranti, L.; Fontana, A.; Amorosi, A.; Bondesan, A.; Braitenberg, C.; Dutton, A.; Fontolan, G.; Furlani, S.; Lambeck, K.; et al. Holocene relative sea-level changes and vertical movements along the Italian and Istrian coastlines. Quat. Int. 2009, 221, 37–51. [Google Scholar] [CrossRef]
  58. Rovere, A.; Stocchi, P.; Vacchi, M. Eustatic and relative sea-level changes. Curr. Clim. Chang. Rep. 2016, 2, 221–231. [Google Scholar] [CrossRef]
  59. Vacchi, M.; Marriner, N.; Morhange, C.; Spada, G.; Fontana, A.; Rovere, A. Multiproxy assessment of Holocene relative sea-level changes in the western Mediterranean: Sea-level variability and improvements in the definition of the isostatic signal. Earth Sci. Rev. 2016, 155, 172–197. [Google Scholar] [CrossRef]
  60. Shennan, I.; Long, A.J.; Horton, B.P. (Eds.) Handbook of Sea-level Research; John Wiley & Sons: Oxford, UK, 2015; pp. 1–581. [Google Scholar]
  61. Van de Plassche, O. (Ed.) Sea-Level Research: A Manual for the Collection and Evaluation of Data; GeoBooks, Galliard (Printers) Ltd: Great Yarmouth, UK, 1986; pp. 1–603. [Google Scholar]
  62. Romano, P.; Di Vito, M.A.; Giampaola, D.; Cinque, A.; Bartoli, C.; Boenzi, G.; Detta, F.; Di Marco, M.; Giglio, M.; Iodice, S.; et al. Intersection of exogenous, endogenous and anthropogenic factors in the Holocene landscape: A study of the Naples coastline during the last 6000 years. Quat. Int. 2013, 303, 107–119. [Google Scholar] [CrossRef]
Figure 1. Location map of Nisida Roman harbour with the submerged archaeological structures in red. The shaded relief (altitude 45°, azimuth 315°) in figure derives from a DTM with a spatial grid 2 m × 2 m. The Ministry of the Environment kindly provided the Lidar data used to calculate the DTM.
Water 10 01686 g001
Figure 2. Vitruvius’ cofferdam for hydraulic concrete. Reconstruction (after [39]).
Water 10 01686 g002
Figure 3. (a) Pictorial view of Nisida harbour in 1635 by B. Picchiatti where the Roman opus pilarum is clearly visible; (b) historical map “PIANTA DEL PORTO DI NISITA” 1838, where the pilae are still intact and emerged; and (c) present-day aerial photo.
Water 10 01686 g003
Figure 4. Direct and indirect marine surveys: (a) sensors installation on MicroVeGA; (b) Semi-submerged Roman gallery; (c) topographic survey of a GCP; (d) initial operations of the marine survey; (e) MicroVeGA in action; and (f) initial operations of the topographic survey.
Water 10 01686 g004aWater 10 01686 g004b
Figure 5. (a) Nisida aerial photo with a location map of the study area; and (b) navigation grids of morpho-bathymetric and photogrammetric surveys.
Water 10 01686 g005aWater 10 01686 g005b
Figure 6. Photos of the underwater archaeological structure by MicroVeGA.
Water 10 01686 g006
Figure 7. Dimensions (cm) of MicroVeGA catamaran.
Water 10 01686 g007
Figure 8. The photogrammetric system installed on board of MicroVeGA.
Water 10 01686 g008
Figure 9. Sketches of ground ranges of acoustical and photogrammetric sensors (figure not in scale): (a) 3D reconstruction of the beam opening of the three sensors; and (b) 2D reconstruction of the beam opening of the three sensors. R1 is 0.139H1 (with an opening angle of the acoustic beam of 8°); R2 is 1.87H2 + b (where b is the stereoscopic base); and R3 can be set with the SSS software (Starfish Scanline V2.1) and varies between 4 and 300 m.
Water 10 01686 g009
Figure 10. Block diagram of the platform management system (PMS).
Water 10 01686 g010
Figure 11. Acoustic system for the draught measuring.
Water 10 01686 g011
Figure 12. (a) 2D view of DTM of Nisida coastal archaeological site; and (b) 3D view of DTM of Nisida coastal archaeological site.
Water 10 01686 g012
Figure 13. Backscattering signal chart of a sweep passing through the archaeological structures with the amplitude of the acoustic signal expressed in grey scale.
Water 10 01686 g013
Figure 14. SSS map of the study area, with a seabed characterisation and the location of the archaeological structures.
Water 10 01686 g014
Figure 15. Three-dimensional reconstruction of the archaeological remains obtained by interpolating photogrammetric data.
Water 10 01686 g015
Figure 16. Slope analysis of pilaDTM to evaluate the more eroded areas.
Water 10 01686 g016
Figure 17. Sketch of the pila with the concrete layer before its erosion and the limit between subaerial and hydraulic concrete.
Water 10 01686 g017
Figure 18. 3D point cloud with the perimeter of the outcropping areas in hydraulic concrete (light-dark dashed line). (a) Cloud point visualisation by using Cloud Compare software; and (b) pilaDTM visualisation by using the ArcScene software.
Water 10 01686 g018aWater 10 01686 g018b
Figure 19. Sketch of the new type of measuring point useful in the case of port-like structures built in hydraulic concrete.
Water 10 01686 g019
Figure 20. Sketch of the surveyed pila with the main construction features detected during the surveys and with the Roman sea level position here deduced.
Water 10 01686 g020
Figure 21. Three-dimensional reconstruction of the upper surface of the more preserved pila (pilaDTM) with the traces of the oaken stakes (catenae and destinae) composing the cofferdam (light-dark dashed line).
Water 10 01686 g021
Figure 22. Underwater photo taken during the direct survey.
Water 10 01686 g022
Figure 23. Underwater photo taken during the direct survey.
Water 10 01686 g023
Figure 24. Roman sea level position and pictorial reconstruction of the Nisida opus pilarum. The surveyed pila is drawn in continuous black line. The structures drawn in dashed line were reconstructed from the historical maps in Figure 3.
Water 10 01686 g024
Table 1. General characteristics of MicroVeGA drone.
MicroVEGAGeneral Characteristics
Length1.35 m
Beam0.86 m
Height0.60 m
Empty weight16 Kg
Max weight32 Kg
Speed Max/Cruise1/0.5 m/s
Endurance2 h at Speed Max
Standard SensorsGPS, IMU, Compass
PayloadSBES, SSS, CAM 3D
Propulsion2 × brushless thruster 100 W
CommunicationsWiFi 5 GHz
SoftwareTritech StarFish and TrackStar
Operative SystemWindows, Linux and C++
Power12 V × 35 Ah
Table 2. Table of slope classes used to classify the morphology of the pila upper face and to detect the eroded sectors.
ClassesSlope %TypeArea (m2)Area (%)
10–10Gentle slope10.34.6
210–20Moderate slope23.610.6
320–30Steep slope26.912.1
4>30Very steep slope161.572.6
Table 3. Table of the planar dimensions of the wooden board traces on the top face of the pila.
IDDIMENSION (m)DEPTH (m)Type
D10.3 × 0.4−2.4Destina
D20.4 × 0.3−2.3Destina
D30.4 × 0.6−2.4Destina
D40.5 × 0.3−2.5Destina
C113.9 × 0.5−2.9Catena

