
Comparing the Clinical and Economic Outcomes Associated with Adjuvanted versus High-Dose Trivalent Influenza Vaccine among Adults Aged ≥ 65 Years in the US during the 2019–20 Influenza Season—A Retrospective Cohort Analysis

 ,
,
Abstract
:1. Introduction
2. Methods
2.1. Study Design
2.2. Data Sources
2.3. Study Population
2.4. Study Measures
2.4.1. Patient Characteristics
2.4.2. Outcome Assessment
2.4.3. Clinical Outcomes
2.4.4. Economic Outcomes
2.5. Statistical Analyses
2.6. Sub-Group and Sensitivity Analysis
3. Results
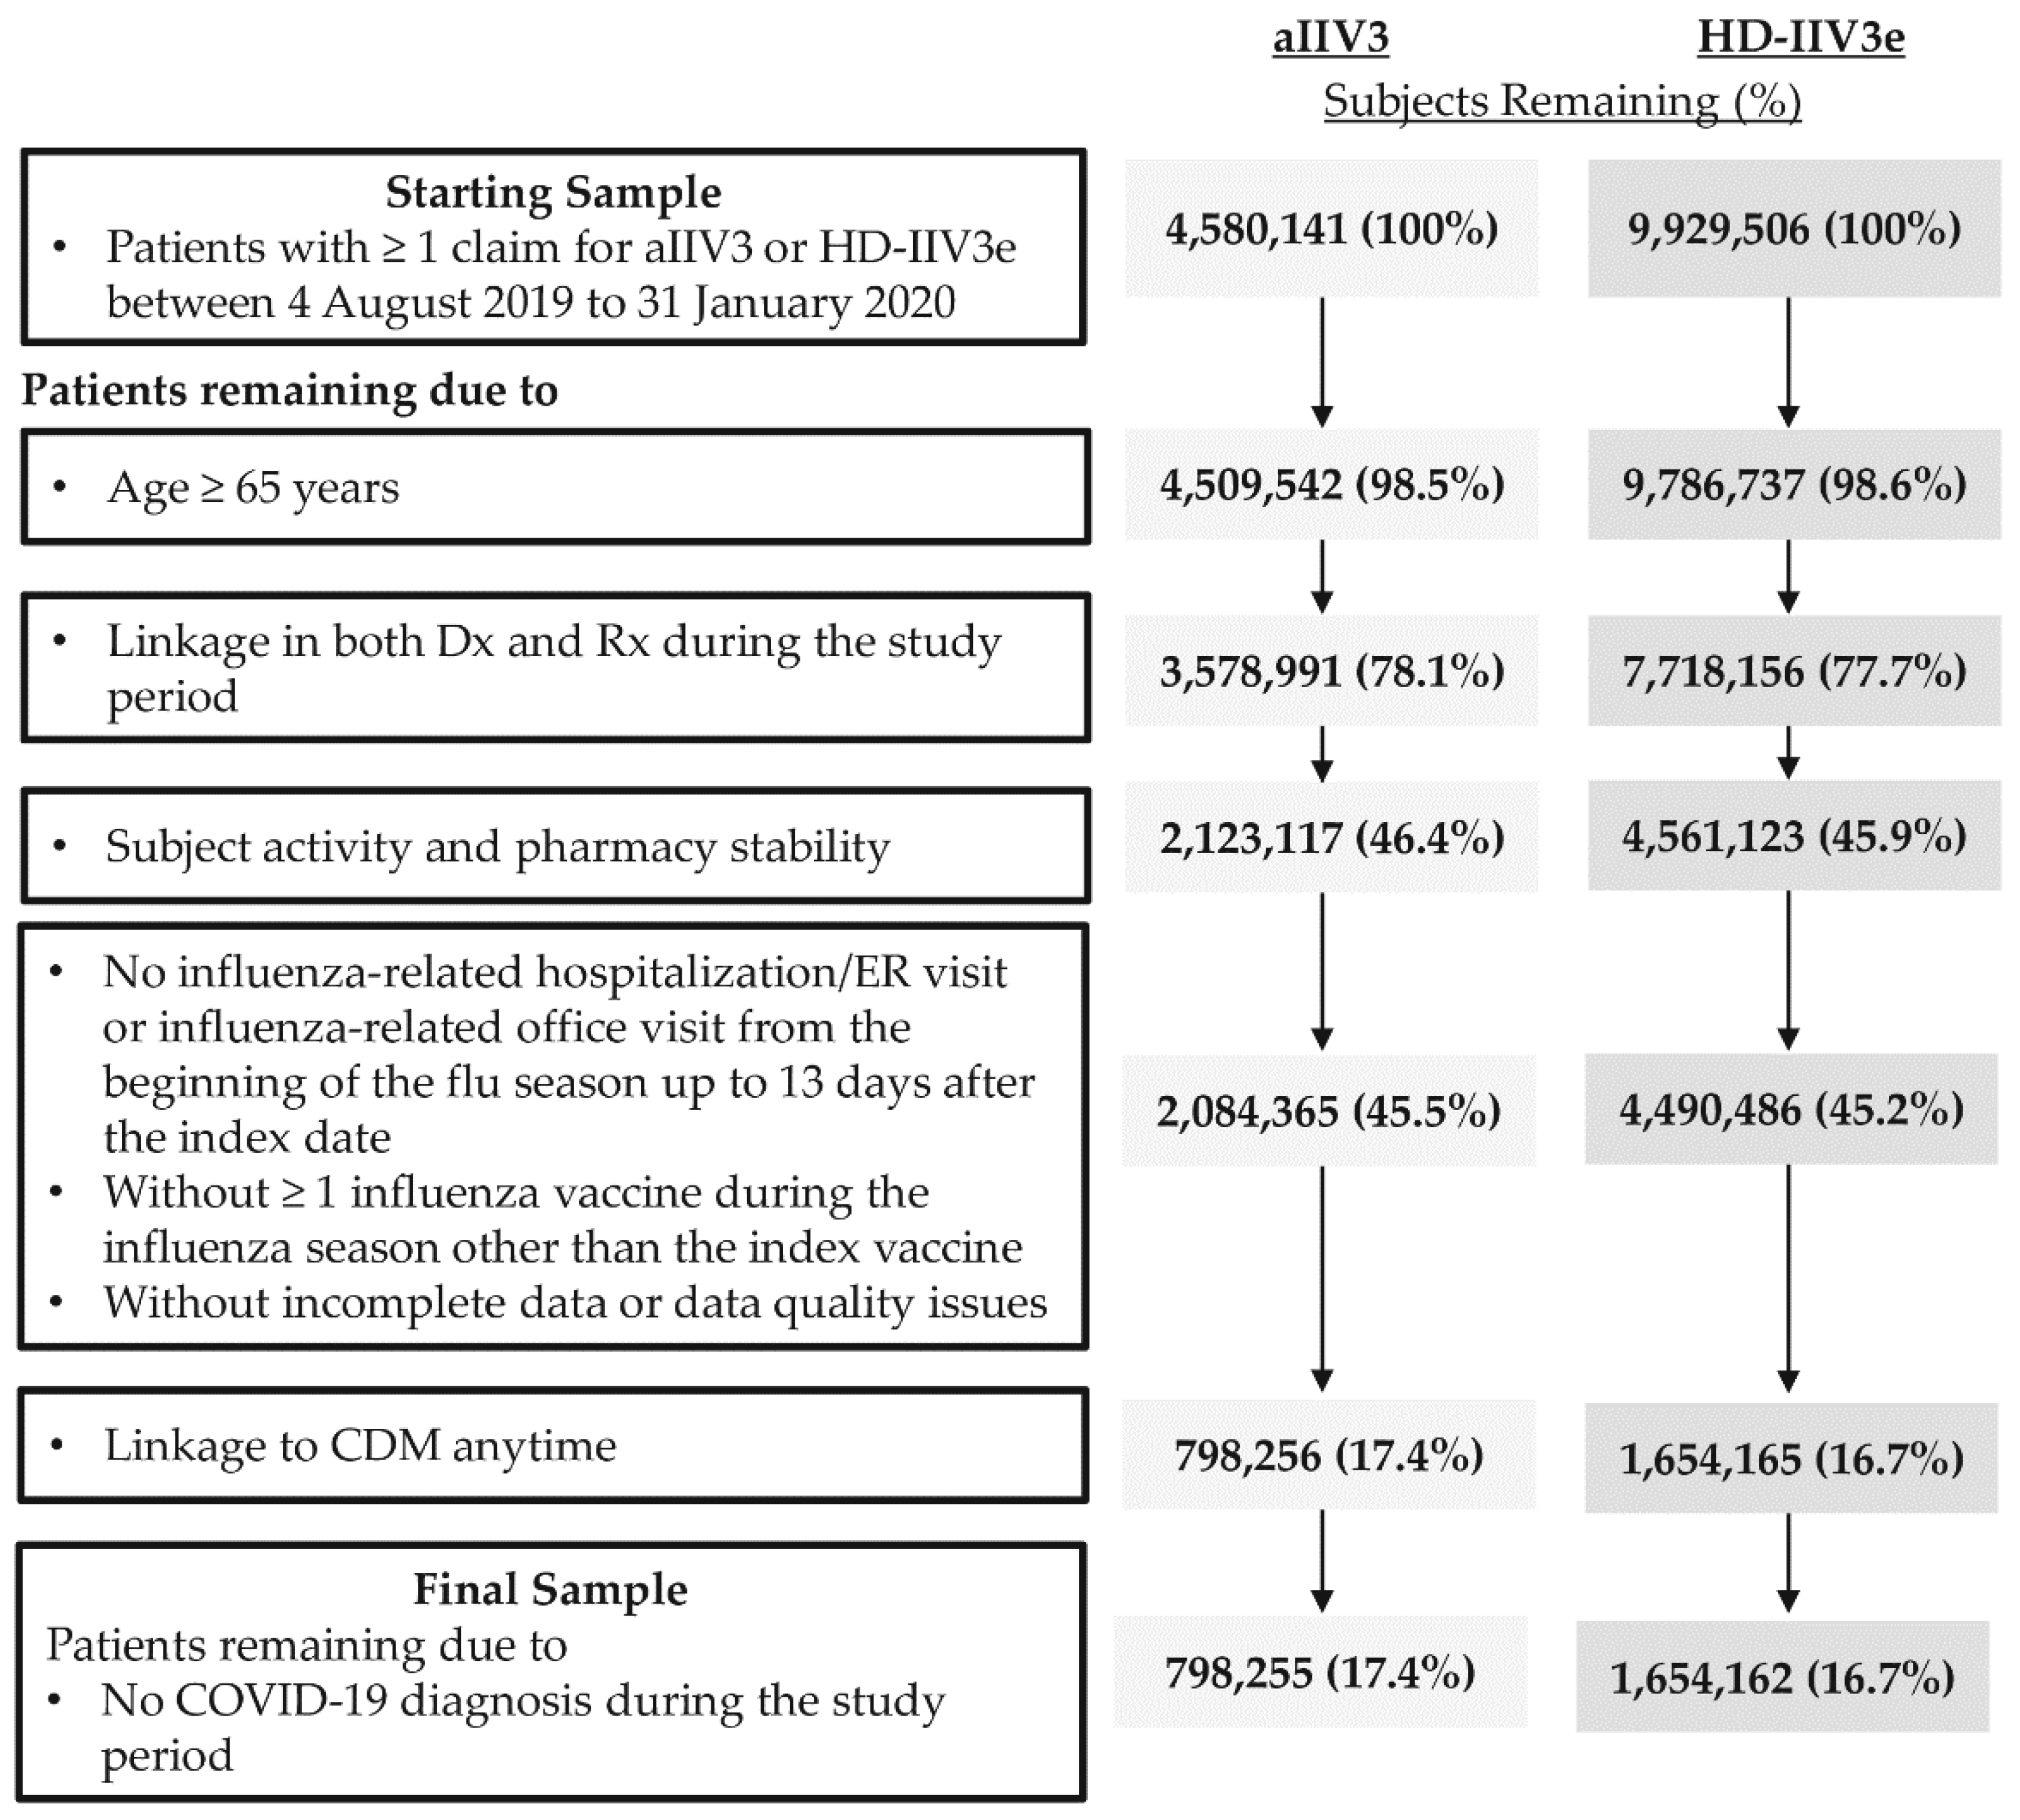
3.1. Study Sample
3.2. Patient Characteristics
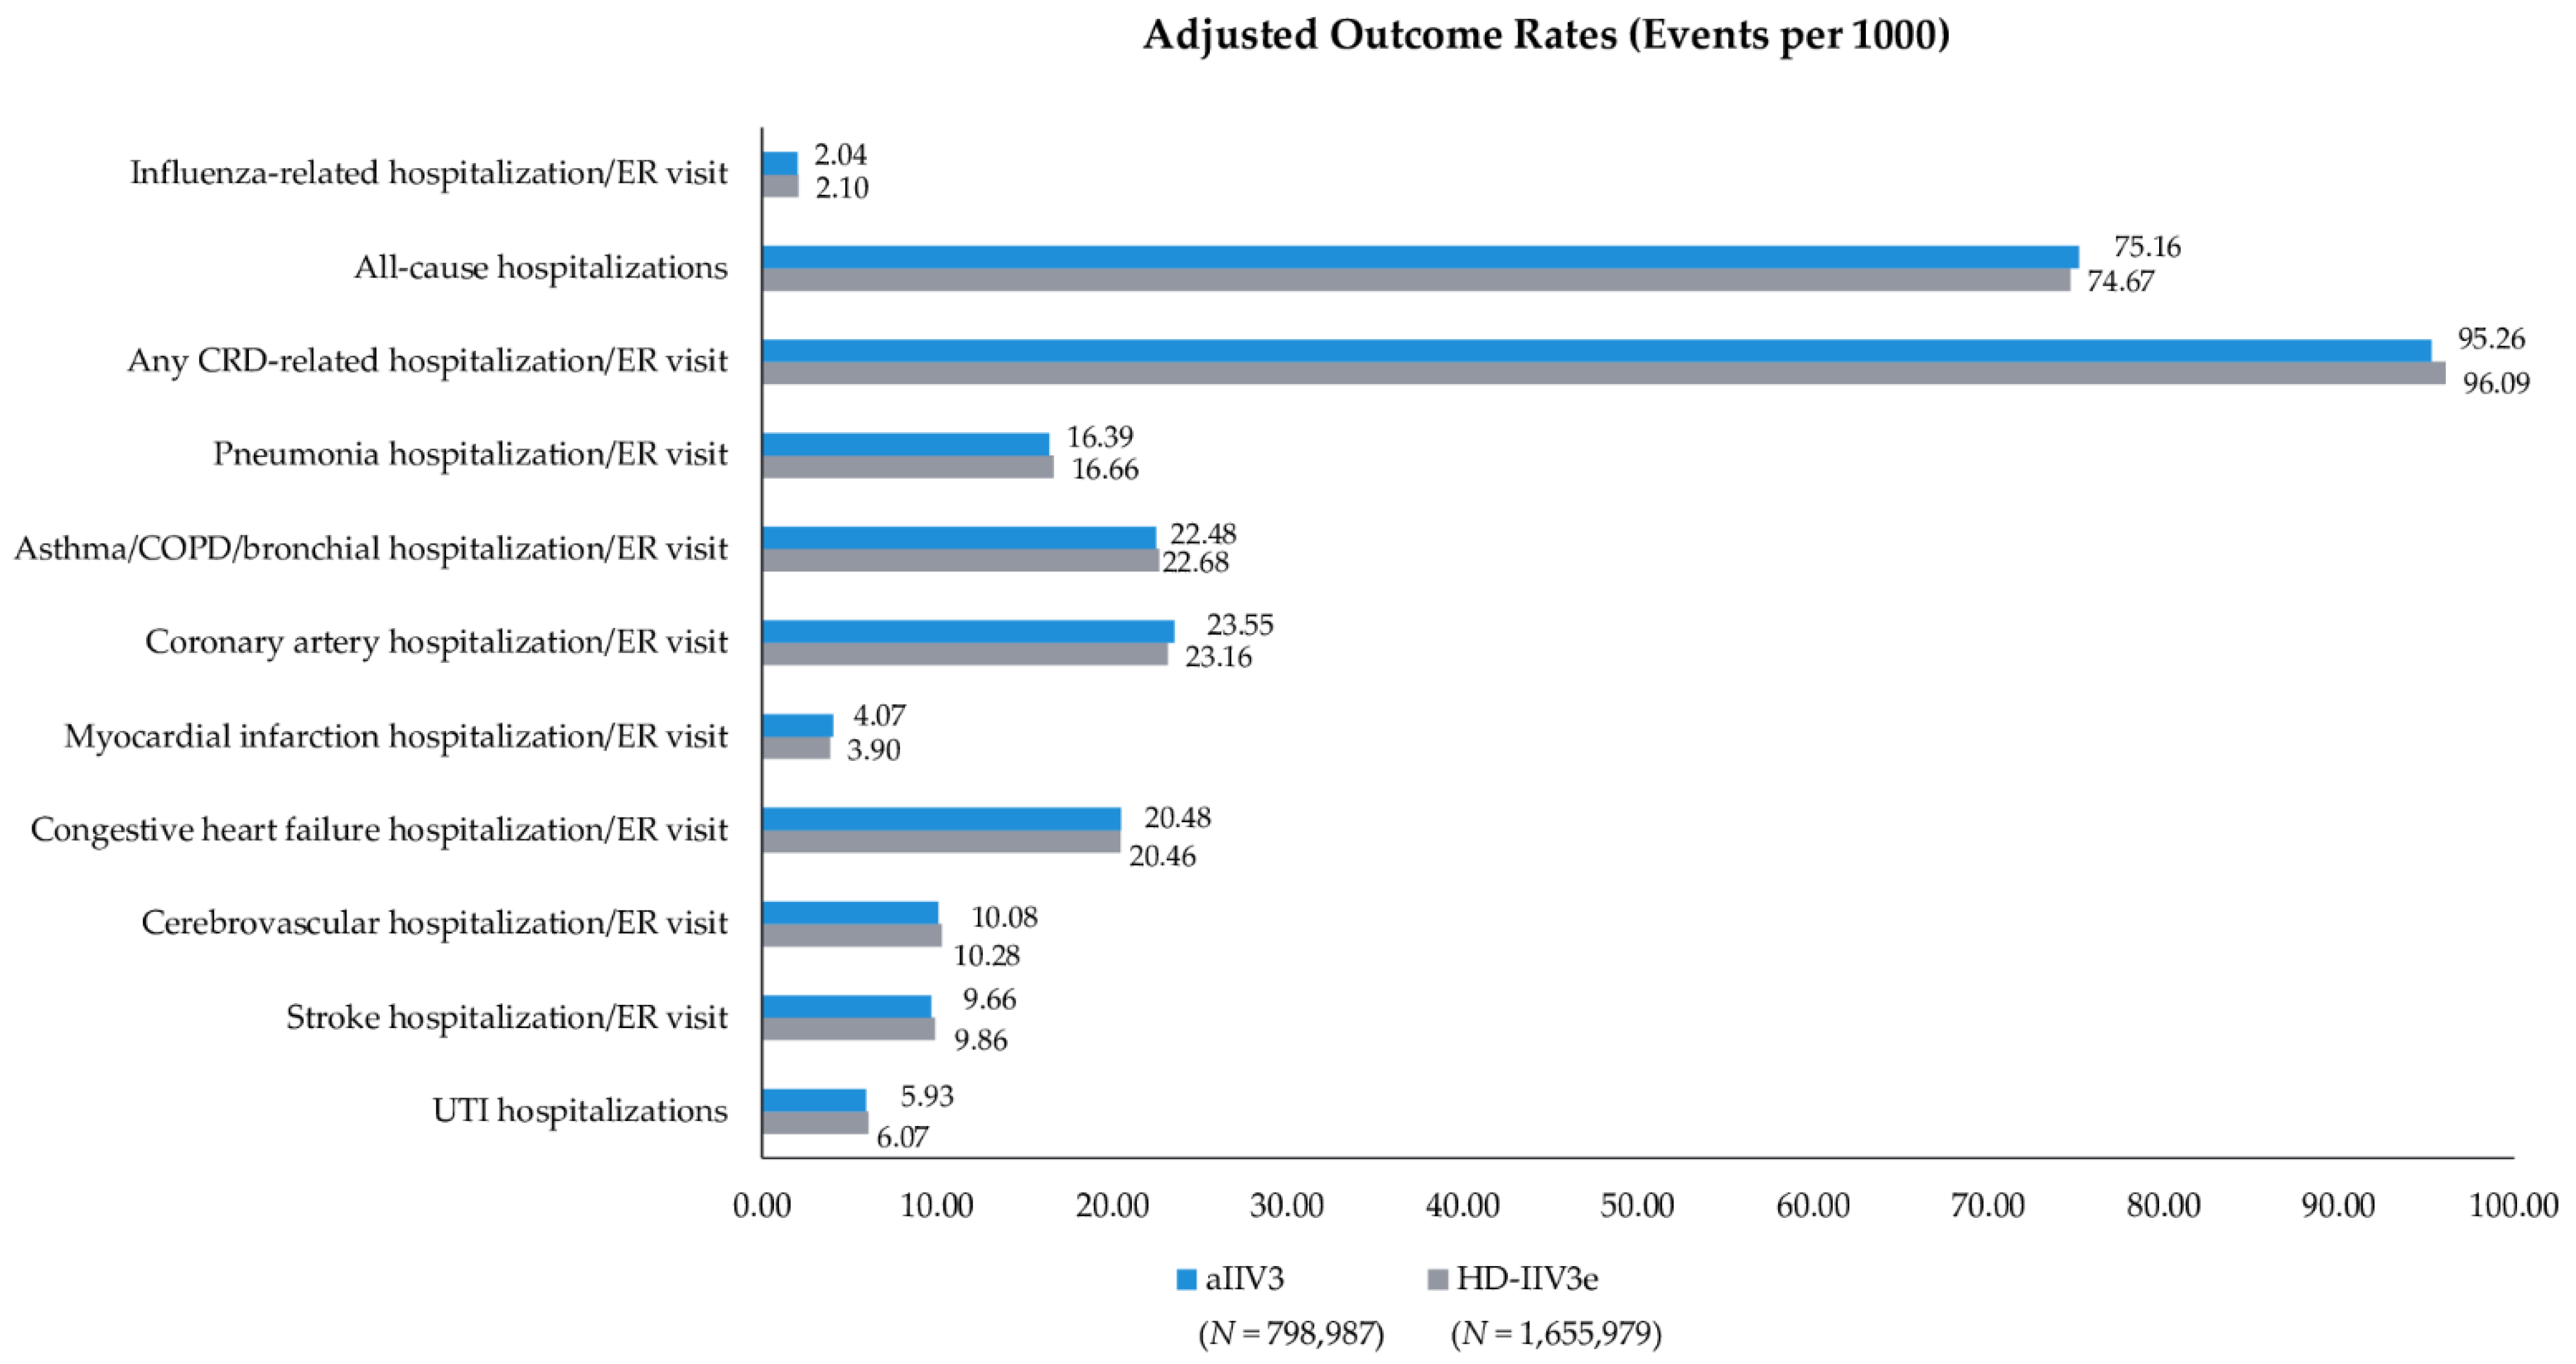
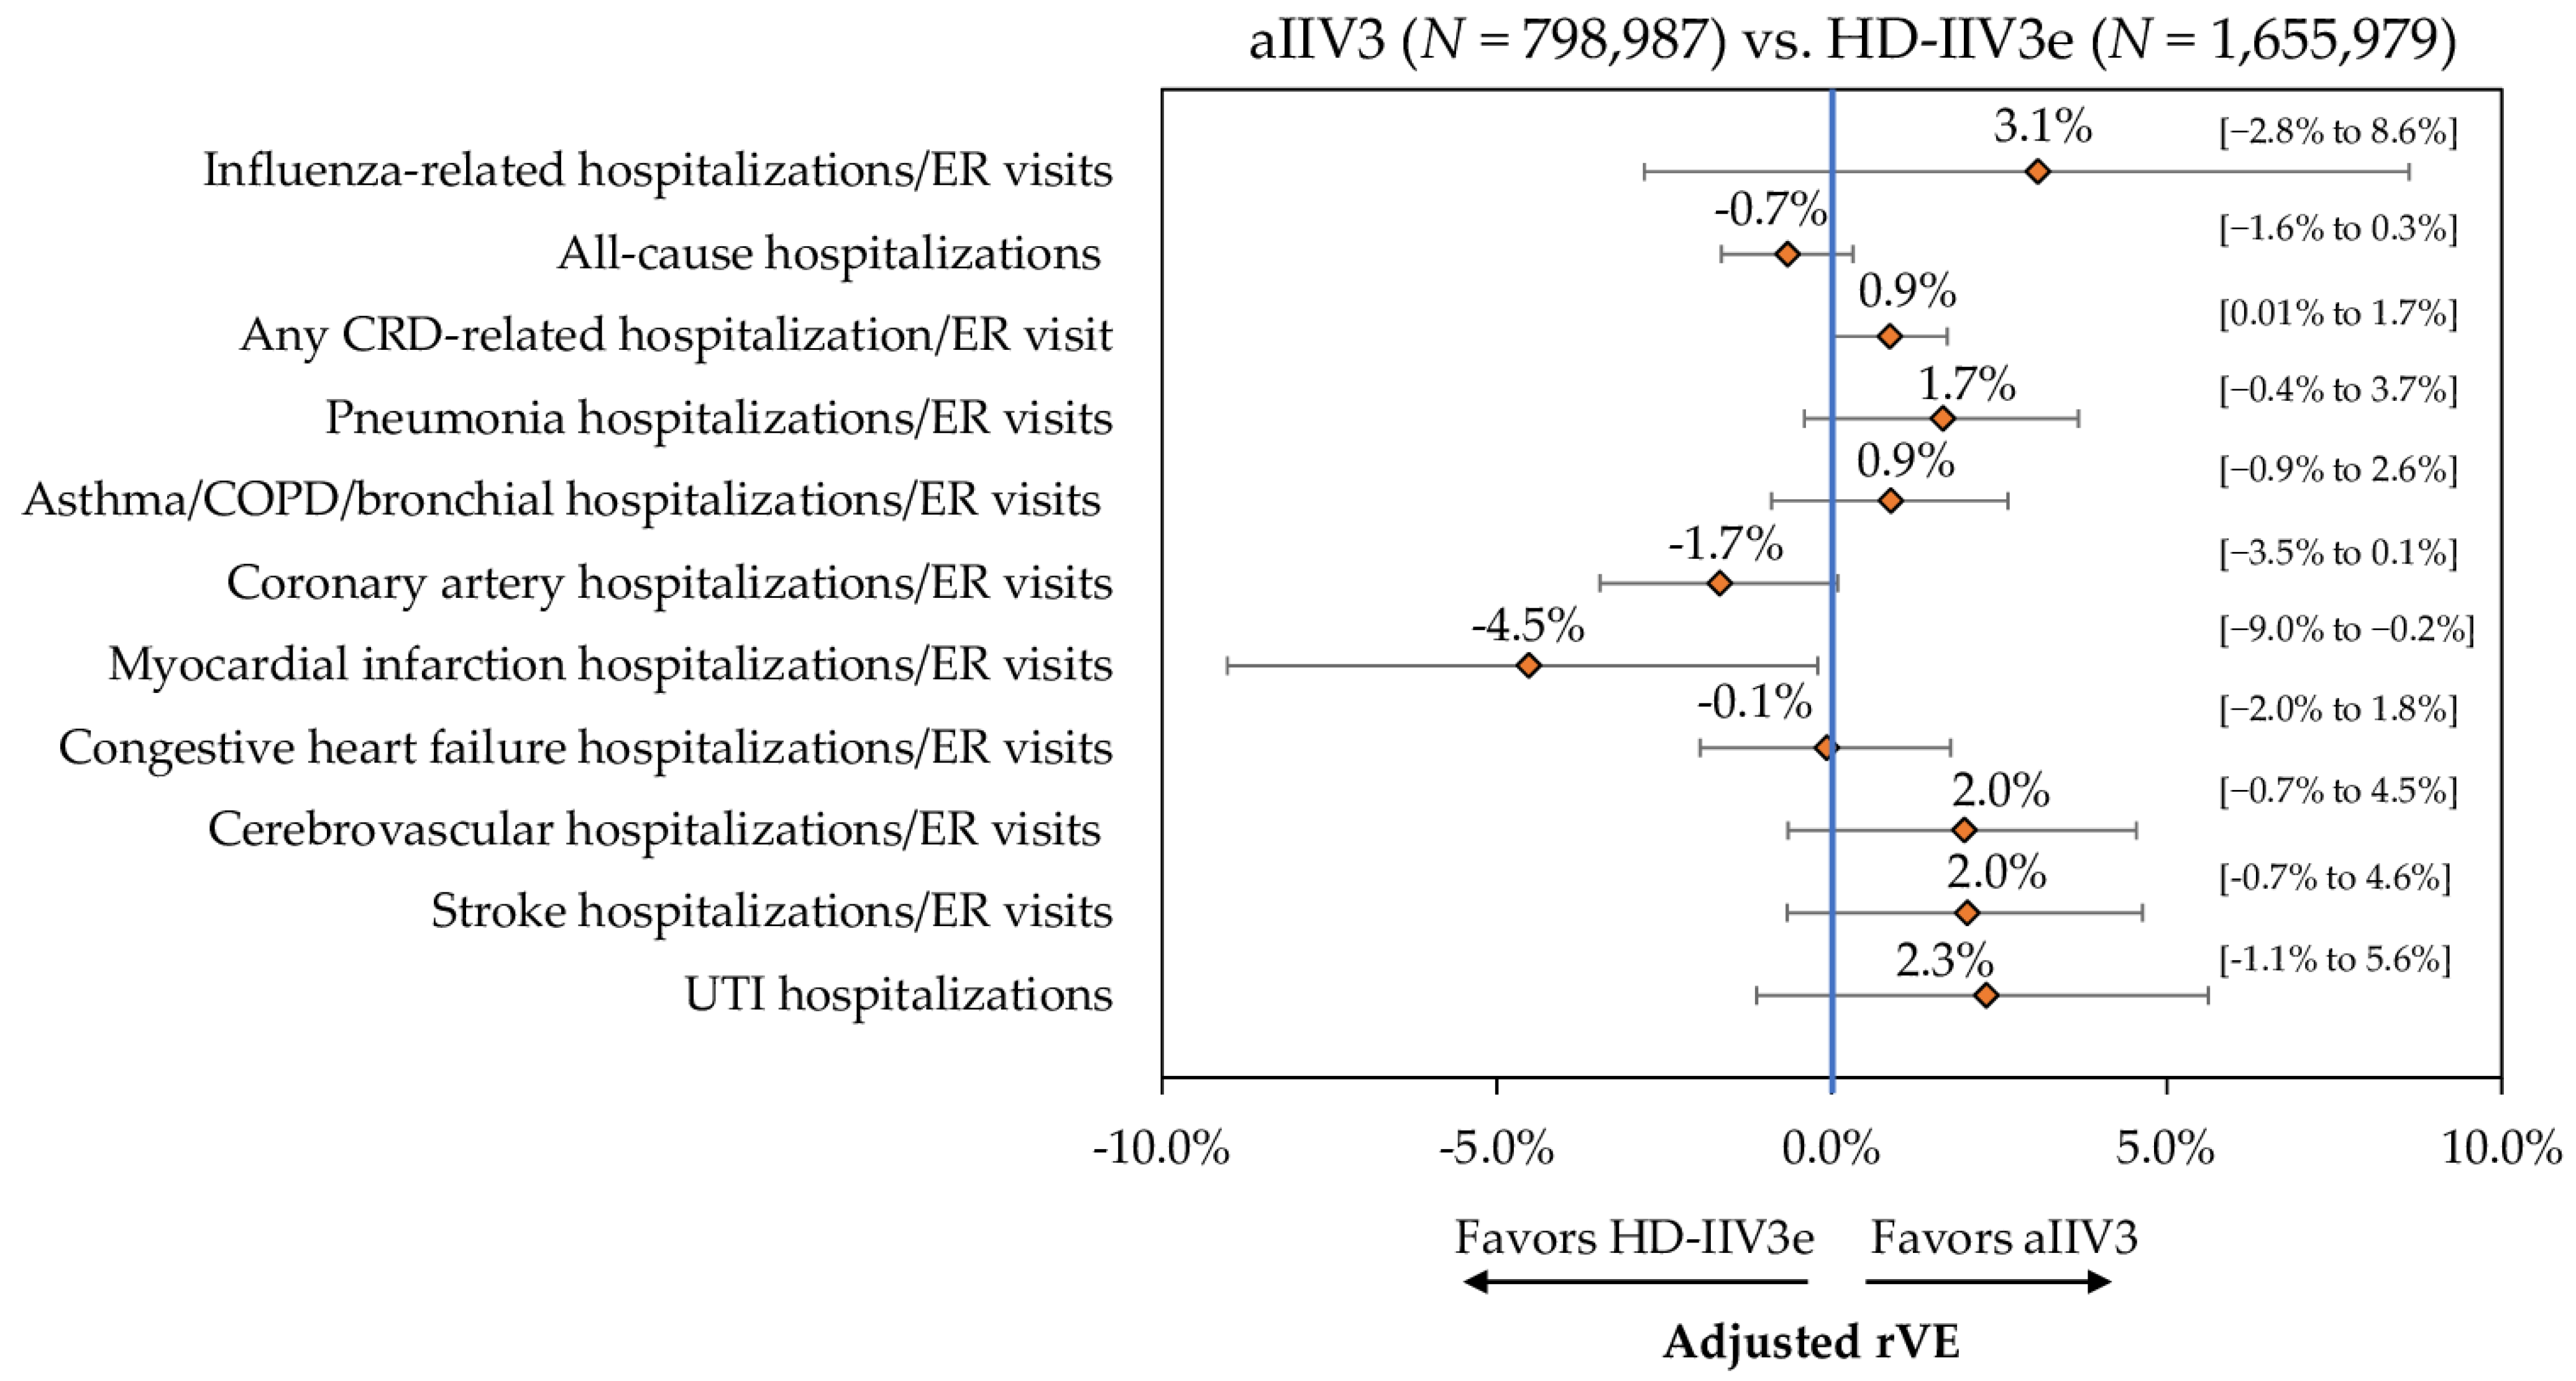
3.3. Clinical Outcomes
3.4. Economic Outcomes
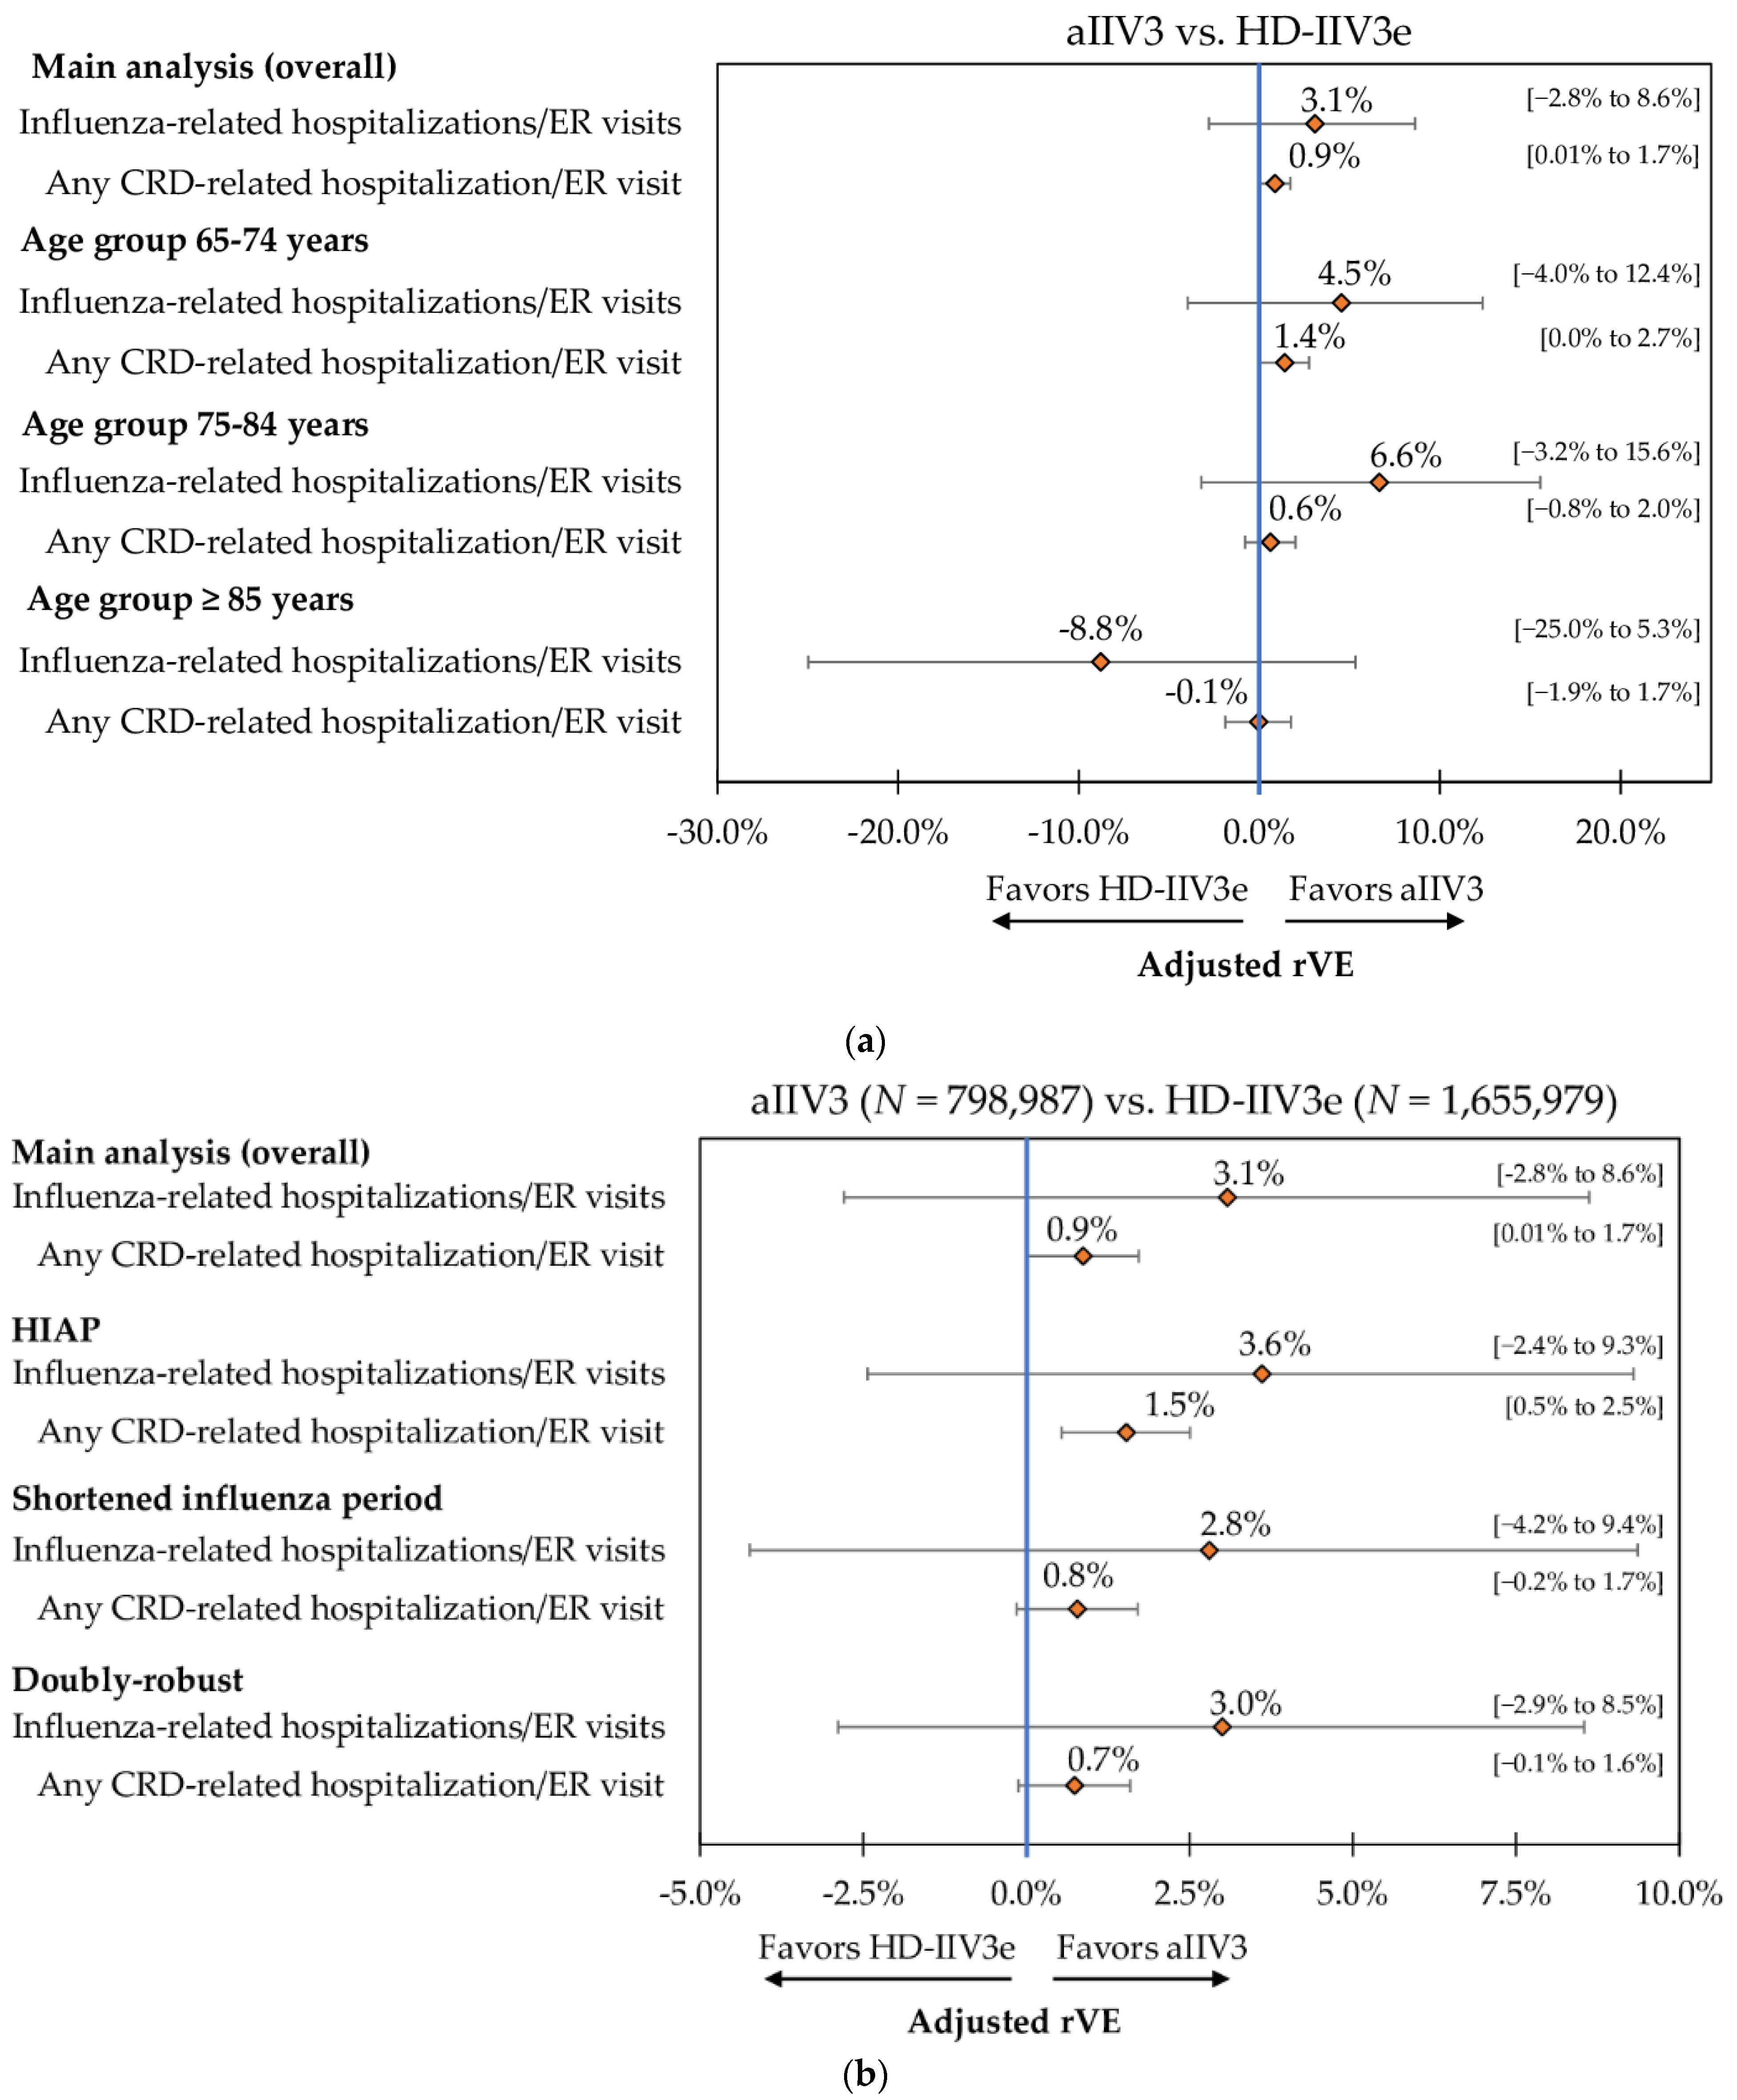
3.5. Sub-Group and Sensitivity Analyses
4. Discussion
5. Conclusions
Supplementary Materials
Author Contributions
Funding
Institutional Review Board Statement
Informed Consent Statement
Data Availability Statement
Conflicts of Interest
References
- Sullivan, S.G.; Price, O.H.; Regan, A.K. Burden, effectiveness and safety of influenza vaccines in elderly, paediatric and pregnant populations. Ther. Adv. Vaccines Immunother. 2019, 7, 2515135519826481. [Google Scholar] [CrossRef]
- Centers for Disease Control and Prevention. Disease Burden of Influenza. Available online: https://www.cdc.gov/flu/about/disease/burden.htm (accessed on 20 May 2021).
- Centers for Disease Control and Prevention. People 65 Years and Older & Influenza. 6 May 2021. Available online: https://www.cdc.gov/flu/highrisk/65over.htm (accessed on 28 January 2021).
- Centers for Disease Control and Prevention. Estimated Influenza Illnesses, Medical Visits, Hospitalizations, and Deaths in the United States—2019–2020 Influenza Season. Available online: https://www.cdc.gov/flu/about/burden/2019-2020.html (accessed on 7 October 2021).
- Grohskopf, L.A.; Alyanak, E.; Broder, K.R.; Walter, E.B.; Fry, A.M.; Jernigan, D.B. Prevention and Control of Seasonal Influenza with Vaccines: Recommendations of the Advisory Committee on Immunization Practices—United States, 2019–2020 Influenza Season. MMWR Recomm. Rep. 2019, 68, 1–21. [Google Scholar] [CrossRef] [Green Version]
- Ng, T.W.; Cowling, B.J.; Gao, H.Z.; Thompson, M.G. Comparative immunogenicity of enhanced seasonal influenza vaccines in older adults: A systematic review and meta-analysis. J. Infect. Dis. 2019, 219, 1525–1535. [Google Scholar] [CrossRef]
- Mannino, S.; Villa, M.; Apolone, G.; Weiss, N.S.; Groth, N.; Aquino, I.; Boldori, L.; Caramaschi, F.; Gattinoni, A.; Malchiodi, G. Effectiveness of adjuvanted influenza vaccination in elderly subjects in northern Italy. Am. J. Epidemiol. 2012, 176, 527–533. [Google Scholar] [CrossRef] [Green Version]
- DiazGranados, C.A.; Dunning, A.J.; Kimmel, M.; Kirby, D.; Treanor, J.; Collins, A.; Pollak, R.; Christoff, J.; Earl, J.; Landolfi, V. Efficacy of high-dose versus standard-dose influenza vaccine in older adults. N. Engl. J. Med. 2014, 371, 635–645. [Google Scholar] [CrossRef]
- Lee, J.K.; Lam, G.K.; Shin, T.; Kim, J.; Krishnan, A.; Greenberg, D.P.; Chit, A. Efficacy and effectiveness of high-dose versus standard-dose influenza vaccination for older adults: A systematic review and meta-analysis. Expert Rev. Vaccines 2018, 17, 435–443. [Google Scholar] [CrossRef]
- Pelton, S.I.; Divino, V.; Postma, M.J.; Shah, D.; Mould-Quevedo, J.; DeKoven, M.; Krishnarajah, G. A retrospective cohort study assessing relative effectiveness of adjuvanted versus high-dose trivalent influenza vaccines among older adults in the United States during the 2018–2019 influenza season. Vaccine 2021, 39, 2396–2407. [Google Scholar] [CrossRef]
- Van Aalst, R.; Gravenstein, S.; Mor, V.; Mahmud, S.M.; Wilschut, J.; Postma, M.; Chit, A. Comparative effectiveness of high dose versus adjuvanted influenza vaccine: A retrospective cohort study. Vaccine 2020, 38, 372–379. [Google Scholar] [CrossRef]
- Izurieta, H.S.; Lu, M.; Kelman, J.; Lu, Y.; Lindaas, A.; Loc, J.; Pratt, D.; Wei, Y.; Chillarige, Y.; Wernecke, M.; et al. Comparative effectiveness of influenza vaccines among U.S. Medicare beneficiaries ages 65 years and older during the 2019–2020 season. Clin. Infect. Dis. 2020. [Google Scholar] [CrossRef]
- Izurieta, H.S.; Chillarige, Y.; Kelman, J.; Wei, Y.; Lu, Y.; Xu, W.; Lu, M.; Pratt, D.; Chu, S.; Wernecke, M. Relative effectiveness of cell-cultured and egg-based influenza vaccines among elderly persons in the United States, 2017–2018. J. Infect. Dis. 2019, 220, 1255–1264. [Google Scholar] [CrossRef]
- Izurieta, H.S.; Chillarige, Y.; Kelman, J.; Wei, Y.; Lu, Y.; Xu, W.; Lu, M.; Pratt, D.; Wernecke, M.; MaCurdy, T. Relative Effectiveness of Influenza Vaccines Among the United States Elderly, 2018–2019. J. Infect. Dis. 2020, 222, 278–287. [Google Scholar] [CrossRef] [Green Version]
- Pelton, S.I.; Divino, V.; Shah, D.; Mould-Quevedo, J.; DeKoven, M.; Krishnarajah, G.; Postma, M.J. Evaluating the Relative Vaccine Effectiveness of Adjuvanted Trivalent Influenza Vaccine Compared to High-Dose Trivalent and Other Egg-Based Influenza Vaccines among Older Adults in the US during the 2017–2018 Influenza Season. Vaccines 2020, 8, 446. [Google Scholar] [CrossRef]
- Macias, A.E.; McElhaney, J.E.; Chaves, S.S.; Nealon, J.; Nunes, M.C.; Samson, S.I.; Seet, B.T.; Weinke, T.; Yu, H. The disease burden of influenza beyond respiratory illness. Vaccine 2020, 39, A6–A14. [Google Scholar] [CrossRef]
- IQVIA Inc. Anonymously Linking a Plurality of Data Records. US Patent 6,397,224, 28 May 2002.
- COVID-19 Data: Number of Lab-Confirmed COVID-19 Cases; Retrieved from Johns Hopkins Coronavirus Resource Center GitHub Repository. Available online: https://github.com/CSSEGISandData/COVID-19 (accessed on 15 June 2021).
- Centers for Disease Control and Prevention. New ICD-10-CM Code for the 2019 Novel Coronavirus (COVID-19). 1 April 2020. Available online: https://www.cdc.gov/nchs/data/icd/Announcement-New-ICD-code-for-coronavirus-3-18-2020.pdf (accessed on 15 June 2021).
- Agency for Healthcare Research and Quality. HCUP Cost-to-Charge Ratio Files. September 2018. Available online: https://www.hcup-us.ahrq.gov/db/state/costtocharge.jsp (accessed on 15 June 2019).
- Centers for Medicare & Medicaid Services. Hospital Outpatient Prospective Payment. Annual Policy Files. 2019. Available online: https://www.cms.gov/Medicare/Medicare-Fee-for-Service-Payment/HospitalOutpatientPPS/Annual-Policy-Files.html (accessed on 1 March 2021).
- US Armed Forces Health Surveillance Center’s (AFHSC) published and validated Code Set B (for influenza surveillance). Available online: https://health.mil/Reference-Center/Publications/2015/10/01/Influenza-Like-Illness (accessed on 15 June 2021).
- Austin, P.C. Balance diagnostics for comparing the distribution of baseline covariates between treatment groups in propensity-score matched samples. Stat. Med. 2009, 28, 3083–3107. [Google Scholar] [CrossRef] [Green Version]
- Austin, P.C.; Stuart, E.A. Moving towards best practice when using inverse probability of treatment weighting (IPTW) using the propensity score to estimate causal treatment effects in observational studies. Stat. Med. 2015, 34, 3661–3679. [Google Scholar] [CrossRef]
- Thoemmes, F.; Ong, A.D. A primer on inverse probability of treatment weighting and marginal structural models. Emerg. Adulthood 2016, 4, 40–59. [Google Scholar] [CrossRef] [Green Version]
- Basu, A.; Rathouz, P.J. Estimating marginal and incremental effects on health outcomes using flexible link and variance function models. Biostatistics 2005, 6, 93–109. [Google Scholar] [CrossRef] [Green Version]
- Deb, P.; Norton, E.C. Modeling health care expenditures and use. Annu. Rev. Public Health 2018, 39, 489–505. [Google Scholar] [CrossRef] [Green Version]
- Lozano, J.E. Lozalojo/Mem: Second Release of the MEM R Library. Zenodo [Internet]. [cited 1 February 2017]. Available online: https://zenodo.org/record/165983 (accessed on 15 June 2021).
- Boikos, C.; Sylvester, G.C.; Sampalis, J.S.; Mansi, J.A. Relative effectiveness of the cell-cultured quadrivalent influenza vaccine compared to standard, egg-derived quadrivalent influenza vaccines in preventing influenza-like illness in 2017–2018. Clin. Infect. Dis. 2020, 71, e665–e671. [Google Scholar] [CrossRef]
- Funk, M.J.; Westreich, D.; Wiesen, C.; Stürmer, T.; Brookhart, M.A.; Davidian, M. Doubly robust estimation of causal effects. Am. J. Epidemiol. 2011, 173, 761–767. [Google Scholar] [CrossRef]
- Centers for Disease Control and Prevention. Weekly U.S. Influenza Surveillance Report. Available online: https://www.cdc.gov/flu/weekly/index.htm (accessed on 21 May 2021).
- Austin, P.C. The relative ability of different propensity score methods to balance measured covariates between treated and untreated subjects in observational studies. Med. Decis. Mak. 2009, 29, 661–677. [Google Scholar] [CrossRef]
- Peasah, S.K.; Meltzer, M.I.; Vu, M.; Moulia, D.L.; Bridges, C.B. Cost-effectiveness of increased influenza vaccination uptake against readmissions of major adverse cardiac events in the US. PLoS ONE 2019, 14, e0213499. [Google Scholar] [CrossRef]
- Udell, J.A.; Zawi, R.; Bhatt, D.L.; Keshtkar-Jahromi, M.; Gaughran, F.; Phrommintikul, A.; Ciszewski, A.; Vakili, H.; Hoffman, E.B.; Farkouh, M.E. Association between influenza vaccination and cardiovascular outcomes in high-risk patients: A meta-analysis. JAMA 2013, 310, 1711–1720. [Google Scholar] [CrossRef]
- Putri, W.C.; Muscatello, D.J.; Stockwell, M.S.; Newall, A.T. Economic burden of seasonal influenza in the United States. Vaccine 2018, 36, 3960–3966. [Google Scholar] [CrossRef]
- Centers for Medicare & Medicaid Services. Seasonal Influenza Vaccines Pricing. 2021. Available online: https://www.cms.gov/Medicare/Medicare-Fee-for-Service-Part-B-Drugs/McrPartBDrugAvgSalesPrice/VaccinesPricing (accessed on 8 July 2021).


| Pre-IPTW | Post-IPTW | |||||
|---|---|---|---|---|---|---|
| Vaccine Cohort Characteristics | aIIV3 n = 798,255 | HD-IIV3e n = 1,654,162 | SMD 1 | aIIV3 n = 798,987 | HD-IIV3e n = 1,655,979 | SMD 1 |
| Mean age | 75.0 | 75.0 | −0.01 | 75.0 | 75.0 | 0.00 |
| SD | 6.2 | 6.3 | 6.2 | 6.2 | ||
| Median | 74 | 74 | 74 | 74 | ||
| Age group (%) | ||||||
| 65–74 years | 50.5% | 51.0% | 0.01 | 50.9% | 50.9% | 0.00 |
| 75–84 years | 34.8% | 34.2% | −0.01 | 34.3% | 34.4% | 0.00 |
| ≥85 years | 14.6% | 14.8% | 0.01 | 14.7% | 14.7% | 0.00 |
| Female (%) | 58.9% | 59.4% | 0.01 | 59.2% | 59.3% | 0.00 |
| Geographic region (%) | ||||||
| Northeast | 15.6% | 18.1% | 0.07 | 17.7% | 16.9% | −0.02 |
| Midwest | 16.7% | 18.0% | 0.03 | 17.5% | 17.6% | 0.00 |
| South | 52.0% | 45.3% | −0.13 | 47.0% | 47.9% | 0.02 |
| West | 15.6% | 18.6% | 0.08 | 17.8% | 17.5% | −0.01 |
| DHHS region (%) | ||||||
| Region 1: CT, ME, MA, NH, RI, VT | 4.5% | 6.1% | 0.07 | 5.6% | 5.6% | 0.00 |
| Region 2: NJ, NY, PR, VI | 8.0% | 9.9% | 0.07 | 9.2% | 9.2% | 0.00 |
| Region 3: DE, DC, MD, PA, VA, WV | 9.6% | 9.0% | −0.02 | 9.2% | 9.2% | 0.00 |
| Region 4: AL, FL, GA, KY, MS, NC, SC, TN | 36.1% | 22.1% | −0.31 | 26.6% | 26.8% | 0.01 |
| Region 5: IL, IN, MI, MN, OH, WI | 14.8% | 15.0% | 0.01 | 14.9% | 14.9% | 0.00 |
| Region 6: AR, LA, NM, OK, TX | 10.1% | 17.5% | 0.21 | 15.2% | 15.0% | 0.00 |
| Region 7: IA, KS, MO, NE | 1.9% | 2.9% | 0.07 | 2.6% | 2.6% | 0.00 |
| Region 8: CO, MT, ND, SD, UT, WY | 0.9% | 1.3% | 0.05 | 1.2% | 1.2% | 0.00 |
| Region 9: AZ, CA, HI, NV, AS, FS, GU, PU | 9.8% | 11.2% | 0.05 | 10.8% | 10.7% | 0.00 |
| Region 10: AK, ID, OR, WA | 4.3% | 5.1% | 0.04 | 4.8% | 4.8% | 0.00 |
| Payer type (%) | ||||||
| Cash | 0.2% | 0.2% | 0.00 | 0.2% | 0.2% | 0.00 |
| Medicaid | 0.1% | 0.1% | 0.00 | 0.1% | 0.1% | 0.00 |
| Medicare Part D | 34.8% | 32.7% | −0.04 | 33.1% | 33.3% | 0.01 |
| Medicare | 41.3% | 37.5% | −0.08 | 38.5% | 38.6% | 0.00 |
| Third party | 23.7% | 29.5% | 0.13 | 28.2% | 27.8% | −0.01 |
| Pre-IPTW | Post-IPTW | |||||
|---|---|---|---|---|---|---|
| Vaccine Cohort Characteristics | aIIV3 n = 798,255 | HD-IIV3e n = 1,654,162 | SMD 1 | aIIV3 n = 798,987 | HD-IIV3e n = 1,655,979 | SMD 1 |
| Month of influenza vaccination (%) | ||||||
| August | 10.7% | 1.5% | −0.39 | 4.5% | 4.6% | 0.01 |
| September | 30.6% | 29.4% | −0.03 | 29.6% | 29.7% | 0.00 |
| October | 41.1% | 45.4% | 0.09 | 43.9% | 44.0% | 0.00 |
| November | 12.0% | 16.1% | 0.12 | 14.8% | 14.7% | 0.00 |
| December | 4.0% | 5.4% | 0.07 | 5.0% | 4.9% | 0.00 |
| January | 1.7% | 2.2% | 0.04 | 2.1% | 2.1% | 0.00 |
| CCI score (%) | ||||||
| 0 | 52.9% | 52.1% | −0.02 | 52.3% | 52.3% | 0.00 |
| 1 | 21.2% | 21.2% | 0.00 | 21.3% | 21.2% | 0.00 |
| 2 | 13.0% | 13.2% | 0.01 | 13.2% | 13.1% | 0.00 |
| 3+ | 13.0% | 13.5% | 0.01 | 13.3% | 13.3% | 0.00 |
| Mean CCI score | 1.0 | 1.0 | 0.02 | 1.0 | 1.0 | 0.00 |
| SD | 1.4 | 1.4 | 1.4 | 1.4 | ||
| Median | 0 | 0 | 0 | 0 | ||
| Pre-index comorbidities (%) | ||||||
| Asthma | 4.0% | 3.9% | 0.00 | 4.0% | 3.9% | −0.01 |
| Blood disorders | 0.3% | 0.3% | 0.00 | 0.3% | 0.3% | 0.00 |
| Chronic lung disease | 9.2% | 9.4% | 0.01 | 9.3% | 9.3% | 0.00 |
| Diabetes | 22.3% | 23.1% | 0.02 | 22.6% | 23.0% | 0.01 |
| Heart disease | 14.0% | 14.3% | 0.01 | 14.3% | 14.1% | −0.01 |
| Kidney disorders | 10.3% | 10.5% | 0.01 | 10.4% | 10.4% | 0.00 |
| Liver disorders | 2.6% | 2.6% | 0.00 | 2.6% | 2.6% | −0.01 |
| Neurological or neurodevelopmental conditions | 5.3% | 5.4% | 0.01 | 5.4% | 5.4% | 0.00 |
| Weakened immune system 2 | 11.3% | 11.1% | −0.01 | 11.3% | 11.1% | −0.01 |
| IBD | 0.7% | 0.7% | −0.01 | 0.7% | 0.7% | 0.00 |
| Composite of the above | 50.7% | 51.4% | 0.01 | 51.2% | 51.2% | 0.00 |
| Indicators of frail health status (%) | ||||||
| Home oxygen use | 5.2% | 5.6% | 0.02 | 5.5% | 5.5% | 0.00 |
| Wheelchair use | 2.8% | 3.2% | 0.02 | 3.0% | 3.1% | 0.01 |
| Walker use | 3.8% | 3.9% | 0.01 | 3.9% | 3.9% | 0.00 |
| Dementia | 1.5% | 1.5% | 0.00 | 1.6% | 1.5% | 0.00 |
| Urinary catheter use | 0.2% | 0.2% | 0.00 | 0.2% | 0.2% | 0.00 |
| Falls | 0.9% | 0.9% | 0.00 | 0.9% | 0.8% | 0.00 |
| Fractures | 0.5% | 0.6% | 0.00 | 0.6% | 0.6% | 0.00 |
| Composite of the above | 11.9% | 12.5% | 0.02 | 12.4% | 12.3% | 0.00 |
| Indicators of health-seeking behavior (%) | ||||||
| Cataracts | 8.5% | 8.2% | −0.01 | 8.4% | 8.2% | −0.01 |
| Eyelid disorders | 1.3% | 1.2% | −0.01 | 1.3% | 1.2% | −0.01 |
| Hemorrhoids | 2.1% | 2.0% | −0.01 | 2.0% | 2.0% | 0.00 |
| Ingrown nail | 1.0% | 0.9% | −0.01 | 1.0% | 0.9% | −0.01 |
| Lipomas | 0.3% | 0.2% | 0.00 | 0.3% | 0.2% | 0.00 |
| UTI | 6.6% | 6.6% | 0.00 | 6.6% | 6.6% | 0.00 |
| Wound of hand or finger | 0.5% | 0.5% | 0.00 | 0.5% | 0.5% | 0.00 |
| Composite of the above | 18.5% | 18.0% | −0.01 | 18.3% | 18.0% | −0.01 |
| Pre-index hospitalization (%) | 8.3% | 8.2% | 0.00 | 8.2% | 8.2% | 0.00 |
| Mean pre-index outpatient pharmacy costs | USD 2109 | USD 2154 | 0.02 | USD 2111 | USD 2158 | 0.02 |
| SD | USD 6801 | USD 6824 | USD 6050 | USD 6726 | ||
| Median | USD 530 | USD 547 | USD 527 | USD 551 | ||
| Mean inpatient costs | USD 874 | USD 857 | 0.00 | USD 889 | USD 853 | 0.00 |
| SD | USD 8392 | USD 8502 | USD 8529 | USD 8479 | ||
| Median | USD 0 | USD 0 | USD 0 | USD 0 | ||
| Mean outpatient medical costs (excluding ER) | USD 3830 | USD 3792 | −0.02 | USD 3861 | USD 3759 | −0.02 |
| SD | USD 14,401 | USD 14,194 | USD 14,448 | USD 14,147 | ||
| Median | USD 641 | USD 619 | USD 641 | USD 615 | ||
| Mean ER costs | USD 193 | USD 189 | 0.01 | USD 195 | USD 188 | 0.00 |
| SD | USD 1059 | USD 1046 | USD 1071 | USD 1043 | ||
| Median | USD 0 | USD 0 | USD 0 | USD 0 | ||
| Mean TOTAL pre-index costs 3 | USD 7006 | USD 6991 | 0.00 | USD 7056 | USD 6959 | 0.00 |
| SD | USD 19,559 | USD 19,840 | USD 19,733 | USD 19,727 | ||
| Median | USD 2178 | USD 2191 | USD 2183 | USD 2190 | ||
| Predicted Mean Annualized Cost | aIIV3 n = 798,987 | HD-IIV3e n = 1,655,979 | Incremental Mean | p-Value | ||
|---|---|---|---|---|---|---|
| Mean | 95% CIs | Mean | 95% CIs | |||
| All-cause total | USD 13,196 | USD 13,133–USD 13,260 | USD 13,221 | USD 13,176–USD 13,275 | USD 25.24 | 0.2720 |
| Influenza-related total | USD 21.64 | USD 19.91–USD 23.36 | USD 21.92 | USD 20.79–USD 23.17 | USD 0.28 | 0.4000 |
| Influenza-related hospitalizations | USD 22.98 | USD 19.32–USD 27.21 | USD 22.04 | USD 19.68–USD 24.53 | −USD 0.94 | 0.3200 |
| Influenza-related ER | USD 4.15 | USD 3.73–USD 4.61 | USD 4.44 | USD 4.18–USD 4.74 | USD 0.29 | 0.1280 |
| Influenza-related office visit | USD 2.01 | USD 1.80–USD 2.25 | USD 1.92 | USD 1.77–USD 2.09 | −USD 0.09 | 0.2620 |
| Influenza-related pharmacy | USD 2.75 | USD 2.68–USD 2.81 | USD 2.77 | USD 2.73–USD 2.80 | USD 0.02 | 0.3020 |
Publisher’s Note: MDPI stays neutral with regard to jurisdictional claims in published maps and institutional affiliations. |
© 2021 by the authors. Licensee MDPI, Basel, Switzerland. This article is an open access article distributed under the terms and conditions of the Creative Commons Attribution (CC BY) license (https://creativecommons.org/licenses/by/4.0/).
Share and Cite
Levin, M.J.; Divino, V.; Shah, D.; DeKoven, M.; Mould-Quevedo, J.; Pelton, S.I.; Postma, M.J. Comparing the Clinical and Economic Outcomes Associated with Adjuvanted versus High-Dose Trivalent Influenza Vaccine among Adults Aged ≥ 65 Years in the US during the 2019–20 Influenza Season—A Retrospective Cohort Analysis. Vaccines 2021, 9, 1146. https://doi.org/10.3390/vaccines9101146
Levin MJ, Divino V, Shah D, DeKoven M, Mould-Quevedo J, Pelton SI, Postma MJ. Comparing the Clinical and Economic Outcomes Associated with Adjuvanted versus High-Dose Trivalent Influenza Vaccine among Adults Aged ≥ 65 Years in the US during the 2019–20 Influenza Season—A Retrospective Cohort Analysis. Vaccines. 2021; 9(10):1146. https://doi.org/10.3390/vaccines9101146
Chicago/Turabian StyleLevin, Myron J., Victoria Divino, Drishti Shah, Mitch DeKoven, Joaquin Mould-Quevedo, Stephen I. Pelton, and Maarten J. Postma. 2021. "Comparing the Clinical and Economic Outcomes Associated with Adjuvanted versus High-Dose Trivalent Influenza Vaccine among Adults Aged ≥ 65 Years in the US during the 2019–20 Influenza Season—A Retrospective Cohort Analysis" Vaccines 9, no. 10: 1146. https://doi.org/10.3390/vaccines9101146