The Increasing Sociospatial Fragmentation of Urban America


Department of Geography and Earth Sciences, University of North Carolina at Charlotte, Charlotte, NC 28223, USA
Urban Sci. 2019, 3(1), 9; https://doi.org/10.3390/urbansci3010009
Submission received: 14 December 2018
/
Revised: 5 January 2019
/
Accepted: 7 January 2019
/
Published: 11 January 2019
(This article belongs to the Special Issue Formalizing Urban Methodologies)
Abstract
:This analysis examines the spatial fragmentation of the urban landscape with respect to neighborhoods classified according to their racial, demographic, housing and socioeconomic characteristics. The analysis is performed on the 50 largest metropolitan areas throughout the United States from 1990–2010, and looks at both global trends over time using a landscape ecology metric of edge density to quantify fragmentation over time. It then analyzes the spatial clustering of each neighborhood type over time, for each city. Results illustrate an increasingly fragmented urban landscape with respect to neighborhood type, led by Los Angeles as the most fragmented metropolitan area. Decomposed by neighborhood type, both racially concentrated high-poverty neighborhoods, as well as neighborhoods with a highly educated population, have increased in spatial concentration in large cities over time, exposing rises in spatial inequalities even as global patterns suggest a breaking up of neighborhood types. The global patterns are therefore driven by declines in more moderate-income and multiethnic neighborhoods, and a decline in the spatial concentration of newer, white, single-family housing neighborhoods.
1. Introduction
Debates over the urban spatial structure of American cities have largely fallen into two broad, well-documented schools of thought: the neat geometric landscapes of segregated social groups as proposed by Chicago school theorists, and the chaotic, quasi-random, post-modernist landscapes of the Los Angeles school. The concentric zones [1], sectors [2] and multiple nuclei [3] describing the spatial structure of American cities developed by Chicago school sociologists beginning in the 1920s have persisted as the predominant models of urban form, though their current relevance and accuracy even in their time have been questioned [4]. Their most ardent and well-organized critics, those associated with the so-called Los Angeles school, contend that the modern metropolis is not governed by metropolitan-scale organizing processes. Meanwhile, other less prominent schools of thought and revisions (or reversals) to the Chicago school models including the New York school and the Great Inversion hypotheses have also percolated into the discussion.
While theoretical debates over urban structure have played out in the literature [5,6,7,8], comparatively few empirical studies have tested the relevance of these ideas both over time and for a large number of US cities. This research contributes to this debate by analyzing the spatial fragmentation of neighborhood types, as defined by their racial, socioeconomic and housing characteristics in the 50 largest US metropolitan areas from 1990–2010. It subsequently analyses the types of neighborhoods in each city that are most spatially compact versus dispersed, and their changes over time. In particular, four research questions are addressed: (1) Which cities exhibit the greatest fragmentation of neighborhood types? (2) Which cities have witnessed the greatest increase in the fragmentation of neighborhood types over time? (3) Which types of neighborhoods in each city are most spatially compact versus dispersed? And finally, (4) how has the spatial clustering of neighborhood types changed over time for each city? The implications of this empirical analysis are linked to these existing schools of thought and their relevance in describing US cities today. Widespread increases in fragmentation and declines in the clustering of neighborhood types would imply a trend toward Los Angeles school thinking, while a stasis in fragmentation and high levels of clustering is more indicative of ordered Chicago school thinking. Decomposing the results by metropolitan area addresses whether Los Angeles is indeed unique in its spatial disorganization, or is representative of the future of US cities.
Overall, the results point to consistent increases in the fragmentation of neighborhood types across most US metropolitan areas between 1990 and 2010. Los Angeles emerges as the most fragmented metropolitan area by 2010, followed by New York and San Francisco. Other fast-growing, southern cities including Tampa, Miami, Washington D.C., Raleigh, Charlotte and Atlanta saw the sharpest increases in spatial fragmentation between the two time periods, suggesting that newer growth patterns are less ordered than their Chicago-era predecessors. The analysis by neighborhood type showed that these global patterns were not driven by uniform declines in the spatial clustering of all neighborhood types; high-poverty black neighborhoods continued to exhibit high spatial clustering across the nation.
The remaining structure of this article is as follows: the next section provides a brief overview of the theoretical and empirical state of knowledge on the spatial arrangement of cities by social groups, followed by an overview of the data and methods used in Section 3. Results are presented in Section 4, and a discussion and conclusions are in Section 5.
2. Background
2.1. Schools of Thought
According to Chicago school thinkers, the outcome of both economic and social processes is an observable and quantifiable spatial concentration of population groups within cities. Accordingly, land values and housing density, which help dictate who lives where, also exhibit a clear spatial pattern. Competition for land and the availability of new housing construction, coupled with transportation infrastructure (which helps determine both land prices and the propensity for land to be developed), give rise to a rather ordered spatial separation of social groups and subsequent urban form. Burgess’ [1] famous concentric zone model identified four zones situated in rings around a city center core descending linearly in socioeconomic status toward a catchall ‘commuter zone’ on the outskirts of the city. Harris and Lewis [4] argue that this model likely oversimplifies even the realities of early 20th-century Chicago, as the suburbs likely contained far more diversity than the commuter zone implied. Over time, the model arguably helped to exacerbate the perception of a stark city center /suburban divide whereas in reality, suburbs have long been economically, physically and socially diverse places [4,9]. Nonetheless, supporters of Chicago school and research that follows in its tradition, defend its evidence-based approach of seeking to identify and explain regularities across urban areas [7].
The Great Inversion hypothesis posited by Ehrenhalt [10] retains the ordered spatial patterns described by the Chicago school, but reverses the sorting pattern to reflect more recent back-to-the-city movements and gentrification trends reshaping American cities. According to this view, the city center will be home to the more affluent social classes, while the disadvantaged will increasingly live at a distance from this core. Similar to this hypothesis is the idea of a New York school proposed by Halle [11]. According to this view, cities conform to a pattern prototyped by New York City featuring a strong urban core, home to the middle class and rich as opposed to the working class and new immigrants described by original Chicago school thinkers.
On the far opposite end of the spectrum of these cities described by strong spatial patterns, the Los Angeles school, rooted in postmodernism, embraces the polycentric and periphery-driven landscape of Los Angles as emblematic of the future of US cities [6]. According to the Los Angeles school, Chicago is the prototypical modernist city featuring a strong core which dictates an organized sorting of neighborhoods and social groupings away from this center. Los Angeles, by contrast, is polycentric in nature, with cores dispersed around the metropolitan area including in the periphery. As acknowledged by Beveridge [12], though the notion of a Los Angeles school did not emerge until the 1980s, Fogelson [13] described the evolution of Los Angeles from its agricultural beginnings until its ‘fragmented par excellence, the archetype for better or for worse of the contemporary American metropolis’ (p.2). Debates over whether Los Angeles is archetypical of newer American cities or exemplary in its decentralization and fragmentation have persisted.
Of these predominant schools of thought regarding the sociospatial ordering of US cities, Chicago is suggestive of clustered, spatially cohesive groupings of neighborhood types of varying geometric patterns. New York flips the ordering so that the city center features a concentration of advantage rather than disadvantage, while Los Angeles rejects a strong central core theory in favor of polycentricity and a high degree of fragmentation.
2.2. Empirical Evidence
A small but growing body of literature has sought to empirically test the relevance of these epistemologies in describing the current spatial structure of cities. For example, Hackworth [14] evaluated landscape complexity in the 10 largest metro areas from 1970–2000 according to four variables: population density, rent, average home value, and per-capita income. He analyzed the distribution of these variables with respect to distance from their city centers, and found very regular patterns with respect to space. Ultimately, he concluded that the chaotic urban form proposed by the Los Angeles school did not describe the spatial structure of the ten largest US cities. While landscape complexity did increase marginally, overall, he argued that these cities witnessed inner-city revitalization, inner-ring suburban decline, and suburbanization in a largely similar fashion. Shearmur and Charron [15] provided supporting evidence for the presence of regular patterns and processes with respect to the income distribution in Montreal, arguing in favor of Chicago school-inspired quantitative analyses that seek to uncover these regularities, and Meyer and Esposito [16] found the income distribution in Los Angeles to be significantly related to distance from the central business district, even more so than for Chicago. This latter finding may capture some of the ‘Great Inversion’ patterns present in Chicago, as wealth returns to strengthen its urban core.
In a more recent analysis, Florida and Adler [17] examined the 2012 spatial patterns of three classes of workers: advantaged, blue collar and service in 12 of the largest US metropolitan areas. They categorized these cities into three groups: core-oriented, where the advantaged class occupies a large share of the core of the city; class-bloc, where the three classes were largely split into large, separated spatial blocs; and fractal, where class segmentation was less organized. In contrast to Hackworth [14], Florida and Adler [17] argue that the spatial organization of social classes in modern cities has been reshaped into a ‘patchwork metropolis in which class divides cut across city and suburb alike’ (p. 14). The spatial patterns of neighborhood socioeconomic dynamics in Chicago and Los Angeles from 1970–2010 were mapped by Delmelle [18], who noted that the resulting landscapes of Chicago largely reminisced the patterns foretold by early theorists with clear concentric zones and multiple nuclei. A spatially contiguous revival of downtown waterfront properties also aligned with the Great Inversion Hypothesis. On the other hand, the pattern of Los Angeles was much less ordered, particularly as it moved away from a largely impoverished core. Other descriptive analyses on the spatial patterns of various neighborhood types in various metropolitan areas have commented on the more structured spatial patterns of older cities compared to more dispersed spatial patterns in newer, more rapidly growing urban areas [19,20].
Beveridge [12] examined patterns of population growth in New York, Chicago and Los Angeles, and found that early growth followed a more structured pattern in Chicago and Los Angeles, but had no obvious pattern in New York. More recent growth has mimicked the unstructured picture of New York in all three cities. In all three cases, population growth could be found in both downtown and outlying areas, but there was no specific pattern to this growth. He argued that once an urban area has been settled initially, subsequent population growth is a function of other urban features such as transportation networks, land use types, and other factors that are not distributed in the same way across all urban areas. Florida and Adler [17] reiterated this suggestion by proposing that the most advantaged class has located in the most geographically desirable locations, leaving the remaining spaces for those less well-off. These desirable locations may be in the center of cities, but they may also be in the suburbs, moving the importance away from a strictly spatial perspective and instead emphasizing the importance of urban and natural in determining where growth occurs and for whom. Foote and Walter [19] noted the importance of highways and arterials in describing the spatial patterns of growth in rapidly growing cities, harking back to Hoyt’s sectorial model, and Meyer and Esposito [16] acknowledged the role of natural amenities in Chicago models including distance from the city center, elevation and waterfront in determining the income distribution of cities. The evidence is therefore mixed on the status of traditional models in explaining current cities.
In this article, I offer a complementary perspective on the evolution of urban landscape complexity in 50 US metropolitan areas. I take neighborhoods classified into nine similar groupings according to their social, economic and housing characteristics, and analyze how the spatial configuration of these neighborhoods has changed through time (from 1990–2010). In the first part, I investigate the fragmentation of neighborhood types at the metropolitan scale to determine the extent to which the spatial arrangement of neighborhoods has become more intermixed and to compare this fragmentation among cities. This analysis addresses the quandary raised by Harris [21] as to whether Los Angeles is exceptional or exemplary in depicting contemporary urban spatial structures. In the second part, I analyze the spatial clustering of each neighborhood type in each city. This follows the analysis of Delmelle [22] who analyzed the spatial clustering of these neighborhood types for all 50 MSAs grouped together. In this analysis, I segment out these results by MSA to determine which social groups are most spatially compact and how these patterns compare across cities and through time. What is found is a trend toward spatial fragmentation across the majority of the 50 MSAs, supporting the idea that modern metropolitan development does not conform to the patterns predicted by the established, geometric traditional schools of thought. Rather, metropolitan sorting patterns and development occur in a manner that follows attributes dispersed throughout the landscape, both in the city center and peripheral space alike.
3. Data and Methods
3.1. Neighborhood Classification
The neighborhood classification scheme used in this analysis was developed by Delmelle [22] who classified US Census tracts in the 50 largest Metropolitan Statistical Areas (MSAs) in the United States from 1980–2010 based on a collection of 18 variables describing the tract’s racial, housing, socioeconomic and demographic profile each decade. Nine classes of neighborhoods were established based on a self-organizing map and k-means clustering procedure. The classified census tract data are freely available for download [23]. A brief description of the predominant characteristics describing the 9 groups is as follows, while a full description of each group and details on how they were established can be found in [22]:
- Wealthy, white, educated
- Newer single-family homes, largely white, high socioeconomic status
- White and Asian, multiunit housing, educated, recent in-movers, high home values
- Older homes, white, some Hispanic, blue-collar workers
- Hispanic and black, higher poverty, aging single-family homes
- Black, high poverty, vacant homes
- Hispanic and foreign born, high poverty, single-family homes
- Mixed race, average socioeconomic status, renters
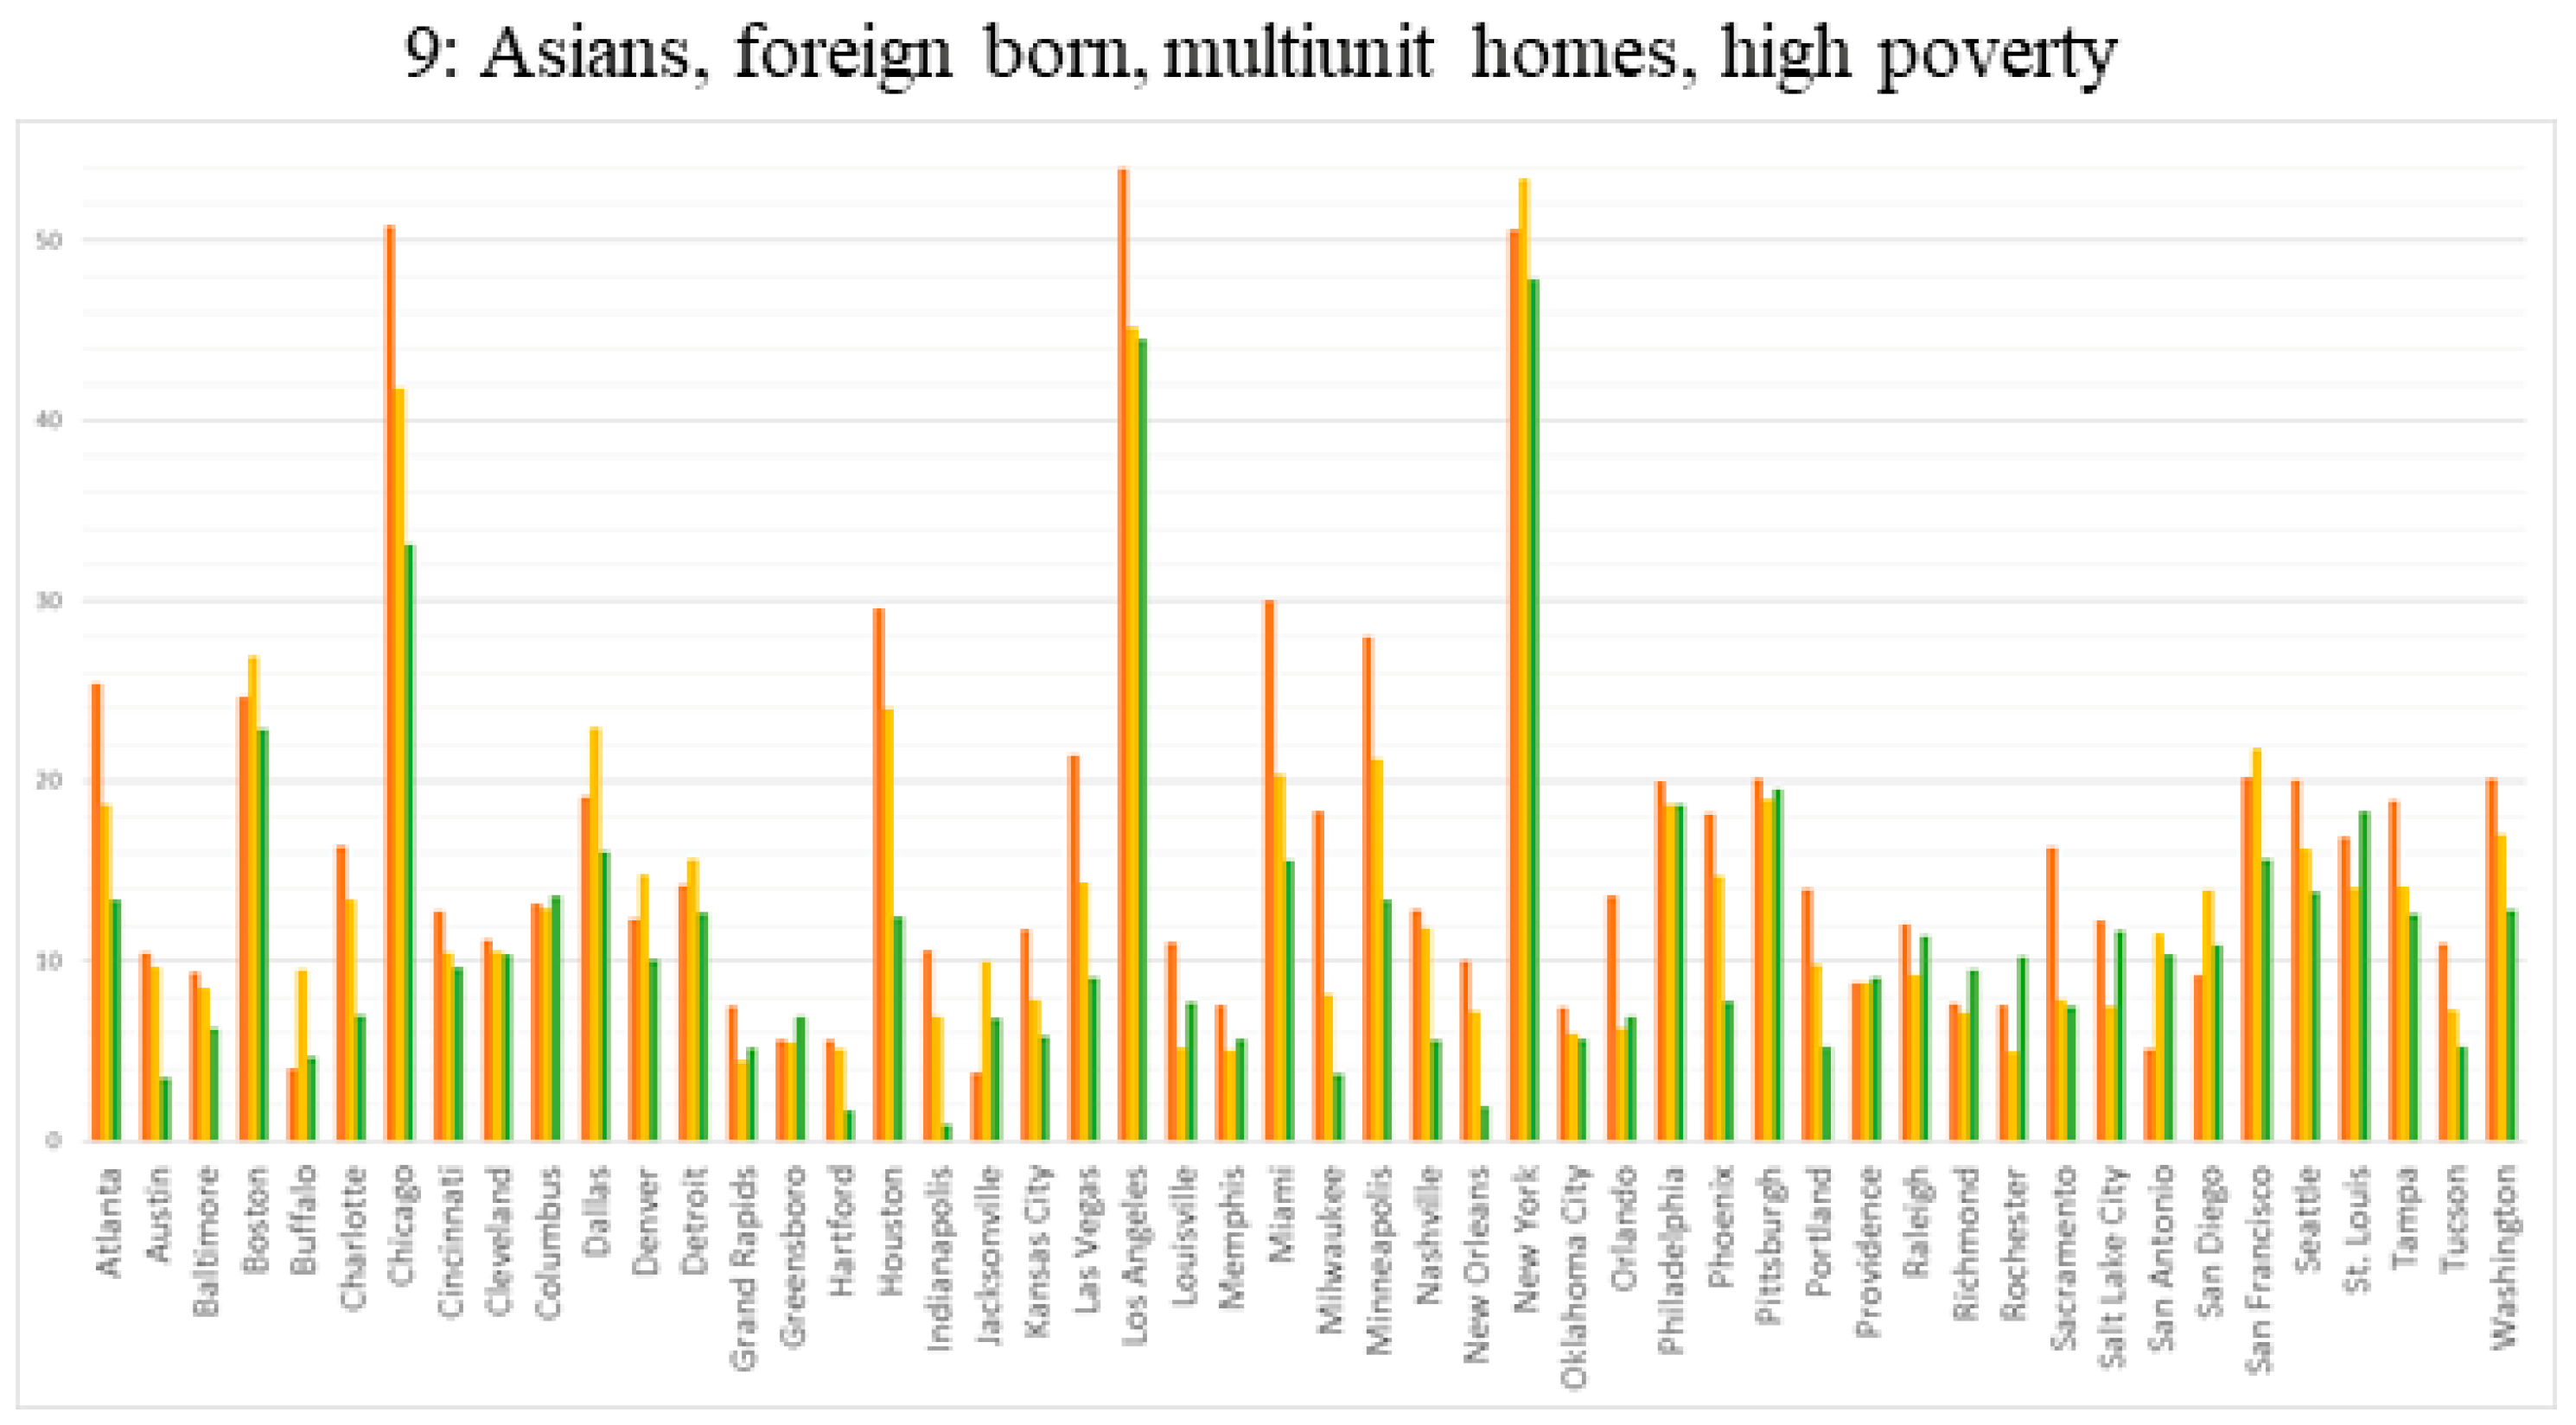
- Asians, foreign born, multiunit homes, high poverty, recent in-movers
Because a relatively large share of neighborhoods had missing values in the year 1980, this analysis begins in 1990 and continues until 2010.
3.2. Measuring Fragmentation
Prior studies have alluded to the increasingly fragmented spatial patterns of neighborhood types to describe landscape-scale urban patterns, particularly in newer and fast-growing US cities [17,18,19,20], but few, if any have actually quantified the extent to which neighborhood types are in fact fragmented versus compact. To do so, I rely on a metric commonly employed in the landscape ecology analysis of “patch” fragmentation. In this case, the unit of measurement is a connected set of Census Tracts belonging to the same neighborhood class. To obtain these so-called patches, the landscape notation for this unit, Census Tracts are dissolved so that boundaries between contiguous neighborhoods of the same class are eliminated.
To compute landscape fragmentation, edge density, a measure of shape irregularity that assesses whether a neighborhood type has a regular or complex shape with a ragged edge, is employed [24]. An increase in edge density over time implies a process involving the breakup of contiguous groups of neighborhood types, or a decline in the spatial segregation of neighborhood types [25]. Edge density is simply the total amount of edge (TE) relative to the entire urban area (TUA), ED = TE/TUA.
3.3. Spatial Clustering of Neighborhood Types
To examine which neighborhood types within each city have become more or less clustered together, I use a categorical measure of spatial autocorrelation, the join-count statistic. This statistic tests whether neighborhoods of the same class are more spatially contiguous than would be expected in a random distribution. The measurement counts the number of adjoining neighborhoods belonging to the same group and compares this value to an expected number based on the observed number of neighborhoods belonging to that class. A z-score compares the observed number of ‘joins’ to the expected number. A higher z-score indicates a greater amount of spatial clustering of like neighborhoods, while negative z-scores connote a spatial dispersion of neighborhood types. This analysis is performed for each of the 9 neighborhood classes in each city separately, for all three decades. A queen contiguity weight matrix is used to operate the spatial adjacency of neighborhood types. This analysis is performed using the spdep package in R [26].
4. Results
4.1. Landscape Fragmentation
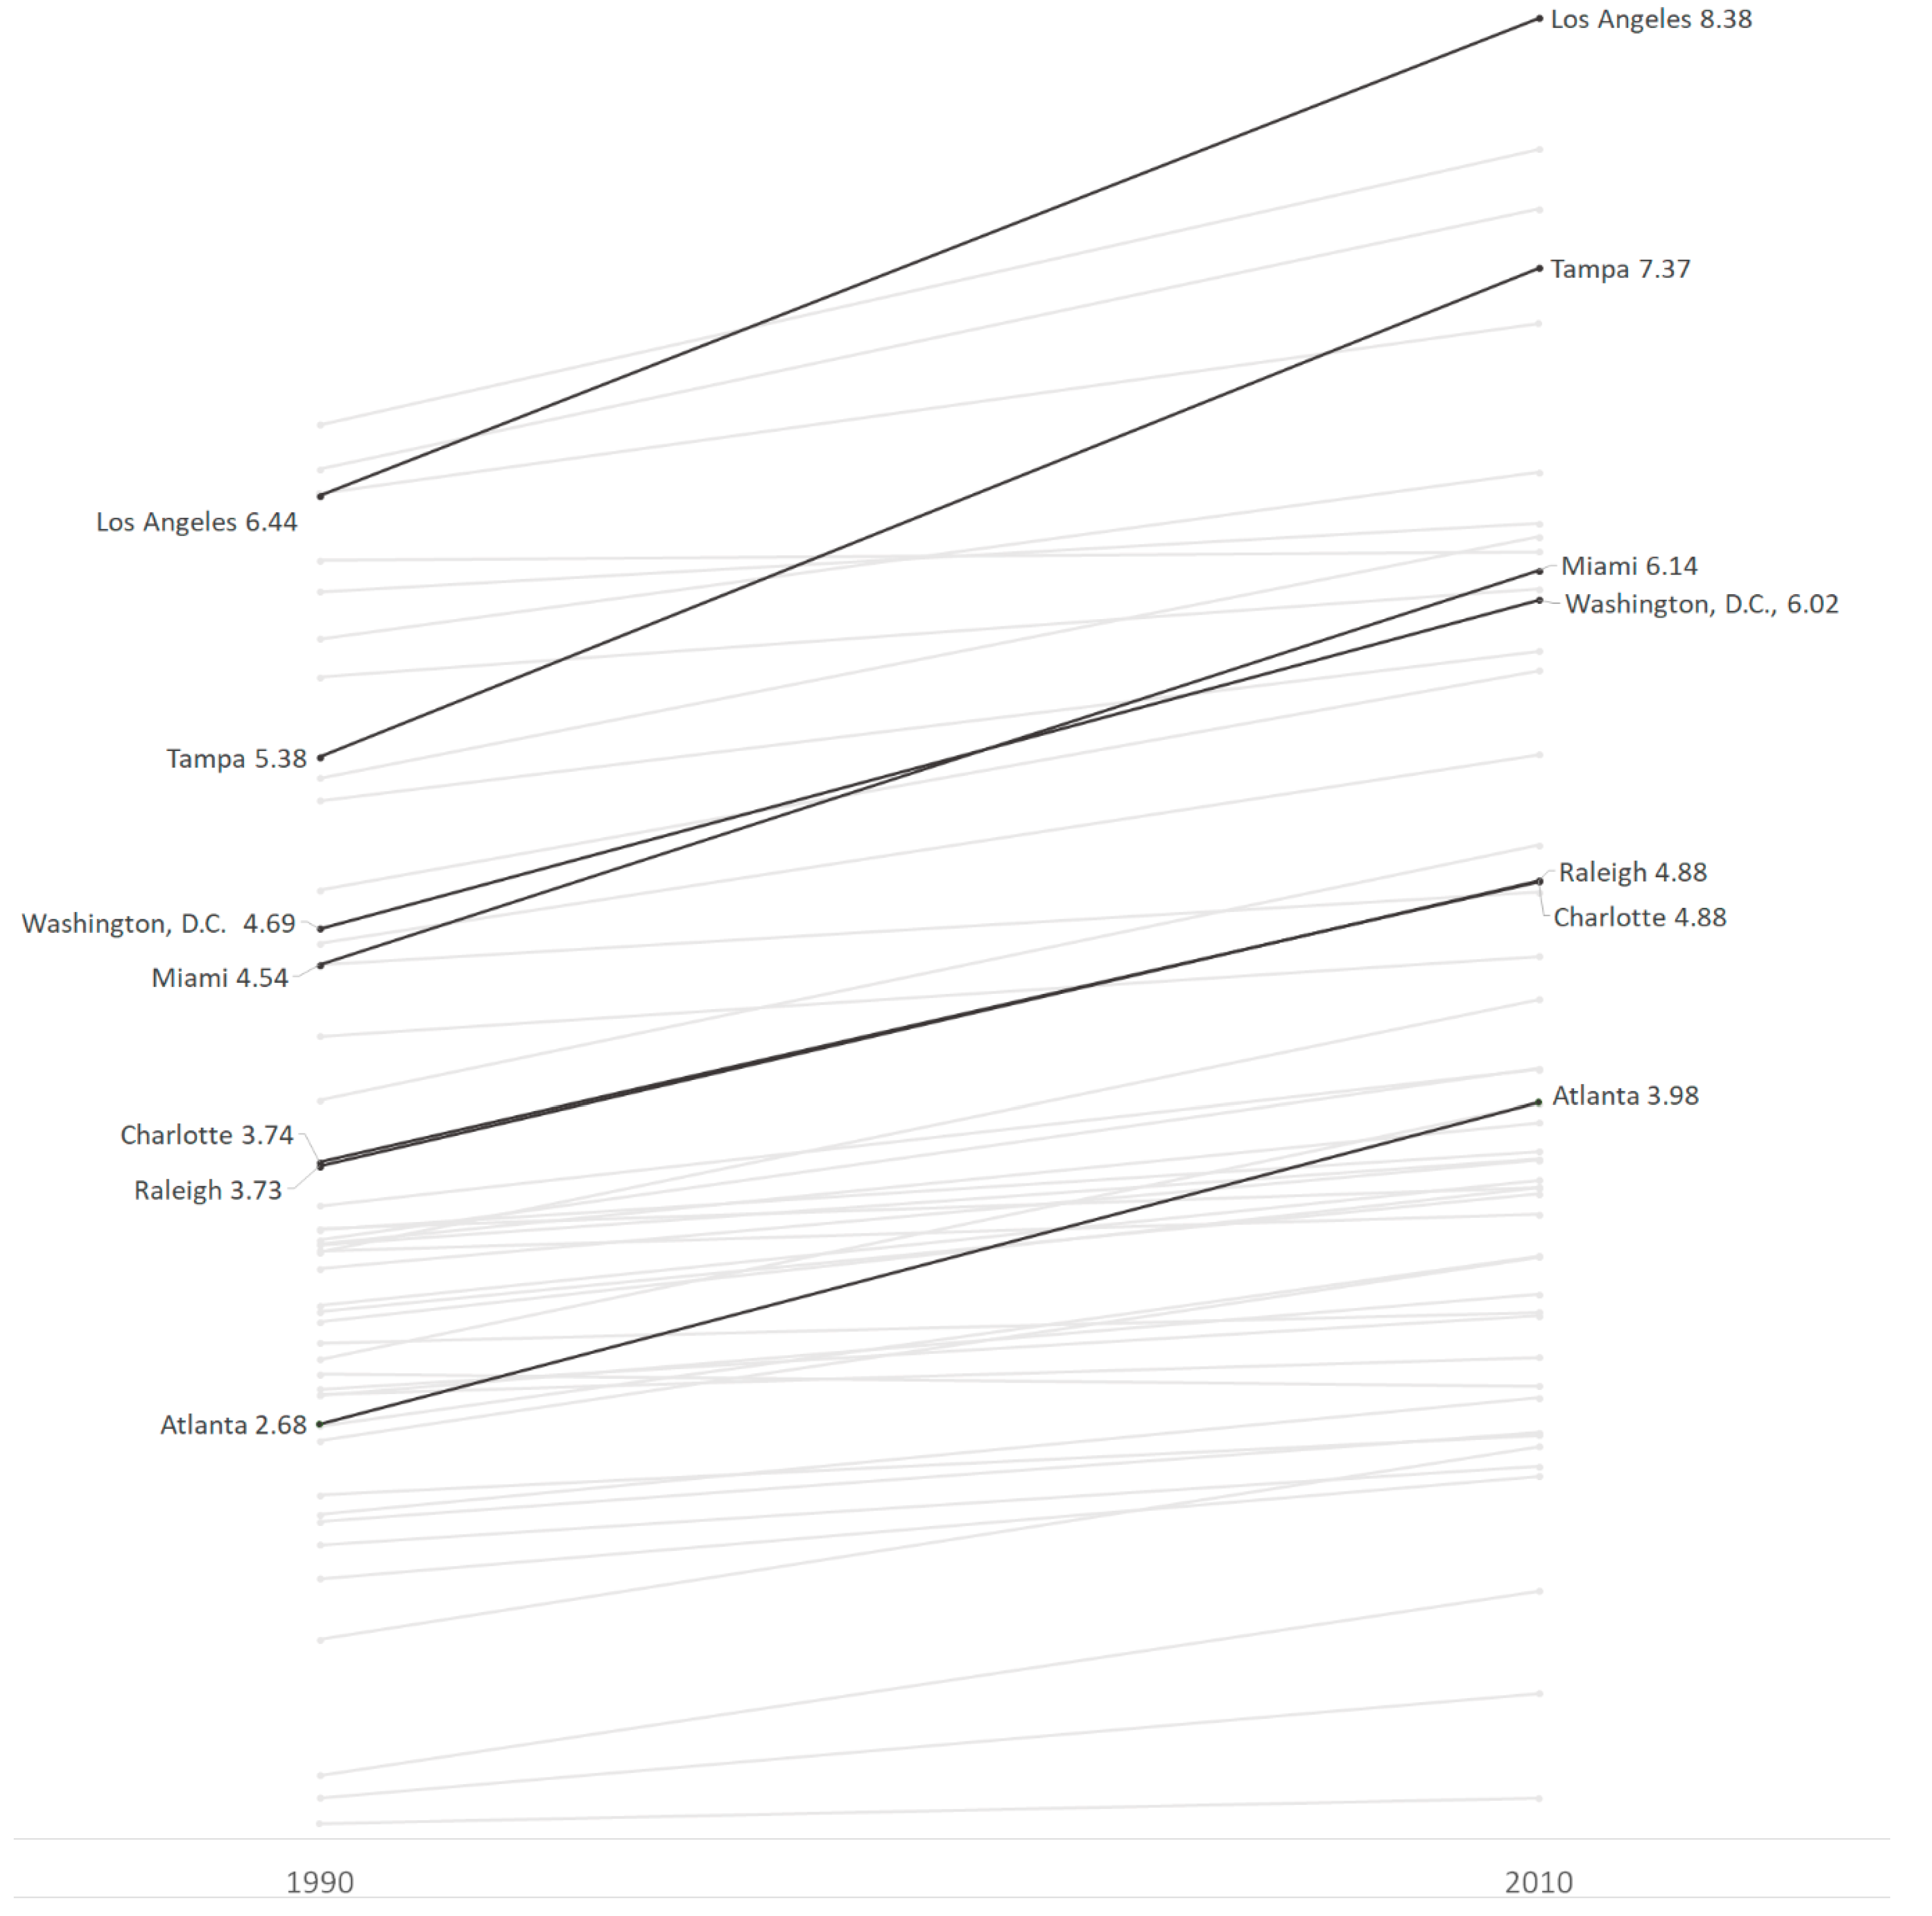
The results of the edge density analysis for 1990, 2000 and 2010 are reported in Table 1—a higher edge density value is indicative of a greater degree of fragmentation. The results show that by 2010, the Los Angeles MSA had the most fragmented urban landscape, followed by New York, San Francisco, Tampa and Philadelphia. These five cities form a top tier of fragmented cities, followed by a second group comprising Boston, Hartford, Baltimore, Providence, Miami, Cleveland, Washington, D.C., Detroit and Milwaukee. Figure 1 highlights the metro areas that witnessed the sharpest increases in fragmentation between 1990 and 2010 including Tampa, Los Angeles, Miami, Washington, D.C., Atlanta, Raleigh, Charlotte and New York. These are all cities that underwent rapid population growth during that timeframe, suggesting that as new population moves into a metropolitan area, the result is a less-ordered partitioning of neighborhood types than traditional models may suggest. Western cities that have likewise seen rapid population growth, such as Salt Lake City, Tucson and Las Vegas, continue to register as having more homogeneous swaths of neighborhood types. This is likely an artifact of larger census tracts, especially in outlying areas, as well as no natural boundaries to halt the outward expansion of new developments. In more geographically constrained areas, a greater possibility exists for redevelopment in the case of rapid population growth. Overall, however, all metropolitan areas except for New Orleans saw a rise in global fragmentation patterns between 1990 and 2010.
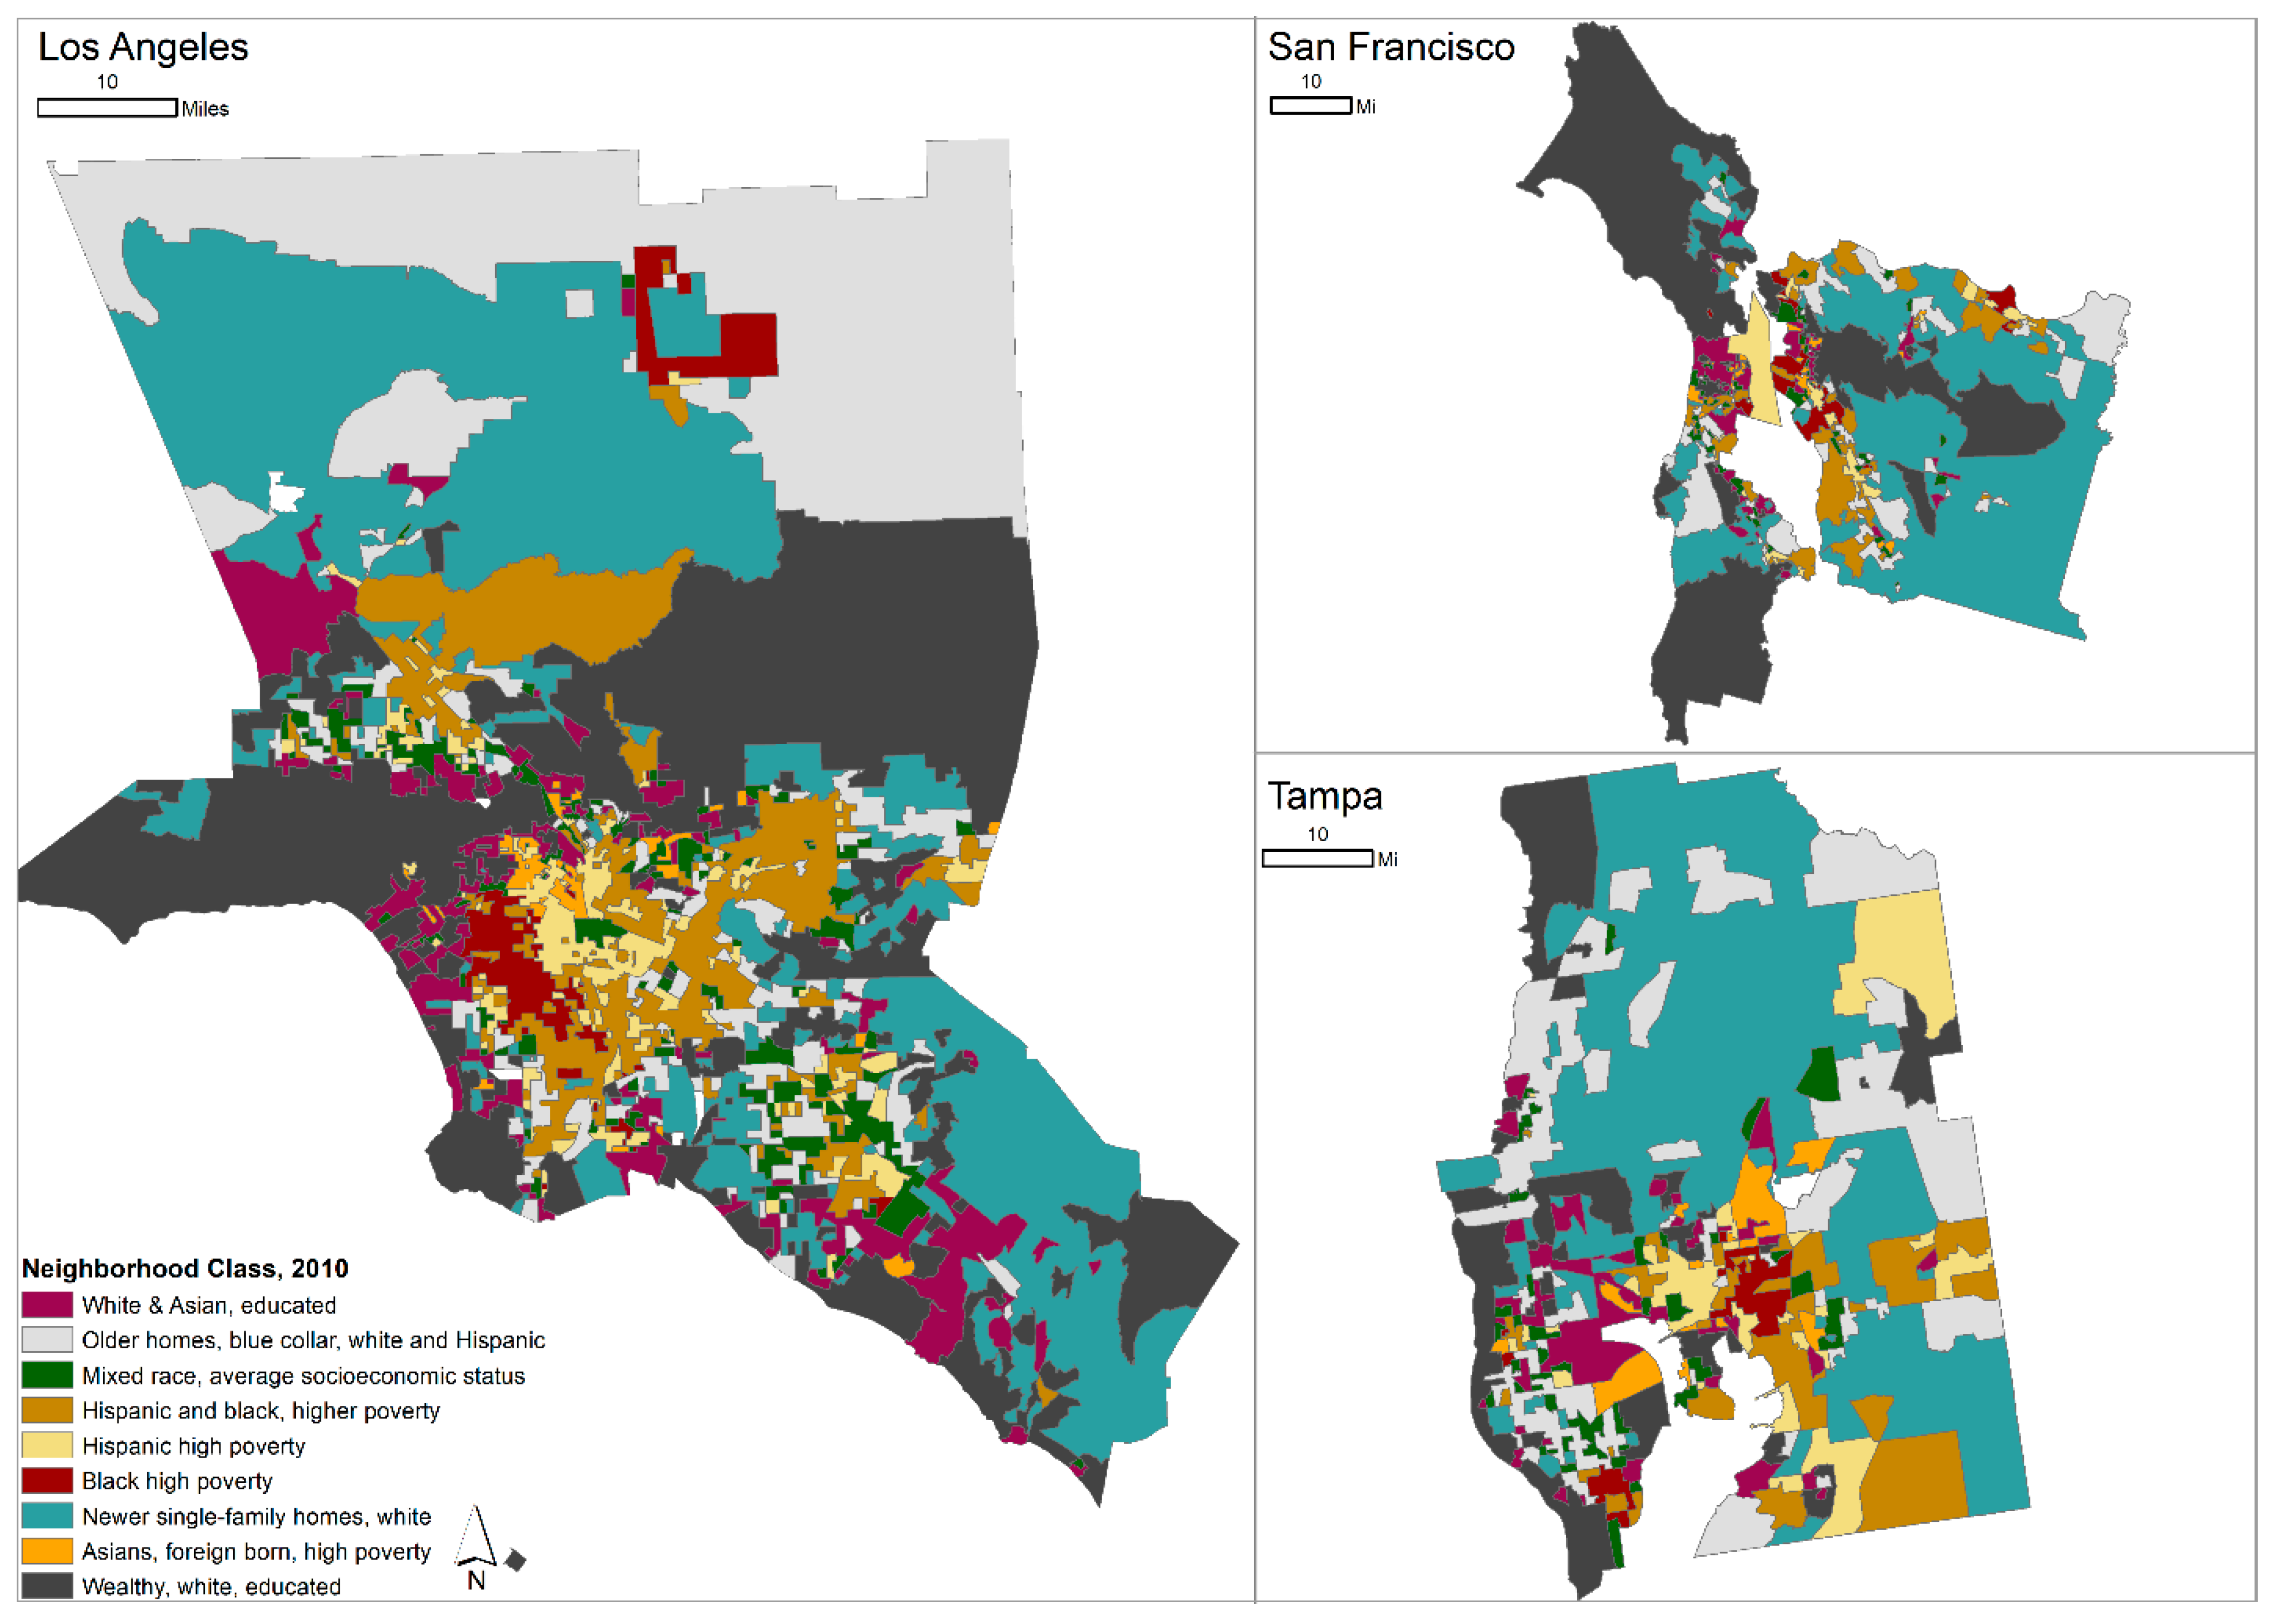
Figure 2 illustrates the spatial distribution of three of the most fragmented urban areas in 2010: Los Angeles, the most fragmented, San Francisco, the third, and Tampa, the metro area that saw the greatest increase in fragmentation. Indeed, these maps bear little resemblance to textbook illustrations of traditional models of urban form; rather, a complex intermixing of neighborhood types is present. In the case of San Francisco and Tampa, the presence of water bodies further obfuscates the spatial landscape.
4.2. Spatial Clustering of Neighborhood Types
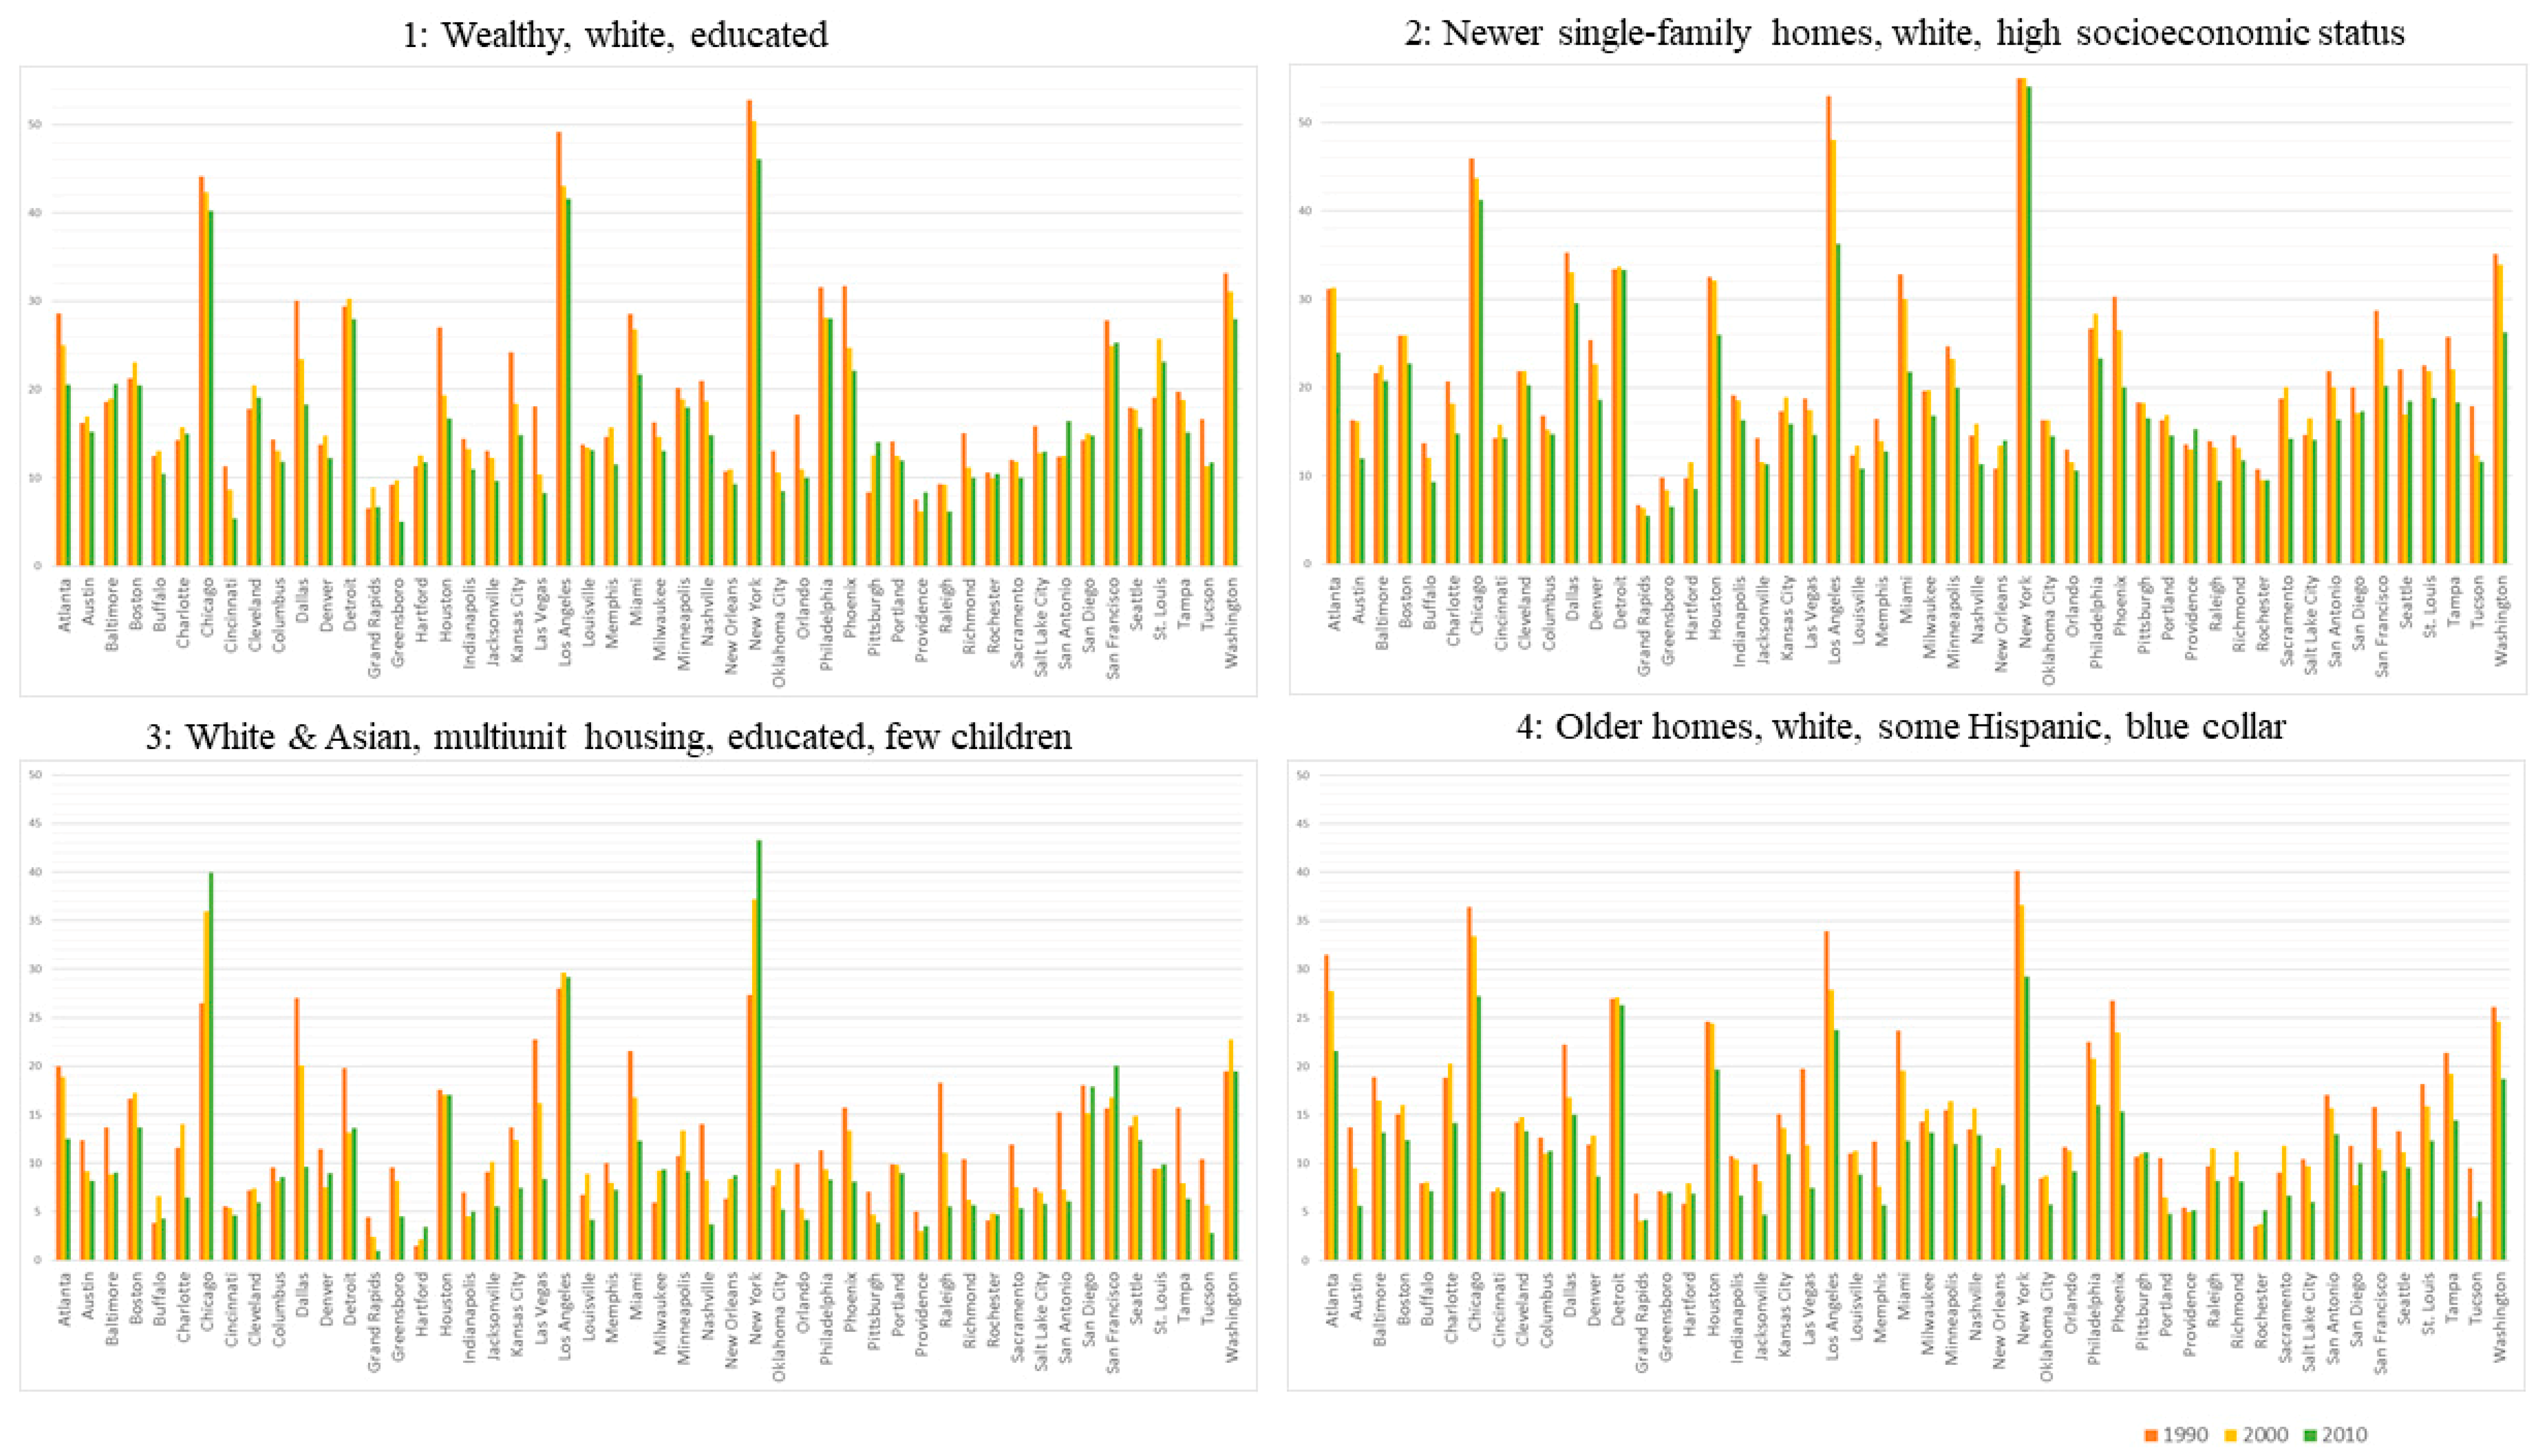
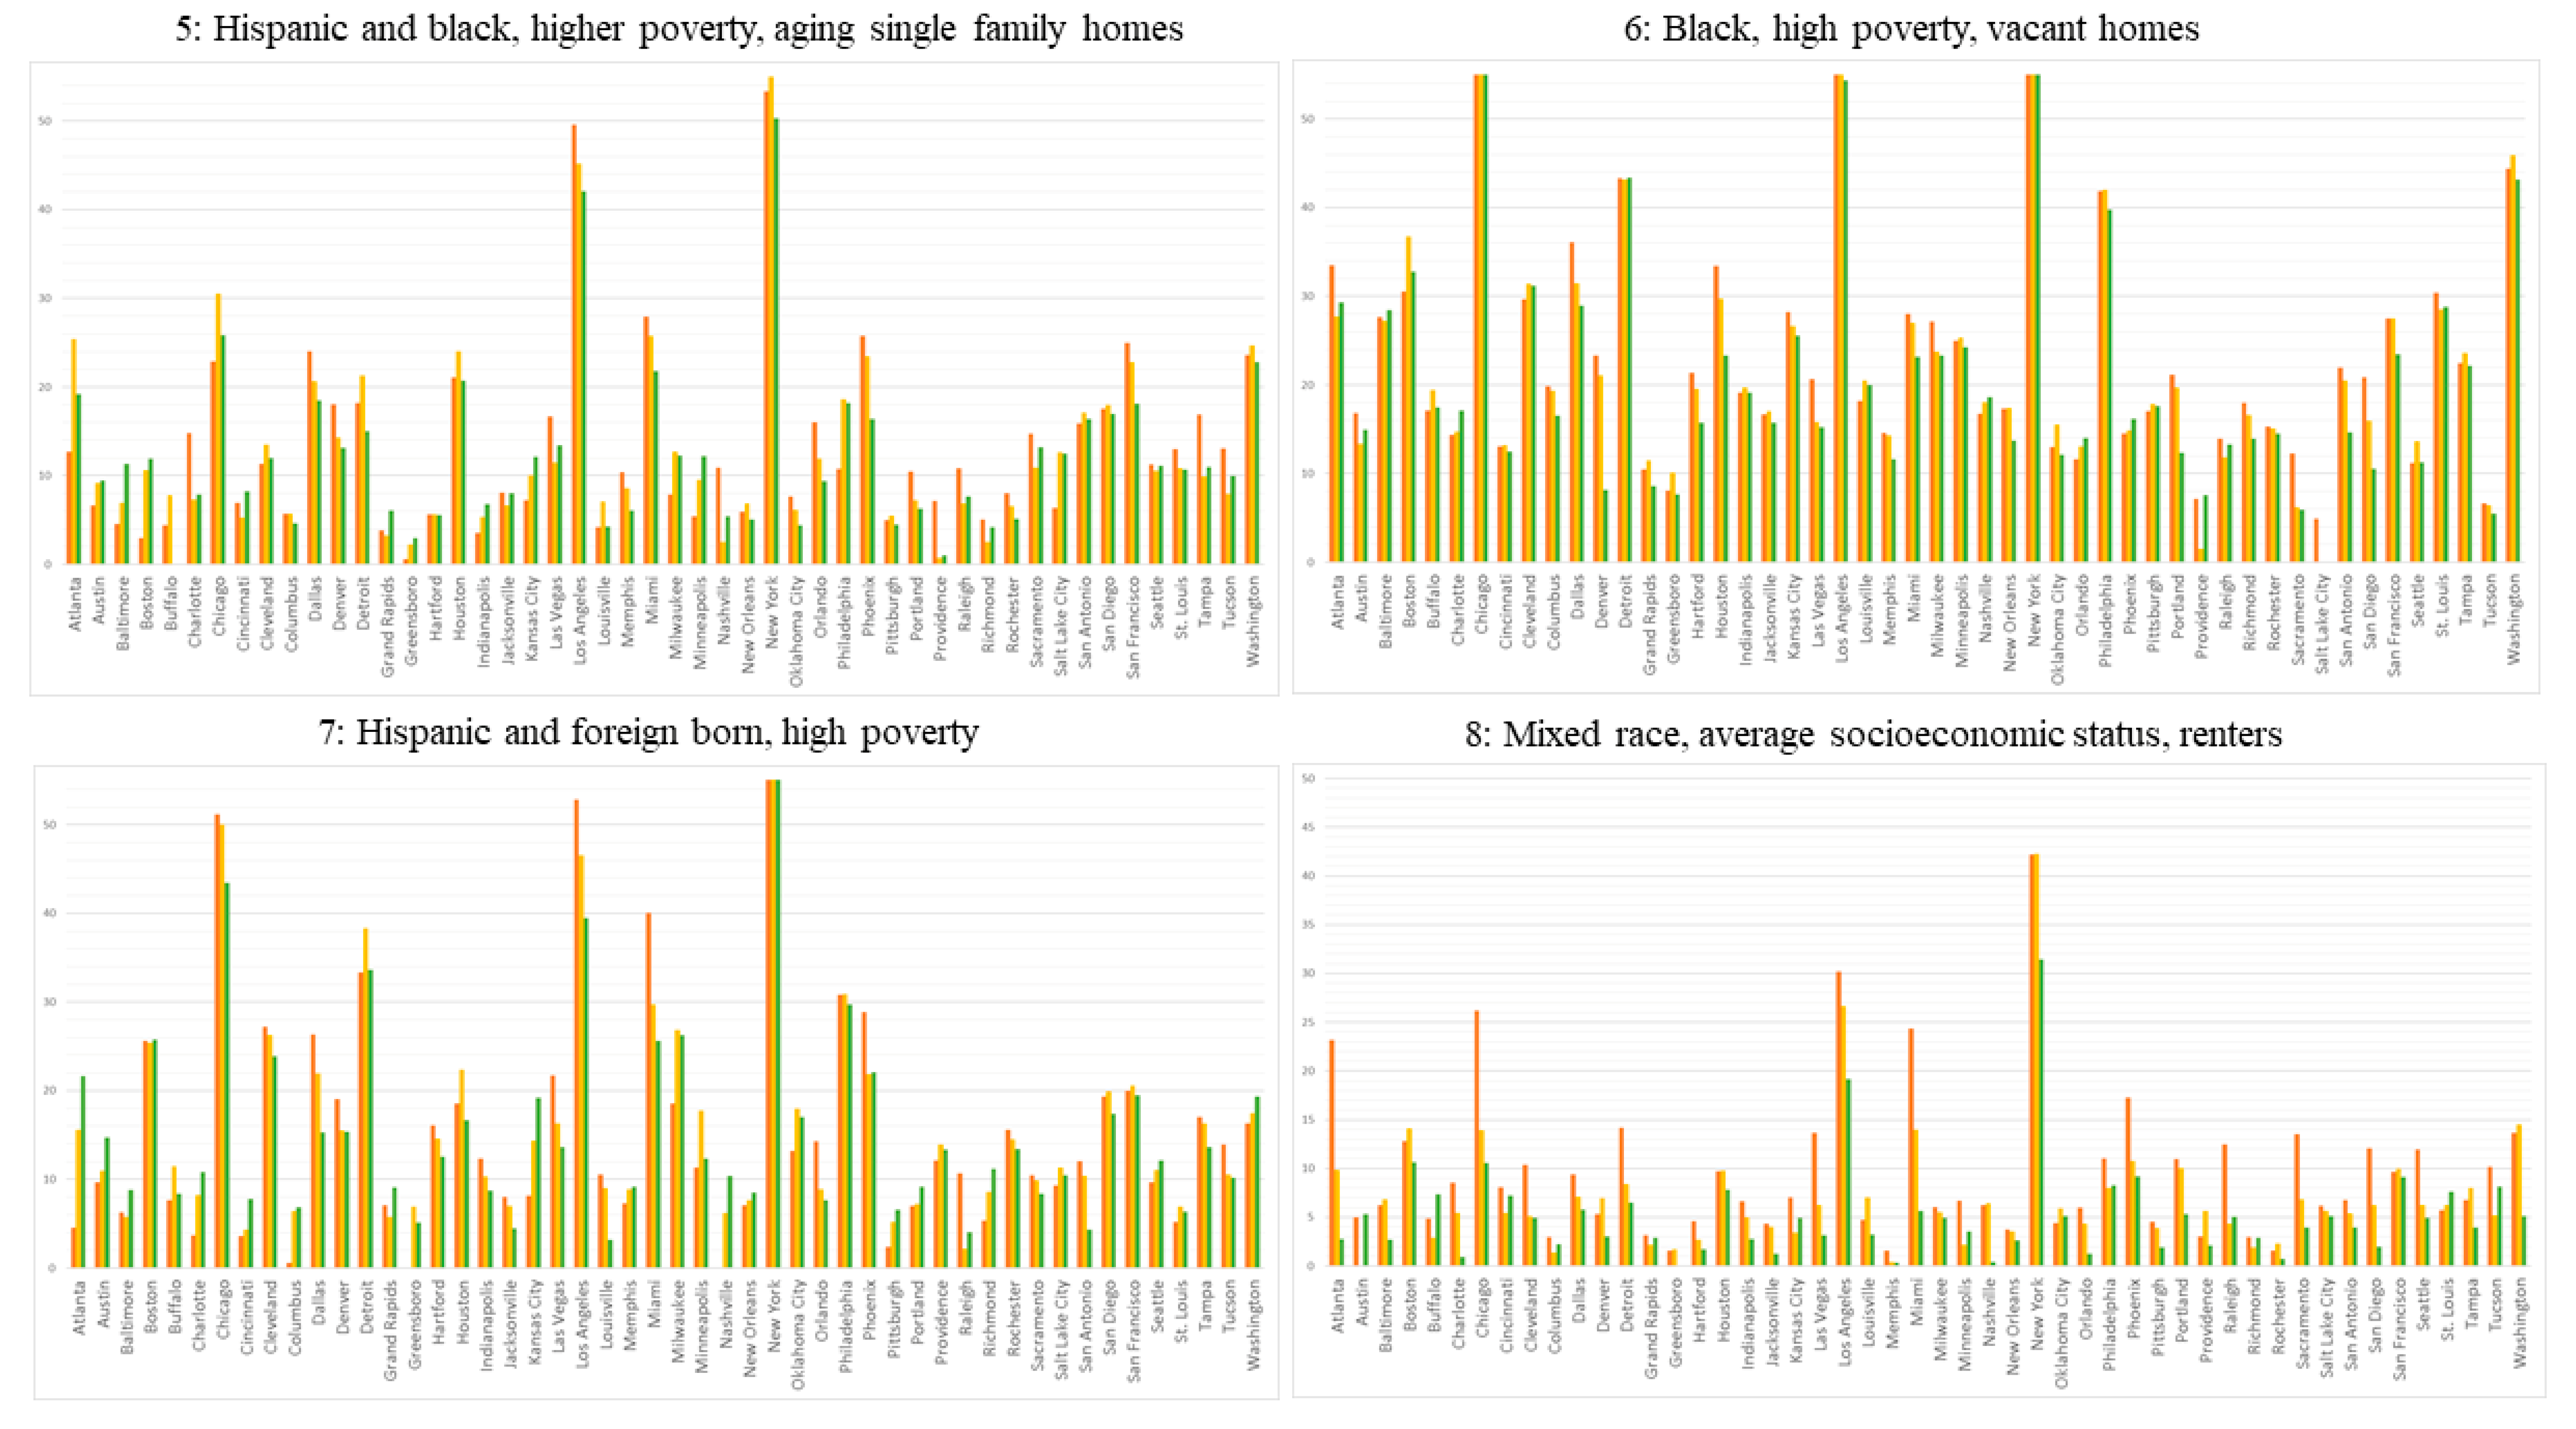
The previous analysis examined the overall fragmentation of metropolitan areas. This analysis more closely examines which neighborhood types in each city have changed in regards to their spatial clustering. Results of the spatial clustering by neighborhood type for each city, over time, are visualized in the graphs in Figure 3, Figure 4 and Figure 5. A general trend visible in these results is a decline in the spatial clustering of many neighborhood types in cities over time, supporting the aggregate findings of the previous analysis. When probing the results in more detail, several interesting observations emerge.
In the case of Los Angeles, which had the highest overall spatial fragmentation of neighborhood types, the spatial clustering of each type of neighborhood has generally declined over time with the exception of two: the high-poverty black neighborhoods (neighborhood type 6) and the white and Asian, highly educated group with high home values and a large share of multifamily housing (neighborhood type 3) whose spatial concentration has generally remained persistent through time. Outside of these opposite pockets of socioeconomic advantage or disadvantage, the spatial pattern of neighborhood types has become less concentrated and more intermixed. This is true for other types of higher-poverty neighborhoods as well, such as the class dominated by Hispanics, and those with a high share of first-generation and largely Asian residents. Like Los Angeles, both New York and Chicago also saw an increase in the young, educated and high-home-value neighborhood type, while the high-poverty black neighborhoods remained highly clustered. In New York, the largely Hispanic, high-poverty group (cluster 7) also saw a steadily high level of spatial clustering. Collectively, these results show that in the example of these large “superstar” cities [26], while overall metropolitan-wide patterns of fragmentation have been on the rise, the spatial clustering of particular neighborhood types reveals stark patterns of persistent and growing spatial inequality. New York, the second most fragmented city, saw increasing spatial concentrations of the highly educated, white and Asian type (type 3) and steadily high spatial concentrations of racially concentrated poverty neighborhoods (types 6 and 7). Spatial fragmentation was then driven by declines in the more moderate-income, and racially mixed neighborhood types.
The aforementioned dynamics for Chicago, Los Angeles and New York are largely echoed in the findings for each neighborhood type, for all 50 MSAs. The black, high-poverty neighborhood class (type 6) saw little-to-no spatial deconcentrating over time, even as cities more globally became spatially intermixed. The group defined by white and Asian, multiunit housing, educated and few children (class 3) saw opposing dynamics depending on the type of city in which it was present. In large cities mentioned above, they tended to increase in spatial concentration, but in newer, faster-growing cities, they saw steep declines in their spatial concentration. In the analysis of the dynamics behind these neighborhood types, Delmelle [22] noted that the transformation of this particular class featured two distinct processes: one more akin to traditional notions of gentrification where previously economically disadvantaged neighborhoods made the transition into this group, and the second was a transition from more traditional single-family, suburban-type neighborhoods. The former of these processes was more common in older and larger cities, whereas the latter was more prevalent in new, fast-growing western and southern cities. This second type of transformation was identified as a new suburbanist type of development. Here we find that this neighborhood class in cities such as Atlanta, Dallas, Las Vegas, Nashville, Phoenix, Raleigh, Richmond and San Antonio saw steep declines in spatial concentration. Likewise, traditional single-family suburban neighborhoods (class 2) also became spatially deconcentrated in these cities over time. Taken together, these patterns point to the breaking up of traditional single-family suburbs, particularly, in newer, growing cities.
5. Discussion and Conclusions
This analysis has examined the spatial fragmentation of neighborhoods as classified according to their socioeconomic, racial and housing characteristics in the 50 largest metropolitan areas in the United States from 1990–2010. Results underscore an increasingly fragmented sociospatial landscape, with Los Angeles emerging as the most fragmented of all. In some ways, this supports the idea that while Los Angeles is exceptional in the extent and growth of its fragmentation, the majority of all large metropolitan areas in the United States are following this trend, but not to the same degree. While others have qualitatively described these patterns [17,18,19,20], this analysis has provided a complementary quantitative analysis of observed trends. Increases in fragmentation are consistent with Florida and Adler’s [17] suggestion of a patchwork metropolis in an analysis of 12 US metropolitan areas, and find further support with Beveridge’s [12] idea that new population growth and development does not necessary occur in an ordered and regular pattern, as suggested by Chicago school theorists. Rather, newer patterns of settlement are increasingly intermixed and random, particularly in comparison to cities formed and analyzed when initial Chicago school theories were developed.
While metropolitan-wide patterns of fragmentation have largely been on the rise, spatial patterns of specific neighborhood types are indicative that these trends are not uniform across all types of neighborhoods. In this analysis, increasing spatial clusters of wealth and racially based poverty were apparent in large and growing cities including Chicago, New York and Los Angeles. Across the country, spatial clusters of high-poverty black neighborhoods remained the most persistent through time, compared to all other neighborhood types.
A decline in the spatial concentration of largely white, single-family home, upper-middle class neighborhoods supports a growing awareness of the change in how traditional suburbs are formed [26]. The locations of newer, affluent multi-family neighborhoods containing highly educated and largely childless residents also became increasingly spatially dispersed through time, most notably in newer, fast-growing southern and western cities. Thus, while the ‘Great Inversion Hypothesis’ [10] suggests an attractive alternative to explain the reversal of Chicago school ordered landscapes reflecting changes in residential preferences and national demographic shifts toward a greater demand for urban lifestyles, the reality is more nuanced. Urban-like multifamily and multiethnic neighborhoods are a progressively dispersed neighborhood type found throughout metropolitan areas. The hypothesized shifts are not occurring in a regular reversal of traditional patterns, they are occurring in a more randomized manner, closer to those described by Los Angeles school advocates.
Beyond a theoretical discussion, this empirical analysis has implications that extend to the broader trends in urban science and analytics. As this emerging discipline embraces the data deluge available for analyzing and describing cities, it has largely favored an analytical approach that seeks to identify broad trends, patterns and regularities in cities, often at the expense of the particular or individual [27]. As this analysis suggests with respect to the socioeconomic, housing and demographic landscape, the urban environment is decreasing in the strength of its broad spatial patterns, and thus the quest to uncover such order may no longer be as relevant as analyses that focus on the aberration from patterns including the lack of or reversal in spatial autocorrelation. In agreement with [17], the importance of space in an abstract sense regarding the distribution of social, demographic and housing types is less important than other explanatory factors for determining where growth occurs and from whom. Future research may therefore emphasize these elements of the metropolitan environment which may or may not have a clear spatial pattern. Research questions, tools and techniques should recognize this reality and examine the implications of such trends shaping society.
Funding
This research received no external funding.
Conflicts of Interest
The author declares no conflict of interest.
References
- Burgess, E.W. The growth of the city. In The City; Park, R.E., Burgess, E.W., McKenzie, R., Eds.; University of Chicago Press: Chicago, IL, USA, 1925. [Google Scholar]
- Hoyt, H. One Hundred Years of Land Values in Chicago: The Relationship of the Growth of Chicago and the Rise in Its Land Values, 1830–1933; University of Chicago Press: Chicago, IL, USA, 1933. [Google Scholar]
- Harris, C.D.; Ullman, E.L. The nature of cities. Ann. Am. Acad. Polit. Soc. Sci. 1945, 242, 7–17. [Google Scholar] [CrossRef]
- Harris, R.; Lewis, R. Constructing a fault (y) zone: Misrepresentations of American cities and suburbs, 1900–1950. Ann. Assoc. Am. Geogr. 1998, 88, 622–639. [Google Scholar] [CrossRef]
- Conzen, M.P.; Greene, R.P. Introduction—All the world is not Los Angeles, nor Chicago: Paradigms, schools, archetypes, and the urban process. Urban Geogr. 2008, 29, 97–100. [Google Scholar] [CrossRef]
- Dear, M.; Burridge, A.; Marolt, P.; Peters, J.; Seymour, M. Critical Responses to the Los Angeles School of Urbanism. Urban Geogr. 2008, 29, 101–112. [Google Scholar] [CrossRef]
- Shearmur, R. Chicago and LA: A clash of epistemologies. Urban Geogr. 2008, 29, 167–176. [Google Scholar] [CrossRef]
- Mollenkopf, J. School is out: The case of New York City. Urban Aff. Rev. 2008, 44, 239–265. [Google Scholar] [CrossRef]
- Harris, R. Using Toronto to explore three suburban stereotypes, and vice versa. Environ. Plan. A 2015, 47, 30–49. [Google Scholar] [CrossRef]
- Ehrenhalt, A. The Great Inversion and the Future of the American City; Vintage Books: New York, NY, USA, 2012. [Google Scholar]
- Halle, D. New York and Los Angeles: Politics, Society, and Culture—A Comparative View; University of Chicago Press: Chicago, IL, USA, 2003. [Google Scholar]
- Beveridge, A. Commonalities and contrasts in the development of major United States urban areas: A spatial and temporal analysis from 1910–2000. In Navigating Time and Space in Population Studies; Gutmann, M., Deane, G., Merchant, E., Sylvester, K., Eds.; Springer: Amsterdam, The Netherlands, 2011; pp. 185–216. [Google Scholar]
- Fogelson, R.M. The Fragmented Metropolis: Los Angeles, 1850–1930; University of California Press: Berkeley, CA, USA, 1967. [Google Scholar]
- Hackworth, J. Emergent urban forms, or emergent post-modernisms? A comparison of large US metropolitan areas. Urban Geogr. 2015, 26, 484–519. [Google Scholar] [CrossRef]
- Shearmur, R.; Charron, M. From Chicago to LA and Back Again: A Chicago-Inspired Quantitative Analysis of Income Distribution in Montreal. Prof. Geogr. 2004, 56, 109–126. [Google Scholar]
- Meyer, W.B.; Esposito, C.R. Burgess and Hoyt in Los Angeles: Testing the Chicago models in an automotive-age American city. Urban Geogr. 2015, 36, 314–325. [Google Scholar] [CrossRef]
- Florida, R.; Adler, P. The patchwork metropolis: The morphology of the divided postindustrial city. J. Urban Aff. 2018, 40, 609–624. [Google Scholar] [CrossRef]
- Delmelle, E.C. Mapping the DNA of Urban Neighborhoods: Clustering Longitudinal Sequences of Neighborhood Socioeconomic Change. Ann. Am. Assoc. Geogr. 2016, 106, 36–56. [Google Scholar] [CrossRef]
- Foote, N.; Walter, R. Neighborhood and socioeconomic change in emerging megapolitan nodes: Tracking shifting social geographies in three rapidly growing United States metropolitan areas, 1980–2010. Urban Geogr. 2016, 1–28. [Google Scholar] [CrossRef]
- Delmelle, E.C. Five decades of neighborhood classifications and their transitions: A comparison of four US cities, 1970–2010. Appl. Geogr. 2015, 57, 1–11. [Google Scholar] [CrossRef]
- Harris, R. Amnesia and myopia: History and theory in Los Angeles. J. Urban Hist. 2000, 26, 669–678. [Google Scholar] [CrossRef]
- Delmelle, E.C. Differentiating pathways of neighborhood change in 50 US metropolitan areas. Environ. Plan. A 2017, 49, 2402–2424. [Google Scholar] [CrossRef]
- Neighborhood Pathways. Available online: https://www.arcgis.com/home/item.html?id=58d32b16f1af4cf59a4940d364f37658#overview (accessed on 14 December 2018).
- Reis, J.P.; Silva, E.A.; Pinho, P. Spatial metrics to study urban patterns in growing and shrinking cities. Urban Geogr. 2016, 37, 246–271. [Google Scholar] [CrossRef]
- Crews, K.A.; Peralvo, M.F. Segregation and fragmentation: Extending landscape ecology and pattern metrics analysis to spatial demography. Popul. Res. Policy Rev. 2008, 27, 65–88. [Google Scholar] [CrossRef]
- Florida, R. The New Urban Crisis; Basic Books: New York, NY, USA, 2017. [Google Scholar]
- Schwanen, T. Geographies of transport II: Reconciling the general and the particular. Prog. Hum. Geogr. 2017, 41, 355–364. [Google Scholar] [CrossRef]
Figure 1.
Change in the fragmentation of neighborhood types from 1990 to 2010. The steepest slopes are shown in bold.
Figure 1.
Change in the fragmentation of neighborhood types from 1990 to 2010. The steepest slopes are shown in bold.

Figure 2.
2010 spatial distribution of neighborhood types in Los Angeles, San Francisco and Tampa.

Figure 3.
Spatial clustering of neighborhood types 1–4 for 50 MSAs, 1990–2010.

Figure 4.
Spatial clustering of neighborhood types 5–8 for 50 MSAs, 1990–2010.

Figure 5.
Spatial clustering of neighborhood type 9 for 50 MSAs, 1990–2010.


Table 1.
Edge density of 50 largest Metropolitan Statistical Areas (MSAs), 1990, 2000, 2010. Sorted by largest 2010 value.
Table 1.
Edge density of 50 largest Metropolitan Statistical Areas (MSAs), 1990, 2000, 2010. Sorted by largest 2010 value.
| City | Edge Density 1990 | Edge Density 2000 | Edge Density 2010 | Change 1990–2010 |
|---|---|---|---|---|
| Los Angeles | 6.44 | 7.44 | 8.38 | 1.94 |
| New York | 6.73 | 6.96 | 7.85 | 1.12 |
| San Francisco | 6.55 | 6.93 | 7.60 | 1.05 |
| Tampa | 5.38 | 6.39 | 7.37 | 1.98 |
| Philadelphia | 6.45 | 6.73 | 7.14 | 0.69 |
| Boston | 5.86 | 5.92 | 6.54 | 0.67 |
| Hartford | 6.05 | 5.64 | 6.33 | 0.28 |
| Baltimore | 5.30 | 5.85 | 6.28 | 0.98 |
| Providence | 6.18 | 6.40 | 6.21 | 0.03 |
| Miami | 4.54 | 5.09 | 6.14 | 1.60 |
| Cleveland | 5.71 | 6.18 | 6.06 | 0.36 |
| Washington, D.C. | 4.69 | 5.04 | 6.02 | 1.33 |
| Detroit | 5.21 | 5.70 | 5.81 | 0.61 |
| Milwaukee | 4.84 | 4.95 | 5.73 | 0.89 |
| Buffalo | 4.63 | 4.69 | 5.39 | 0.77 |
| Chicago | 3.99 | 4.53 | 5.02 | 1.03 |
| Raleigh | 3.73 | 3.71 | 4.88 | 1.16 |
| Charlotte | 3.74 | 4.15 | 4.88 | 1.13 |
| Pittsburgh | 4.54 | 4.49 | 4.84 | 0.29 |
| Cincinnati | 4.25 | 4.30 | 4.57 | 0.32 |
| Dallas | 3.38 | 3.82 | 4.40 | 1.02 |
| Orlando | 3.43 | 3.99 | 4.12 | 0.69 |
| Greensboro | 3.57 | 3.80 | 4.12 | 0.55 |
| Atlanta | 2.68 | 3.15 | 3.98 | 1.30 |
| Jacksonville | 2.94 | 3.51 | 3.98 | 1.04 |
| Houston | 3.41 | 3.48 | 3.90 | 0.49 |
| San Diego | 3.47 | 4.11 | 3.78 | 0.32 |
| Minneapolis | 3.41 | 3.58 | 3.76 | 0.35 |
| Seattle | 3.31 | 3.73 | 3.75 | 0.44 |
| Columbus | 3.16 | 3.59 | 3.67 | 0.51 |
| Rochester | 3.47 | 3.57 | 3.64 | 0.17 |
| Austin | 3.09 | 3.10 | 3.64 | 0.55 |
| Louisville | 3.13 | 2.94 | 3.61 | 0.48 |
| Sacramento | 3.38 | 3.32 | 3.53 | 0.15 |
| Nashville | 2.67 | 2.67 | 3.36 | 0.69 |
| Memphis | 2.61 | 3.09 | 3.36 | 0.74 |
| Indianapolis | 2.80 | 2.83 | 3.21 | 0.41 |
| Richmond | 3.01 | 2.85 | 3.13 | 0.12 |
| Portland | 2.82 | 2.84 | 3.12 | 0.30 |
| Grand Rapids | 2.80 | 2.91 | 2.95 | 0.15 |
| New Orleans | 2.88 | 2.68 | 2.83 | -0.05 |
| St. Louis | 2.31 | 2.54 | 2.79 | 0.47 |
| Oklahoma City | 2.28 | 2.42 | 2.64 | 0.36 |
| Kansas City | 2.39 | 2.55 | 2.64 | 0.24 |
| Phoenix | 1.81 | 1.99 | 2.59 | 0.78 |
| San Antonio | 2.19 | 2.41 | 2.51 | 0.32 |
| Denver | 2.05 | 2.18 | 2.47 | 0.41 |
| Las Vegas | 1.26 | 1.90 | 2.00 | 0.75 |
| Tucson | 1.17 | 1.47 | 1.59 | 0.42 |
| Salt Lake City | 1.06 | 1.01 | 1.16 | 0.10 |
© 2019 by the author. Licensee MDPI, Basel, Switzerland. This article is an open access article distributed under the terms and conditions of the Creative Commons Attribution (CC BY) license (http://creativecommons.org/licenses/by/4.0/).
Share and Cite
MDPI and ACS Style
Delmelle, E.C. The Increasing Sociospatial Fragmentation of Urban America. Urban Sci. 2019, 3, 9. https://doi.org/10.3390/urbansci3010009
AMA Style
Delmelle EC. The Increasing Sociospatial Fragmentation of Urban America. Urban Science. 2019; 3(1):9. https://doi.org/10.3390/urbansci3010009
Chicago/Turabian StyleDelmelle, Elizabeth C. 2019. "The Increasing Sociospatial Fragmentation of Urban America" Urban Science 3, no. 1: 9. https://doi.org/10.3390/urbansci3010009