
Metropolitan Innovation in the New Economy

1
School of Geography and Development, University of Arizona, Tucson, AZ 85721, USA
2
Department of Geography and Planning and the Urban Affairs Centre, University of Toledo, Toledo, OH 43606, USA
3
Spatially Integrated Social Sciences Program, University of Toledo, Toledo, OH 43605, USA
*
Author to whom correspondence should be addressed.
Urban Sci. 2017, 1(2), 18; https://doi.org/10.3390/urbansci1020018
Submission received: 20 January 2017
/
Revised: 28 April 2017
/
Accepted: 12 May 2017
/
Published: 16 May 2017
Abstract
:This paper analyzes the high-tech economies of 350-plus metropolitan areas across the U.S. during 2010. Attention is given to 20 different production attributes—including the age and education of the workforce, patent production, business startups, per capita productivity of the workers, and the like. Multivariate analysis is used to reduce these 20 attributes down to 10 orthogonal dimensions; then the scores on these dimensions are used to identify eight different innovation and entrepreneurial clubs. Basically the exercise deconstructs the metropolitan economies into various parts so that each economy is assigned a signature score on each of the independent factors. High-tech places, which are especially active in both patents and startups, are shown to be more heterogeneous than low-tech places. Moreover, the recent growth and change seen in many metropolitan areas appears to be associated with the incidence of very different factors: population growth has been driven by forces that are different from those that have induced either employment change or productivity growth in those metropolitan areas.
1. Introduction
During the closing decades of the twentieth century the U.S. and many other advanced nations entered a long wave of innovation-driven prosperity that has been called The New Economy [1]. While these economies experienced some remarkable changes—including the flourishing of knowledge-based industries, the deepening of global competition, and the rise of the financial sector—national economic development clearly still does not occur everywhere at the same time. In fact, there is now strong evidence that the 350-plus metropolitan regions of the U.S. have separated into two broad groups of leaders and laggards. Simply put, the cities in one group have become significantly wealthier, richer in human capital, more productive, and more innovative than those in the other group. [2], for one, believes that this sorting has already created a permanent gap in the life prospects for the nation’s tens of millions of urban residents. However, truthfully, little is known about the full implications of this recent socioeconomic division. In part this is the case because no overarching theory exists to clarify how firms and households continuously interact in order to shape the metropolitan attributes of the American space-economy [3]. Moreover, an incomplete picture still exists of the dramatic population and economic changes that have been experienced across the nation’s metropolitan landscape in recent times. So many studies of U.S. labor markets are content to rank-order the performances of metropolitan economies using one or a few measures of economic health (or success) without actually addressing the factors most responsible for the changes that are occurring in levels of economic health.
This paper, which is entirely empirical, sheds new light on the variety of innovation-driven growth that now dominates the nation’s largest labor markets. While the study itself remains cross-sectional, dealing only with the year 2010, the analysis brings together a wide array of variables reflecting those factors that are thought to drive the differential growth now being experienced in the nation’s largest urban economies. The two main purposes of the paper are: first, to reveal the underlying dimensions of this economic growth and, second, to reveal how different cities can be successful in the New Economy in very different ways. Some cities prosper largely through the formation of ideas and the generation of patents, others prosper by facilitating business start-ups and entrepreneurship, while even others ensure their continued success by being especially productive in existing industries. The paper’s analysis leads to two general findings. First, a two-way sorting process in metropolitan fortunes is entirely too simplistic, at least for a large nation like the U.S., and a more nuanced framework is needed that recognizes that metropolitan economies are sorting into a variety of distinctive innovation and entrepreneurship clubs (types). Second, there is no one single recipe or formula that ensures the continued economic success of the nation’s largest cities. In fact, adapting Tolstoy’s famous phrase, the current evidence suggests that all successful cities prosper or grow in somewhat different ways but all unsuccessful cities stagnate or decline in much the same way.
A number of private and public agencies now monitor various aspects of economic performance across the nation’s 350-plus metropolitan areas. In fact, several websites allow a chosen city to be directly compared to another city according to the most visible indicators of health in their labor markets, including unemployment rates, average wages and salaries, recent employment growth, and the like. However, during the past decade or so more and more attention is being given to the key role of innovation—a broadly applied term that captures the importance of high-tech industries and highlights those factors that serve to grow and sustain high-tech industries: knowledge, advanced skills, entrepreneurship, research and development, patent production, technology transfer, and communications infrastructure. A number of observers now argue that metropolitan areas must establish and nurture innovation ecosystems that include key actors (corporations, universities, etc.), service providers, venture capitalists, networks among the actors, and good local or regional governance [4,5]. However, outside of various case studies, we really do not have a clear idea about how the complex features of these innovation ecosystems might vary from one metropolitan center to the next.
This paper argues that a relatively small number of input and output attributes can be analyzed to give some useful insights into the variety of innovation ecosystems that currently exist across the U.S. metropolitan landscape. The intensity of these attributes, which include both patent production and entrepreneurship, not only differs from one place to another but the manner in which these attributes are combined varies by location. A total of 20 such attributes has been chosen to shed light on how these production ecosystems currently vary across the nation’s largest metropolitan areas. Using multivariate techniques, we use these diverse attributes to reveal the underlying dimensions of innovation and entrepreneurship that are most common across the metropolitan landscape. Once the primary dimension of general innovation has been identified, the other less important dimensions are examined to demonstrate how the cities variously combine their knowledgeable and educated workforces in order to produce patents, engage in entrepreneurship, and create high value-added outputs. Therefore, as a first step, the overall innovative index of each metropolitan economy has been estimated by generating its score on each of the latent dimensions and then summing up those performance scores across all of the dimensions [6].
However, this paper is more interested in exploring how those metropolitan economies are now sorting themselves into separate groups. Therefore, the analysis focuses on identifying eight distinctive types of economies—called innovation clubs—that currently persist across the nation’s metropolitan system, where special attention is given to those five clubs that exhibit innovative and entrepreneurial activity exceeding the national metropolitan average. The upcoming discussion also clarifies that the various cities assigned to a given club tend to share similarities in other aspects of metropolitan living, including ambience, housing costs, and crime. Furthermore, the locations of all cities in the five highest-performance clubs are mapped to see if there are any obvious geographic commonalities that are associated with club membership. Finally, the performance of each innovation club is examined to see how the recent population and economic growth experienced by these metropolitan economies varies with club membership.
2. Literature Review
Studies of economic growth in metropolitan areas must contend with two very broad yet interrelated questions. First, why are some urban regions consistently more creative than others? In other words, why do some cities create more ideas, knowledge, and commercial innovations than other cities and, along the same lines, why do some cities maintain more productive or high value-added industries than other cities? Second, why are the geographic spread effects of these new ideas and innovations so limited? In other words, why do not the benefits of new knowledge spread more quickly over time and over greater distances across space? Interestingly, enough, these are the same two fundamental issues that confronted the leading thinkers on regional growth—people like Albert Hirschman, Gunnar Myrdal and Francois Perroux—during the two decades after World War II.
Much of today’s widespread interest in regional growth stems from two very popular and controversial sources: first, the ideas of Michael Porter [7,8] about firm strategies and industry clusters and, second, the ideas of Richard Florida [9,10] about the so-called creative class. Porter, who acquainted many government officials and practitioners with spatial externalities, helped lead analysts back to the ideas of Jane Jacobs [11] who, decades earlier, had recognized the important role of ‘new work’ in city growth and development. Her thinking has also been strongly endorsed by Edward Glaeser [12], both in his technical and non-technical writings. Florida, in contrast, persuaded government officials and practitioners about the key role of human capital in city growth and development. His interpretation of human capital was very different from that of Paul Romer [13] and Robert Lucas [14] in economics and, in many ways, Florida’s creative class identifies people more with similar lifestyles than with similar skills. In any case, this second stream of research now recognizes that different kinds of work involve different levels of cognitive skills and that some of these skills—when translated into specific occupations—are rewarded much more lucratively than others [15,16,17]. As a result of these two broad perspectives on urban and regional growth, the post-2000 literature in economic geography and regional science has been awash with international studies addressing entrepreneurship, venture capital, learning regions, spatial knowledge spillovers, and the like (for example see [18,19,20]).
2.1. Urban Creativity
As Peter Hall [21] and others have argued, throughout history cities have always demonstrated a great amount of heterogeneity in their creativity. Hall has even suggested that while all exceptionally creative cities share some commonalities with other exceptional cities (of their time), they also exhibit their own particularities or distinctive traits. What now seems clear is that large cities have inherent advantages both in production and in consumption: urban workers are able to constantly upgrade their skills through learning externalities and talented people are attracted to large cities for both pecuniary and non-pecuniary reasons [22,23].
2.2. Innovation and Entrepreneurship
In recent times a vast literature has arisen in different disciplines to address how economic success—as measured by sustained productivity growth and job expansion—depends upon knowledge creation, new business formation, and strong institutions. Several strands of this literature are especially relevant for this paper because they shed light on how the so-called innovation-driven cities of the U.S. have managed to forge ahead of others in the New Economy. For present purposes three broad topics are briefly discussed: (i) the production and transfer of regional knowledge; (ii) entrepreneurship; and (iii) the role of networks and institutions. Most of this literature has been addressed in great detail in various chapters of several edited Handbooks [24,25,26,27].
2.2.1. Production and Transfer of Regional Knowledge
Traditional studies addressing the nature of knowledge differentiate between two broad forms: codified and tacit. In the former case knowledge can be shared easily through a common language (e.g., following instructions) while in the latter case knowledge is gained more slowly through observation, imitation, or study (e.g., interpretation). Recent studies recognize three different knowledge bases that place different weights on these codified and tacit forms. Analytical knowledge uses science and mathematics to describe features of the world, synthetic knowledge applies this knowledge in a more practical way, and symbolic knowledge uses imagery and other means to elicit emotional responses [28].
At the regional level much attention has been given to geographic variation in analytical knowledge. One overriding theme, following Jaffe [29] and Feldman [30], is that different urban regions have very different regional knowledge production functions (RKPFs). When patents are adopted as a proxy for knowledge that is both useful and new, studies invariably show that metropolitan-level patent production depends on the volume of both university and private research and that high distance decay occurs in local (within-region) knowledge transfers for both types of research [31]. Other research has addressed a variety of contextual factors, including the facilitating role of local social capital, the emergence of linkages between local research agencies, the degree of size concentration in these local agencies, and the creation of linkages between these agencies across different regions [32,33,34,35,36]. In any case, those metropolitan areas that are well represented in research universities or major research institutes are invariably more productive in new knowledge than those cities that lack these two types of research facilities [37,38]. Therefore, the presence of research agencies in cities is the main commonality that would be recognized by Peter Hall in the New Economy; on the other hand, the particularities of the various cities would include such matters as the specialization of their economic bases or the quality of their infrastructures.
But other research has led to a strong interest in symbolic knowledge. Many observers point out that this type of knowledge is especially significant for the various media and for the entertainment, advertising, and fashion industries, where interpretation and acceptance often relies on social or cultural factors [39,40]. Here the acquisition of creative skills is less tied to qualifications gained at universities or technical institutes and is more tied to lengthy experimentation or apprentice-type learning. Large cities, especially national capitals, dominate most of these imagery-based and design-rich industries, where firms must have especially nimble and competitive supply chains in order to quickly transform new ideas into valued final products.
The transfer of knowledge is also recognized to be an especially important issue—and one that requires more elaborate approaches than the simple diffusion models that were embraced years ago [41]. Various critiques have clarified the differences between knowledge that moves through spillovers and knowledge that moves instead along with the person. In the first case, tacit knowledge is either made freely available to the public or knowledge is shared by interpersonal communication—in both cases without remuneration. However, in other instances workers often move to other firms or even other regions and take their knowledge with them. This complicates matters because these workers tend to retain many of their earlier collaborative ties even though they have changed locations [42]. Network analysis is being increasingly used to reveal the nature of these connections and there is already evidence that knowledge transfers exhibit significant distance decay in both geographic and functional space [43,44]. This has implications for economic development because core urban regions do not spread their new knowledge to peripheral urban regions as quickly as public officials would like.
In fact, Tödtling and Trippl [45] suggest that the more developed nations now exhibit three broad types of urban economies. Very large cities with diversified economies and mid-sized cities with universities or research labs provide the best conditions for creating and transferring analytical and symbolic knowledge, and these places will continue to attract people who excel in either the sciences or the arts. Radical or disruptive innovations will tend to be confined to these sorts of places. Smaller, specialized industrial cities, on the other hand, tend to utilize synthetic knowledge and in these places innovations are apt to be more incremental. These cities can have high valued-added activities but often firms simply take advantage of internal scale in providing consumer goods or services. Smaller, peripheral cities are very weak in the production and transfer off all three bases of knowledge and these places usually exhibit economic distress. Public policies aimed at upgrading worker skills or improving connections to other places often fail to provide significant benefits.
2.2.2. Entrepreneurship
During the late 1990s and early 2000s many observers noted that it was new firms in emerging industries that had by far the greatest impact on regional economic growth [46]. Soon these firms were labeled high-tech and these specific industries were labeled knowledge-based. Moreover, analysts began studying in detail the regional economic ecosystems that were responsible for creating and nurturing these new firms and industries [47,48]. These studies in turn led to a renewed appreciation of the important role of entrepreneurship in affecting the varying fortunes of urban regions [49].
Stylized models of enterprise typically begin with a new business startup whose entry into the market (direct effect) heightens competition among the incumbents and initiates new capacities (indirect effects) among the survivors. Numerous observers claim these indirect effects—costs reductions, the departure of inefficient firms, new products and processes, and greater variety in goods and services—are critical because they promote competitiveness on the supply side of the market and thereby induce further economic development [50,51]. Baumol et al. [52] claim that entrepreneurial capitalism (radical innovations, marketing new products) and big-firm capitalism (incremental innovations, scale economies for old products) are both indispensable to the operation of advanced economic systems.
It is now widely recognized that entrepreneurship is affected by both supply and demand factors in local or regional labor markets. Supply-side factors include the education, experience, and age of the region’s pool of workers, and their previous acquaintanceship with start-ups; demand-side factors are more related to either the overall size of the labor market or the level of economic development enjoyed by the region or the wider nation. Increasingly, too, the role of institutions—especially rules and regulations—are seen to be critical in affecting entrepreneurial activity [53].
However, the concept of entrepreneurship remains elusive for several reasons. First, there is disagreement about its measurement (startup versus self-employment rates), although there is increased awareness that some startups, like patents, are much more important than others. Second, there is disagreement about the role of entrepreneurs in the creation of new knowledge [54,55]. In some instances, they appear to be the passive recipients of unused regional knowledge while in other cases entrepreneurs work closely with designers and inventors to bring new products to the market.
In any case entrepreneurship is widely believed to be related to the size and nature of metropolitan economies. Some industries, like construction, favor small firms and usually have high start-up rates; other industries, especially those dominated by government (e.g., education) usually have low self-employment rates. Therefore, self-employment rates are generally higher in fast-growing cities where the needs for new offices and homes are the greatest. Also, as manufacturing industries pass through their life cycles, firms tend to become larger (to apply economies of scale) and self-employment rates tend to decline, so cities with sunset industries generally have lower rates of entrepreneurship. At the same time, self-employment rates vary with certain characteristics of the metropolitan labor force, where rates are usually higher for older individuals and for those with some post-secondary education. Glaeser [56] has suggested that about one-half of the variation in entrepreneurship currently seen across U.S. metropolitan areas is due to place-to-place differences in industry mix and household characteristics. Studies from other nations endorse these findings but point out that the returns to entrepreneurship are higher in larger cities.
2.2.3. Institutions and Networks
Following the lead of economists like Acemoglu and Robinson [57], it is now widely recognized that the success of both innovation and entrepreneurship depends on the quality of institutions in the economy. Without good infrastructure, transparency, independent lending agencies, and intellectual property rights it is simply impossible for sustained economic development to take hold. In the more advanced economies many of these institutions are now spread fairly evenly over space, although some cities have been quicker to adopt new communication systems and others have been more adept at finding new funding arrangements for risky projects. Building on the earlier work of Saxenian [58], Rodriguez-Pose [59], and others, Storper et al. [5] argue that the ties established between business networks and civic networks (NGOs, community organizations, etc.) are now especially critical in determining the direction and strength of regional development. These ties can be either formal alliances or informal bridges, and both types of ties enhance the social capital available to agents operating in the metropolitan economy. Engel [4], among others, has also extolled the virtues of these ties, which serve to promote attitudes like trust and tolerance, in making regional economies more vigorous in good times and more resilient in bad times. Wolfe and Gertler [60] have even gone so far as to say that the future performances of Canadian metropolitan areas will depend upon the density and diversity of these social networks, the overall quality of the living environment, and the degree of social inclusion and civic engagement that is enjoyed by the local population.
3. Empirical Analysis
The main intent of the empirical analysis is to reveal the substantially different ways that large American cities now produce their high-tech and high value-added goods and services. A mixture of input and output variables is used in the multivariate analysis of 352 metropolitan areas at a single point in time—the year 2010. (These raw data are available from the senior author.) These groups of variables measure: (i) the quality of the workforce; (ii) the incidence of entrepreneurship; (iii) the intensity of patent production; (iv) overall innovation; (v) overall productivity; and (vi) the metropolitan context for innovation. However, no variables have been included to address the important role of institutions or social capital in promoting metropolitan growth.
3.1. The Variables
3.1.1. Quality of the Workforce
Six different variables are chosen here to (i) reflect general creativity; (ii) capture the general benefits that flow from higher education; and (iii) highlight the special advantages of attracting and maintaining youthful educated workers.
First, Richard Florida’s widely known twin measures of creative workers are adopted (see martin prosperity.org/tag/creativity-index). The share of metropolitan workers in the creative class, CCLASS, is used to capture the importance of having city workers engaged in the fields of science and technology, design and architecture, and various other professional areas. Alternatively, the creativity index, CREATE, is used to measure the incidence of the 3Ts—technology, talent, and tolerance—in the local environment. Although highly correlated (Pearson’s r = 0.80) these variables are not identical. The third variable in this cluster is the standard measure of human capital, DEGREE, which reflects the percentage of the entire city adult population 25 years and older having a bachelor’s degree. This variable correlates significantly (in the 0.55–0.60 range) with Florida’s variables but the incidence of college degrees is relatively high in certain places, like retirement areas, that are not very innovative.
Three other variables are used to address the special importance of attracting university-educated workers who occupy the 18–44 age cohort. The annual Leading Locations studies provide ordinal data regarding this youthful “prime workforce” and both the current level and recent change in this demographic group is addressed (see www.areadevelopment.com). Therefore, data are adopted for: (i) the percentage share of the prime workforce, PRIMWF, in the total workforce; (ii) the 3-year percentage change, CHPRIM, in the prime workforce; and (iii) the 1-year percentage rate of in-migration, INPRIM, for this prime workforce. To ease the interpretation all the ranks are reversed so that higher scores are better. PRIMWF and INPRIM correlate strongly with the variables in the first cluster; however, CHPRIM is a lot more volatile and does not correlate with any other variable in the entire group.
3.1.2. Entrepreneurship
While entrepreneurship is widely known to be a key in regional growth there is some disagreement about how best to measure that activity. Three approaches appear to dominate the current literature: (i) self-employment rates; (ii) new product formation rates; and (iii) new business startup rates. Much research has argued that startups, (usually) taken as those businesses opened in the previous year, are an especially important part of Schumpterian “creative destruction” dynamics. Recent study has focused on how those activities (STEM) of a more technical nature are especially important in the creation of new jobs. Moreover, several observers have argued that high-tech multipliers are much higher than other multipliers. The analysis here makes use of data provided in the report prepared by Hathaway [61] for the Kauffman Foundation. This report is especially valuable because it differentiates general startups GENTRE from high-tech startups TENTRE, although the levels do correlate highly (r = 0.95 in 2010). Here startup density figures, or location quotients using a national base, are given for each measure of entrepreneurship in 1990 and 2010. The 2000–2010 changes in those concentration measures, CHGENT and CHTENT, are estimated by subtracting the 1990 densities from the 2010 densities and dividing that change in half. The degree of correlation for the density changes (r = 0.78) is somewhat lower than for the densities.
3.1.3. Patents
Patent production has been studied for years, especially in the more advanced economies. The analysis here uses the figures disclosed for utility patent grants in all classes, as provided annually by the U.S. Patent and Trademark Office [62]. Here the metropolitan location is attributed to the residence of the first-named inventor. The website www.uspto.gov provides figures for the patent volumes, which correlate highly with city size, and these figures must be standardized to address local specialization. The raw patent figures PATENT for 2010 and 2000 were transformed into patent densities LQPATE for each year by computing location quotients using the local and national population figures. Next, the change in patent density CHLQPA was computed as the 2010 location quotient minus the 2000 location quotient. Patent densities correlate significantly with entrepreneurship densities (r is approximately 0.50 in both instances) but there is virtually no correlation between the alternative measures of change. Finally, a composite variable ENTPAT, was computed as GENTRE x LQPATE to capture the possible synergistic effects between entrepreneurial activity and patent production in 2010.
3.1.4. Overall Innovation
A comprehensive view of metropolitan innovation is given by the composite variable, INNOVA, which is calculated by Statsamerica [63]. This index is comprised of 4 distinct sub-indices—human capital, economic dynamics, productivity and employment, and economic well-being—where each sub-index is in turn comprised of several performance indicators. The human capital sub-index comprises 30% of the total score and, as considered above, this reflects both the age and the education of the workforce. The economic dynamics sub-index, which comprises a further 30%, is different from all of the other variables used here because it addresses venture capital and broadband connection. The other two sub-indices are to a large degree captured in the variables that are considered below. The basic problem with this composite variable is that many of the input data are known to be highly correlated (redundant) but it remains unclear where this double-counting actually occurs.
3.1.5. Overall Productivity
The nation’s metropolitan areas now vary tremendously in terms of their per capita productivity. In fact, gaps in urban productivity have been growing steadily for decades. To capture this aspect of the nation’s metropolitan landscape we use the productivity figures provided each year by the Bureau of Economic Analysis [64]. Highly innovative cities generally have high levels of gross domestic product per capita, GRDPPC, but not all highly productive cities are in fact highly innovative. This occurs, in part, because some cities remain productive in high value-added industries that are in the declining part of their product cycle. In our case the degree of correlation between GRDPPC and INNOVA is r = 0.64.
3.1.6. Metropolitan Context
Four other variables are included in the multivariate analysis in order to provide suitable context for the different variables discussed above. The first of these is metropolitan population, POPULA, where it is known that the largest cities like New York and Chicago have very different production ecosystems—with highly beneficial internal and external scale economies—than the smallest cities like Yuma and Dothan. A second variable, WAGSAL, addresses average wages and salaries across the cities, and is adopted to recognize that qualitative differences exist in the metropolitan workforces. Moreover, new patent production and entrepreneurship tend to be promoted in those areas that already enjoy higher wages or salaries. Two other variables are chosen to control for the highly variable composition of both metropolitan income and employment in the U.S. One variable, EARRAT, measures the ratio of earned income to total income and thereby distinguishes retirement places and depressed areas, with high amounts of non-earnings income, from the nation’s most vibrant and productive cities. A second variable, EMPRAT, measures the ratio of total employment to population and distinguishes those productive places with high (gross) labor force participation rates from those unproductive places with low participation rates. These variables are all taken from or created from BEA data for the year 2010.
3.1.7. Other Attributes
It is very useful in labor market studies of this sort to discern whether the performance of each economy is tied to other general factors, including the locations of the metropolitan areas in the overall space-economy and the incidence of other natural or socioeconomic attributes in those metropolitan areas [65]. Therefore, maps were produced to indicate the various city locations—but only in the five clusters or IE clubs that were found to be performing above the national average. In the upcoming discussion it is clarified that some cities in each of these IE clubs clearly excelled in both entrepreneurship and patent production and these places are highlighted with capital letters in those maps. The average levels of various contextual attributes are also revealed for each of the eight different IE clubs (see Table 4 below). These attributes, whose scores were taken from the Places Rated Almanac [66], are climate (CLIME), ambience (AMBIN), housing costs (HCOST), education (EDUCA), recreation (RECRE), health (HEALT), transportation (TRANS), and crime (CRIME). The scores for many of these attributes are known to vary with city population size but it is still useful to note how current economic success is associated with relative performance in other aspects of metropolitan life. Here the 352 metropolitan scores are all standardized to a value of 100 (the national average) in the case of each contextual attribute. Therefore, if it is found that the metropolitan areas in a given cluster average 115 in TRANS this means that, taken as a group, these places are performing 15% better than the national metropolitan average in the area of transportation. In the case of each of the eight contextual attributes a higher score is generally preferred to a lower score; however, it should be pointed out that a high score for HCOST indicates that housing is cheap and a high score for CRIME indicates that overall crime is low.
4. Initial Results
All of the results of this paper are based on the loadings and scores of a Varimax rotated factor analysis, where some 92% of the variance in the 20 variables is accounted for by only 10 orthogonal dimensions (the factors). A loading indicates the degree of correlation of a given variable with a particular factor, while a score represents the performance of a given metropolitan economy on a particular factor. The factor loadings have been discussed in great detail elsewhere [6] but, for purposes of clarification, they are shown again in the Appendix (Table A1). Each of these factors can be interpreted by the loadings and these interpretations are given in Table 1. Many of the 20 variables load heavily on Factor 1 (F1), which alone accounts for nearly 20% of the overall variance and can be interpreted as a general innovation factor. This single factor captures the general incidence of young, talented, and highly educated workers in the various metropolitan areas. The scores on F1 steadily rise as cities become more talented and educated so all of the metropolitan areas can be ranked from highest to lowest on this most general dimension. In fact, each set of factor scores was examined and, only in the case of Factor 8, were the scores reversed so that positive values would correspond to increases in youthful workers. When considered together, the set of orthogonal factors basically deconstruct the heterogeneity of the metropolitan economies in 10 different directions; so a given city’s score on each dimension reveals something that is unique or important about the innovation ecosystem of that particular city. Some successful cities are narrowly productive in one or more high-valued activities, others are very entrepreneurial and exhibit an abundance of business startups, and even others are more inclined towards the formation of new ideas and the production of patents.
Each city can be ranked on each dimension according to its factor score and a listing of the top-15 or top-20 cities on each of those 10 dimensions is very informative [6]. The important thing to note here is that some cities appear much more frequently than others near the top of each of these lists. San Francisco, CA appears near the top for F2, F4, and F10 and Seattle, WA appears near the top for F2, F3, F4, and F10. Therefore, a vector of the 10 ranked scores (where lower is better) provides a simple signature for the innovation ecosystem of each and every city. In the case of San Francisco this vector is (181, 6, 89, 4, 75, 229, 15, 137, 87, 9) and in the case of Seattle this vector is (185, 10, 10, 10, 117, 104, 4, 91, 25, 14), and these two large cities demonstrate a strong similarity in their overall innovative ecosystems—in fact a simple index can be calculated to measure the degree of this similarity. Clearly, though, the pattern of ranks in both of these vectors is very different from that of Kansas City, KS (81, 322, 14, 28, 148, 44, 25, 107, 133, 38) or New York City, NY (144, 357, 69, 1, 125, 245, 235, 215, 337, 328).
From the factor scores it is possible to construct an innovation index that reveals how each metropolitan economy performs across all of the 10 orthogonal dimensions. In fact, this index can either be unweighted (INNOV1) or weighted (INNOV2), depending upon how the variance accounted for by each dimension is treated. When using INNOV1 Boulder, CO stands out alone at #1 (its score is 17.68), San Jose, CA and Seattle next group closely together at #2 and #3 with scores between 14.0 and 15.0, and then San Francisco and Washington, DC group together at #4 and #5. After that the scores slowly descend until reaching the two least innovative cities: Naples, FL (−4.95) and Punta Gorda, FL (−5.79). Alternatively, when using INNOV2, Boulder (53.21) and San Jose (50.43) distance themselves from the remainder of the pack, five other places have scores ranging between 29.0 and 38.0, and only then does a pattern of steady decline appear in the weighted index. Now the two least innovative cities in the nation are identified as being Sumter, SC (−14.11) and Sheboygan, WI (−14.20).
Table 2 shows the values of the weighted innovation index, INNOV2, for the nation’s 35 highest ranking metropolitan areas in the year 2010. It is important to note that in some cases, like Santa Fe, NM (#35, 127.5) and Trenton, NJ (#14, 68.8%), most of the overall innovation score is due to the place’s high performance on Factor 1 alone. However, many of the very highest-ranking economies have innovation scores that are largely generated by their superior performance on several of the other 9 factors. Therefore, in the case of Boulder (#1) only 4.6% of the innovation score is due to F1 while in the case of New York City (#7) only 5.9% of the innovation score is due to F1. In fact, the data in the table suggest that successful metropolitan economies can have very different innovation ecosystems. This important finding means that a typology should be created for the various metropolitan economies that will differentiate various IE clubs from one another. The methodology for this typology is addressed in the next section of the paper, but for now note that the final column of Table 2 indicates the club membership for the 35 highest-performing economies. Despite the similarity shown for the importance of Factor 1, Santa Fe and Trenton are actually assigned to different clubs and Boulder and New York City are also assigned to different clubs.
Further examination of the cities listed in Table 2 quickly reveals something else that is very interesting about the current geography of metropolitan innovation and entrepreneurship in the U.S. Of the 35 highly successful cities, a total of 29 (82.9%) are located in the Snowbelt states and only 6 (17.1%) are located in the Sunbelt states. This split can be compared to the distribution of all the nation’s 352 metropolitan areas, where 235 (66.8%) of these cities are found in the Snowbelt and the remaining 135 (33.2%) are found in the Sunbelt. Therefore, clearly there is today a remarkable geographic concentration of innovation and entrepreneurship in those metropolitan areas that are spread across the northern tier of U.S. states.
5. More Results: The Innovation and Entrepreneurial Clubs
5.1. Methodology
The next step in the analysis involved identifying those distinctive IE clubs for the 350-plus metropolitan economies spread across the national landscape. Here a clustering procedure was applied numerous times to the 10 vectors of normalized factor scores that were noted above (so use was made of a 352 × 10 matrix). In fact, Ward’s algorithm was used in each application in order to minimize chaining in the procedure and help ensure equal cluster sizes. After carefully examining the various results for as few as 5 clusters and as many as 20 clusters, and carefully observing how smaller clusters were sequentially grouped into larger clusters, it was decided that a solution with 8 broad clusters was the most satisfactory.
Three of these clusters, with a combined total of 206 (58.3%) metropolitan areas, exhibited very little activity in the way of high-tech activity, entrepreneurship, or patent production. Two other distinct clusters, with 79 (22.4%) combined metropolitan areas, showed some tendency toward innovation and approximately matched the national metropolitan average. Finally, three other distinct clusters, with a total of 68 (19.3%) metropolitan areas, exhibited a lot of talent and a high degree of innovation. Given that this paper is more interested in the presence (and not absence) of innovation, it was decided that closer attention should be given to the five most innovative groups of cities. Therefore, for innovation clubs 4 through 8, a second-stage factor analysis was performed in order to separate out the stronger performers from the weaker performers in each case. This factor analysis excluded the 4 contextual variables and only examined the 16 core variables addressing talent, entrepreneurship, and patent production. Hierarchical classification, using 5 factors, was then applied within each cluster to detect two or three separate performance regimes in each case. These various regimes were then ordered according to how the various groups performed on two especially important criteria: patents production and business startups. Therefore, there are two different but related classifications that can be used: one recognizes the 8 broad IE clubs while the other allows more detail and recognizes 15 different IE clubs. The numbers of metropolitan economies in these IE clubs are shown in Table 3, where the right-hand column shows per capita averages for business startups and patents in those various clubs.
5.2. The Eight Broad Types
All of the seven Type 1 cities are iconic Sunbelt economies. These metropolitan areas are small in population size (the average was 369 K in 2010) and rich in amenities, and the residents of these places—like Prescott, AZ and Naples, FL—are often talented and educated although they tend to be older if not retired. Naples’ population, for example, has 48.5% of its population who are over 65 years of age and older [67]. Therefore, entrepreneurship is limited (as most industries are population-serving), there is hardly any patent production, and there is almost a complete absence of high value-added industry. As Table 4 indicates these cities all have high housing costs and they score low on metropolitan ambience and education but high on recreation. Again, using the example of Naples, the metropolitan area has high location quotients in sectors such as arts, entertainment and recreation (3.33), real estate rental and leasing (1.68), and accommodation and food services (1.45) [68].
Another 77 cities were classified as Type 2 economies. These places are even smaller in size (average 297 K) and they also significantly underperform the national metropolitan average in all aspects of innovation. Forty-five of these places, including Green Bay, WI and Flint, MI, are located in the Snowbelt and 32 others, including Shreveport, LA and Waco, TX, are located in the Sunbelt. These places score low on Factors 1 (−0.87) and 5 (−0.43) and high on Factor 8 (0.81), indicating that their workforces are old and their various industries are generally unproductive. These cities also score very low on such attributes as ambience, education, and recreation although housing is generally very affordable. However, there are a few anomalies—the twin city of Champaign-Urbana, IL being perhaps the best example—where places are remarkably creative even though they largely focus on low-tech activities.
The Type 3 economies are more numerous and somewhat larger (average 456 K) in size. While these 121 places generally perform a little better on the main innovation dimension, Factor 1 (−0.26), they exhibit weakness across nearly all the other factors, and they invariably have a deficiency in talented workers and rates of entrepreneurship and patent production that are below the national average. As in the prior cases the per capita GDP is low. However, there is some evidence given in Factor 8 (−0.72) of recent growth in the youthful workforces of such places. These cities are spread across the entire nation although nearly 72% are located in the Snowbelt. The cluster includes many declining industrial centers (Buffalo, NY; Scranton, PA; and Dayton, OH) and a mixture of both minor and major service centers (El Paso, TX; St Louis, MO: and Knoxville, TN). Buffalo, Scranton, Dayton and St, Louis are all examples of so called shrinking cities whose populations are 55.4%, 47.5%, 46.2% and 63.2% below their peak populations respectively. Minneapolis, MN is the main anomaly here because that city is known to exhibit significant innovation; again that place is a metropolitan area comprised of two rather different twin cities.
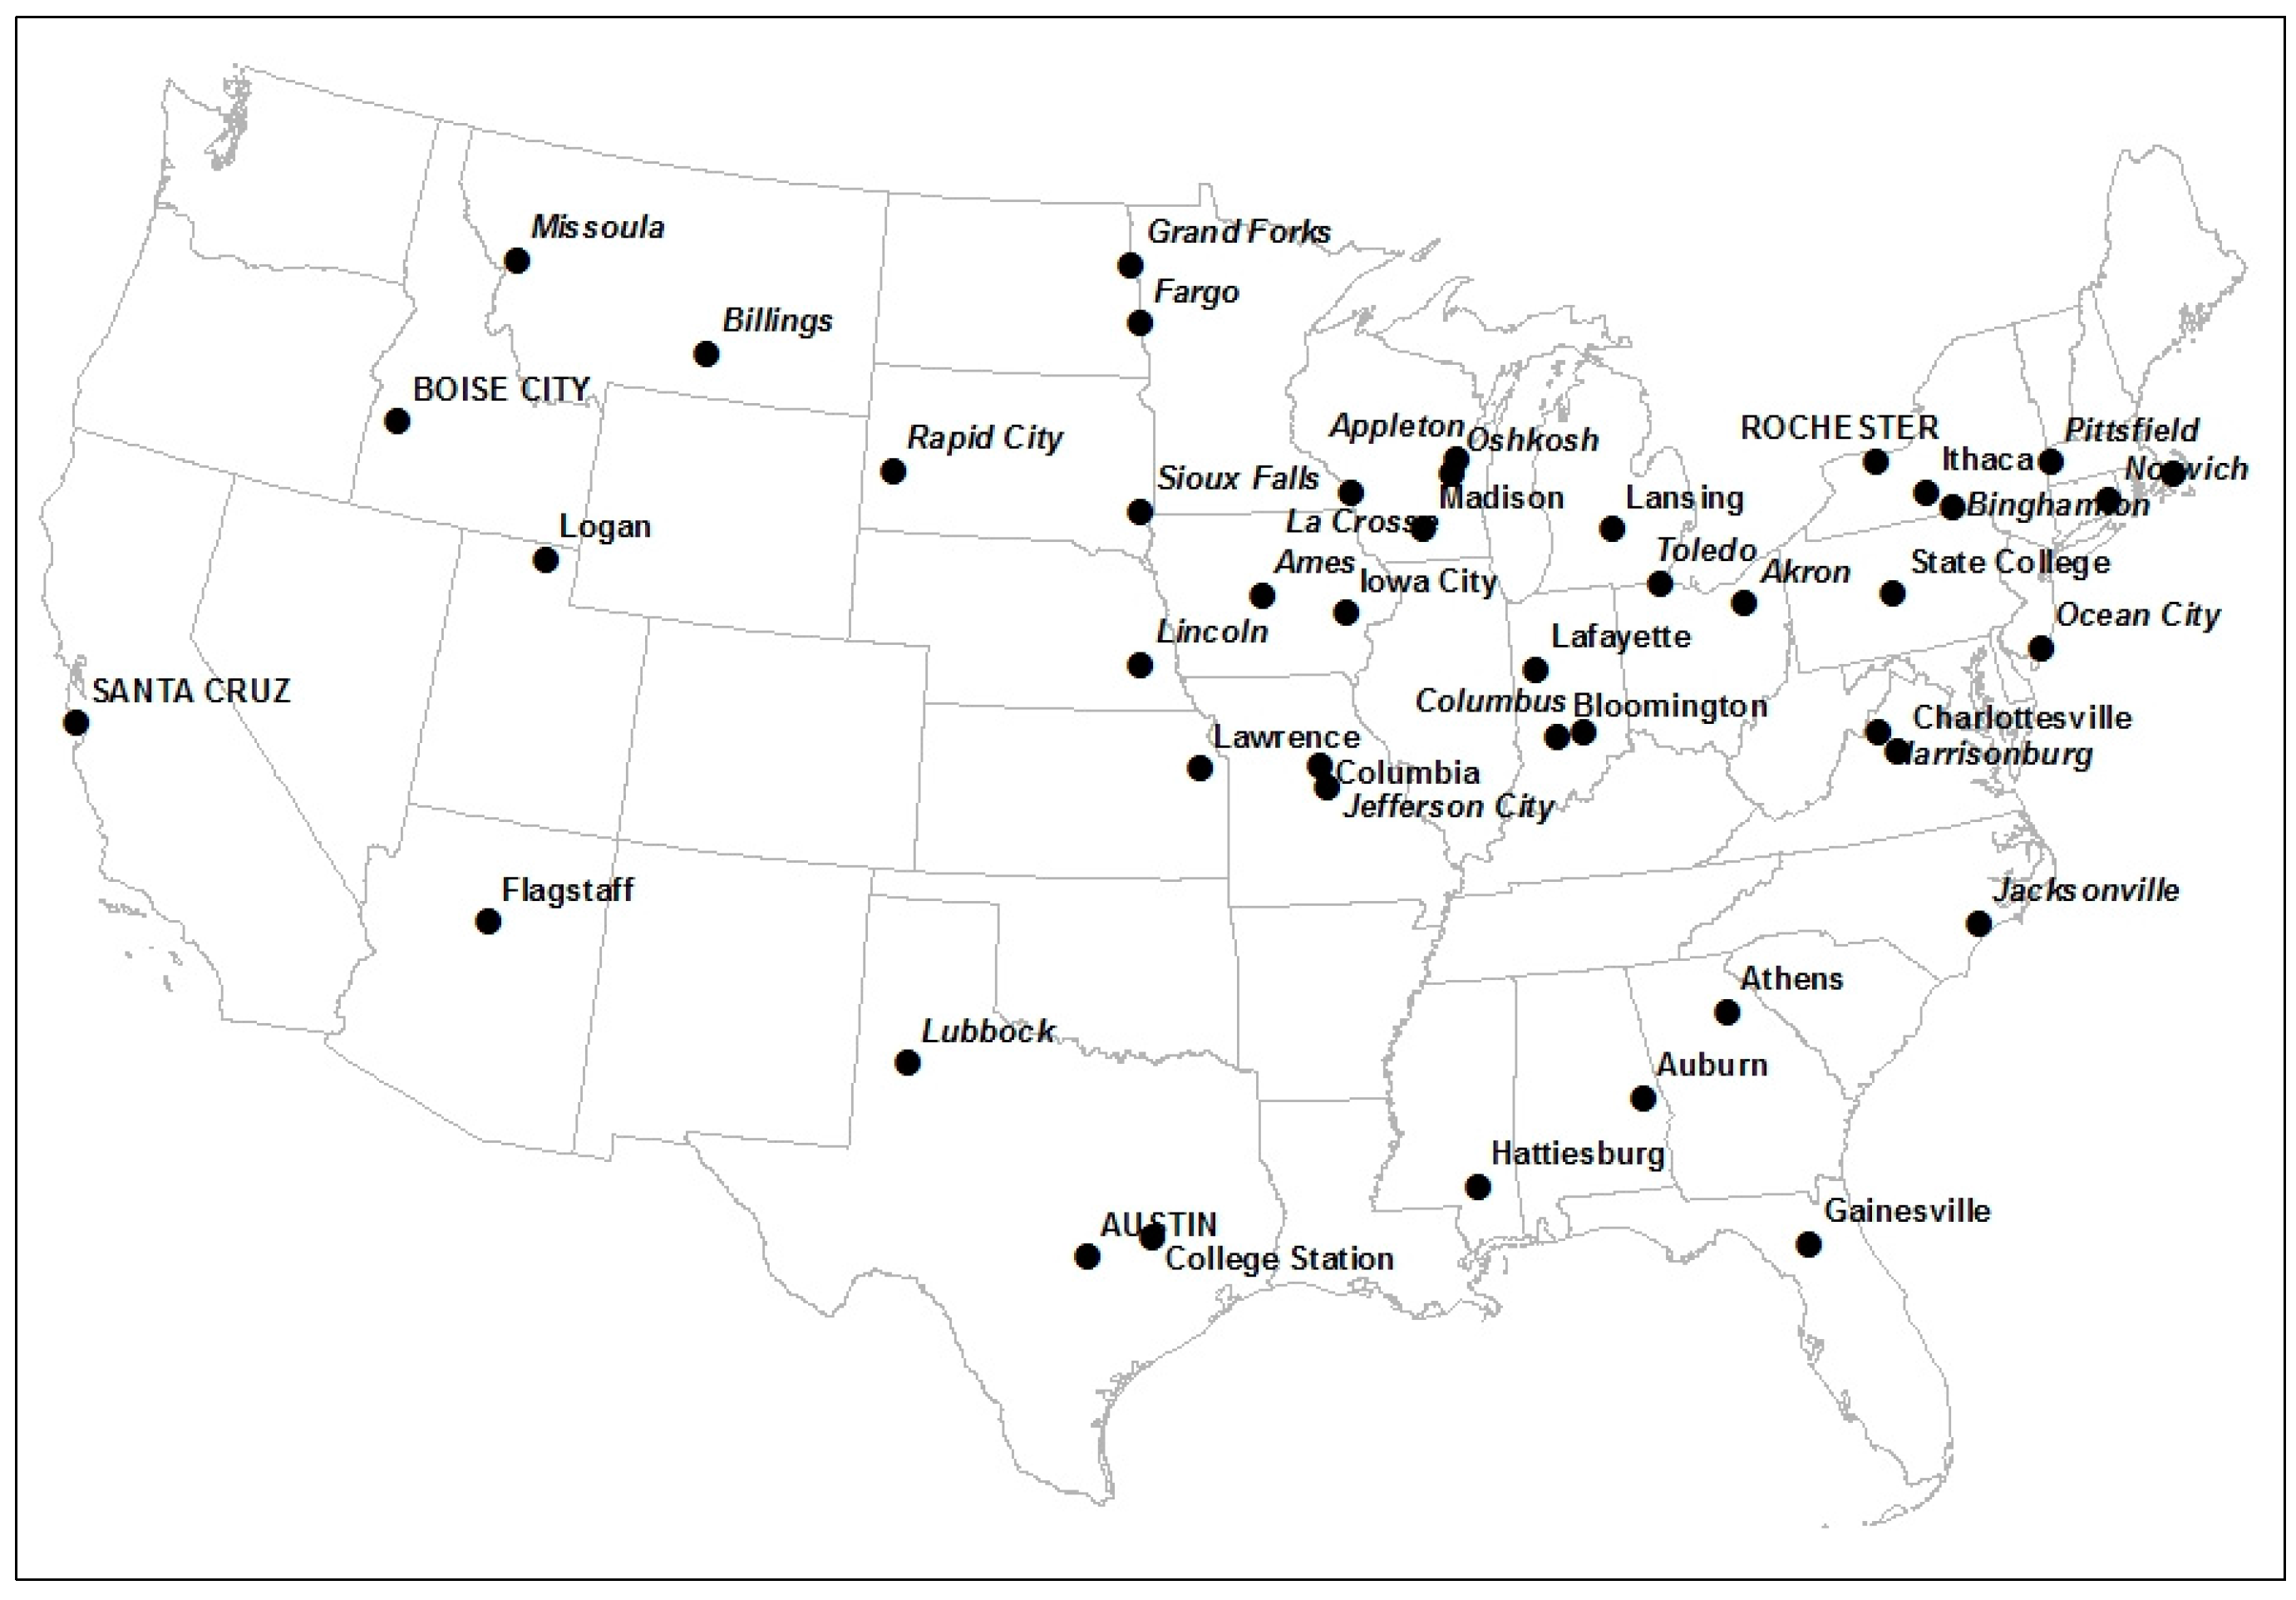
The Type 4 economies are the smallest of the eight types in terms of average population size (278 K) and some four-fifths of this group can be found in the nation’s Snowbelt (see the map in Figure 1). These places score fairly strongly on Factors 1 (0.77) and 5 (0.56) but they score very weakly on several other dimensions, especially Factor 10 (−0.98). Therefore, while these cities have young, innovative workers and high-wage industries, the entrepreneurial aspects of these metropolitan economies are often either weak or in decline. Type 4 places scored strongly on ambience and education, exhibit low crime rates, and are often found in locations with poor natural amenities (Table 4). A large proportion of these places are either old industrial cities (like the prior group) in the Rustbelt or small cities with thriving research universities. A second stage factor analysis divided these 44 places into three groups: Type 4.1 having 23 members, Type 4.2 having 17 members, and Type 4.3 having only 4 members. Although all three groups perform modestly on the innovation index, there is significant differentiation in other aspects of their economies. Type 4.3 cities clearly outperform the other two Types in both entrepreneurship and patent production and, in fact, their workforces constitute an average of the other two Types in terms of talent and age. Here the Type 4.1 cities are much older and much less talented than the Type 4.2 cities. Moreover, the cities in the first group are marginally stronger in entrepreneurship while the cities in the second group are marginally stronger in patent production. Type 4.1 includes several industrial cities like Toledo, OH and several important regional service centers like Jacksonville, FL and Lincoln, NE; Type 4.2 includes numerous places with large research universities including Gainesville, FL, State College, PA, and Madison, WI; and Type 4.3 includes several high-tech hubs like Austin, TX and Boise, ID.
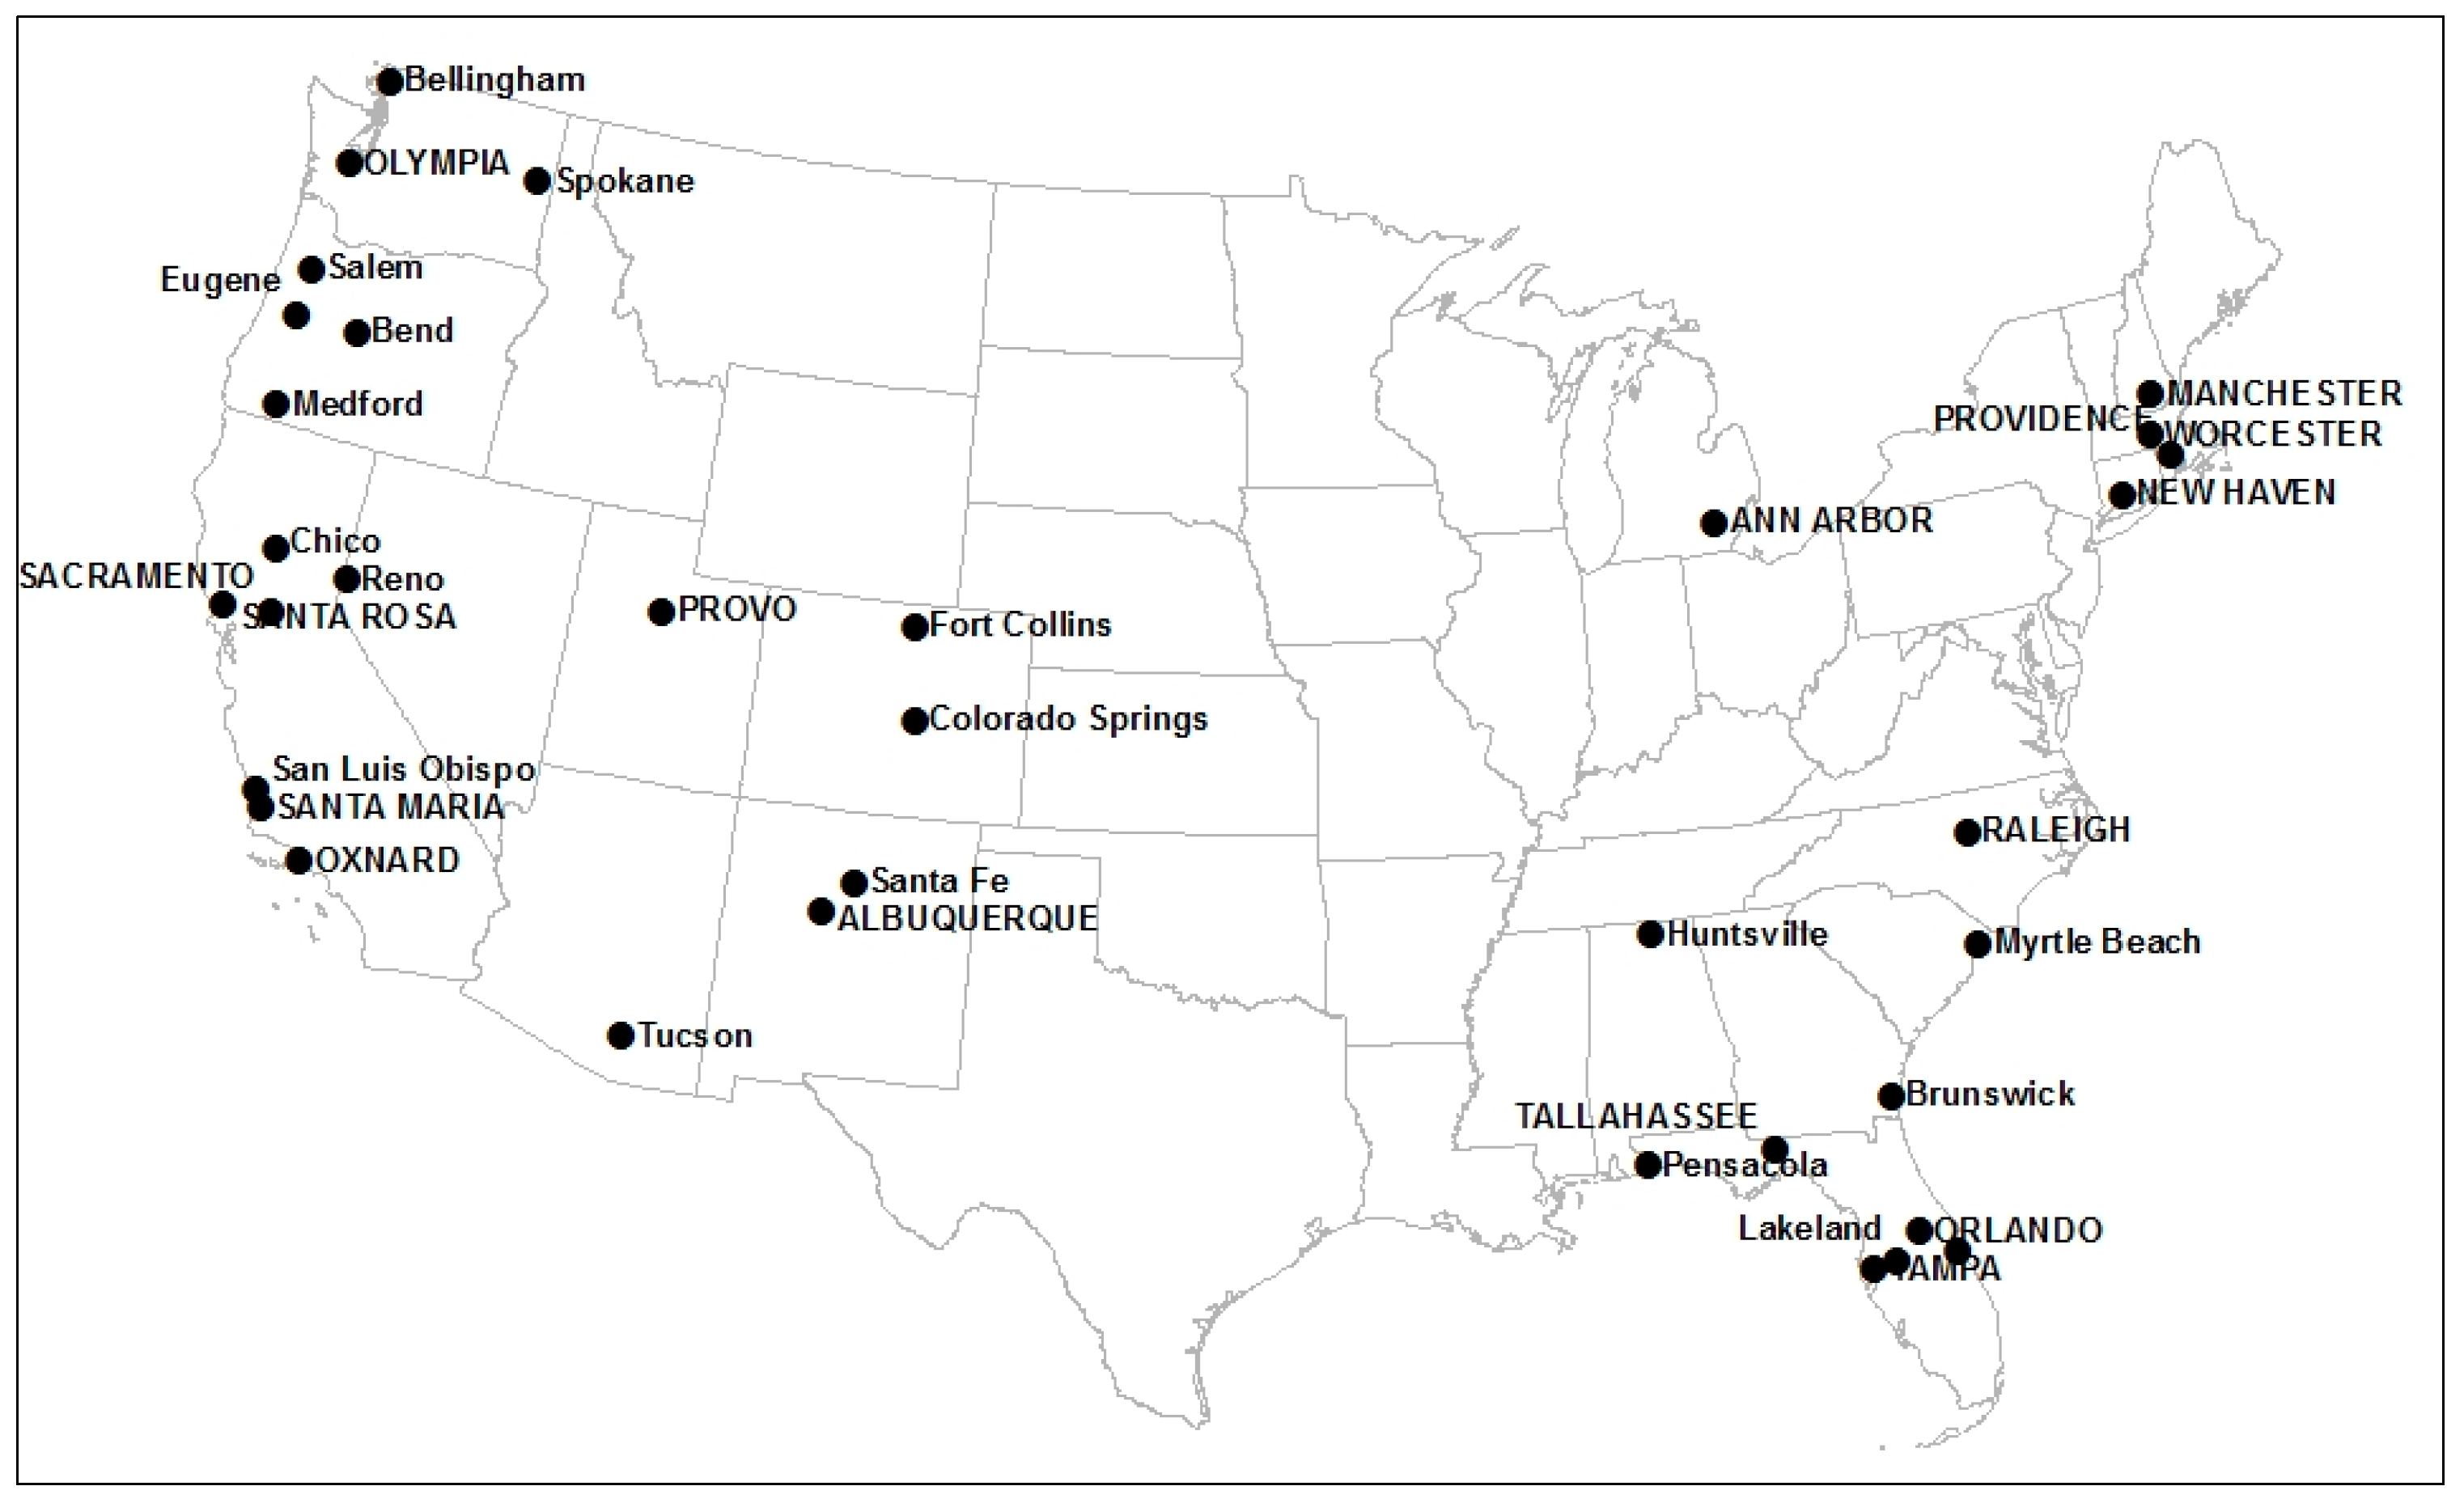
Type 5 is comprised of 35 metropolitan areas that exhibit superior talent and innovation activity in Factor 1 (0.94) and high levels of entrepreneurial activity in Factor 9 (0.80), but suffer low per capita productivity (−0.63) and, according to Factor 3 (−0.37), have experienced some decline in those entrepreneurial levels. These places, whose average population size (670 K) is more than twice that of the cities in Type 4, are distributed approximately evenly between the Snowbelt and Sunbelt states (Figure 2). As a general rule these mid-sized cities score very well on most metropolitan attributes, especially climate and ambience, so their housing costs are relatively high. The second-stage factor analysis distinguished between one group of 19 cities, having older workers, from a second group of 16 cities, having much younger workers. Here the cities in the second group scored much higher on per capita patent production and marginally higher on entrepreneurship than those in the first group. The Type 5.1 places include Tucson, AZ, Santa Fe, NM, and Fort Collins, CO, and the Type 5.2 places include Albuquerque, NM, Provo, UT, and Tampa, FL. As a whole these cities have more diversified economies than those of Type 4 but once again many metropolitan economies continue to be dominated by a major university or research institute.
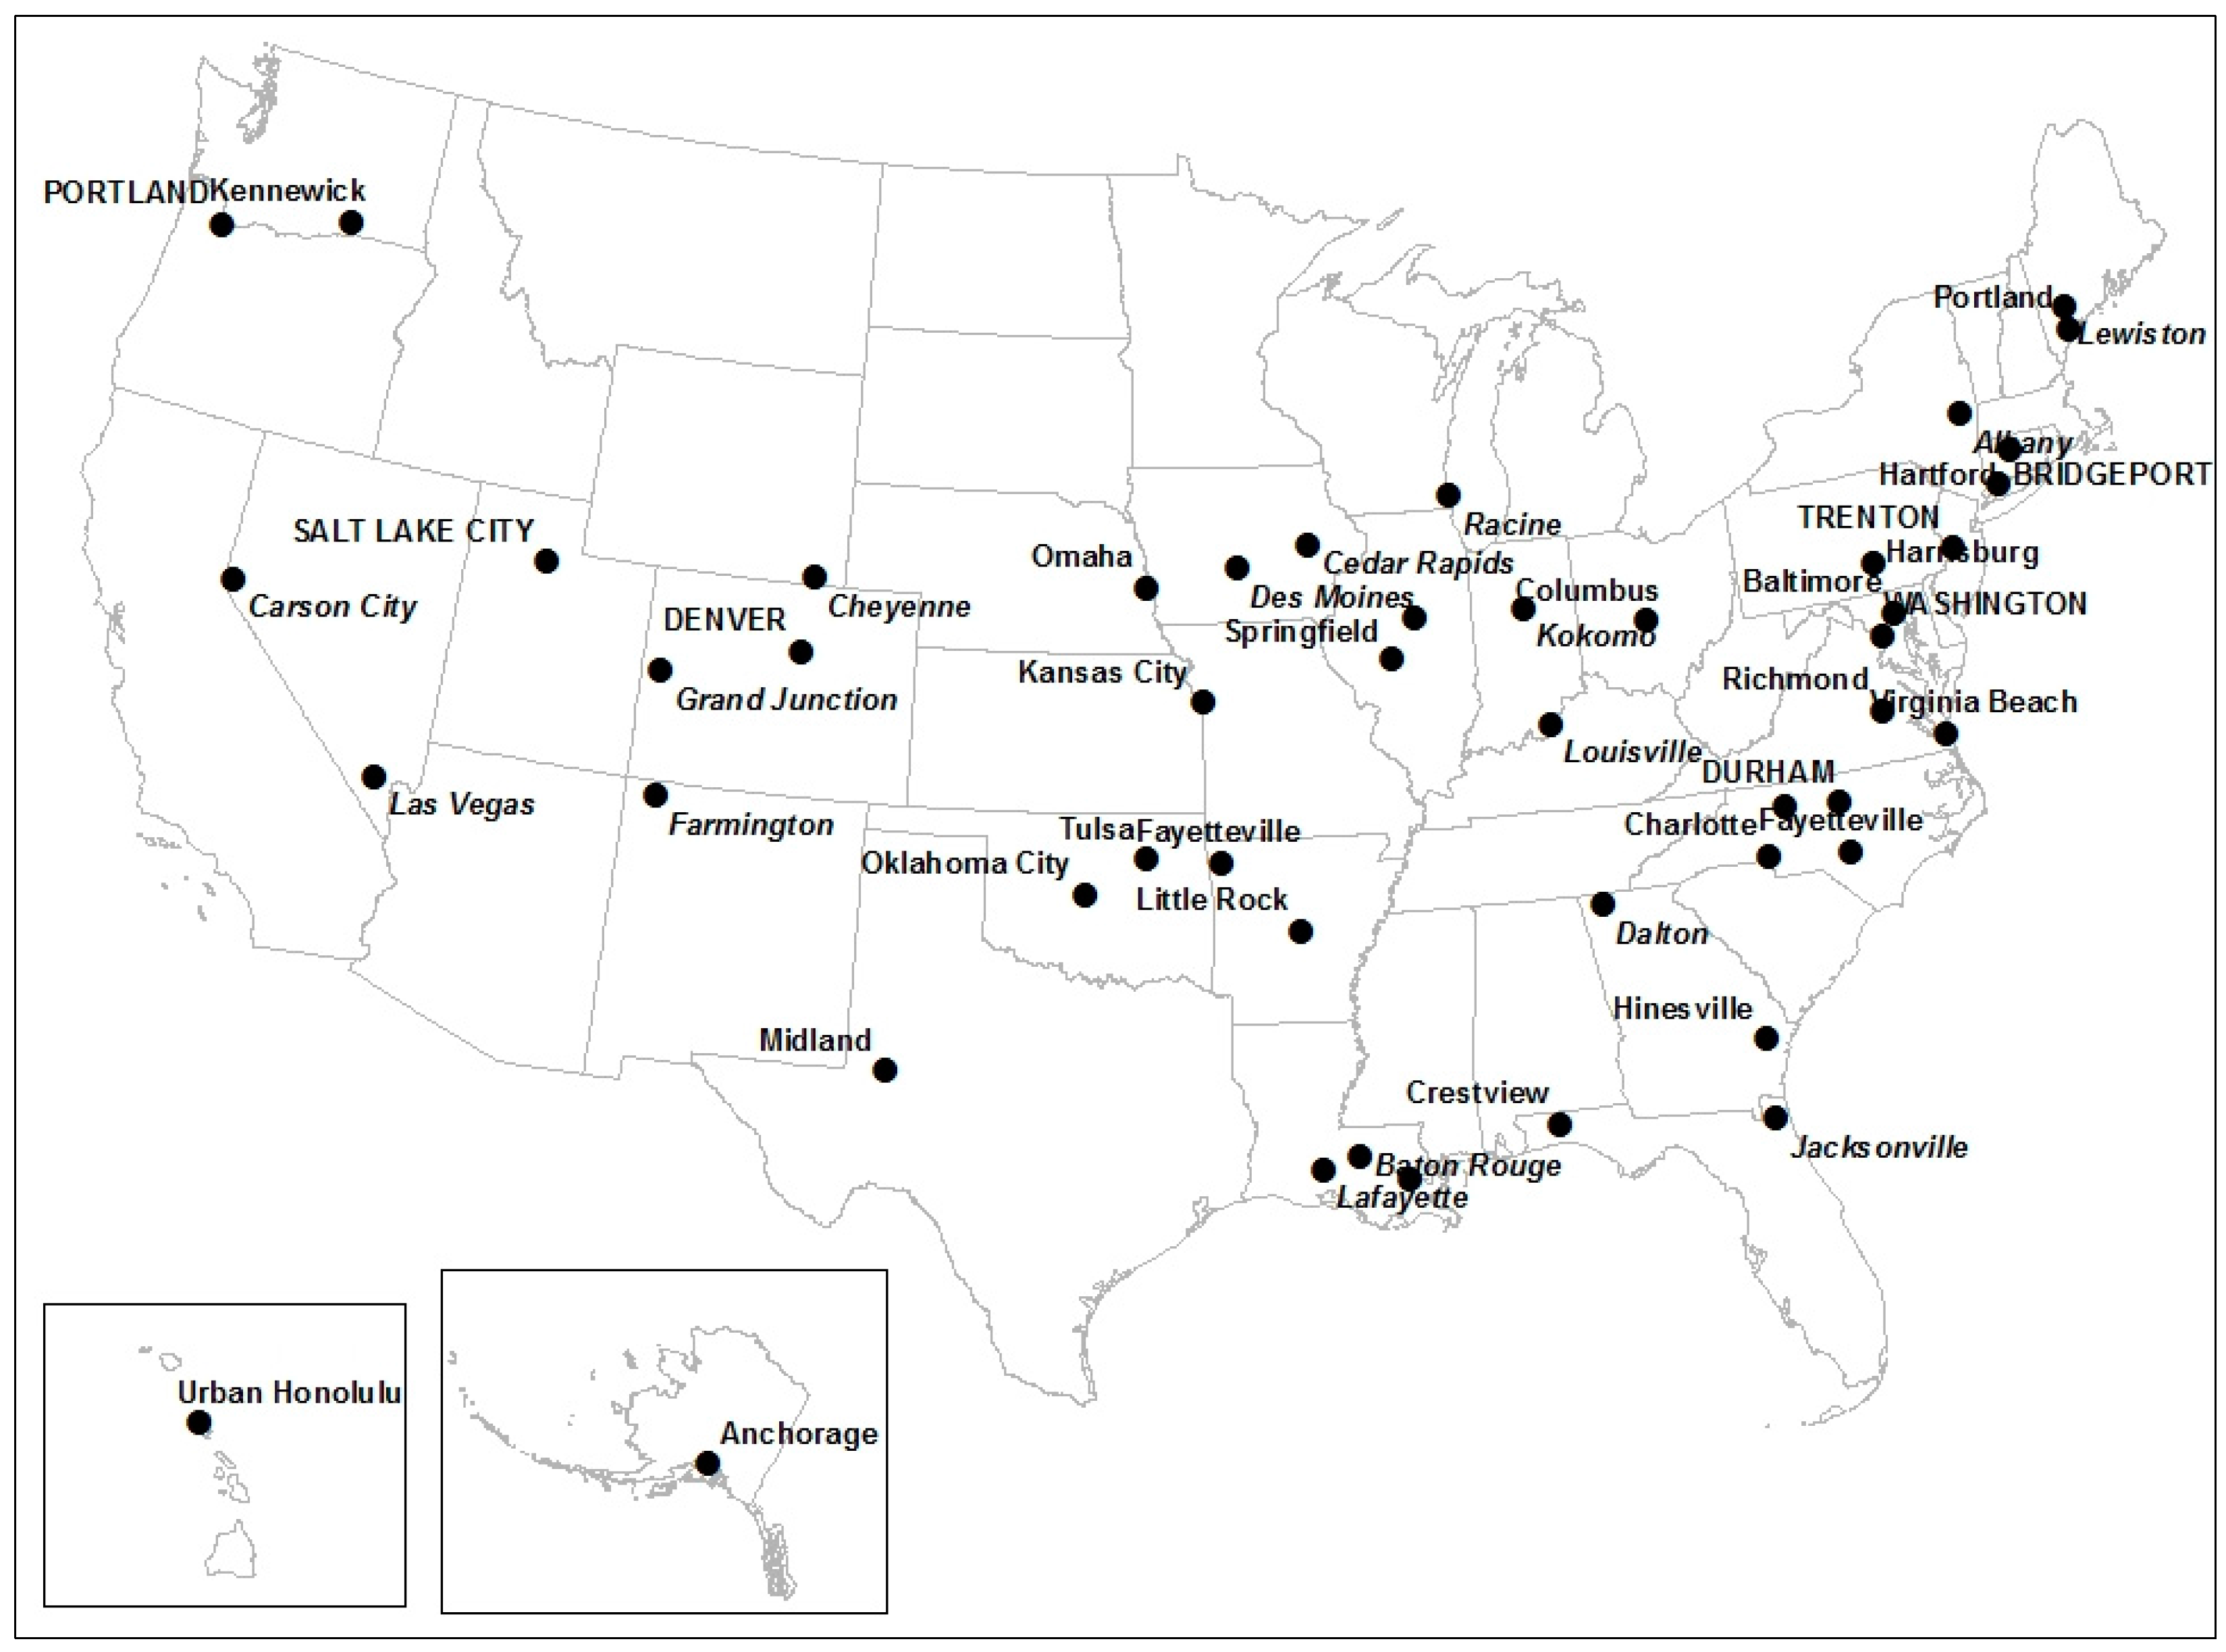
There are 48 Type 6 economies that score moderately high on Factor 1 (0.21), somewhat higher on Factors 3 (0.64) and 5 (0.66), and very high on Factor 10 (1.15). These cities are generally quite large (average 931 K); they enjoy productive industries with high wages, contain a lot of human talent, and are ascending in entrepreneurship. Most (some 77%) of these cities are situated in the Snowbelt and, in general, these places rate highly on ambience, education, health, and transportation (Figure 3). The second-stage factor analysis identified three different subtypes. Type 6.1 is comprised of 16 places having older workers that are slightly more productive in both entrepreneurship and patents than the 25 places allocated to Type 6.2. The remaining 7 Type 6.3 cities have much younger workforces that are nearly twice as productive as the other 41 cities in both entrepreneurship and patents. The Type 6.1 cities include Cheyenne WY and Las Vegas NV, the Type 6.2 cities include Baltimore, MD and Kansas City, and the Type 6.3 cities include Denver, CO and Portland, OR.
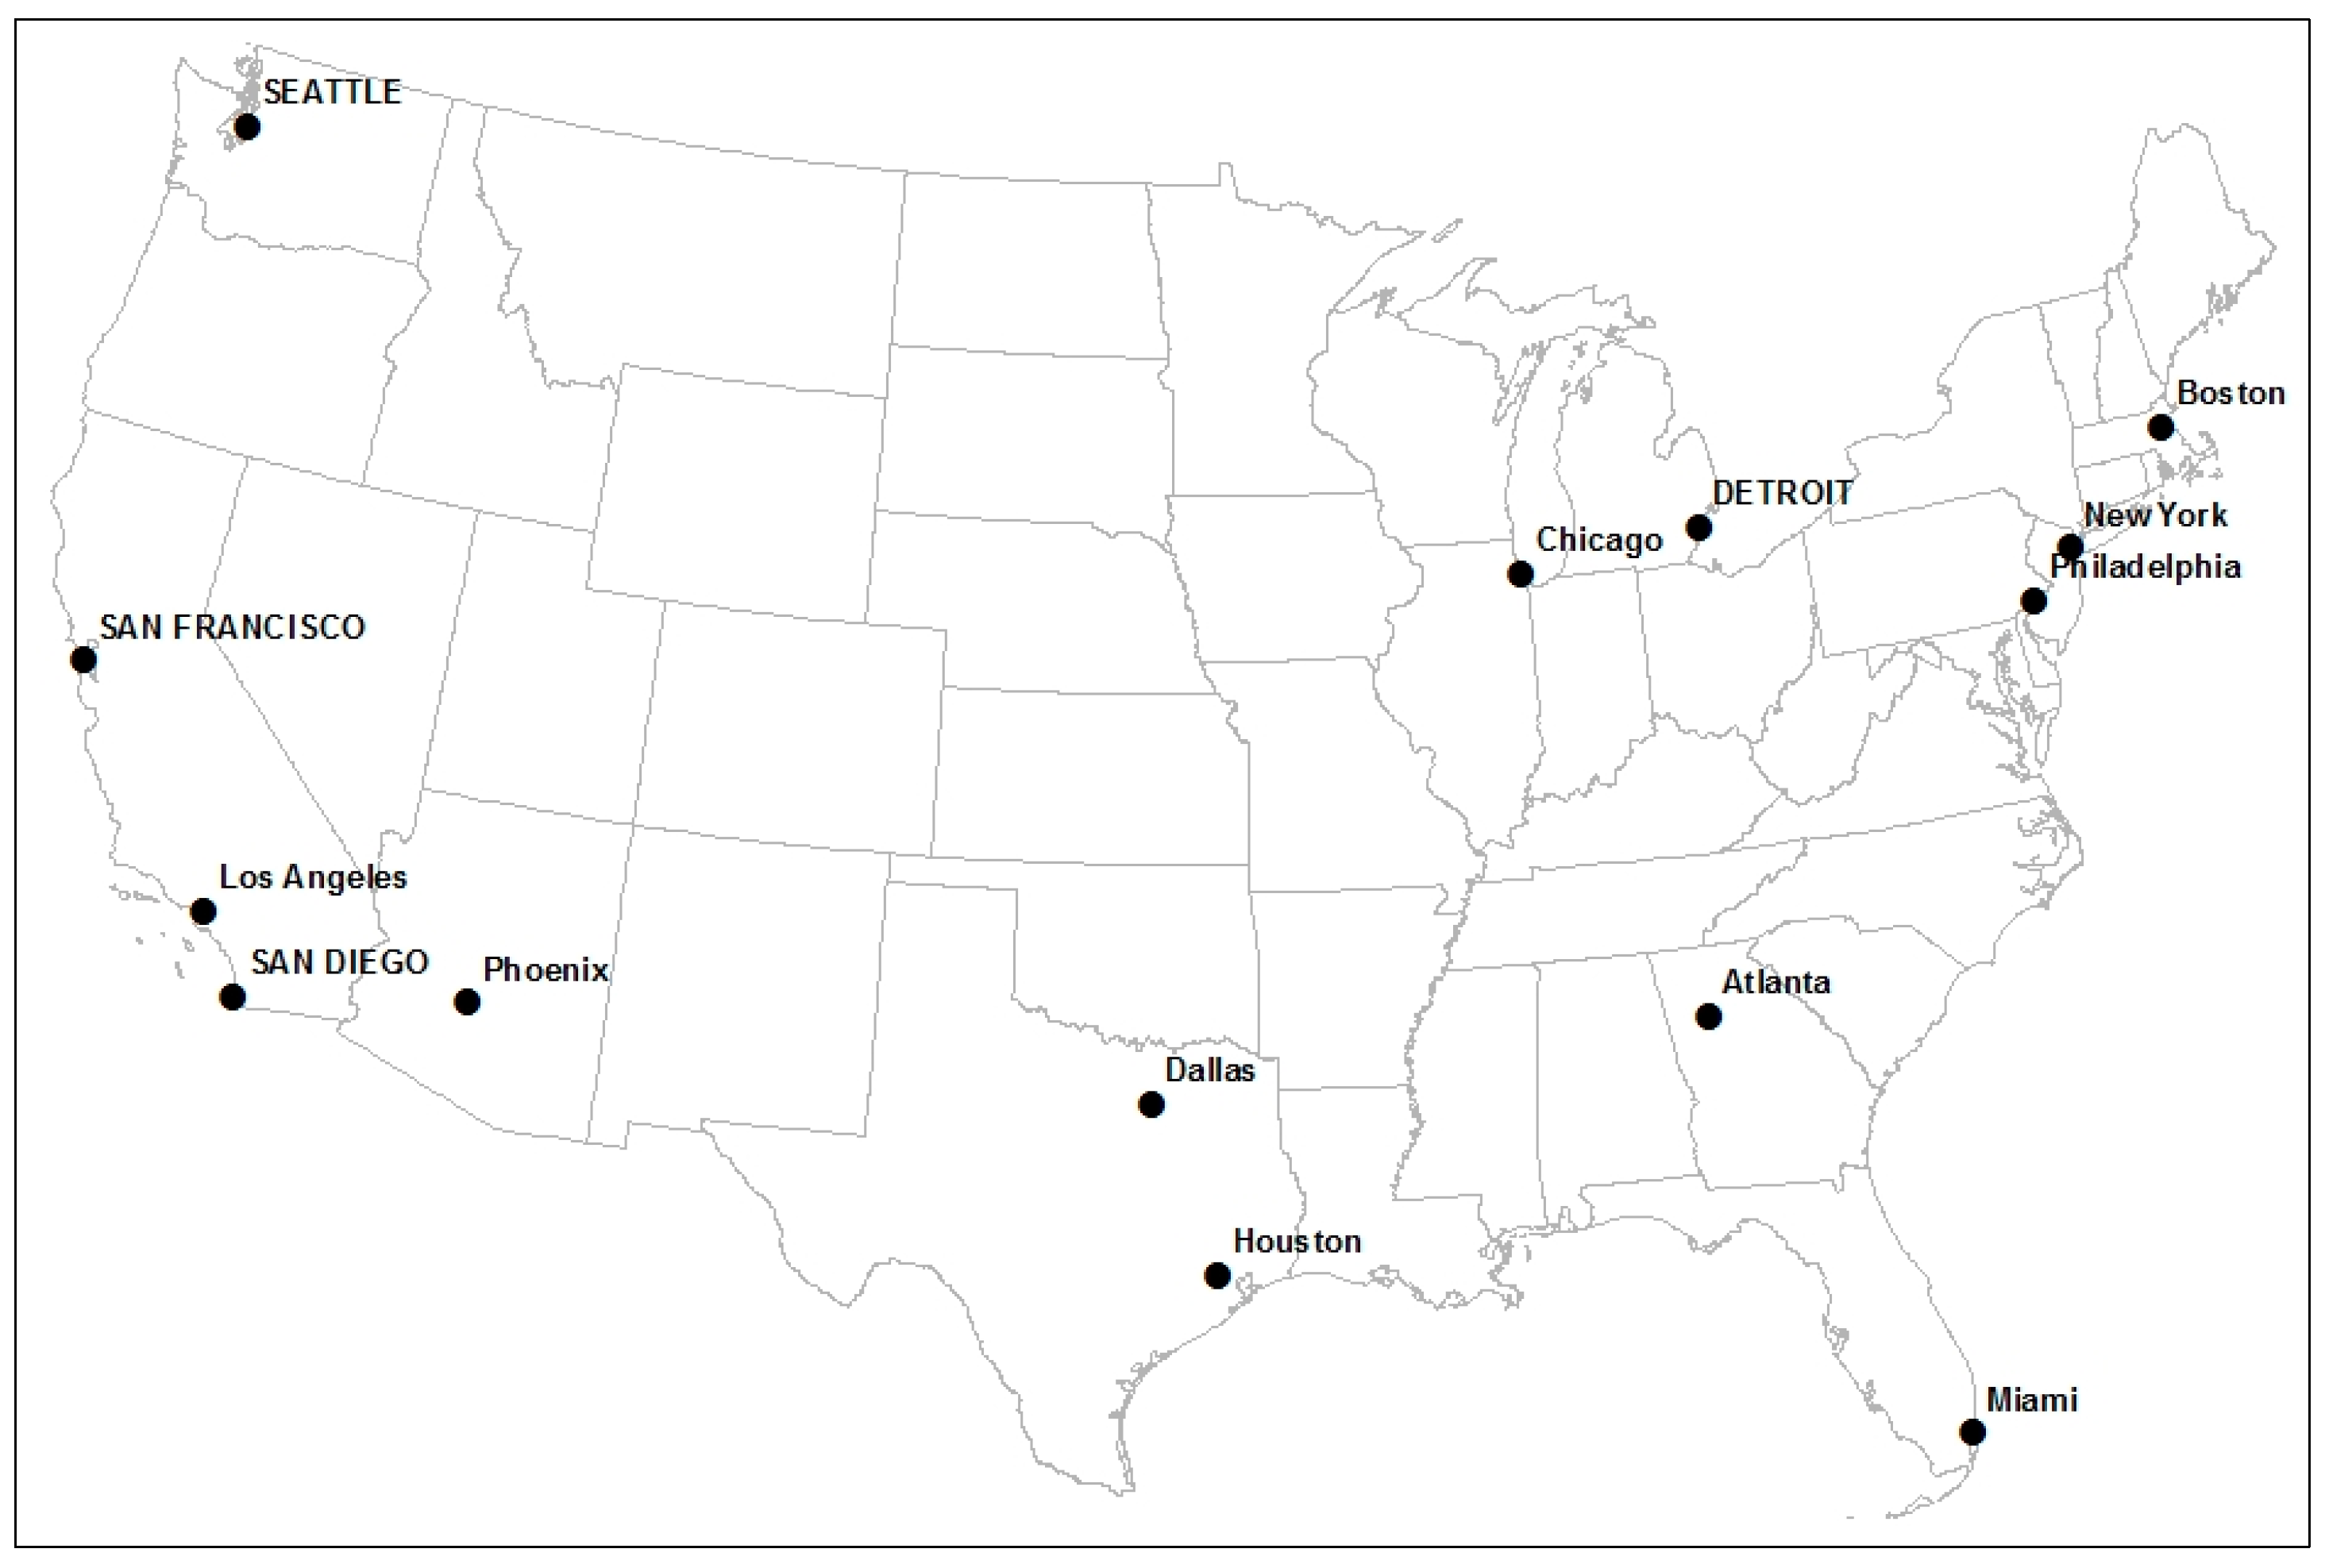
Fourteen metropolitan areas comprise the cluster of Type 7 economies. These cities are generally very large in population size (average 6795 K) and they are spread across the entire national landscape: 6 of these places are located in the Snowbelt and 8 in the Sunbelt (Figure 4). On average these places score fairly strongly on Factors 1 (0.47), 6 (0.43), and 10 (0.34) but their most characteristic feature is a very high score on Factor 4 (3.72). These cities have very large pools of talented, educated workers and they perform strongly in both entrepreneurial activities and patent production. They generally score very high on all metropolitan attributes except for crime and housing costs (Table 4). The second-stage factor analysis divides these large powerhouses into 10 Type 7.1 and 4 Type 7.2 economies. The second group has somewhat younger workers that are both more entrepreneurial and more productive in patents than workers in the first group. The Type 7.1 cities include New York, Chicago, IL, and Los Angeles, CA while the Type 7.2 cities include Seattle, San Diego, CA, and San Francisco. Both of the great Texan rivals, Dallas and Houston, are members of the first group. Detroit, MI is a member of the second group and this anomaly occurs because a remarkable amount of startup and patent activity takes place outside the limits of the city proper. Start-up activity in Detroit has been facilitated by the New Economy Initiative, a $100 million fund that supports entrepreneurial ventures, particularly those that are women and minority owned. Since its inception in 2007 the fund has helped start 1600 companies that have created 17,000 jobs in and around Detroit [69].
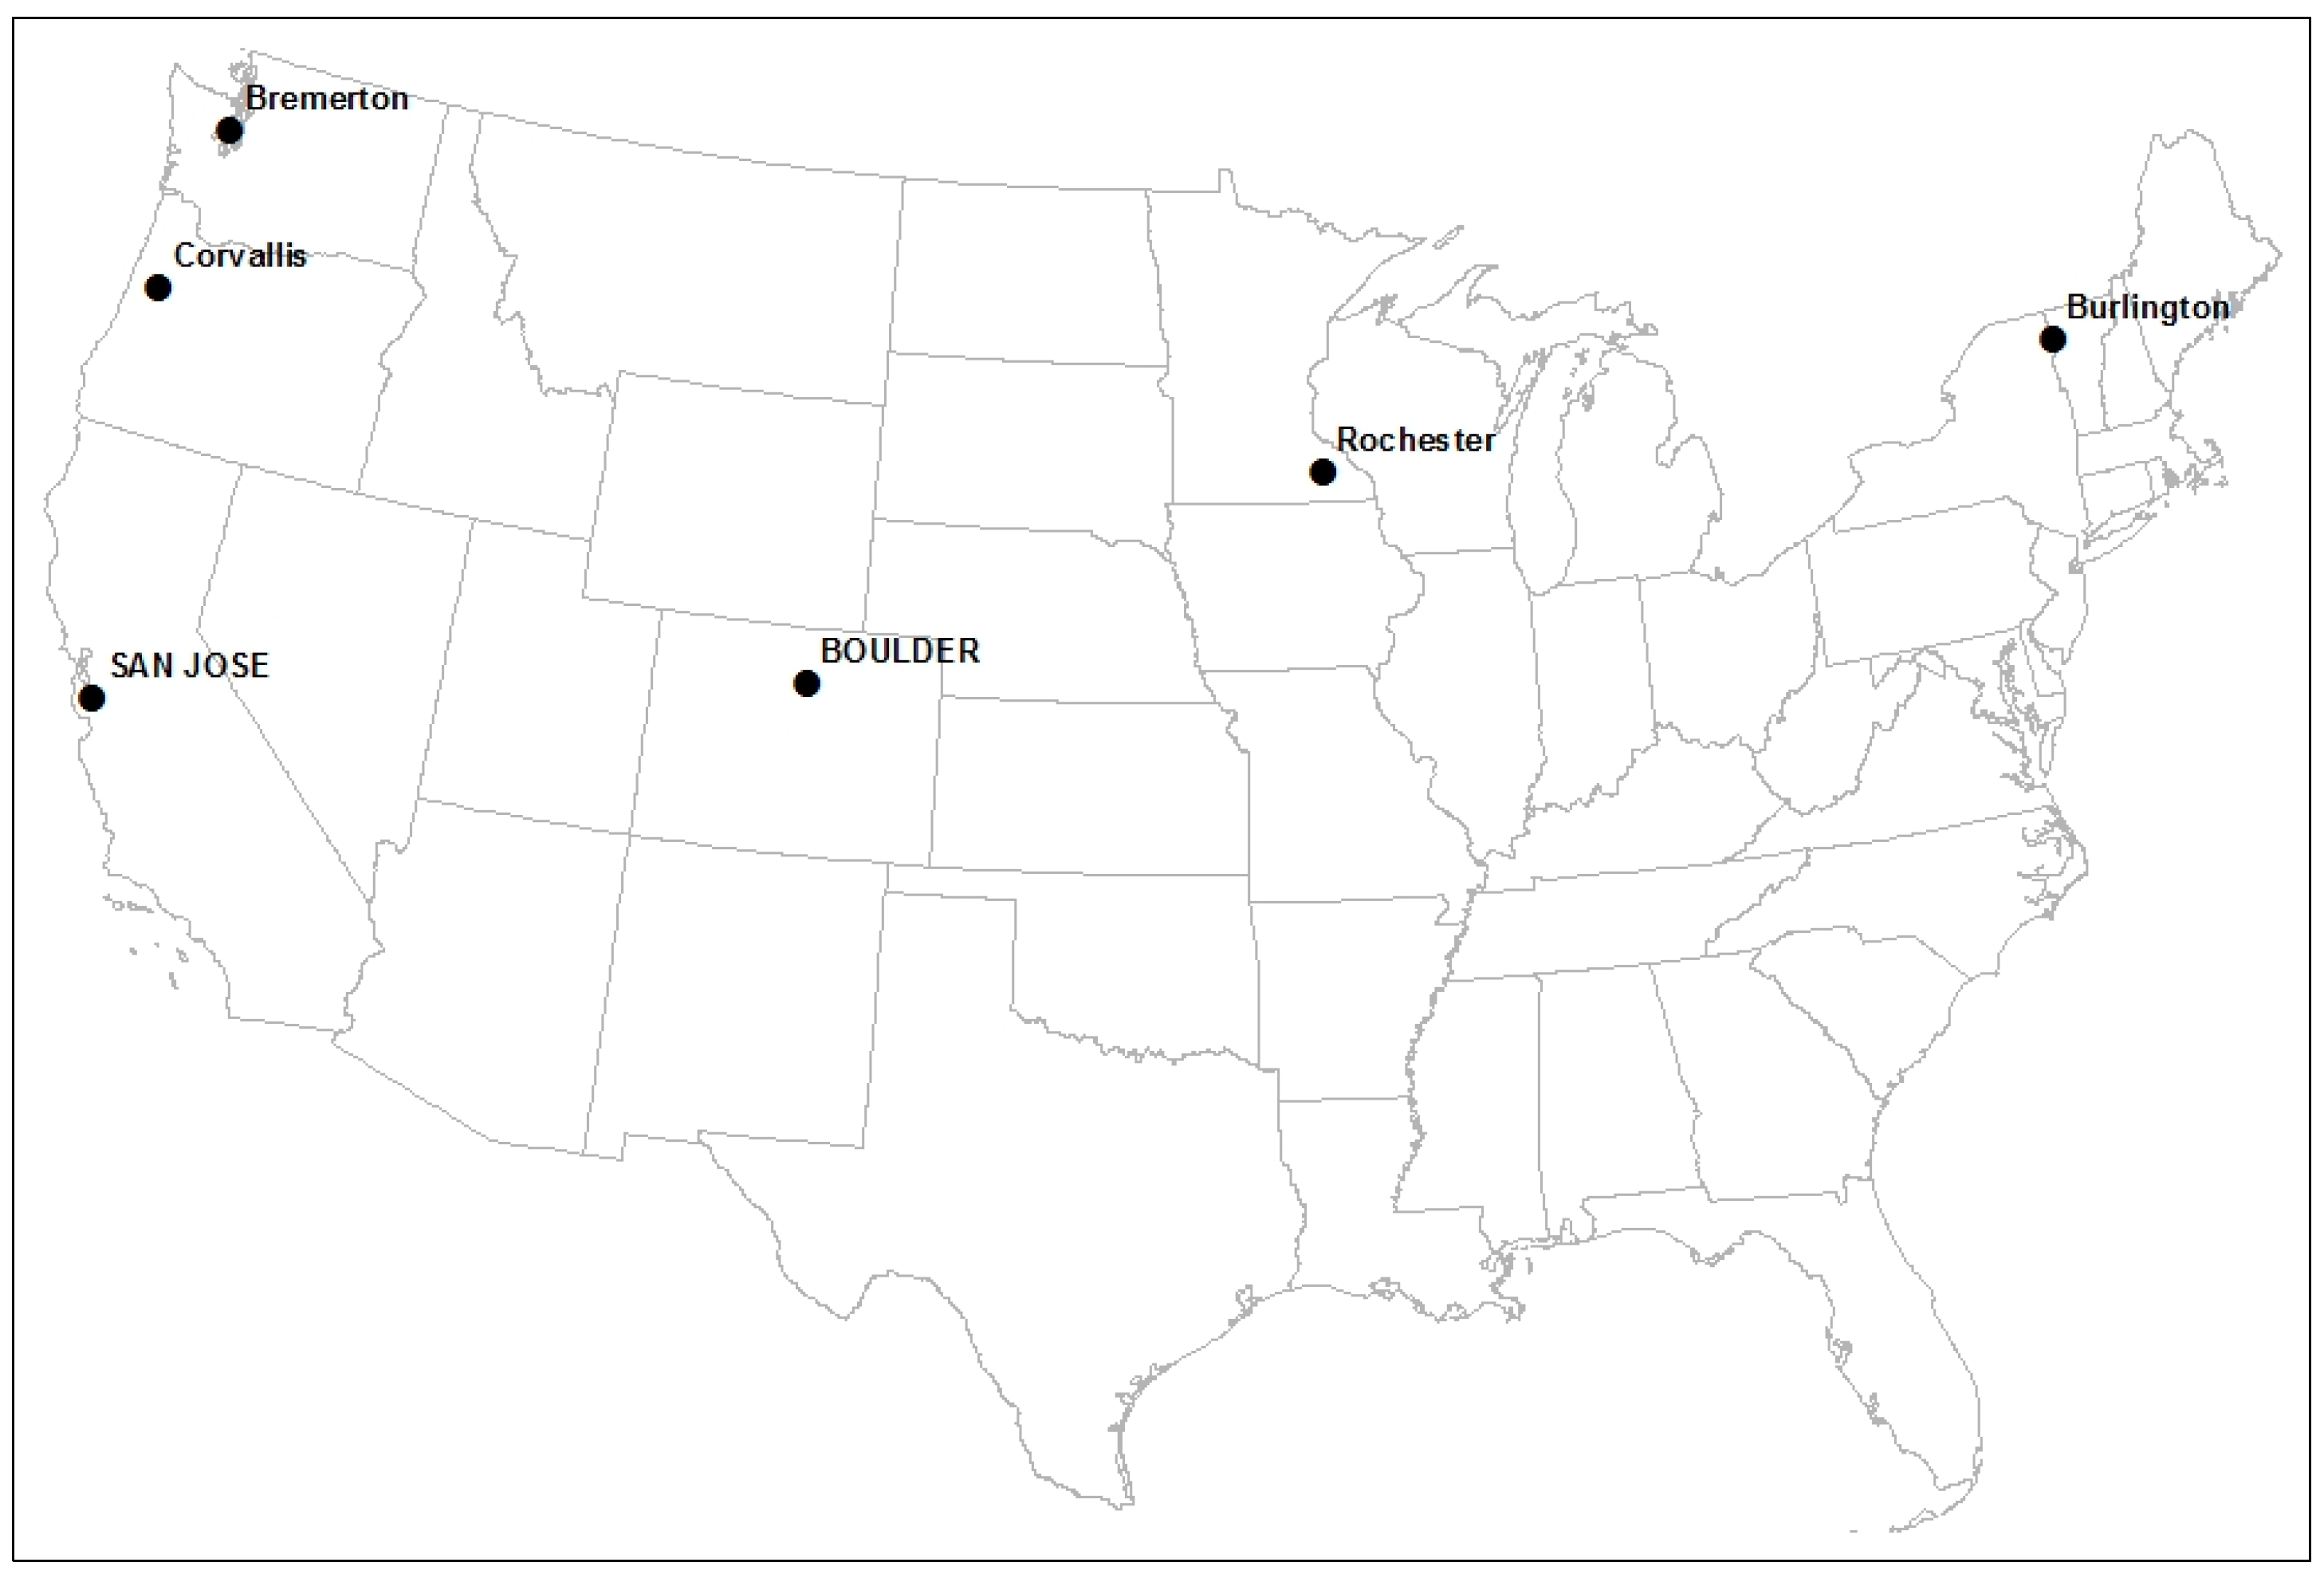
Finally, the Type 8 cities include the nation’s most successful metropolitan economies in both innovation and entrepreneurship. These 6 places have a moderate population size (average 482 K) and exhibit modest positive scores on several of the underlying factors; however, remarkable average scores are seen for Factor 2 (5.12) and Factor 7 (2.83). Therefore, these places not only exhibit high amounts of patent production and entrepreneurship but their activities are expanding in both spheres of innovative activity. Not surprisingly, all 6 of these metropolitan economies are seen on the top-35 list shown in Table 2. Here the second-stage analysis separated out the two high-fliers—Boulder and San Jose (Type 8.2)—from the remaining group of 4 cities comprised of Bremerton, WA, Burlington, VT, Corvallis, OR, and Rochester, MN (Type 8.1). This happens because Boulder has very high scores on both F2 and F9 and San Jose has an extremely high score on F2 (but negative on F9), indicating that both patents and entrepreneurship are of great importance to both economies. These 8 highly productive cities are found mostly in the nation’s western states (Figure 5) and they enjoy high scores in education, crime, and climate (Table 4). The Type 8 places are much smaller than those in Type 7 so housing costs are lower and many big-city amenities in the areas of recreation and health are missing.
6. Some Implications: Heterogeneity and Performance Measures
Classifications are only minimally useful unless they can shed light on other aspects of the subject matter being studied. As a result, interest now turns to examining the various IE clubs for their degree of heterogeneity and then, later, to examining the relative performances of the different clubs with respect to recent population, employment, and productivity change across the 350-plus metropolitan economies.
Perhaps the simplest way to assess metropolitan heterogeneity is to compute an index HETER for each metropolitan area by squaring each of its 10 factor scores and then summing across those values. The lower bound for this index is zero and the upper bound is a large positive number; if, for example, a place had alternating factor scores of 4.0 and −4.0 on the various factors then HETER would take on the extremely high value of 160 in that place. Therefore, if an economy’s factor scores deviated very little from each of the national norms then its heterogeneity index would be very small; on the other hand, if one or several of its factor scores deviated a lot from those/national norms then its index HETER would be quite large. Moreover, as cities scored increasingly higher (lower) on those 10 factors they would become increasingly dissimilar (similar) to one another, so HETER is also a crude measure of the relative uniqueness of each metropolitan economy. Not surprisingly, this index correlates highly (r = 0.45) with INNOV2 so clearly the degree of heterogeneity and the intensity of innovation go hand in hand across the metropolitan landscape. This finding serves to substantiate the opening remarks of the paper where it was claimed that successful cities prosper or grow in dissimilar ways while unsuccessful cities stagnate or decline in much the same way. The final column in Table 3 shows club averages for HETER and, while the trend is not monotonic, clubs 7 and 8 certainly have much higher indices than clubs 2 and 3. Treating club 1 as an outlier, the other 198 cities in clubs 2 and 3 not only suffer from low levels of innovation activity but they are also very uniform in this innovative deficiency.
But it is even more important that this typology of innovation clubs be compared to the volatile growth and change that has been recently experienced by the 350-plus U.S. metropolitan economies. Here the analysis focuses solely on the eight broad types of clubs identified above where within-club growth figures are examined for the five years before the study year (2005–2010) and for the three years after the study year (2010–2013). The percentage changes in population P, employment E, average wages and salaries W, and per capita productivity G are examined, as well as the unemployment rate UNR in 2010.
During the period 2005–2010 all types of metropolitan areas grew rapidly in population size but IE clubs 1 (7.19%) and 5 (7.28%), with superior natural amenities, grew the fastest of all (Table 5). Wages and salaries also grew across all clubs prior to 2010 but this wage growth was highest in clubs 6 (16.34%) and 8 (19.27%). However, employment and productivity growth both languished because of the events of the Great Recession, and here clubs 1 and 5 were clearly hit the hardest. Note, too, that the productivity growth (8.86%) experienced in club 8, the patent and startup high fliers, during the five years leading up to 2010 was truly astounding in comparison to the other metropolitan economies.
But the story after 2010, at least up to 2013, is very different. Recently both employment (7.29%) and productivity (4.21%) growth have been largely concentrated in club 7, which is comprised of the nation’s very largest cities. These largest metropolitan economies have also attracted large population numbers and their average wages have climbed even faster than in the smaller economies. Clearly some of the luster has come off the club 8 high fliers, at least in the first three years after the study year of 2010.
Unemployment rates can be very volatile but they also provide useful information about the relative health of the various urban economies at one point in time. While the trend in the final column of Table 5 is again not monotonic, there is evidence here that the unemployment rate was somewhat lower in 2010 for those metropolitan economies that exhibited the most innovation and entrepreneurship (note that club 4 seems to be an anomaly). In fact, the degree of correlation between UNR and INNOV2 was r = −0.35 in that one year, thereby indicating that the anticipated inverse relationship between innovation intensity and unemployment was significant across the entire group of metropolitan areas.
Given these interesting findings it would seem that one other aspect of the multivariate analysis should be considered: this relates to how the orthogonal dimensions of the factor analysis relate to those same pre- and post-2010 growth figures. If evidence exists that certain factors are strongly correlated with the some of the growth indicators then this should highlight those parts of each city’s production ecosystem that have been most responsible for the city’s recent growth or decline.
Table 6 indicates that Factor 1 had widespread implications for the population growth that was experienced during both time periods. Therefore, places that generally had pools of young and talented workers experienced steady growth in both people and jobs both before and after the year 2010. Factors 3 and 9, which together identify the most entrepreneurial places, had much the same impact on those population and employment numbers. Therefore, those cities with high (low) scores on F1, F3, and F9 tended to experience especially rapid (slow) population growth during those years just before and after 2010. Only four places—Colorado Springs, Fort Collins, Denver (all in Colorado), and the nation’s capital, Washington—exhibited scores exceeding 1.0 for all three of these factors and the growth figures for these places were nearly double the national average. Along opposite lines, only two places—San Jose and Wheeling WV—exhibited scores for F1, F3, and F9 that were all below −0.50 and the latter, which has experienced severe deindustrialization, exhibited both population and employment growth that was about half the national average. San Jose’s scores were more than compensated for by other high factor scores and this finding was in fact a statistical anomaly (see below).
Employment growth was associated with Factors 5 and 6 before 2010 and with Factors 4 and 9 after 2010, while wage growth was strongly associated with Factors 5 and 6 both before and after 2010. Therefore, the incidence of youthful and talented workers in high value-added activities was obviously the key ingredient for those metropolitan economies that enjoyed both expanding employment numbers and higher wages. Moreover, the forces that were driving population growth appear to be a little different from those that were driving employment growth.
Finally, metropolitan productivity either before or after 2010 was largely determined by Factors 2, 5, and 6. However, only one place—the university community of Ann Arbor, MI—had scores for F2, F5, and F6 all exceeding 0.75. In fact, the various members of club 8, the most successful of all high-tech cities, tended to have only one or at most two scores that rated highly on these three all-important productivity factors. Therefore, for example, Boulder ranked highly only on F2, but also on F3 and F9, while both Bremerton and Corvallis also ranked highly only on F2, but also on F7. Alternatively, San Jose ranked highly on both F2 and F5, and also on F7, while both Burlington and Rochester instead ranked highly on both F2 and F6, and again on F7. Evidently Factor 7, which represents ascending patent numbers, proved very important in generating the high innovation scores seen in some metropolitan economies but this factor only had a minor impact on the population or employment growth experienced by those economies.
Two major conclusions can be drawn from these results. First, cities that are successful in the high-tech activities of the New Economy can achieve this success by creating and sustaining somewhat different innovation ecosystems. Stated in the simplest possible way, some cities succeed by emphasizing patents more than startups, others by emphasizing startups more than patents, while even others have prospered by striking a balance between these two pillars of high-tech activity. Second, different factors have very different implications for the type of economic growth that is occurring across the U.S. metropolitan landscape. Some innovative ecosystems, especially those heavily involving startups and entrepreneurial activity, are very important for inducing population and employment change. However, other innovative ecosystems that involve patent production, especially in high-value added industries, are more important for inducing per capita productivity change across that landscape.
7. Conclusions
This paper has used multivariate analysis to uncover the significant heterogeneity that currently exists in both innovation and entrepreneurship across U.S. metropolitan areas. This heterogeneity is in part due to the demographic and economic attributes of those places, including their population sizes and labor force participation rates. Although the data were too limited to outline the complete features of distinctive production ecosystems, the existence of these different ecosystems was revealed by a clustering procedure. In fact, the paper claims that eight very different innovation and entrepreneurship types (clubs) of economies appeared to exist in 2010. However, even these eight general types were not entirely homogenous, especially in the more innovative and entrepreneurial cases, so an alternative and more detailed classification with 15 clubs is also provided. Membership in these clubs appears to have implications for the significant differences in population and economic growth that have been recently seen across metropolitan America, although the behavioral underpinnings for these differential growth patterns were not traced out across the relevant labor and housing markets. The study was limited in part because data were not always readily available for the multivariate analysis. One area of special concern is that metropolitan indicators for either economic institutions or social capital could not be included along with the other attributes of economic activity.
But perhaps the major drawback of the study is its cross-sectional approach. Certainly a lot more work is needed to clarify how patent production and business startups are actually translated into higher productivity and the expansion of employment. At the very least this new work will have to include both time and space as the full benefits of any new ideas or processes will be constrained both by temporal lags in their adoption and by spatial lags that reflect the different locations of the nation’s most important cities. Therefore, like a lot of other scientific research on cities these studies will have to contend with the endogeneity that characterizes urban processes and the heterogeneity that characterizes urban actors. In addition, of course, our analysis does not address intra-metropolitan variations that may exist, particularly in larger metropolitan areas.
Acknowledgments
We thank the four referees for their constructive comments. This study was not supported by any external funding.
Author Contributions
Gordon Mulligan completed the first draft of the manuscript, including running the statistical analysis. Neil Reid read and made modifications to the first draft of the manuscript. Matthew Lehnert produced the maps for the manuscript.
Conflicts of Interest
The authors declare no conflict of interest.
Appendix A

Table A1.
Loadings for the 10 orthogonal factors.
| F1 | F2 | F3 | F4 | F5 | F6 | F7 | F8 | F9 | F10 | |
|---|---|---|---|---|---|---|---|---|---|---|
| CCLASS | 0.65 | 0.32 | 0.07 | 0.13 | 0.10 | 0.42 | 0.02 | 0.00 | 0.01 | 0.35 |
| CREATE | 0.75 | 0.20 | −0.04 | 0.21 | 0.01 | 0.32 | 0.03 | 0.04 | 0.15 | 0.34 |
| DEGREE | 0.81 | 0.15 | −0.01 | 0.20 | 0.20 | −0.08 | 0.05 | 0.06 | 0.29 | −0.13 |
| PRIMWF | 0.66 | 0.19 | 0.08 | 0.18 | 0.26 | 0.56 | −0.06 | −0.10 | −0.01 | −0.06 |
| CHPRIM | −0.02 | −0.02 | 0.05 | 0.02 | 0.12 | 0.09 | 0.02 | −0.99 | 0.01 | 0.01 |
| INPRIM | 0.86 | 0.09 | 0.15 | 0.11 | 0.18 | −0.07 | 0.05 | −0.01 | −0.03 | 0.05 |
| GENTRE | 0.45 | 0.44 | 0.38 | 0.16 | 0.18 | 0.17 | −0.02 | −0.02 | 0.58 | 0.16 |
| CHGENT | 0.04 | 0.10 | 0.93 | −0.13 | 0.05 | −0.09 | −0.09 | −0.05 | 0.12 | −0.07 |
| TENTRE | 0.45 | 0.41 | 0.39 | 0.12 | 0.17 | 0.14 | −0.01 | −0.02 | 0.60 | 0.12 |
| CHTENT | 0.06 | −0.09 | 0.92 | −0.05 | 0.05 | 0.09 | −0.02 | −0.05 | 0.12 | −0.07 |
| PATENT | 0.14 | 0.55 | −0.13 | 0.75 | 0.12 | 0.05 | 0.09 | −0.05 | 0.05 | 0.13 |
| LQPATE | 0.30 | 0.88 | −0.05 | 0.05 | 0.10 | 0.14 | 0.14 | 0.04 | −0.04 | 0.11 |
| CHLQPA | 0.03 | 0.17 | −0.04 | 0.03 | 0.00 | −0.02 | 0.98 | −0.01 | 0.00 | 0.02 |
| ENTPAT | 0.15 | 0.90 | 0.07 | 0.08 | 0.11 | 0.02 | 0.10 | −0.01 | 0.28 | 0.04 |
| INNOVA | 0.60 | 0.46 | −0.03 | 0.21 | 0.21 | 0.23 | −0.10 | 0.03 | 0.22 | 0.32 |
| GRDPPC | 0.24 | 0.21 | 0.01 | 0.26 | 0.76 | 0.21 | 0.05 | −0.04 | 0.13 | 0.39 |
| POPULA | 0.17 | 0.04 | −0.09 | 0.95 | 0.03 | 0.11 | −0.02 | −0.06 | 0.07 | 0.06 |
| WAGSAL | 0.27 | 0.35 | −0.16 | 0.44 | 0.35 | 0.13 | 0.06 | −0.01 | 0.15 | 0.60 |
| EARRAT | 0.08 | −0.10 | −0.02 | 0.13 | 0.42 | 0.80 | −0.02 | −0.13 | 0.11 | 0.12 |
| EMPRAT | 0.30 | 0.09 | 0.16 | −0.03 | 0.85 | 0.26 | −0.02 | 0.01 | 0.05 | −0.06 |
Note: Bold indicates absolute value ≥0.20.
References
- Alcaly, R.E. The New Economy; Farrar, Straus, and Giroux: New York, NY, USA, 2003. [Google Scholar]
- Moretti, E. The New Geography of Jobs; Houghton Mifflin Harcourt: Boston, MA, USA, 2012. [Google Scholar]
- Storper, M.; Scott, A.J. Rethinking human capital, creativity and urban growth. J. Econ. Geogr. 2008, 9, 147–167. [Google Scholar] [CrossRef]
- Engel, J.S. Global Clusters of Innovation: Entrepreneurial Engines of Economic Growth around the World; Edward Elgar: Cheltenham, UK, 2014. [Google Scholar]
- Storper, M.; Kemeny, T.; Makarem, N.P.; Osman, T. The Rise and Fall of Urban Economies: Lessons from San Francisco and Los Angeles; Stanford Business Books; Stanford University Press: Stanford, CA, USA, 2015. [Google Scholar]
- Mulligan, G.; Reid, N.; Carruthers, J.; Lehnert, M. Exploring innovation gaps in the American space economy. In Regional Research Frontiers: The Next Fifty Years; Jackson, R., Schaeffer, P., Eds.; Springer International Publishing: Cham, Switzerland, 2017. [Google Scholar]
- Porter, M.E. The Competitive Advantage of Nations; Free Press: New York, NY, USA, 1990. [Google Scholar]
- Porter, M.E. The Five Competitive Forces That Shape Strategy; Harvard Business Review: Tampa, FL, USA, 2008. [Google Scholar]
- Florida, R.L. Cities and the Creative Class; Routledge: New York, NY, USA, 2005. [Google Scholar]
- Florida, R.L. The Rise of the Creative Class; Basic Books: New York, NY, USA, 2012. [Google Scholar]
- Jacobs, J. The Economy of Cities; Random House: New York, NY, USA, 1969. [Google Scholar]
- Glaeser, E.L. Triumph of the City: How Our Greatest Invention Makes Us Richer, Smarter, Greener, Healthier, and Happier; Penguin Press: New York, NY, USA, 2011. [Google Scholar]
- Romer, P.M. Increasing returns and long-run growth. J. Political Econ. 1986, 94, 1002–1037. [Google Scholar] [CrossRef]
- Lucas, R. On the mechanics of economic development. J. Monet. Econ. 1988, 22, 3–42. [Google Scholar] [CrossRef]
- Scott, A.J. Capitalism and urbanization in a new key? The cognitive-cultural dimension. Soc. Forces 2007, 85, 1465–1482. [Google Scholar] [CrossRef]
- Scott, A.J. Production and work in the American metropolis: A macroscopic approach. Ann. Reg. Sci. 2007, 42, 787–805. [Google Scholar] [CrossRef]
- Hanushek, E.A.; Woessmann, L. The role of cognitive skills in economic development. J. Econ. Lit. 2008, 46, 607–668. [Google Scholar] [CrossRef]
- Baptista, R.; Escária, V.; Madruga, P. Entrepreneurship, regional development and job creation: The case of Portugal. Small Bus. Econ. 2007, 30, 49–58. [Google Scholar] [CrossRef]
- Kantis, H.; Ishida, M.; Komori, M. Entrepreneurship in Emerging Economies: The Creation and Development of New Firms in Latin America and East Asia; Inter-American Development Bank: Washington, DC, USA, 2002. [Google Scholar]
- Acs, Z.J.; Amorós, J.E. Entrepreneurship and competitiveness dynamics in Latin America. Small Bus. Econ. 2008, 31, 305–322. [Google Scholar] [CrossRef]
- Hall, P. Cities in Civilization; Pantheon Books: New York, NY, USA, 1998. [Google Scholar]
- Shearmur, R. Are cities the font of innovation? A critical review of the literature on cities and innovation. Cities 2012, 29, S9–S18. [Google Scholar] [CrossRef]
- Cheshire, P.C.; Nathan, M.; Overman, H.G. Urban Economics and Urban Policy: Challenging Conventional Policy Wisdom; Edward Elgar: Cheltenham, UK, 2014. [Google Scholar]
- Acs, Z.; Audretsch, D. (Eds.) Handbook of Entrepreneurship Research, 2nd ed.; Springer: New York, NY, USA, 2010. [Google Scholar]
- Giarratani, F.; Hewings, G.; McCann, P. (Eds.) Handbook of Industry Studies and Economic Geography; Edward Elgar: Cheltenham, UK, 2013. [Google Scholar]
- Karlsson, C.; Andersson, M.; Norman, T. (Eds.) Handbook of Research Methods and Applications in Economic Geography; Edward Elgar Publishing: Northampton, MA, USA, 2015. [Google Scholar]
- Shearmur, R.; Carrincazeaux, C.; Doloreux, D. (Eds.) Handbook on the Geographies of Innovation; Edward Elgar: Cheltenham, UK, 2016. [Google Scholar]
- Asheim, B.; Coenen, L.; Moodysson, J. Methods and applications of regional innovation systems analysis. In Handbook of Research Methods and Applications in Economic Geography; Karlsson, C., Andersson, M., Norman, T., Eds.; Edward Elgar: Cheltenham, UK, 2015. [Google Scholar]
- Jaffe, A. Real effects of academic research. Am. Econ. Rev. 1989, 79, 957–970. [Google Scholar]
- Feldman, M.P. The Geography of Innovation; Kluwer Academic: Dordrecht, The Netherlands, 1994. [Google Scholar]
- Anselin, L.; Varga, A.; Acs, Z. Local geographic spillovers between university research and high technology innovations. J. Urban Econ. 1997, 42, 422–448. [Google Scholar] [CrossRef]
- Capello, R. Spatial and sectoral characteristics of relational capital in innovation activity. Eur. Plan. Stud. 2002, 10, 177–200. [Google Scholar] [CrossRef]
- Fritsch, M. Cooperation and the efficiency of regional R&D activities. Camb. J. Econ. 2004, 28, 829–846. [Google Scholar]
- Ponds, R.; Oort, F.V.; Frenken, K. Innovation, spillovers and university-industry collaboration: An extended knowledge production function approach. J. Econ. Geogr. 2009, 10, 231–255. [Google Scholar] [CrossRef]
- Iyer, S.; Kitson, M.; Toh, B. Social capital, economic growth and regional development. Reg. Stud. 2005, 39, 1015–1040. [Google Scholar] [CrossRef]
- Inkpen, A.C.; Tsang, E.W.K. Social Capital, networks, and knowledge transfer. Acad. Manag. Rev. 2005, 30, 146–165. [Google Scholar] [CrossRef]
- Youtie, J.; Shapira, P. Building an innovation hub: A case study of the transformation of university roles in regional technological and economic development. Res. Policy 2008, 37, 1188–1204. [Google Scholar] [CrossRef]
- Etzkowitz, H.; Klofsten, M. The innovating region: Toward a theory of knowledge-based regional development. R D Manag. 2005, 35, 243–255. [Google Scholar] [CrossRef]
- Tödtling, F.; Trippl, M. One size fits all? Towards a differentiated regional innovation policy approach. Reg. Policy 2005, 34, 1203–1219. [Google Scholar] [CrossRef]
- Asheim, B.; Grillitsch, M.; Trippl, M. Regional innovation systems: Past-present-future. In Handbook on the Geographies of Innovation; Shearmur, R., Carrincazeaux, C., Doloreux, D., Eds.; Edward Elgar: Cheltenham, UK, 2016. [Google Scholar]
- Howells, J. Tacit knowledge, innovation and economic geography. Urban Stud. 2002, 39, 871–884. [Google Scholar] [CrossRef]
- Breschi, S. Knowledge spillovers and local innovation systems: A critical survey. Ind. Corp. Change 2001, 10, 975–1005. [Google Scholar] [CrossRef]
- Balconi, M.; Breschi, S.; Lissoni, F. Networks of inventors and the role of academia: An exploration of Italian patent data. Res. Policy 2004, 33, 127–145. [Google Scholar] [CrossRef]
- Maggioni, M.A.; Nosvelli, M.; Uberti, T.E. Space versus networks in the geography of innovation: A European analysis. Pap. Reg. Sci. 2007, 86, 471–493. [Google Scholar] [CrossRef]
- Tödtling, F.; Trippl, M. How do firms acquire knowledge in different sectoral and regional contexts? In Handbook on the Geographies of Innovation; Shearmur, R., Carrincazeaux, C., Doloreux, D., Eds.; Edward Elgar: Cheltenham, UK, 2016. [Google Scholar]
- Haltiwanger, J.; Jarmin, R.; Miranda, J. Who Creates Jobs? Small vs. Large vs. Young; NBER Working Paper Series; National Bureau of Economic Research: Cambridge, MA, USA, 2010. [Google Scholar]
- Armington, C.; Acs, Z.J. The determinants of regional variation in new firm formation. Reg. Stud. 2002, 36, 33–45. [Google Scholar] [CrossRef]
- Lee, S.Y.; Florida, R.; Acs, Z. Creativity and entrepreneurship: A regional analysis of new firm formation. Reg. Stud. 2004, 38, 879–891. [Google Scholar] [CrossRef]
- Audretsch, D.B.; Keilbach, M. Entrepreneurship capital and regional growth. Ann. Reg. Sci. 2005, 39, 457–469. [Google Scholar] [CrossRef]
- Wennekers, S.; Thurik, R. Linking entrepreneurship and economic growth. Small Bus. Econ. 1999, 13, 27–55. [Google Scholar] [CrossRef]
- Fritsch, M. Methods of analyzing the relationship between new business formation and regional development. In Handbook of Research Methods and Applications in Economic Geography; Karlsson, C., Andersson, M., Norman, T., Eds.; Edward Elgar: Cheltenham, UK, 2015. [Google Scholar]
- Baumol, W.; Litan, R.; Schramm, C. Good Capitalism, Bad Capitalism and the Economics of Growth and Prosperity; Yale University Press: New Haven, RI, USA, 2007. [Google Scholar]
- Spencer, J.W.; Gómez, C. The relationship among national institutional structures, economic factors, and domestic entrepreneurial activity: A multicountry study. J. Bus. Res. 2004, 57, 1098–1107. [Google Scholar] [CrossRef]
- Gittell, R.; Sohl, J.; Tebaldi, E. Do entrepreneurship and high-tech concentration create jobs? Exploring the growth in employment in U.S. metropolitan areas from 1991 to 2007. Econ. Dev. Q. 2014, 28, 244–253. [Google Scholar] [CrossRef]
- Tsvetkova, A. Innovation, entrepreneurship, and metropolitan economic performance: Empirical test of recent theoretical propositions. Econ. Dev. Q. 2015, 29, 299–316. [Google Scholar] [CrossRef]
- Glaeser, E. Entrepreneurship and the City; Working Paper 13551; National Bureau of Economic Research: Cambridge, MA, USA, 2007. [Google Scholar]
- Acemoglu, D.; Robinson, J. Why Nations Fail; Random House: New York, NY, USA, 2012. [Google Scholar]
- Saxenian, A.L. Regional Advantage: Culture and Competition in Silicon Valley and Route 128; Harvard University Press: Cambridge, MA, USA, 1994. [Google Scholar]
- Rodríguez-Pose, A.C.A. Do institutions matter for regional development? Reg. Stud. 2013, 47, 1034–1047. [Google Scholar] [CrossRef]
- Wolfe, D.; Gertler, M. (Eds.) Growing Urban Economies; University of Toronto Press: Toronto, ON, Canada, 2016. [Google Scholar]
- Hathaway, I. Tech Starts: High-Technology Business Formation and Job Creation in the United States. Available online: http://www.kauffman.org (accessed on 17 January 2017).
- Calendar Year Patent Statistics: Listing of All U.S. Metropolitan and Micropolitan Areas, Total Utility Counts, 2000–2013. Available online: www.upto.gov (accessed on 17 January 2017).
- StatsAmerica. Available online: http://statsamerica.org/ (accessed on 17 January 2017).
- Bureau of Economic Analysis. Available online: http://bea.gov/ (accessed on 17 January 2017).
- Mulligan, G.F.; Reid, N.; Moore, M.S. A typology of metropolitan labor markets in the US. Cities 2014, 41, S12–S29. [Google Scholar] [CrossRef]
- Savageau, D. Places Rated Almanac; Hungry Minds: New York, NY, USA, 2000. [Google Scholar]
- Naples City Florida Quick Facts from the US Census Bureau. Available online: www.census.gov/quickfacts/table/PST045215/1247625,00 (accessed on 17 January 2017).
- Location Quotient Calculator. Available online: http://data.bls.gov/location_quotient/ControllerServlet (accessed on 17 January 2017).
- Tulshyan, R. The $100 Million Fund That’s Fostering Detroit’s Minority Startup Entrepreneurs; Forbes.Com: New York, NY, USA, 2015. [Google Scholar]
Figure 1.
Type 4 economies.

Figure 2.
Type 5 economies.

Figure 3.
Type 6 economies.

Figure 4.
Type 7 economies.

Figure 5.
Type 8 economies.

Table 1.
Interpreting the 10 innovation factors.
| Factor | % Variance | Interpretation |
|---|---|---|
| F1 | 19.7 | Young, educated, and highly talented innovators |
| F2 | 14.5 | High patent production with high entrepreneurship |
| F3 | 10.7 | Ascending entrepreneurial |
| F4 | 9.8 | Large cities with diverse patents and entrepreneurs |
| F5 | 9.6 | Young workers in very high valued-added industries |
| F6 | 7.6 | Young, talented workers in high value-added industries |
| F7 | 5.2 | Ascending in patent production |
| F8 | 5.1 | Significant rise in young workers |
| F9 | 5.0 | High entrepreneurship but low patent production |
| F10 | 4.8 | Talented workers with moderate entrepreneurship and patents |
Note: F8 is flipped (reversed) to facilitate interpretation.
Table 2.
Top metropolitan economies ranked by innovation index.
| Rank | City | INNOV2 | % due to F1 | Club |
|---|---|---|---|---|
| 1 | Boulder | 53.2 | 4.6 | 8.2 |
| 2 | San Jose | 50.4 | −9.2 | 8.2 |
| 3 | Seattle | 37.3 | −1.4 | 7 |
| 4 | San Francisco | 35.7 | −0.3 | 7 |
| 5 | Washington | 33.0 | 33.8 | 6.3 |
| 6 | Corvallis | 30.2 | 47.7 | 8.1 |
| 7 | New York | 29.2 | 5.9 | 7 |
| 8 | Denver | 23.3 | 32.3 | 6.3 |
| 9 | Durham | 22.8 | 48.5 | 6.3 |
| 10 | Boston | 21.5 | 38.5 | 7 |
| 11 | Fort Collins | 20.0 | 61.3 | 5.1 |
| 12 | Burlington VT | 19.9 | 9.2 | 8.1 |
| 13 | Raleigh | 19.4 | 38.8 | 5.2 |
| 14 | Trenton | 17.4 | 68.8 | 6.3 |
| 15 | Portland OR | 17.3 | 34.2 | 6.3 |
| 16 | Des Moines | 17.0 | 1.8 | 6.2 |
| 17 | Kansas City | 16.8 | 27.7 | 6.2 |
| 18 | Cheyenne | 16.7 | −28.7 | 6.1 |
| 19 | Los Angeles | 15.5 | 8.1 | 7 |
| 20 | Atlanta | 15.1 | 45.1 | 7 |
| 21 | Huntsville | 15.0 | 57.1 | 5.1 |
| 22 | Chicago | 14.8 | 9.3 | 7 |
| 23 | Colorado Sp | 14.7 | 64.1 | 5.1 |
| 24 | Champaign | 14.6 | 73.3 | 2 |
| 25 | Bremerton | 14.6 | 48.8 | 8.1 |
| 26 | Philadelphia | 14.3 | 29.6 | 7 |
| 27 | Salt Lake City | 13.9 | 33.3 | 6.3 |
| 28 | San Diego | 13.5 | 17.7 | 7 |
| 29 | Richmond | 13.4 | 41.9 | 6.2 |
| 30 | Rochester MN | 13.2 | 49.7 | 8.1 |
| 31 | Missoula | 12.9 | 51.9 | 4.1 |
| 32 | Bridgeport | 12.5 | 77.4 | 6.3 |
| 33 | Minneapolis | 12.5 | 52.2 | 3 |
| 34 | Provo | 12.3 | 61.1 | 5.2 |
| 35 | Santa Fe | 12.3 | 127.5 | 5.1 |
Note: Innovation score calculated as ∑V(Fi)0.5 (FSi) where V is the % variance explained by the ith rotated factor and FS is the associated factor score (where the signs on F8 are reversed).
Table 3.
The innovation clubs: Average score and performance.
| Type | Number | INNOV2 | Startups | Patents | HETER |
|---|---|---|---|---|---|
| 1 | 7 | −9.52 | 0.50 | 0.16 | 21.72 |
| 2 | 77 | −6.43 | 0.32 | 0.12 | 5.44 |
| 3 | 121 | −2.61 | 0.38 | 0.15 | 4.57 |
| 4 | 44 | 0.64 | 0.69 | 0.47 | 14.45 |
| 4.1 | 23 | −0.86 | 0.68 | 0.28 | 9.78 |
| 4.2 | 17 | 2.88 | 0.58 | 0.44 | 10.21 |
| 4.3 | 4 | −0.26 | 1.20 | 1.65 | 59.20 |
| 5 | 35 | 1.05 | 0.94 | 0.43 | 10.87 |
| 5.1 | 19 | −0.73 | 0.90 | 0.31 | 8.33 |
| 5.2 | 16 | 3.18 | 0.99 | 0.56 | 13.88 |
| 6 | 48 | 8.39 | 1.01 | 0.28 | 9.29 |
| 6.1 | 16 | 5.87 | 0.96 | 0.25 | 7.68 |
| 6.2 | 25 | 6.54 | 0.83 | 0.17 | 6.65 |
| 6.3 | 7 | 20.78 | 1.80 | 0.71 | 22.42 |
| 7 | 14 | 16.29 | 1.21 | 0.62 | 28.91 |
| 7.1 | 10 | 13.79 | 1.03 | 0.41 | 32.58 |
| 7.2 | 4 | 22.54 | 1.65 | 1.11 | 19.71 |
| 8 | 6 | 30.58 | 2.13 | 3.23 | 86.48 |
| 8.1 | 4 | 12.95 | 0.75 | 2.11 | 37.56 |
| 8.2 | 2 | 53.08 | 4.50 | 4.07 | 184.33 |
| All | 352 | 0.00 | 0.61 | 0.29 | 9.97 |
Note: All figures are club means; startups and patents are densities.
Table 4.
Innovation clubs and metropolitan attributes.
| Type | CLIME | AMBIN | HCOST | EDUCA | RECRE | HEALT | TRANS | CRIME |
|---|---|---|---|---|---|---|---|---|
| 1 | 143.4 | 47.0 | 30.6 | 33.6 | 144.1 | 94.5 | 42.0 | 101.0 |
| 2 | 101.2 | 58.8 | 119.5 | 69.1 | 75.6 | 73.3 | 70.8 | 90.4 |
| 3 | 84.6 | 93.1 | 123.2 | 93.2 | 98.9 | 107.5 | 102.1 | 94.5 |
| 4 | 78.7 | 122.3 | 91.5 | 128.5 | 86.6 | 109.3 | 105.2 | 138.5 |
| 5 | 147.0 | 128.3 | 51.6 | 120.5 | 128.3 | 97.1 | 103.1 | 93.2 |
| 6 | 98.6 | 127.3 | 84.0 | 125.4 | 111.5 | 119.2 | 128.5 | 97.9 |
| 7 | 142.0 | 187.8 | 37.6 | 144.4 | 174.2 | 127.6 | 182.8 | 69.5 |
| 8 | 131.9 | 85.2 | 52.4 | 123.3 | 80.3 | 106.8 | 76.9 | 142.9 |
Note: National metropolitan average is 100 where higher scores are generally preferred.
Table 5.
Innovation clubs and economic performance.
| Type (N) | ΔP0510 | ΔP1013 | ΔE0510 | ΔE1013 | ΔW0510 | ΔW1013 | ΔG0510 | ΔG1013 | UNR10 |
|---|---|---|---|---|---|---|---|---|---|
| 1 (7) | 7.19 | 3.86 | −3.88 | 6.48 | 9.34 | 5.28 | −20.40 | −1.88 | 12.22 |
| 2 (77) | 4.63 | 1.13 | −0.83 | 3.89 | 15.48 | 5.63 | −2.45 | 2.25 | 11.12 |
| 3 (121) | 4.44 | 1.32 | −0.50 | 3.62 | 14.83 | 6.10 | −2.96 | 2.06 | 9.51 |
| 4 (44) | 5.98 | 2.55 | 1.98 | 3.90 | 15.30 | 6.45 | 0.38 | 1.92 | 7.72 |
| 5 (35) | 7.28 | 2.73 | −1.43 | 4.61 | 14.51 | 5.15 | −6.96 | −0.30 | 10.09 |
| 6 (48) | 5.77 | 2.74 | 1.91 | 4.55 | 16.34 | 6.51 | 1.42 | 1.52 | 8.44 |
| 7 (14) | 5.51 | 3.23 | 0.96 | 7.29 | 14.67 | 6.82 | −3.03 | 4.31 | 9.93 |
| 8 (6) | 5.03 | 2.47 | −1.00 | 5.29 | 19.27 | 4.73 | 8.86 | −0.13 | 7.41 |
| All (352) | 5.25 | 1.92 | −0.05 | 4.18 | 15.15 | 5.99 | −2.38 | 1.74 | 9.59 |
Table 6.
Correlations between factor scores and economic performance.
| Factor | ΔP0510 | ΔP1013 | ΔE0510 | ΔE1013 | ΔW0510 | ΔW1013 | ΔG0510 | ΔG1013 |
|---|---|---|---|---|---|---|---|---|
| 1 | 0.29 * | 0.40 * | 0.16 * | 0.10 | −0.03 | −0.15 * | −0.04 | −0.19 * |
| 2 | −0.03 | 0.02 | −0.06 | 0.08 | −0.01 | 0.08 | 0.12 * | 0.05 |
| 3 | 0.16 * | 0.13 * | 0.12 * | −0.09 | 0.13 * | −0.02 | 0.10 | −0.21 * |
| 4 | −0.01 | 0.09 | 0.03 | 0.19 * | −0.01 | −0.01 | −0.04 | 0.06 |
| 5 | −0.09 | 0.19 * | 0.25 * | 0.07 | 0.26 * | 0.31 * | 0.38 * | 0.16 * |
| 6 | 0.09 | 0.02 | 0.20 * | 0.07 | 0.11 * | 0.12 * | 0.26 * | 0.15 * |
| 7 | 0.01 | −0.01 | 0.02 | −0.02 | 0.19 * | −0.03 | 0.09 | −0.03 |
| 8 | −0.07 | 0.00 | −0.10 | −0.02 | −0.05 | 0.00 | −0.05 | 0.05 |
| 9 | 0.17 * | 0.17 * | 0.06 | 0.21 * | −0.04 | 0.03 | −0.11 * | 0.04 |
| 10 | −0.08 | 0.03 | −0.06 | 0.08 | 0.09 | −0.01 | 0.07 | −0.04 |
Note: * Significant at 0.05 level.
© 2017 by the authors. Licensee MDPI, Basel, Switzerland. This article is an open access article distributed under the terms and conditions of the Creative Commons Attribution (CC BY) license (http://creativecommons.org/licenses/by/4.0/).
Share and Cite
MDPI and ACS Style
Mulligan, G.; Reid, N.; Lehnert, M. Metropolitan Innovation in the New Economy. Urban Sci. 2017, 1, 18. https://doi.org/10.3390/urbansci1020018
AMA Style
Mulligan G, Reid N, Lehnert M. Metropolitan Innovation in the New Economy. Urban Science. 2017; 1(2):18. https://doi.org/10.3390/urbansci1020018
Chicago/Turabian StyleMulligan, Gordon, Neil Reid, and Matthew Lehnert. 2017. "Metropolitan Innovation in the New Economy" Urban Science 1, no. 2: 18. https://doi.org/10.3390/urbansci1020018