Article

High-Energy and Very High-Energy Constraints from Log-Parabolic Spectral Models in Narrow-Line Seyfert 1 Galaxies

1
INAF, Osservatorio Astronomico di Brera, Via Emilio Bianchi 46, I-23807 Merate (LC), Italy
2
Centre for Space Research, North-West University, Potchefstroom 2531, South Africa
3
LUTH, Observatoire de Paris, CNRS, Université Paris Diderot, PSL Research University Paris, 5 Place Jules Janssen, F-92195 Meudon, France
*
Author to whom correspondence should be addressed.
Universe 2020, 6(4), 54; https://doi.org/10.3390/universe6040054
Submission received: 26 March 2020 / Revised: 1 April 2020 / Accepted: 14 April 2020 / Published: 16 April 2020
(This article belongs to the Special Issue Seyfert Galaxies Astrophysics)

Abstract

:
Narrow-line Seyfert 1 galaxies (NLSy1s) are a well established class of γ -ray sources, showing the presence of a jet like the more common flat-spectrum radio quasars. The evidence of γ -ray emission poses the issue of the location of the γ -ray emitting zone and of the contribution of the γ - γ absorption within the broad-line region (BLR), since such objects have been detected by Fermi-LAT in the MeV-GeV energy range but not by imaging atmospheric Cherenkov telescopes beyond 100 GeV. We discuss how the spectral properties of three NLSy1s (SBS 0846+513, PMN J0948+0022, and PKS 1502+036) derived from the Fermi Large Area Telescope Fourth Source Catalog (4FGL) compared with theoretical models based on the observed properties of the BLR. In particular, we focus on the question on how simple power-law spectral models and log-parabolic ones could be disentangled in γ -ray narrow-line Seyfert 1 galaxies by means of current Fermi-LAT or future imaging atmospheric Cherenkov telescopes data. We found that the only possibility for a log-parabolic model to mimic a power-law model in the energy band above E 100 GeV is to have a very small value of the curvature parameter β 0.05 .

1. Introduction

The MeV-GeV spectra of jetted active galactic nuclei (AGN) can be fitted by using either power-law or log-parabolic models [1,2,3]. As the maximum likelihood method to extract spectral parameters in the γ -ray energy band does not allow us to define the goodness of a fit (see, for example, [4]), the only way to distinguish between the two models is a clear deviation between data and models visible in the spectra. However, in the Fermi-LAT energy band up to a few tens of GeV, where most of the jetted AGN have been detected, it is not possible to break this degeneracy, unless the curvature of the spectrum is highly significant. Nonetheless, in the latter case, a degeneracy remains between the log-parabola and a broken power-law model. We also note that the log-parabola model is more than a simple fitting procedure, but contains an additional physical condition to the jet particle acceleration. As shown in [5], this kind of spectra require a dependency on the energy of the acceleration probability. The problem is important not only in view of locating the region where high-energy gamma rays are emitted, but also to better understand the mechanisms accelerating particles working in a relativistic jet. The location of the γ -ray emitting region is still an open and very timely issue. There is evidence that in some jetted sources the location of the γ -ray emitting region could reside at different distances from the central black-hole during different flaring episodes of the same source as suggested by, e.g., [6] for PKS 1222+216.
The large energy band that will be accessible by the Cherenkov Telescope Array (CTA), from 20 GeV to hundreds of TeV [7], will allow us to break the degeneracy. However, one issue remains open, that is, if there are one or more combinations of photon indices and curvature for which the two models hold the degeneracy even in the CTA energy range. Solving this problem is the aim of the present work. To complete this task, we extended the simulation work performed to date on a sample of jetted Narrow-Line Seyfert 1 galaxies (NLSy1s) [8,9], focusing on the possibility to disentangle the different spectral models.

2. The Sample

Among active galactic nuclei, narrow-line Seyfert 1 galaxies show quite distinctive characteristics. Their definition as a class is due to [10]. These sources show narrow permitted emission lines (FWHM ( H β ) < 2000 km s−1), weak [ O III ] lines with a ratio [ OIII ] / H β < 3 , strong optical Iron emission lines (high FeII / H β ratio), and a relatively low-mass black hole ( 10 6 10 8 M) accreting close to the Eddington limit (see [11] and references therein for an historical review of the NLSy1s properties). A first major step forward in the study of this class of sources was given by their detection in the radio band, although only a small fraction of them (4%–7%) shows significant radio emission [12]. A second breakthrough was their detection in the γ -ray energy band, which revealed the presence of a jet of accelerated particles oriented towards the observer [13]. The latest version of the Fermi Large Area Telescope Fourth Source Catalog (4FGL, revision v5) [14] contains four identified and five associated γ -ray NLSy1 galaxies, respectively, but more sources have been found during flaring episodes or dedicated analysis. Interestingly, their spectra can be fit either by a power-law or by a log-parabola model, the latter ones indicating some curvature in their spectra.
A comprehensive sample of γ -ray narrow-line Seyfert 1 galaxies has been discussed by [8], who collected twenty sources from the literature. Among them, three sources seem to be the most promising ones to be investigated at energies above a few tens of GeV, namely SBS 0846+513, PMN J0948+0022, and PKS 1502+036. We briefly report here their γ -ray discovery literature, while for a detailed description of their high-energy characteristics we refer to [15,16,17] and references therein. Table 1 shows the γ -ray spectral parameters for the log-parabola model as reported in the 4FGL [14]. The data span eight years of science operations, from 4 August 2008 to 2 August 2016. We note that these parameters were not used in [8], which in turn generally adopted the power-law model.
SBS 0846+513 ( z = 0.585 ) was reported as a new γ -ray source in [18], as a consequence of a γ -ray flare detected by it Fermi-LAT in 2010, identified by analyzing the first 30 months of data. This source was subsequently confirmed by [19] and then by [20] analyzing the first 40 months of data.
PMN J0948+0022 ( z = 0.585 ) is the first NLSy1 detected in the γ -ray energy band already during the first months of operations of Fermi-LAT in 2008 [21]. Two intense γ -ray outbursts were then detected in 2010 July [22] and at the end of 2012 [23]. During the latest outburst, there was also an attempt to detect the source at very high-energy (VHE) with VERITAS at energies E > 200 GeV, but without success [23]. We note that VERITAS observations began almost a week after the γ -ray maximum, during the decaying phase of the flare.
PKS 1502+036 ( z = 0.408 ) was discovered as a γ -ray source in [13], by using the first year of Fermi-LAT data (4 August 2008–5 August 2009).

3. Broad-Line Region versus Log-Parabola Spectral Model Absorption

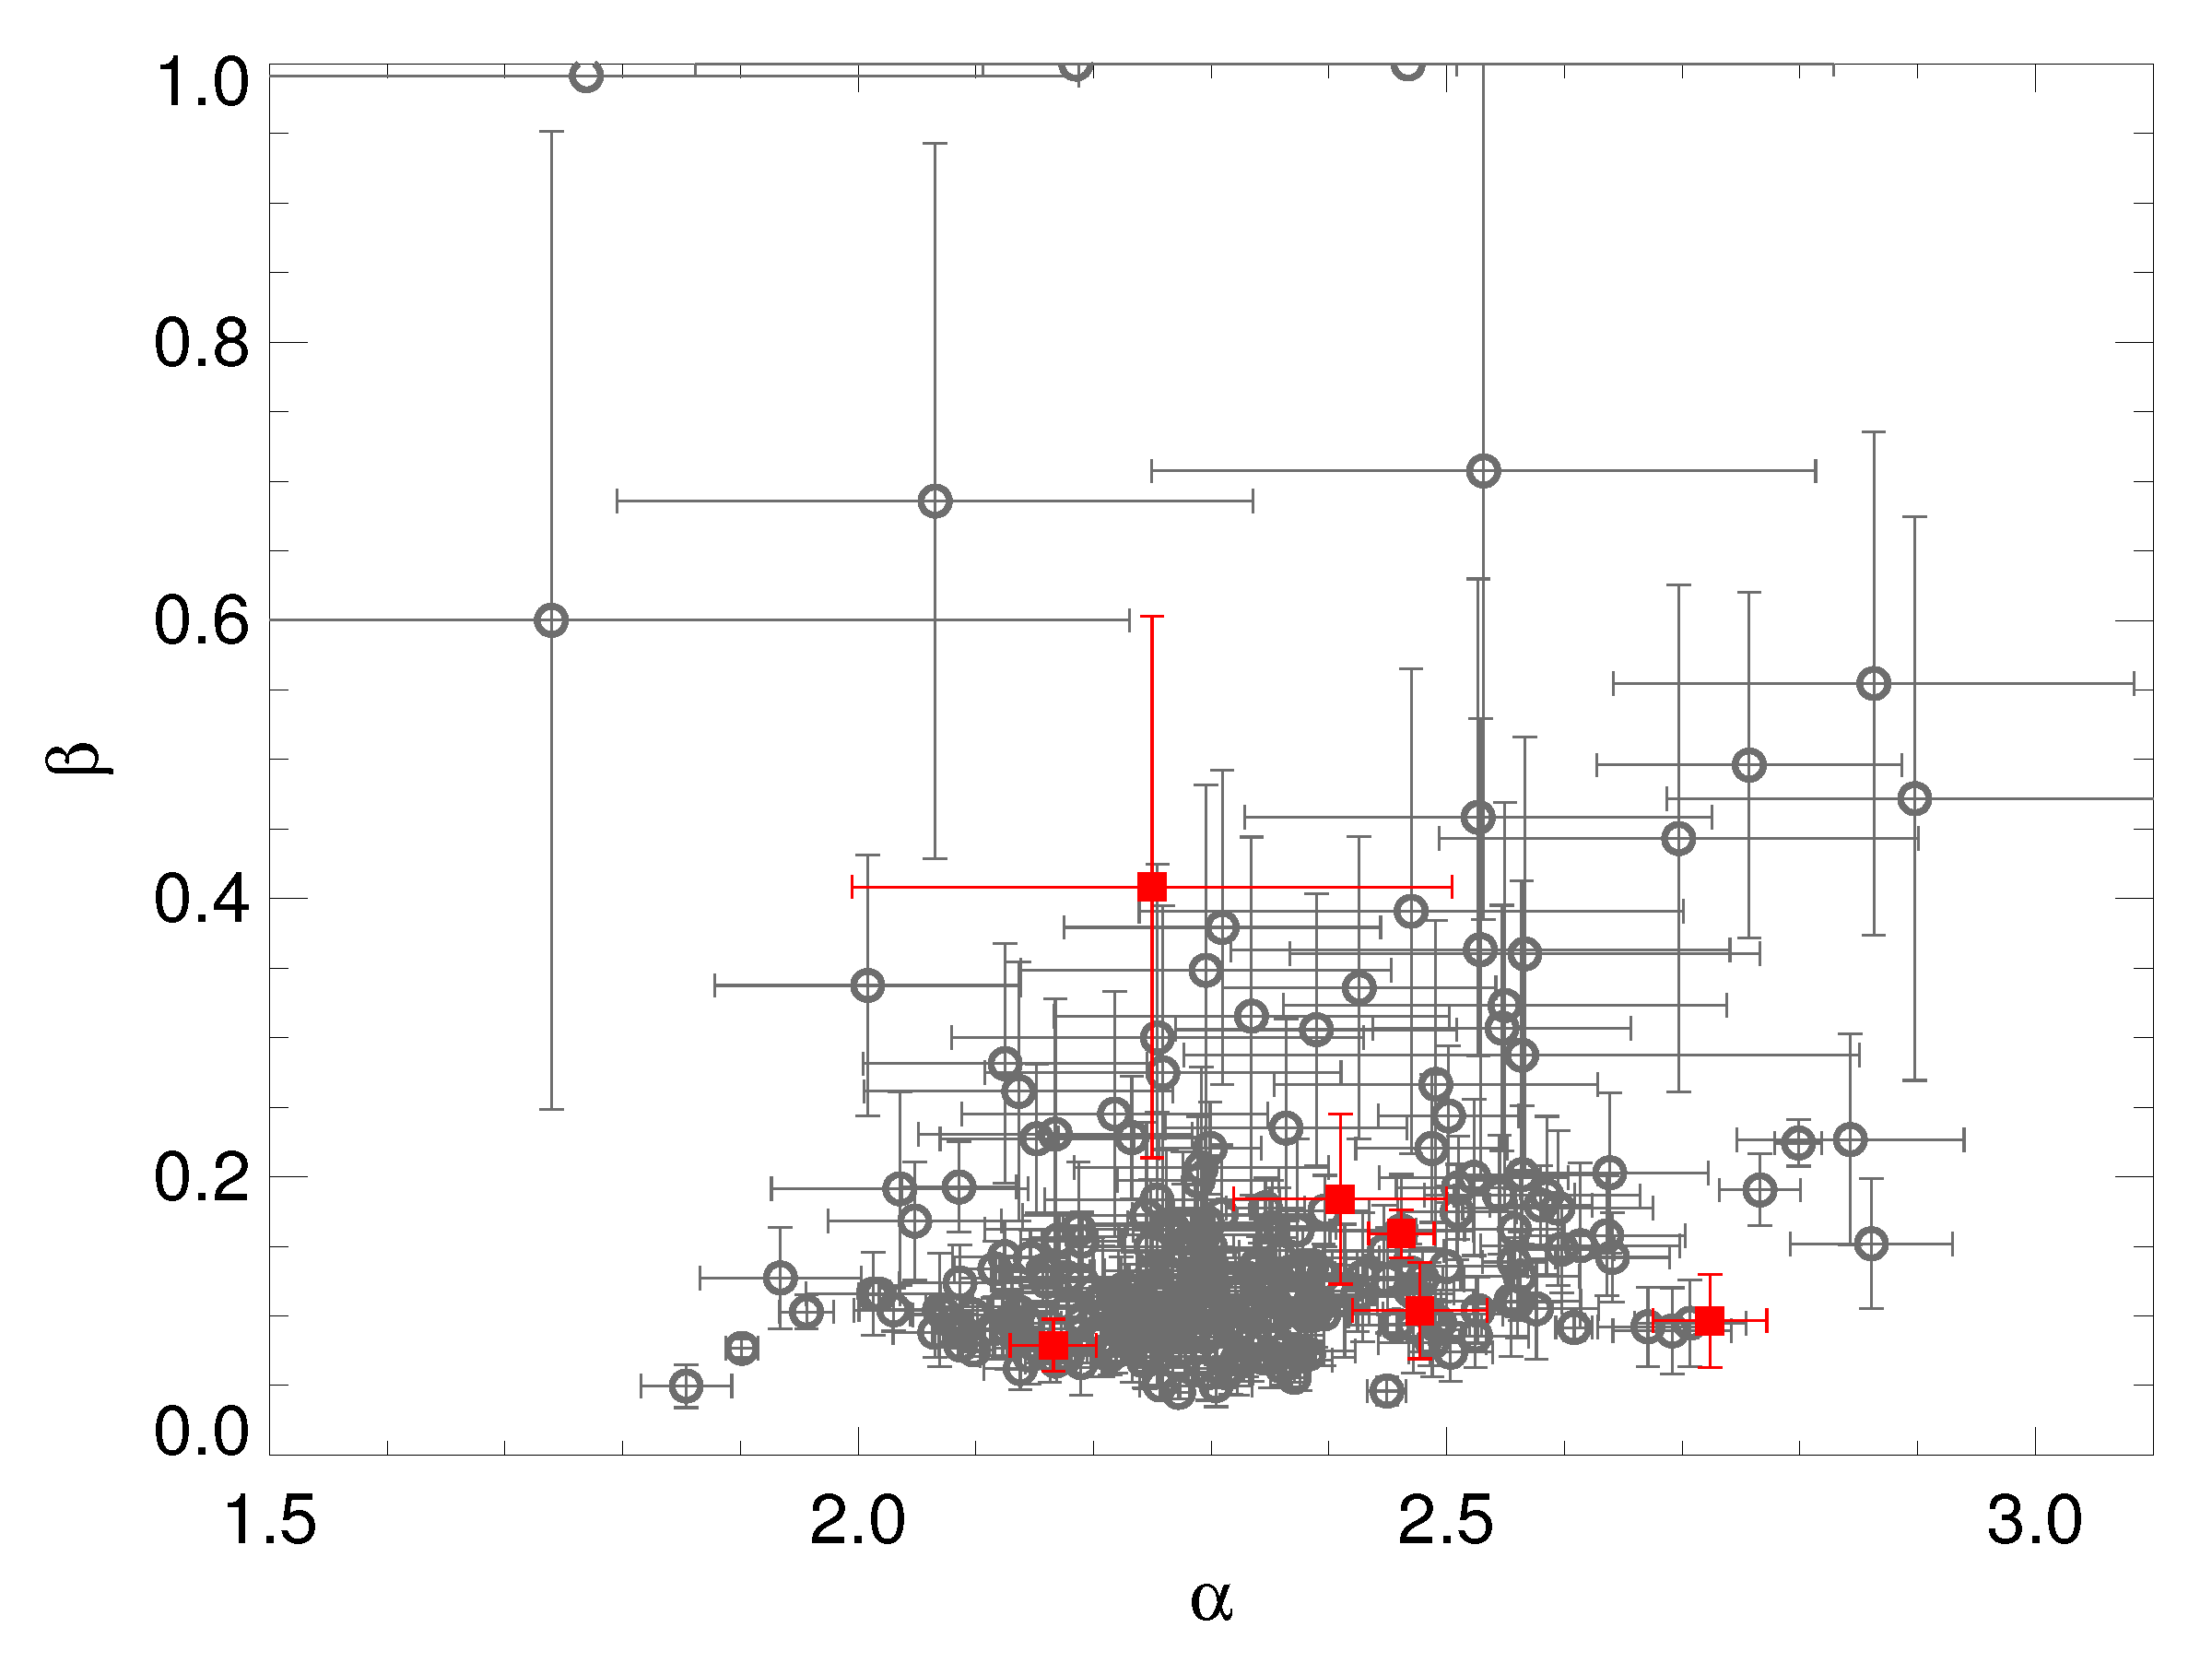
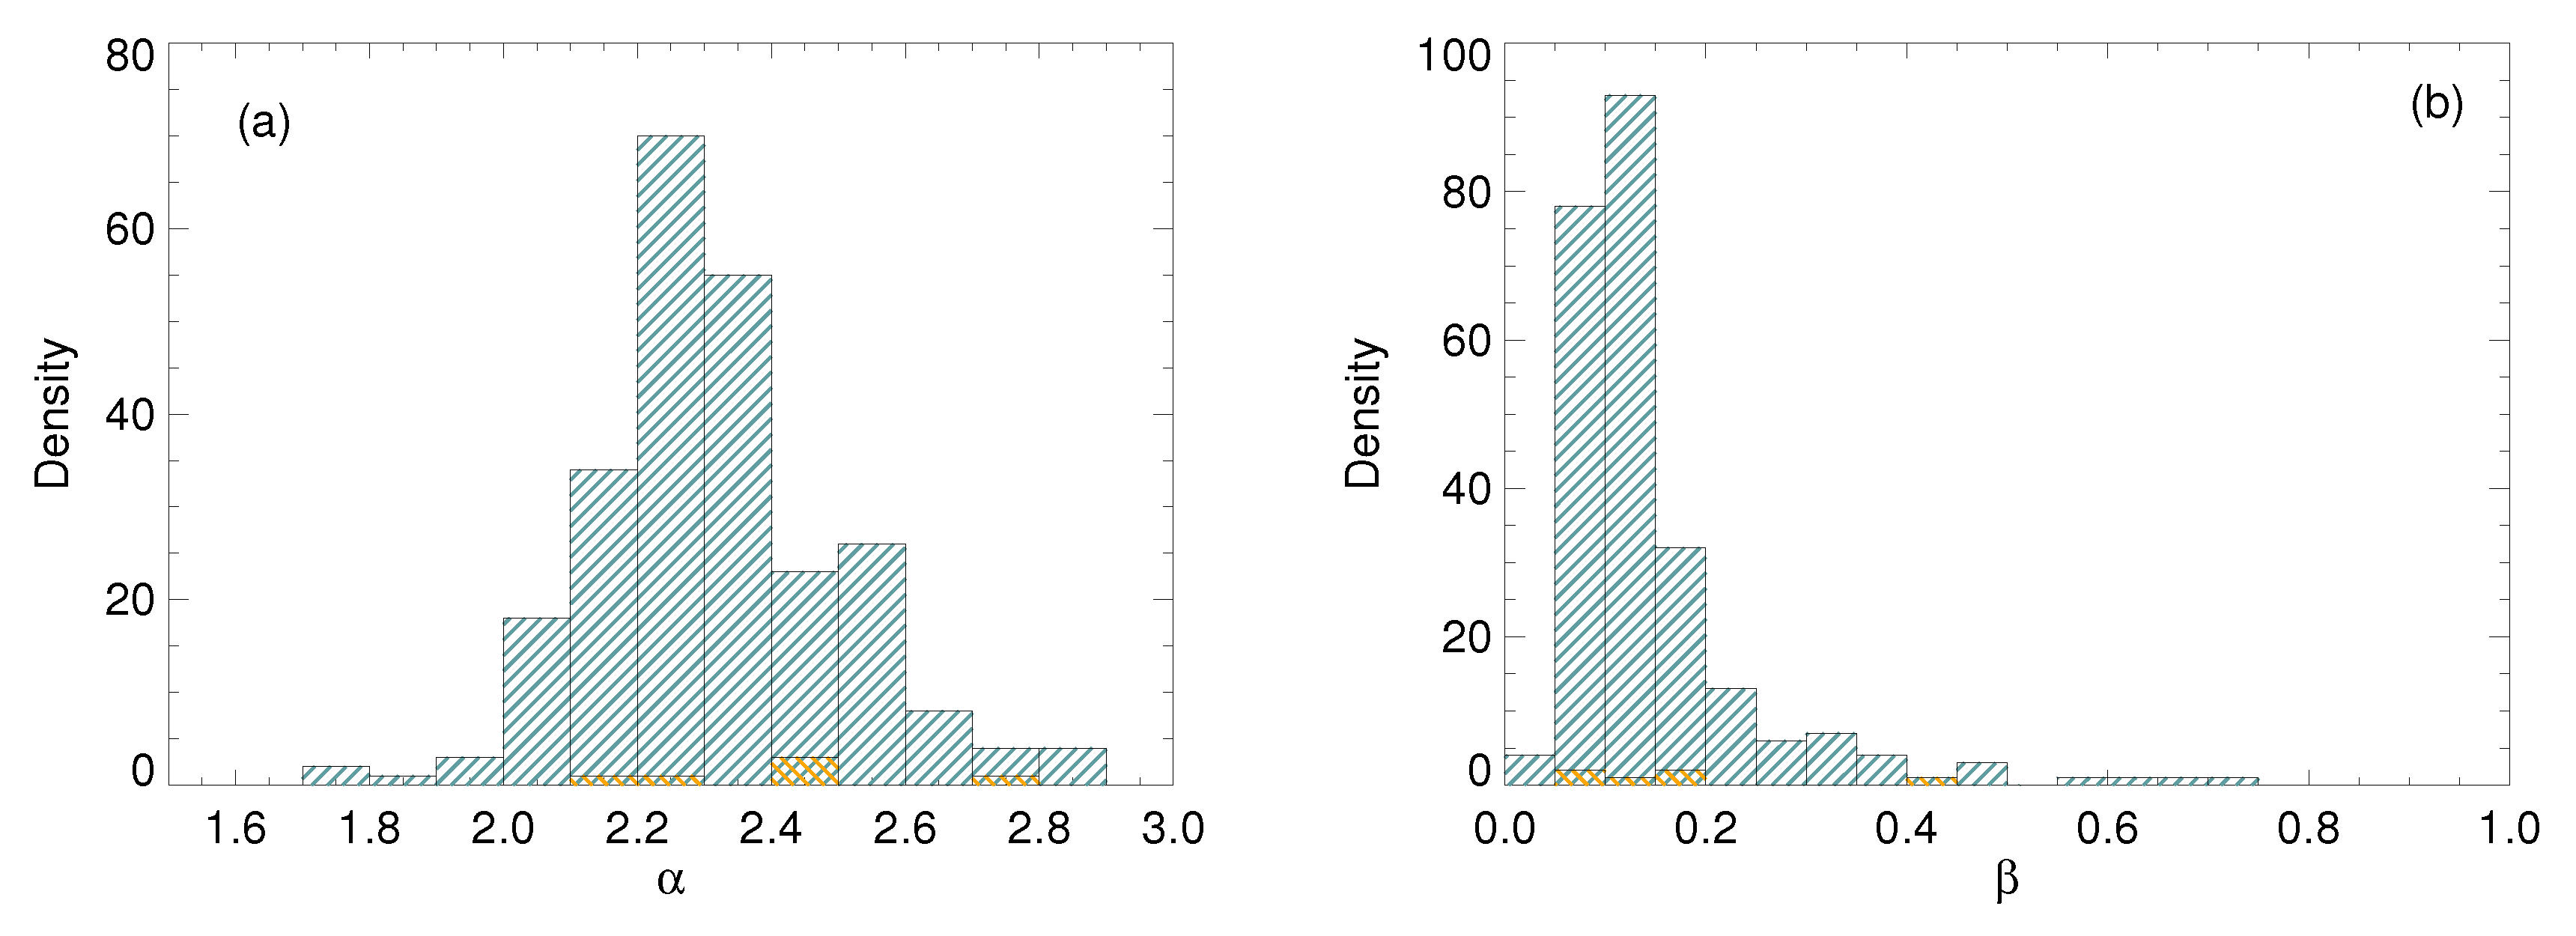
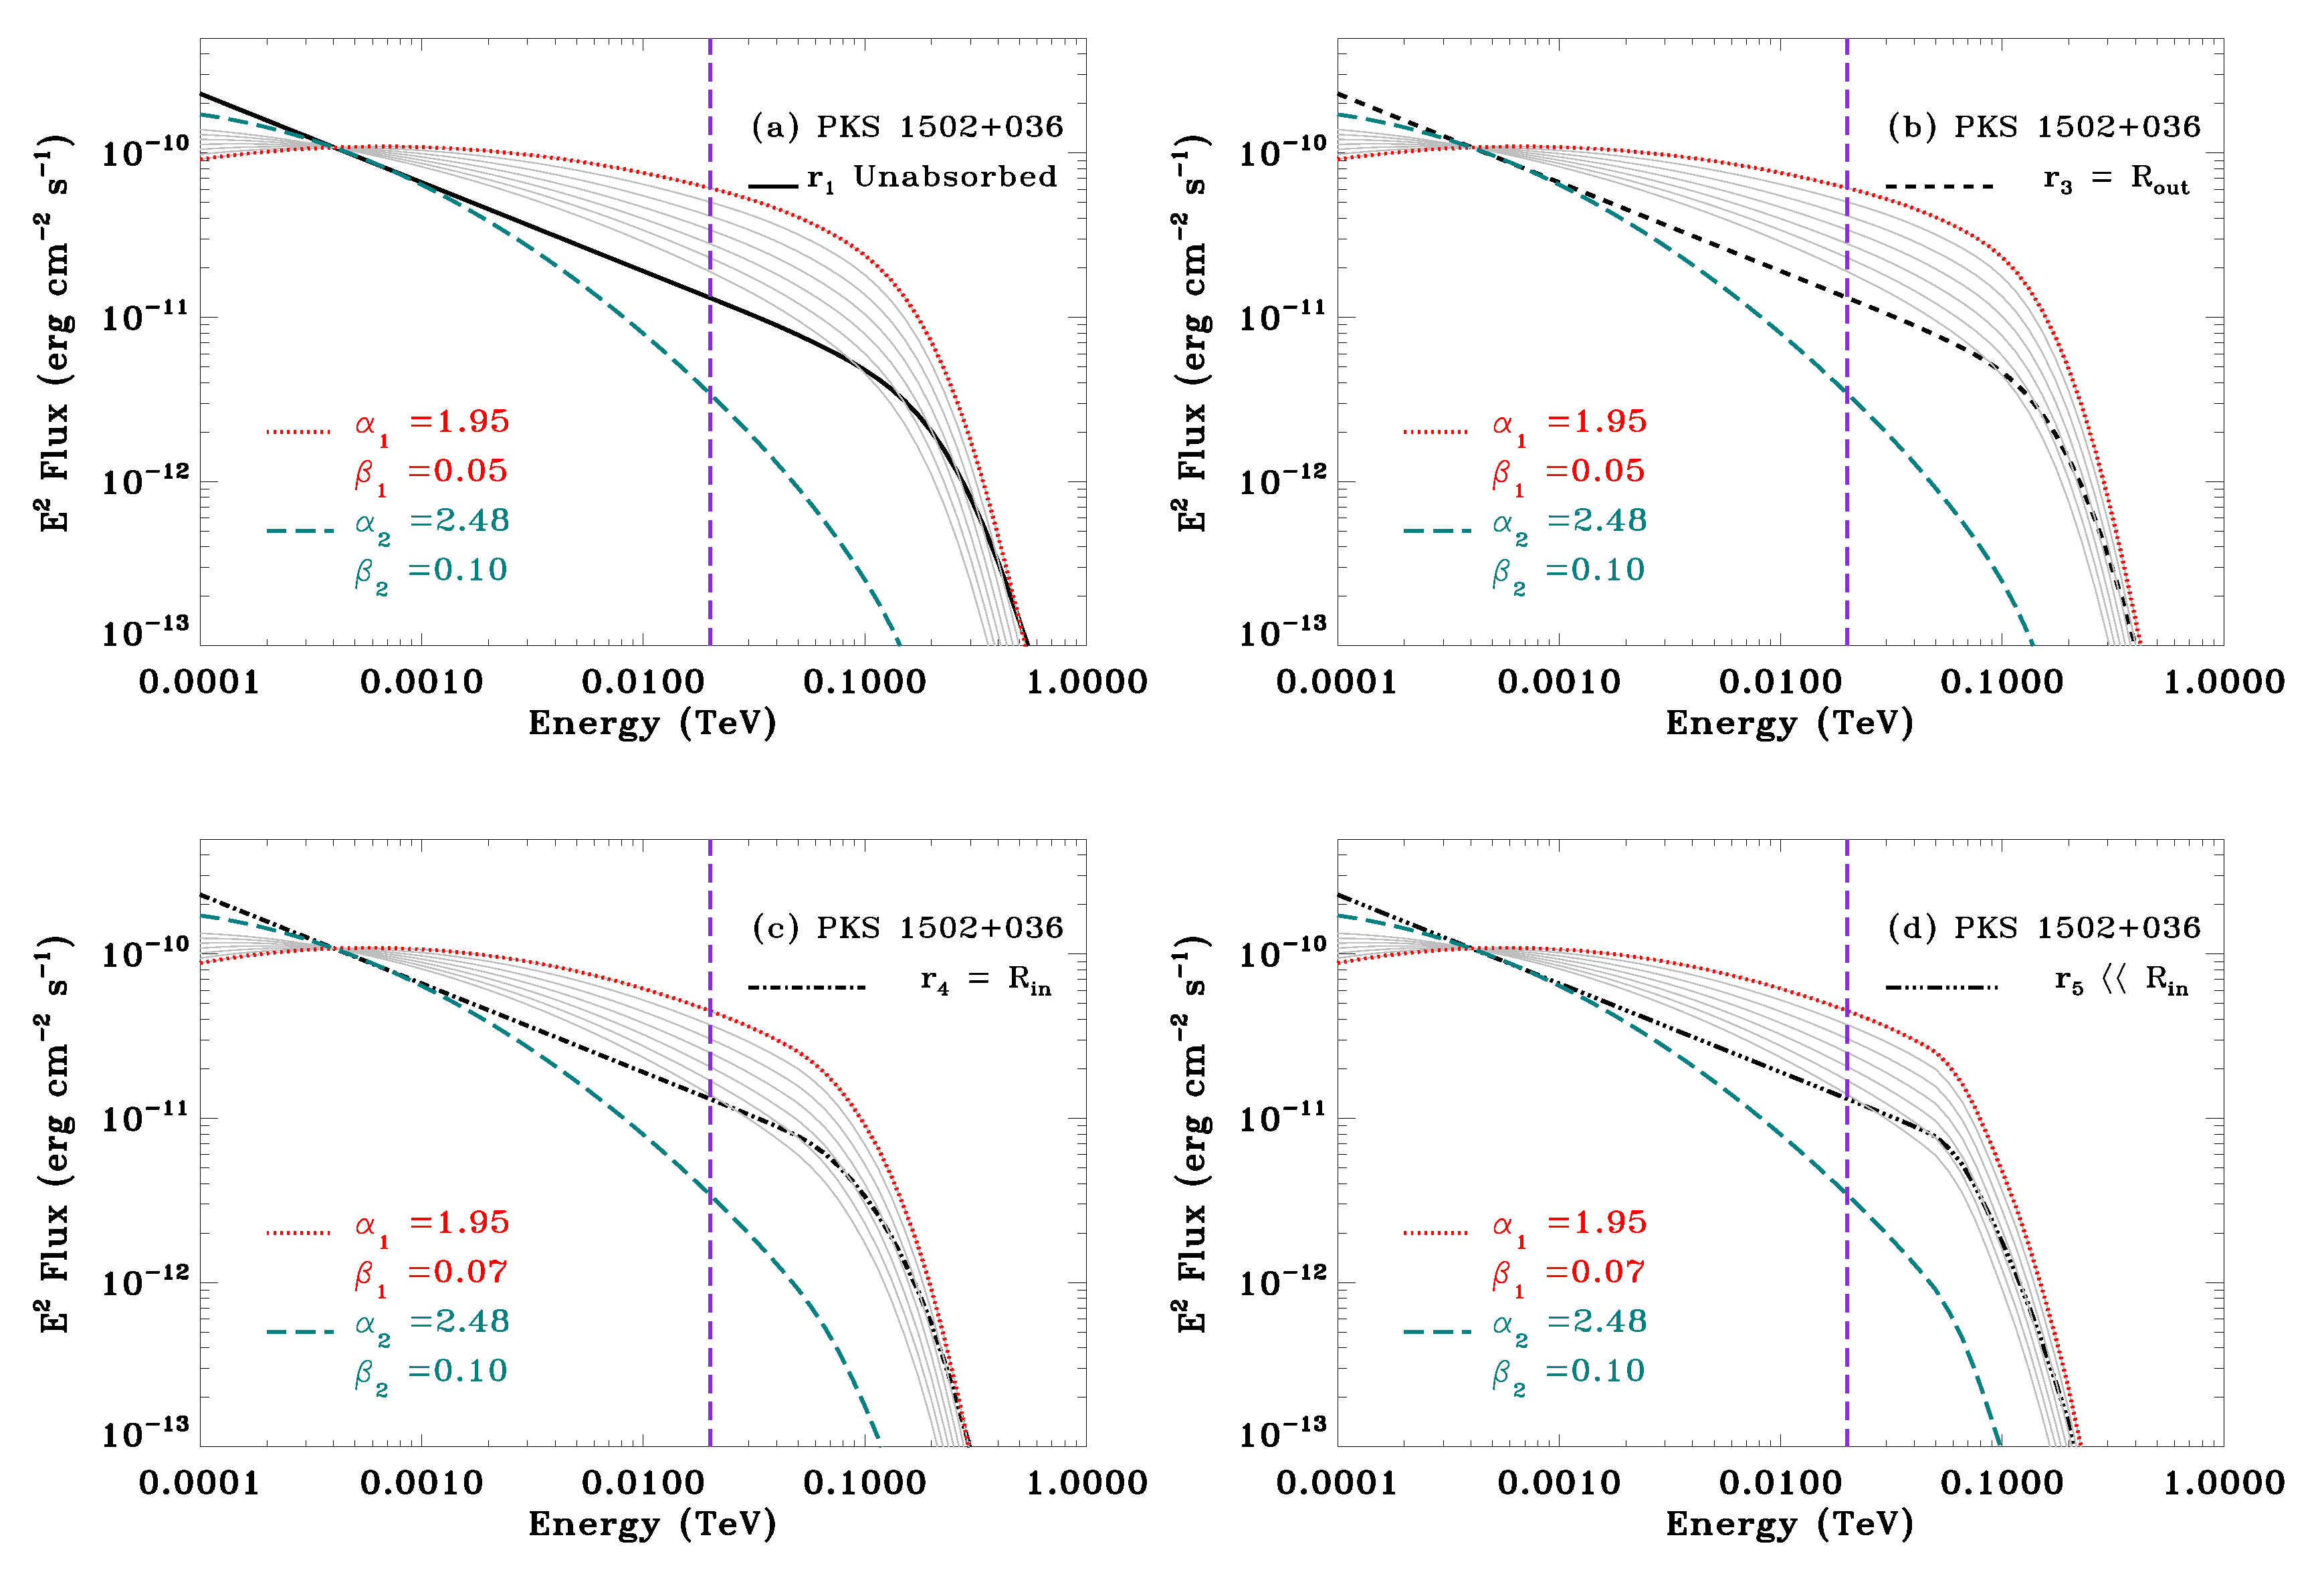
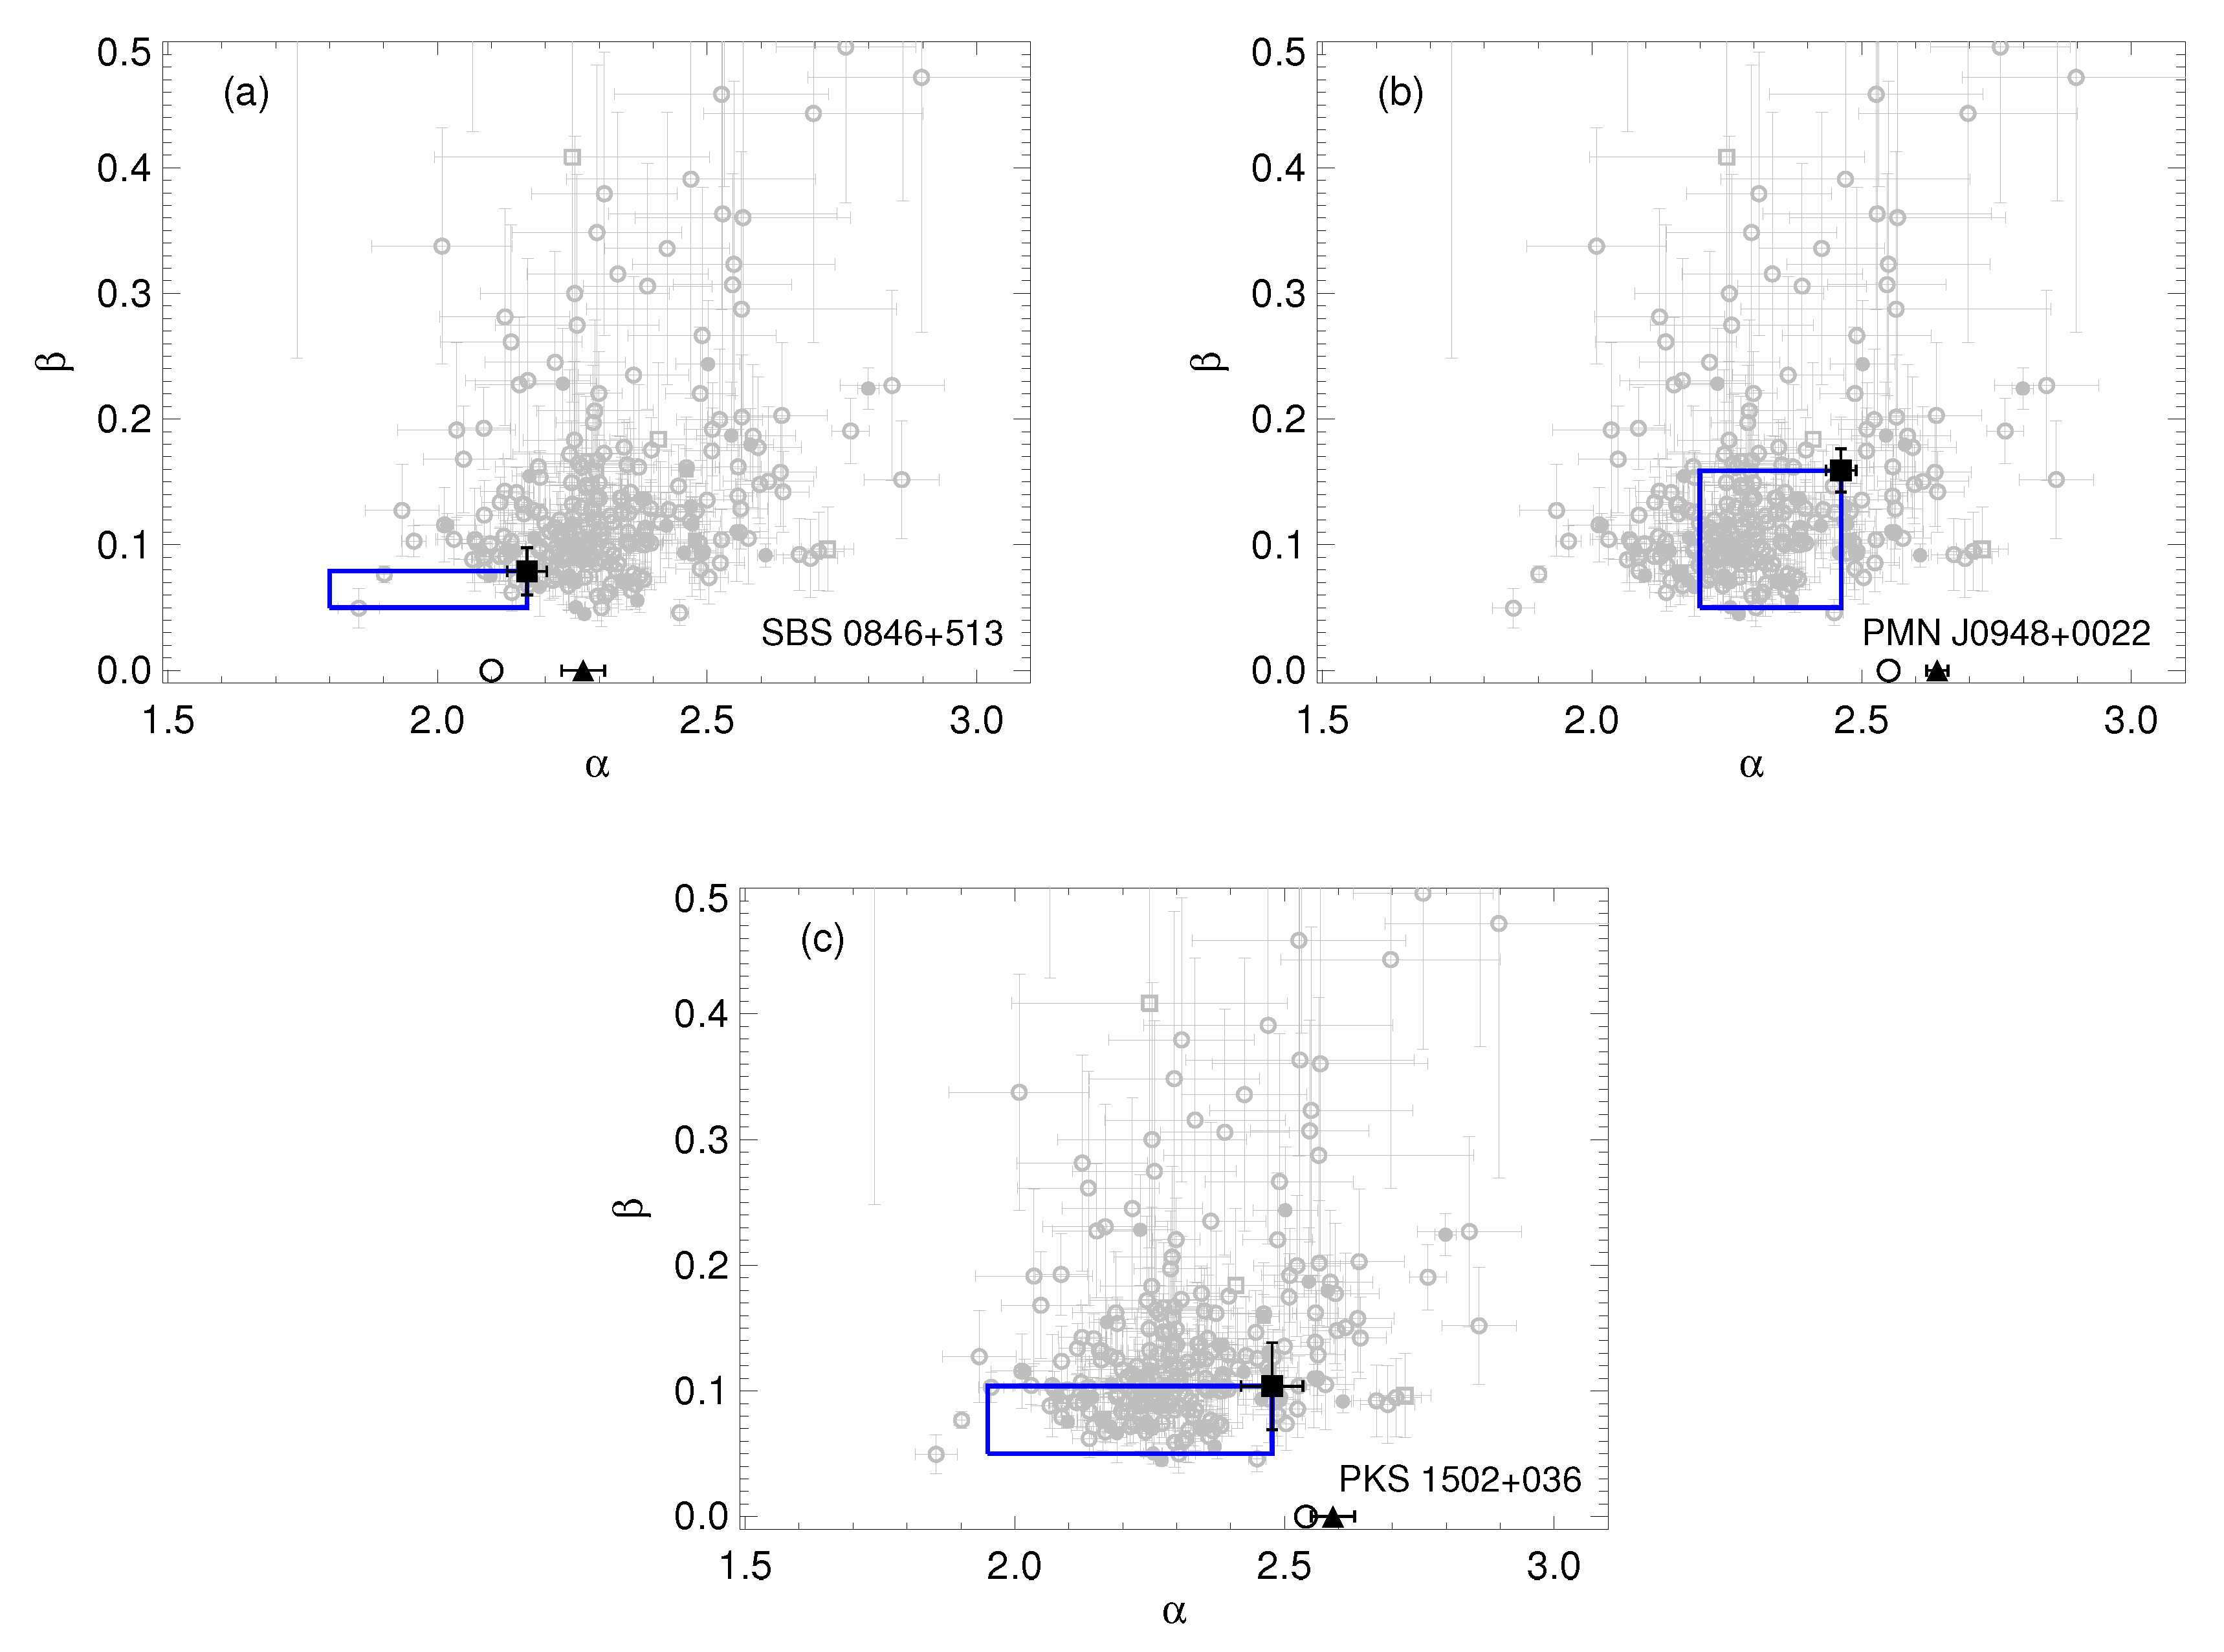
3.1. The Log-Parabola Parameters Space in the 4FGL Context

Narrow-line Seyfert 1 galaxies have been demonstrated to posses characteristics which resemble those of other extra-galactic jetted sources, in particular flat-spectrum radio quasars (see [24] for a review). In order to understand the typical parameter space of the photon index and curvature of the log-parabolic models, we retrieved the values of ( α , β ) for all the quasars and NLSy1s in the 4FGL catalog with the log-parabola indicated as the preferential model. We obtain a sample of 248 quasars and 6 NLSy1s, whose parameters are displayed in Figure 1. It is worth reminding that the curvature parameter in the model adopted by the 4FGL pegs at the value of 1: therefore, the three sources with β = 1 are a spurious fit and are not considered in the statistics on β reported below.
We can now consider the distributions of the two spectral parameters. These distributions will allow us to put initial constraints on α and β . Figure 2 shows the distributions of both the α and β parameters for the whole sample of flat-spectrum radio quasar (blue lines) and narrow-line Seyfert 1 galaxies (orange lines), respectively. We obtain α = 2.32 ± 0.19 , while β = 0.15 ± 0.10 , with 1.74 α 2.90 and 0.05 β 0.71 . We should note, however, that while the distribution on the α parameter has a low skewness value ( s k = 0.33 ), the distribution on the β parameter has a high skewness value ( s k = 2.73 ). A large fraction, 84%, of β values are equal or lower than 0.2. This could be a hint of a non robust log-parabolic fit of the spectrum of those sources in Figure 1 with β ( 0.5 0.6 ) whose error-bars are particularly large. The small average value of the curvature also explains the degeneracy with the power-law model in the Fermi-LAT energy band.

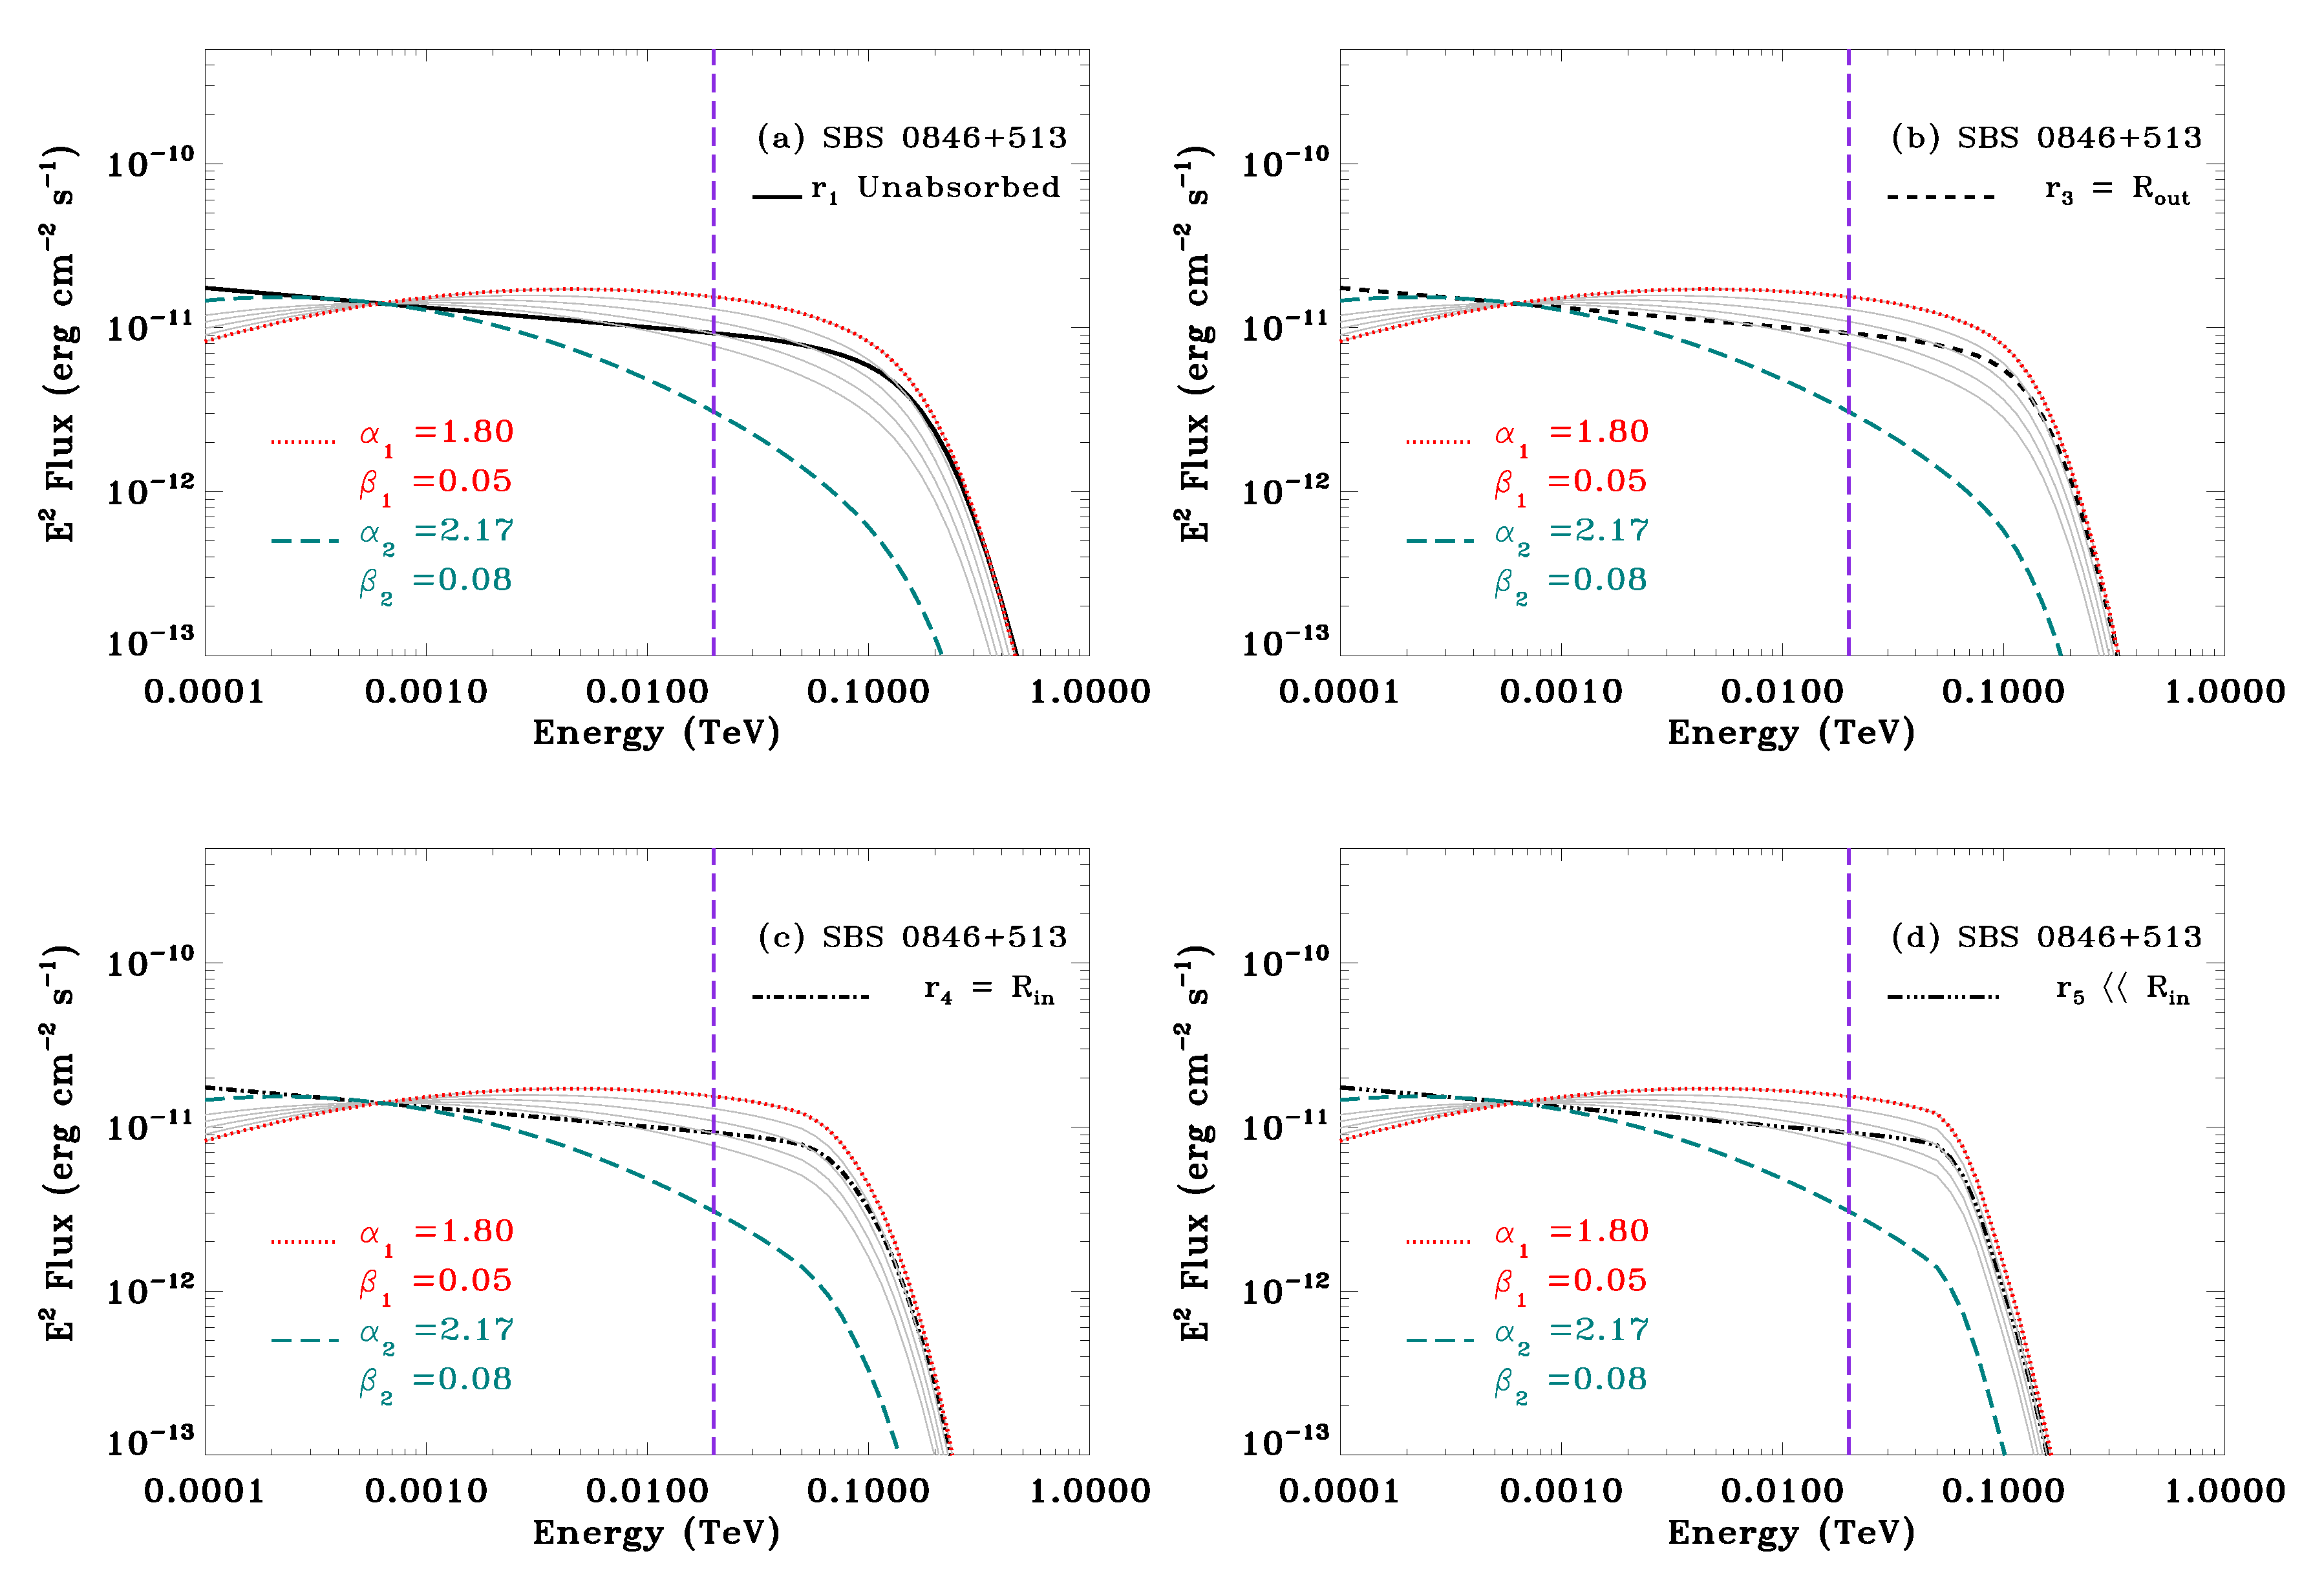
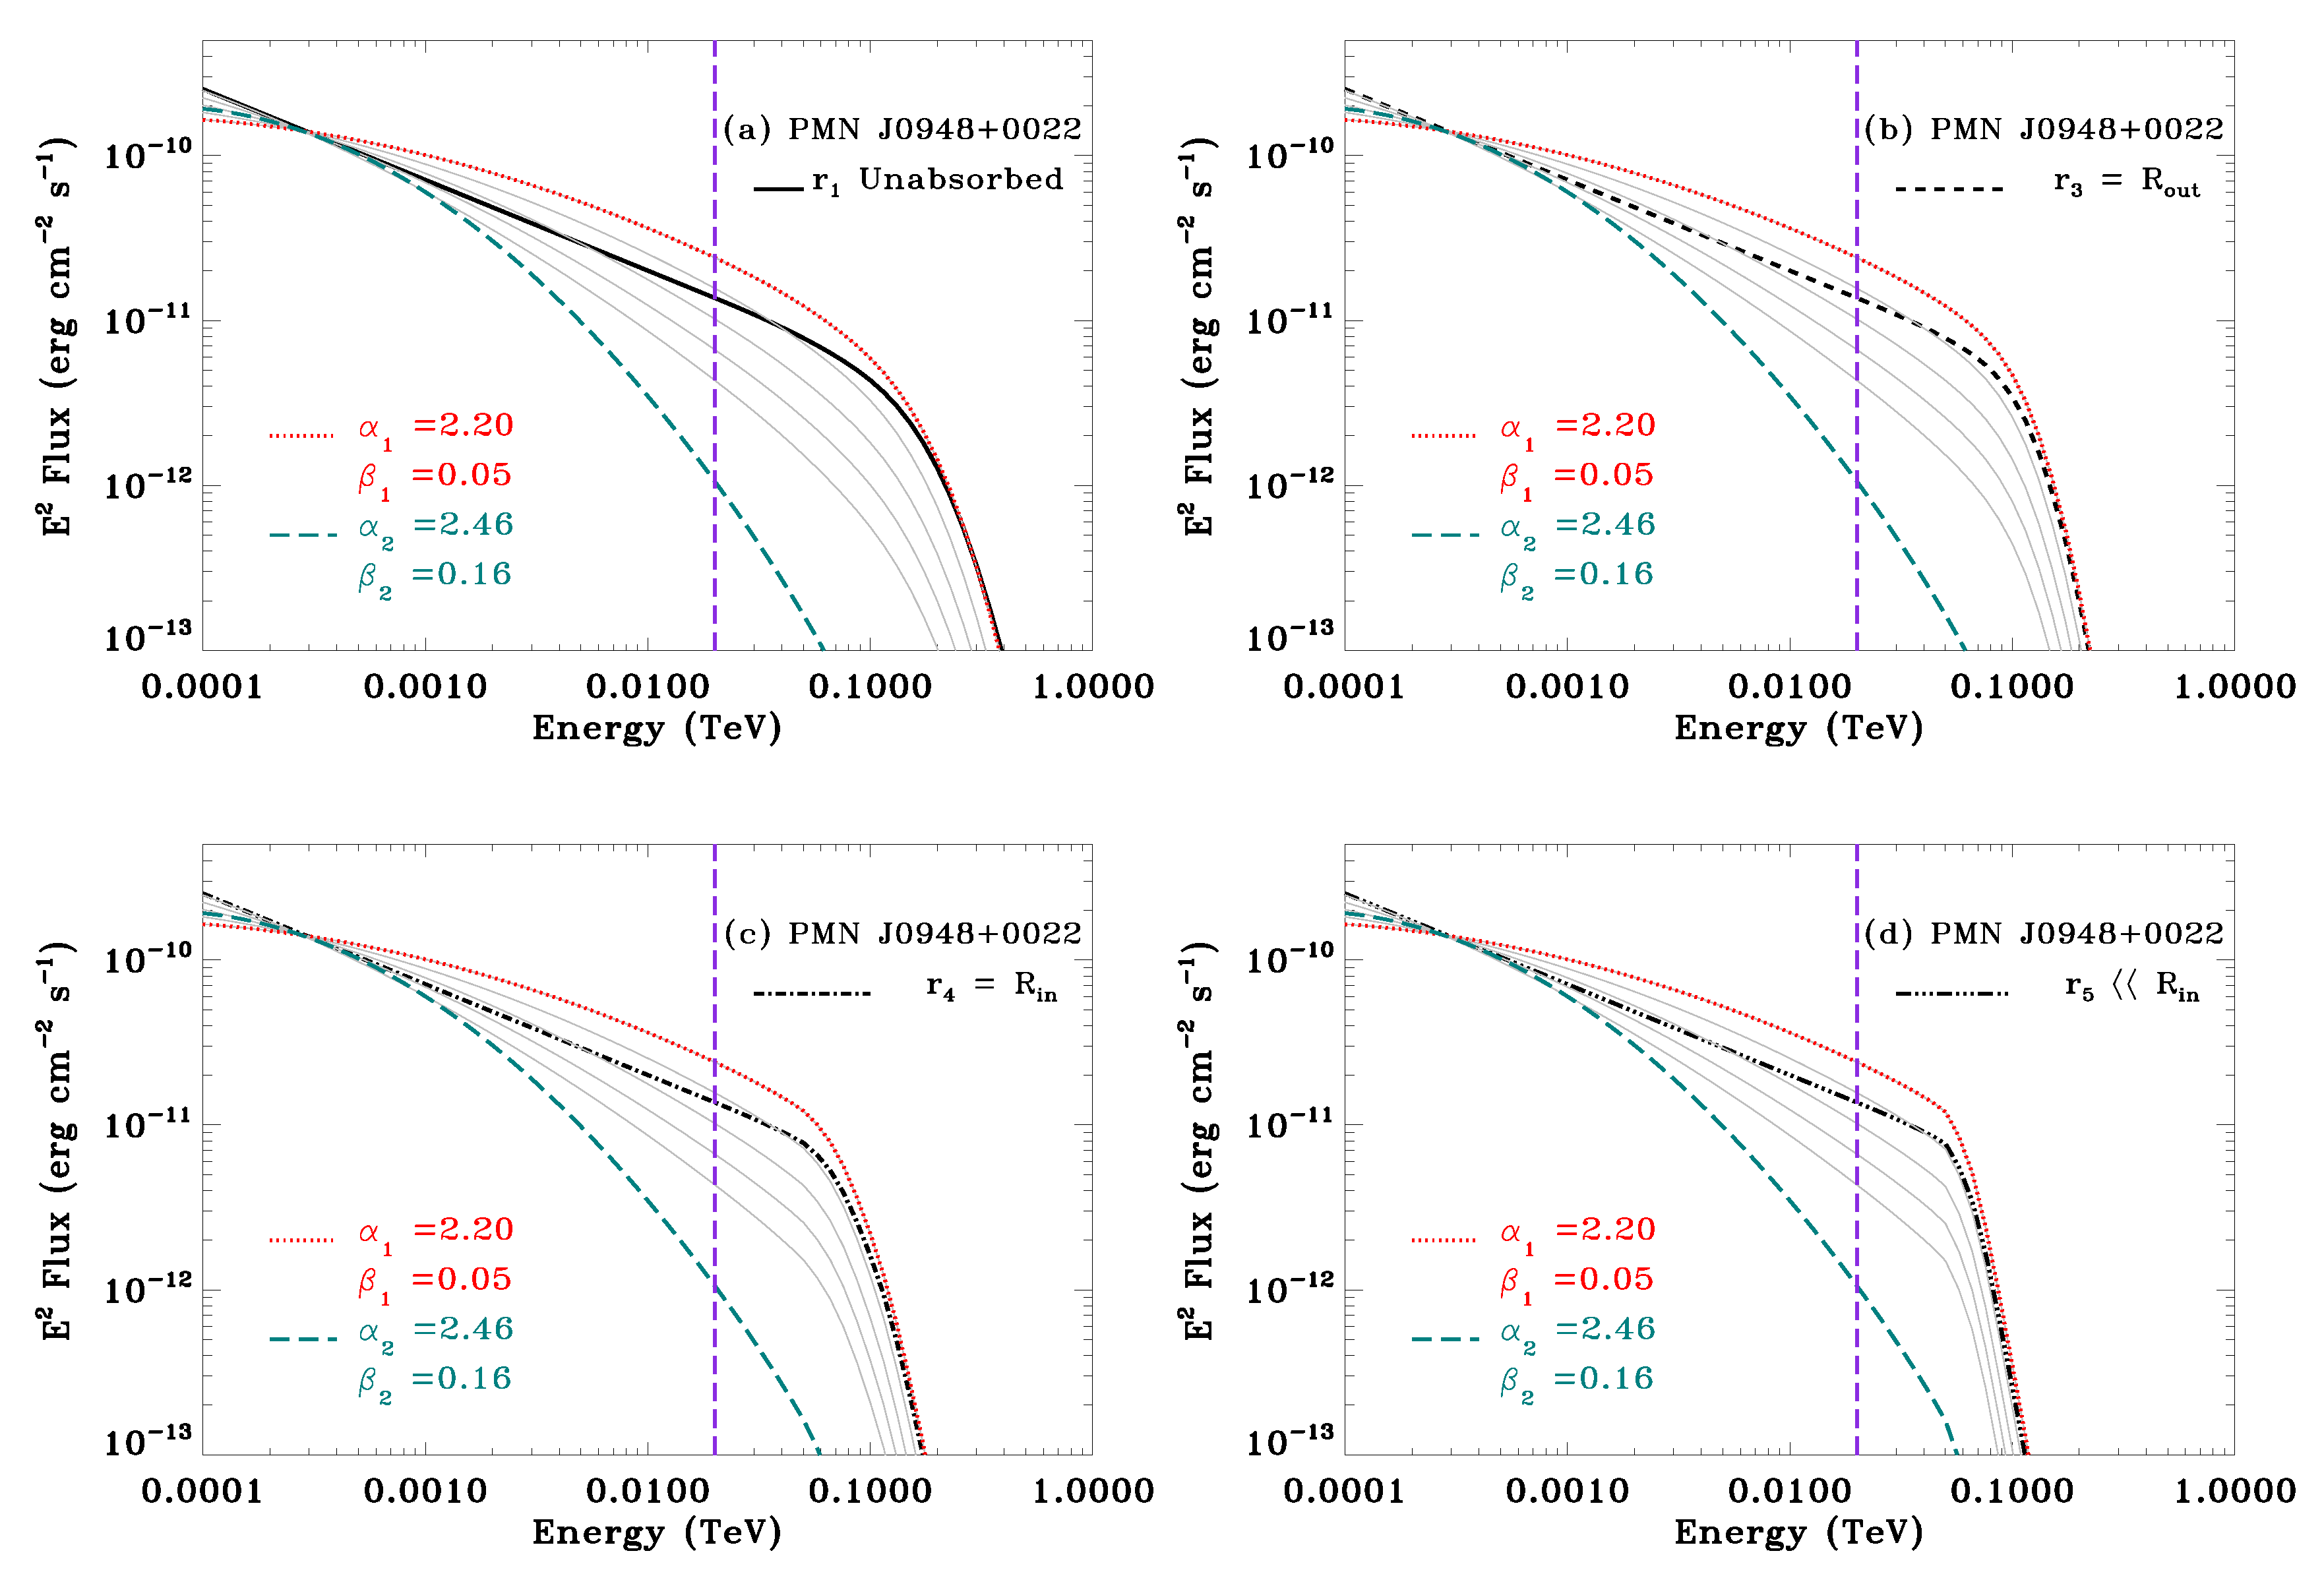
3.2. Application to the Three NLSy1s

As reported in Section 2, we chose SBS 0846+513, PMN J0948+0022, and PKS 1502+036 because, in principle, during flaring events they could be detected by the next generation Cherenkov Telescope Array [7], as discussed in [9], where the authors considered a detailed treatment of γ γ absorption in the radiation fields of the BLR as a function of the location of the γ -ray emission region with parameters inferred from observational constraints [25]. In their Figure 7, the authors compared the log-parabola models for the three sources (whose spectral parameters where derived from the 4FGL), renormalised to the integrated 100 MeV to 100 GeV flux as extrapolated by adopting the power-law models detailed in their Table 1, with respect to the expected spectra due to the BLR internal γ γ absorption. The comparison shows that the log-parabola models are distinct from the BLR internal γ γ absorption. However, it is necessary to take into account that there can be spectral changes during outbursts and some quasars have shown radical spectral changes, suggesting a change of the location of the γ -ray emission (e.g., [6,26]). Therefore, it is worth exploring if there is any realistic combination of ( α , β ) and fluxes for which CTA cannot break the degeneracy with the power-law model.
We simulated a grid of 9 × 9 values for α and β , ( α [ 1.5 , 2.9 ] ; β [ 0.05 , 0.2 ] ). We considered both the BLR contribution to absorption and the attenuation due to the extra-galactic background light (EBL, calculated by adopting the model of [27]).
Figure 3, Figure 4 and Figure 5 show the spectral energy distributions (SEDs) for SBS 0846+513, PMN 0948+0022, and PKS 1502+036, respectively, in the range 100 MeV – 1 TeV. All SEDs have been computed fixing the pivot energy, E 0 , to the one extracted from the 4FGL for each source and allowing the normalization factor, K 0 , to vary (we are analysing possible outbursts) in order to intercept the black line curves values at E 0 . We note that this is not a constraint on the flux computed on the full Fermi-LAT energy band (0.1–300) GeV, but just at the energy E 0 . The black lines were calculated in [9] starting from a simple power-law model and represent the SEDs obtained by means of a convolution of the internal BLR γ γ absorption with the EBL attenuation. The different lines refer to different radii at which the γ -ray emission location, R em , is placed with respect to the BLR boundaries, from least absorbed to most absorbed, following the enumeration adopted in [9]:
  • solid line R em = r 1 R BLR ,
  • dashed lines R em = r 3 = R out (outer BLR radius),
  • dot-dashed lines R em = r 4 = R in (inner BLR radius),
  • and dashed-triple-dotted lines R em = r 5 R BLR , respectively.
The red dotted lines represent the log-parabola models whose slopes are adjacent to the portion of the SED at VHE ( E > a few hundreds of GeV, black solid lines) which were obtained by means of a simple power-law model, as discussed in [9]. In Figure 5, panels (c) and (d), the value of β = 0.07 provides a better agreement with respect to the black lines at energies above a few hundred of GeV. The thin gray lines represent the various SEDs, obtained by means of a log-parabolic model, with E 0 and K 0 as described above, fixing β to the value obtained from the red dotted fit, and allowing α to vary with steps of 0.05. The green long-dashed lines represent the log-parabola models whose spectral parameters were derived from the 4FGL, except for the normalization factor which has been chosen as described above.
Figure 6 shows the scatter-plot of the two spectral parameters ( α and β ) for the different object categories (see Figure 1 for the description of the different symbols), where all the sources have been reported in gray except the three discussed in details in this work. The black filled squares represent the 4FGL log-parabola values as in Figure 1, while the black filled triangles represent the value of the photon index Γ for a power-law fit in 4FGL. The black open circles represent the value of the photon index Γ for the different sources in high γ -ray state as reported in [9]. We also added open squares which represent the intervals, in α and β , defined by the red and green dashed curves in Figure 3, Figure 4 and Figure 5. Panels (a), (b), and (c) represent SBS 0846+513, PMN 0948+0022, and PKS 1502+036, respectively.

4. Discussion

In this work we addressed the question on how simple power-law spectral models and log-parabolic ones could be disentangled in γ -ray narrow-line Seyfert 1 galaxies by means of current Fermi-LAT or future CTA data. In particular, we simulated different sets of log-parabolic spectra-whose boundaries where extracted from the 4FGL- extending from a few hundred of MeV up to TeV energy band. Figure 3, Figure 4 and Figure 5 show that there are sets of log-parabola models —i.e., different combinations of ( α , β )—which mimic the behaviour of a power-law at energies of E > 200–300 GeV. The simulations show that the only possibility for a log-parabolic model to mimic a power-law model in the CTA energy band is to have a very small value of the curvature parameter β 0.05 . To have an idea of the improvement with respect to Fermi-LAT alone, it is possible to compare this result with what has been found in [28] by using four-year data of PMN 0948+0022: in that case, the data did not allow the authors to disentangle between a fit of the overall spectrum with a power-law and a log-parabola models, with a curvature parameter β 0.3 . Since, as shown in Figure 1, most of the quasars have values of β 0.3 , this means that CTA will allow us to break the spectral degeneracy for a large number of sources. Quasars with β 0.05 , for which CTA will not be able to distinguish between different models, represent a small population in the 4FGL catalogue. If we impose α 2.5 and β 0.05 , the following flat-spectrum radio quasars satisfy this condition: 4FGL J0043.8+3425 ( α = 1.854 ± 0.039 , β = 0.050 ± 0.016 ), 4FGL J0112.8+3208 ( α = 2.304 ± 0.031 , β = 0.050 ± 0.015 ), 4FGL J2143.5+1743 ( α = 2.449 ± 0.016 , β = 0.046 ± 0.010 ), and 4FGL J1224.9+2122 ( α = 2.272 ± 0.009 , β = 0.045 ± 0.004 ). We also note that the SBS 0846+513 spectrum fit in the 4FGL yield β = 0.079 , very close to this limiting value.
We see that integrating in the full Fermi-LAT energy band ( 0.1 E GeV 300 ) the difference in flux between the simple power-law models described in [9] and the log-parabolic models described here are on the order of the 10–30 %. On the other hand, differences in fluxes could be conspicuous in more restricted energy bands, (140–200) GeV and (200–280) GeV, typical of VHE telescopes arrays. Table 2 shows the fluxes in two different energy bands, (140–200) GeV and (200–280) GeV. We compare the “red” and “green” models with respect to the un-absorbed, R em = r 1 , one. We clearly see that, while the “red” and r 1 models yield similar fluxes (within a factor of ∼2–4), they could be more than one order of magnitude higher with respect to the “green” one.

5. Conclusions

The forthcoming Cherenkov Telescope Array will play a relevant role in the possible detection of NLSy1s during flares. This will allow us to perform almost simultaneous multi-wavelength observations, covering a wide energy band from radio frequencies up to several hundreds of GeV, which will be extremely important to investigate the spectral properties of these sources. We have seen that Fermi-LAT data alone may not be conclusive in disentangling between a power-law and a log-parabolic model of the NLSy1s spectra. We can conclude that although the BLR absorption tends to strongly affect any spectra, a log-parabola with significant curvature can be distinguished from a power-law model in the CTA energy band.

Author Contributions

Conceptualization, L.F., S.V., P.R.; Writing—Original Draft Preparation, S.V.; Writing—Review and Editing, S.V., L.F., P.R., M.B., C.B. All authors have read and agreed to the published version of the manuscript.

Funding

S.V., L.F., and P.R. acknowledge financial contribution from the agreement ASI–INAF n. 2017-14-H.0. The work of M.B. is supported through the South African Research Chairs Initiative (SARChI) of the Department of Science and Innovation and the National Research Foundation1 of South Africa.

Acknowledgments

We thank the Referees for their prompt and constructive comments.

Conflicts of Interest

The authors declare no conflict of interest.

References

  1. Cerruti, M.; Dermer, C.D.; Lott, B.; Boisson, C.; Zech, A. Gamma-Ray Blazars near Equipartition and the Origin of the GeV Spectral Break in 3C 454.3. Astrophys. J. Lett. 2013, 771, L4. [Google Scholar] [CrossRef] [Green Version]
  2. Dermer, C.D.; Cerruti, M.; Lott, B.; Boisson, C.; Zech, A. Equipartition Gamma-Ray Blazars and the Location of the Gamma-Ray Emission Site in 3C 279. Astrophys. J. 2014, 782, 82. [Google Scholar] [CrossRef] [Green Version]
  3. Dermer, C.D.; Yan, D.; Zhang, L.; Finke, J.D.; Lott, B. Near-equipartition Jets with Log-parabola Electron Energy Distribution and the Blazar Spectral-index Diagrams. Astrophys. J. 2015, 809, 174. [Google Scholar] [CrossRef] [Green Version]
  4. Bevington, P.R.; Robinson, D.K. Data Reduction and Error Analysis for the Physical Sciences, 3rd ed.; McGraw-Hill: New York, NY, USA, 2003. [Google Scholar]
  5. Massaro, E.; Perri, M.; Giommi, P.; Nesci, R. Log-parabolic spectra and particle acceleration in the BL Lac object Mkn 421: Spectral analysis of the complete BeppoSAX wide band X-ray data set. Astron. Astrophys. 2004, 413, 489–503. [Google Scholar] [CrossRef]
  6. Foschini, L.; Ghisellini, G.; Tavecchio, F.; Bonnoli, G.; Stamerra, A. Short time scale variability at gamma rays in FSRQs and implications on the current models. arXiv 2011, arXiv:1110.4471. [Google Scholar]
  7. Hofmann, W. The Cherenkov Telescope Array: Exploring the Very-high-energy Sky from ESO’s Paranal Site. Messenger 2017, 168, 21–26. [Google Scholar] [CrossRef]
  8. Romano, P.; Vercellone, S.; Foschini, L.; Tavecchio, F.; Landoni, M.; Knödlseder, J. Prospects for gamma-ray observations of narrow-line Seyfert 1 galaxies with the Cherenkov Telescope Array. Mon. Not. R. Astron. Soc. 2018, 481, 5046–5061. [Google Scholar] [CrossRef] [Green Version]
  9. Romano, P.; Böttcher, M.; Foschini, L.; Boisson, C.; Vercellone, S.; Landoni, M. Prospects for gamma-ray observations of narrow-line Seyfert 1 galaxies with the Cherenkov Telescope Array II. Gamma-gamma absorption in the broad-line region radiation fields. arXiv 2020, arXiv:2002.11737. [Google Scholar]
  10. Osterbrock, D.E.; Pogge, R.W. The spectra of narrow-line Seyfert 1 galaxies. Astrophys. J. 1985, 297, 166–176. [Google Scholar] [CrossRef]
  11. Pogge, R.W. A quarter century of Narrow-Line Sefert 1s. In Narrow-Line Seyfert 1 Galaxies and Their Place in the Universe (Seyfert 2011); SISSA Medialab: Trieste, Italy, 2011; p. 2. [Google Scholar]
  12. Komossa, S.; Voges, W.; Xu, D.; Mathur, S.; Adorf, H.M.; Lemson, G.; Duschl, W.J.; Grupe, D. Radio-loud Narrow-Line Type 1 Quasars. Astrophys. J. 2006, 132, 531–545. [Google Scholar] [CrossRef] [Green Version]
  13. Abdo, A.A.; Ackermann, M.; Ajello, M.; Baldini, L.; Ballet, J.; Barbiellini, G.; Bastieri, D.; Bechtol, K.; Bellazzini, R.; Berenji, B.; et al. Radio-Loud Narrow-Line Seyfert 1 as a New Class of Gamma-Ray Active Galactic Nuclei. Astrophys. J. Lett. 2009, 707, L142–L147. [Google Scholar] [CrossRef] [Green Version]
  14. The Fermi-LAT Collaboration. Fermi Large Area Telescope Fourth Source Catalog. arXiv 2019, arXiv:1902.10045. [Google Scholar]
  15. Foschini, L.; Berton, M.; Caccianiga, A.; Ciroi, S.; Cracco, V.; Peterson, B.M.; Angelakis, E.; Braito, V.; Fuhrmann, L.; Gallo, L.; et al. Properties of flat-spectrum radio-loud narrow-line Seyfert 1 galaxies. Astron. Astrophys. 2015, 575, A13. [Google Scholar] [CrossRef]
  16. D’Ammando, F.; Orienti, M.; Finke, J.; Larsson, J.; Giroletti, M.; Raiteri, C. A Panchromatic View of Relativistic Jets in Narrow-Line Seyfert 1 Galaxies. Galaxies 2016, 4, 11. [Google Scholar] [CrossRef]
  17. D’Ammando, F. Relativistic Jets in Gamma-Ray-Emitting Narrow-Line Seyfert 1 Galaxies. Galaxies 2019, 7, 87. [Google Scholar] [CrossRef] [Green Version]
  18. Foschini, L. Evidence of powerful relativistic jets in narrow-line Seyfert 1 galaxies. arXiv 2011, arXiv:1105.0772. [Google Scholar]
  19. Donato, D.; Perkins, J.S. Fermi LAT detection of a GeV flare from the Radio-Loud Narrow-Line Sy1 SBS 0846+513. Astron. Telegr. 2011, 3452, 1. [Google Scholar]
  20. D’Ammando, F.; Orienti, M.; Finke, J.; Raiteri, C.M.; Angelakis, E.; Fuhrmann, L.; Giroletti, M.; Hovatta, T.; Max-Moerbeck, W.; Perkins, J.S.; et al. SBS 0846+513: A new γ-ray-emitting narrow-line Seyfert 1 galaxy. Mon. Not. R. Astron. Soc. 2012, 426, 317–329. [Google Scholar] [CrossRef]
  21. Abdo, A.A.; Ackermann, M.; Ajello, M.; Axelsson, M.; Baldini, L.; Ballet, J.; Barbiellini, G.; Bastieri, D.; Battelino, M.; Baughman, B.M.; et al. Fermi/Large Area Telescope Discovery of Gamma-Ray Emission from a Relativistic Jet in the Narrow-Line Quasar PMN J0948+0022. Astrophys. J. 2009, 699, 976–984. [Google Scholar] [CrossRef] [Green Version]
  22. Foschini, L.; Ghisellini, G.; Kovalev, Y.Y.; Lister, M.L.; D’Ammando, F.; Thompson, D.J.; Tramacere, A.; Angelakis, E.; Donato, D.; Falcone, A.; et al. The first gamma-ray outburst of a narrow-line Seyfert 1 galaxy: The case of PMN J0948+0022 in 2010 July. Mon. Not. R. Astron. Soc. 2011, 413, 1671–1677. [Google Scholar] [CrossRef] [Green Version]
  23. D’Ammando, F.; Orienti, M.; Finke, J.; Raiteri, C.M.; Hovatta, T.; Larsson, J.; Max-Moerbeck, W.; Perkins, J.; Readhead, A.C.S.; Richards, J.L.; et al. The most powerful flaring activity from the NLSy1 PMN J0948+0022. Mon. Not. R. Astron. Soc. 2015, 446, 2456–2467. [Google Scholar] [CrossRef]
  24. Foschini, L. Powerful relativistic jets in narrow-line Seyfert 1 glaxies (review). arXiv 2013, arXiv:1301.5785. [Google Scholar]
  25. Böttcher, M.; Els, P. Gamma-Gamma Absorption in the Broad Line Region Radiation Fields of Gamma-Ray Blazars. Astrophys. J. 2016, 821, 102. [Google Scholar] [CrossRef]
  26. Ghisellini, G.; Tavecchio, F.; Foschini, L.; Bonnoli, G.; Tagliaferri, G. The red blazar PMN J2345-1555 becomes blue. Mon. Not. R. Astron. Soc. 2013, 432, L66–L70. [Google Scholar] [CrossRef] [Green Version]
  27. Domínguez, A.; Primack, J.R.; Rosario, D.J.; Prada, F.; Gilmore, R.C.; Faber, S.M.; Koo, D.C.; Somerville, R.S.; Pérez-Torres, M.A.; Pérez-González, P.; et al. Extragalactic background light inferred from AEGIS galaxy-SED-type fractions. Mon. Not. R. Astron. Soc. 2011, 410, 2556–2578. [Google Scholar] [CrossRef] [Green Version]
  28. Foschini, L.; Angelakis, E.; Fuhrmann, L.; Ghisellini, G.; Hovatta, T.; Lahteenmaki, A.; Lister, M.L.; Braito, V.; Gallo, L.; Hamilton, T.S.; et al. Radio-to-γ-ray monitoring of the narrow-line Seyfert 1 galaxy PMN J0948 + 0022 from 2008 to 2011. Astron. Astrophys. 2012, 548, A106. [Google Scholar] [CrossRef] [Green Version]
1.
Any opinion, finding and conclusion or recommendation expressed in this material is that of the authors, and the NRF does not accept any liability in this regard.
Figure 1. Scatter-plot of the two spectral parameters ( α and β ) for the different object categories. Open gray circles represent flat-spectrum radio quasars, while filled red squares represent narrow-line Seyfert 1 galaxies, respectively. Data and errors from the 4FGL.
Universe 06 00054 g001
Figure 2. (a) Distributions of the α parameter for flat-spectrum radio quasars (blue lines) and narrow-line Seyfert 1 galaxies (orange lines). (b) Distributions of the β parameter for flat-spectrum radio quasars (blue lines) and narrow-line Seyfert 1 galaxies (orange lines).
Universe 06 00054 g002
Figure 3. Spectral energy distribution in the energy range 100 MeV–1 TeV for SBS 0846+513. (a) R em = r 1 R BLR ; (b) R em = r 3 = R out ; (c) R em = r 4 = R in ; (d) R em = r 5 R in . The vertical purple dashed line at E = 20 GeV represents the CTA energy lower bound.
Universe 06 00054 g003
Figure 4. Spectral energy distribution in the energy range 100 MeV–1 TeV for PMN 0948+0022. (a) R em = r 1 R BLR ; (b) R em = r 3 = R out ; (c) R em = r 4 = R in ; (d) R em = r 5 R in . The vertical purple dashed line at E = 20 GeV represents the CTA energy lower bound.
Universe 06 00054 g004
Figure 5. Spectral energy distribution in the energy range 100 MeV–1 TeV for PKS 1502+036. (a) R em = r 1 R BLR ; (b) R em = r 3 = R out ; (c) R em = r 4 = R in ; (d) R em = r 5 R in . The vertical purple dashed line at E = 20 GeV represents the CTA energy lower bound.
Universe 06 00054 g005
Figure 6. Scatter-plot of the two spectral parameters ( α and β ) for the different object categories (see Figure 1 for the description of the different symbols). The black filled squares represent the 4FGL values, while the black filled triangles represent the value of the photon index Γ for a power-law fit in 4FGL. The black open circles represent the value of the photon index Γ for the different sources in the high γ -ray state as reported in [9]. Blue rectangles represent the intervals, in α and β , defined by the red and green dashed curves in Figure 3. (a) SBS 0846+513. (b) PMN 0948+0022. (c) PKS 1502+036.
Universe 06 00054 g006
Table 1. γ -ray spectral parameters (log-parabola and power-law models) for the three considered sources according to the Fourth Fermi-LAT Catalog [14]. E 0 is the pivot energy [MeV]; α is the photon index of the log-parabola model; β is the curvature; K lp is the normalization of the log-parabola model [ 10 12 ph cm−2 s−1 MeV−1] at the pivot energy; Γ is the photon index of the power-law model; K pl is the normalization of the power-law model [ 10 12 ph cm−2 s−1 MeV−1] at the pivot energy.
Name E 0 α β K lp Γ K pl
SBS 0846+513624.72 2.17 ± 0.04 0.08 ± 0.02 8.2 ± 0.3 2.27 ± 0.02 7.7 ± 0.2
PMN J0948+0022276.11 2.46 ± 0.03 0.16 ± 0.02 163 ± 4 2.63 ± 0.02 144 ± 3
PKS 1502+036400.94 2.48 ± 0.06 0.10 ± 0.03 19 ± 1 2.59 ± 0.04 17.7 ± 0.8
Table 2. γ -ray spectral parameters and fluxes (log-parabola models) for the three considered sources. Model refers to the red or green models in Figure 3, Figure 4 and Figure 5. F ( 140 200 ) GeV mod and F ( 200 280 ) GeV mod are the fluxes in units of [ 10 13 erg cm−2 s−1], while F ( 140 200 ) GeV sim and F ( 200 280 ) GeV sim are those reported in Tables 4, 5, and 7 of [9], same units.
NameModel r n F ( 140 200 ) GeV mod F ( 200 280 ) GeV mod F ( 140 200 ) GeV sim F ( 200 280 ) GeV sim
SBS 0846+513Red-32.326.8--
- r 1 --32.314.9
Green-1.721.11--
PMN J0948+0022Red-18.312.8--
- r 1 --19.97.8
Green-0.040.02--
PKS 1502+036Red ( 1 ) -85.165.9--
Red ( 2 ) -41.329.3--
- r 1 --26.814.6
Green-0.510.26--
Notes: ( 1 ) : curve with α = 1.95 and β = 0.05 . ( 2 ) : curve with α = 1.95 and β = 0.07 .

