Mycotoxin Occurrence in Feeds and Raw Materials in China: A Five-Year Investigation
by

Wei Hao
1, 
Shu Guan
2,*,
Anping Li
1,
Jinyong Wang
1,
Gang An
1,
Ursula Hofstetter
3 and
Gerd Schatzmayr
3 1
Department of Animal Nutrition and Health, DSM (China) Co., Ltd., Shanghai 201203, China
2
Department of Animal Nutrition and Health, DSM Singapore Industrial Pte. Ltd., Singapore 117440, Singapore
3
Department of Animal Nutrition and Health, DSM Austria GmbH, 3131 Getzersdorf, Austria
*
Author to whom correspondence should be addressed.
Toxins 2023, 15(1), 63; https://doi.org/10.3390/toxins15010063
Submission received: 28 November 2022
/
Revised: 7 January 2023
/
Accepted: 9 January 2023
/
Published: 11 January 2023
(This article belongs to the Special Issue Looking Forward: Mycotoxins Occurrence and Detection in Food and Feed)
Abstract
:Mycotoxins are ubiquitously present in feeds and raw materials and can exert toxicity on animals and humans. Therefore, mycotoxin occurrence should be monitored. We report here a multi-mycotoxin survey of feed samples in China from 2017 to 2021. Concentrations of aflatoxins, trichothecenes type B, fumonisins, and zearalenone were determined in a total of 9392 samples collected throughout China. Regional differences and year-to-year variation of mycotoxin occurrence were also assessed in new-season corn. Generally, Fusarium mycotoxins were prevalent, while mycotoxin contamination in each feed commodity showed a distinct pattern, e.g., wheat and bran were typically affected by trichothecenes type B, peanut meals were highly susceptible to aflatoxins, and finished feeds exhibited a comparatively high prevalence of all mycotoxins. In new-season corn, trichothecenes type B and fumonisins were most prevalent, with positive rates of 84.04% and 87.16%, respectively. Regions exhibited different patterns of mycotoxin occurrence. The Anhui and Jiangsu provinces of East China exhibited a high prevalence and concentrations of aflatoxins with a positive rate and a positive average of 82.61% and 103.08 μg/kg, respectively. Central China obtained high fumonisins levels of 4707.84 μg/kg. Trichothecenes type B and zearalenone occurred more frequently in temperate regions of Northeast China, and their positive rates reached 94.99% and 55.67%, respectively. In these regions, mycotoxin concentrations in new-season corn exhibited pronounced year-to-year variations and this could be due to the unusual changes of rainfall or temperature during sensitive periods of corn growing. A large fraction of new-season corn samples contained multiple mycotoxins with two to three classes (75.42%), and the most frequently observed co-contaminants were the combination of trichothecenes type B and fumonisins (73.52%). Trichothecenes type B and zearalenone concentrations were highly positively correlated with a coefficient of 0.775. In conclusion, mycotoxins contamination and co-contamination of feeds are common. Mycotoxin contamination in new-season corn exhibited regional patterns and year-to-year variations, with climate and weather conditions as determinant factors.
Key Contribution: The current study is the first assessment of patterns of mycotoxin occurrence in China from 2017 to 2021, with the largest dataset included in this report. These findings have important implications for the future trends of mycotoxin contamination and the mycotoxin management in feed production and animal breeding in China.
1. Introduction
Recently, as the demand lifted the utilization of crop by-products as a new source of feed materials with the development of the livestock industry in China, the public concern for food and feed safety, especially for mycotoxin contamination, has increased and become an important issue to be addressed. Contamination levels of certain types of mycotoxins are generally considered as the hygienic indicators in the food and feed chains [1], and these mycotoxins are well known to exert toxicity on animals, compromising the safety and health of humans through the carryover effects from animal products to human consumers [2,3].
Mycotoxins are toxic fungal secondary metabolites, and statistically more than 300 are known nowadays [4]. The most important genera-secreting mycotoxins are Aspergillus, Fusarium, and Penicillium, and the most prevailing mycotoxins produced by the above-mentioned fungi genera are aflatoxins (e.g., aflatoxin B1; AFB1), fumonisins (FUMs), zearalenone (ZEN), trichothecenes type B (e.g., deoxynivalenol; DON), trichothecenes type A (e.g., T-2 toxin; T-2), and ochratoxin A (OTA). The fungal infestation and mycotoxin accumulation could occur widely and frequently in the crop field with climate conditions of rainfall and weather temperature as the most influential factors [3], and since the same fungal strain could produce different types of mycotoxins even under similar environmental conditions, mycotoxins frequently co-occur in feeds and materials.
For mycotoxin risk management, regulatory limits for mycotoxin values have been implemented in many regions throughout the world. In the European Union, maximum levels are enforced for AFB1 and guidance values are stipulated for FUMs, DON, ZEN, and OTA [5,6]. In China, the allowable maximums are regulated for the concentrations of AFB1, ZEN, DON, FUMs, T-2, and OTA in finished feeds and plant materials, and according to different livestock species, the levels for these regulated mycotoxins are also set with different limits (Table 1) [7].
With the legislation put in place, the mycotoxin contamination in feeds has been alleviated and most of the feed samples could meet the requirements of the maximum limits of mycotoxin in the relevant regulations in China, even though continuous low or medium concentration exposure to animals could lead to chronic toxicity. Furthermore, since mycotoxins co-occur in most cases, the effect of the co-contaminants could be “additive” or “synergistic” when compared to the effects of individual mycotoxins, and these interactions may be produced even though the single mycotoxins are at relatively low levels [8,9], while available data are still scarce and insufficient.
The analysis of mycotoxin occurrence is of particular interest and draws increasing attention. Considering that the environmental conditions of temperature and precipitation are key determinants of mycotoxin contamination [10], such survey would exhibit specific pollution patterns in different geographic regions [11], as well as support the mycotoxin risk warning management due to the changing climatic conditions or specific meteorological events. Most importantly, through the monitoring and supervision of mycotoxin contamination in feeds, these surveys would help with the reduction in intake of different types of mycotoxins and the alleviation of acute or chronic symptoms of toxicity in animals, ensuring body health and minimizing the economic damage in the livestock industry.
Previous surveys have mostly reported the regulated mycotoxins and their co-occurrence either on a global scale [11,12,13] or with covers of smaller geographic regions, such as African, European, and Asian countries [14]. In China, the surveys focusing on the patterns of mycotoxin contamination in different commodities and in different regions have been published [15], and with the increased awareness, the demand to investigate the pollution characteristics during relatively long years has become more urgent. Thus, in this report, we analyzed the occurrence and co-occurrence of aflatoxins, ZEN, trichothecenes type B, and FUMs in 9392 samples of finished feed and feed raw materials such as corn, wheat, soybean, and corn by-products collected throughout China from 2017 to 2021. The mycotoxin occurrence in new-season corn of five geographic regions was compared and the year-to-year variation of mycotoxin concentrations was also analyzed. The relevant statistics and reports are still scarce in China, and so far, this is the first and the most comprehensive investigation of regional and year-to-year trends of mycotoxin occurrence in China, with the largest dataset included in this report.
2. Results
2.1. General Mycotoxin Occurrence
The numbers of tested samples, the respective positive rates, as well as the average positives and maximums of different types of mycotoxins are presented in Table 2. A total of 9329 samples were collected throughout China and analyzed for the occurrence of aflatoxins, trichothecenes type B, FUMs, and ZEN. Generally, the Fusarium mycotoxins of trichothecenes type B, FUMs, and ZEN were prevalent and were detected in 87.07%, 77.14%, and 56.29%, respectively, of the total samples, with positive averages of 838.89 μg/kg, 1842.57 μg/kg, and 183.81 μg/kg, respectively. In the year 2017, aflatoxins contamination occurred in 12.71% of the investigated samples with a positive average of as high as 87.15 μg/kg. The positive rates of trichothecenes type B and FUMs in that year also exhibited high values of 98.74% and 71.07%, respectively. In the year 2018, aflatoxins remained at a relatively high pollution level with a positive rate of 25.25% and an average of positives of 81.13 μg/kg. FUMs also exhibited a high prevalence of 80.60%, and its level of positive averages reached 2464.74 μg/kg. Aflatoxins contamination was significantly alleviated from 2019 to 2021 (p < 0.01). The positive rates remained below 20%, and the averages of positives were at levels of approximately or below 30 μg/kg in this study. In the year 2019, ZEN exhibited a low positive average of 74.20 μg/kg. In the year 2020, trichothecenes type B, FUMs, and ZEN were detected in 72.44%, 62.91%, and 46.82% of the samples, respectively, and the positive rates were comparably lower than those in other years. In the year 2021, a higher prevalence of 79.09% and a higher positive average of 1135.07 μg/kg were determined in ZEN and trichothecenes type B (p < 0.01), respectively.
2.2. Mycotoxin Occurrence in Different Feed Commodities
Mycotoxin occurrence was compared in different feed commodities in this survey and the results are presented in Table 3. Mycotoxin occurrence differed according to different feed commodities.
In corn, FUMs and ZEN exhibited a higher prevalence of 81.55% and 51.51% and higher positive averages of 2618.81 μg/kg and 176.79 μg/kg, respectively. Corn also obtained a relatively high prevalence of trichothecenes type B (87.47%), and the positive rate of aflatoxins was below 20%. With a similar mycotoxin occurrence than for the corn samples, corn by-products, which are dried distillers’ grains and soluble fraction (DDGS) and corn gluten meal in this study, were concentrated in ZEN and FUMs contamination. DDGS exhibited a high prevalence of Fusarium mycotoxins with the positive rates of 98.48%, 86.80%, and 87.82%, respectively, in trichothecenes type B, FUMs, and ZEN, and the average of positives reached a value as high as 2327.08 μg/kg in trichothecenes type B. Contaminations of FUMs and ZEN were even aggravated in samples of corn gluten meal with positive averages of 8363.50 μg/kg and 2004.30 μg/kg, respectively. The average of positives of trichothecenes type B was slightly lower in samples of corn gluten meal than in corn samples.
In wheat, bran, and rice bran meal, trichothecenes type B was the most frequently detected mycotoxin, especially in wheat samples, wherein the positive average reached 2129.29 μg/kg in this survey. In soybean meal, ZEN was prevalent and detected with a positive rate of approximately 40%. Cottonseed meal was mainly polluted by the infestation of aflatoxins and FUMs. In the case of peanut meal samples, the contamination of aflatoxins was determined at a high risk level, with a positive rate of 100.00% and a positive average of up to 417.72 μg/kg.
Fusarium mycotoxins dominated in silage, while the average concentrations of positives in FUMs were markedly lower than those in corn. Aflatoxins were rarely detected in alfalfa and oat. The most prevalent mycotoxin was trichothecenes type B with positive rates of above 50% in both grasses, and the positive average of trichothecenes type B should be paid more attention to in oat, where its value reached 1728.82 μg/kg.
Swine and poultry finished feeds were among the commodities exhibiting relatively high percentages of positive samples for every mycotoxin analyzed in this survey. The concentrations of trichothecenes type B reached positive averages of above 500 μg/kg in both finished feeds, and FUMs were detected at positive averages of 120.13 μg/kg and 83.39 μg/kg in poultry and swine feeds, respectively. In ruminant feeds of concentrate supplement and TMR, aflatoxins showed lower prevalence and positive averages than in other commodities, and 53.14% and 71.91% of samples of concentrate supplement and TMR were contaminated with ZEN, respectively.
2.3. Mycotoxin Occurrence in New-Season Corn
Mycotoxin occurrence in new-season corn from 2017 to 2021 were summarized in Table 4. Trichothecenes type B and FUMs were most prevalent, with positive rates of 84.04% and 87.16%, respectively, followed by ZEN, (50.13% positive rate), and aflatoxins positive samples were less common, with a percentage of 31.40% in this survey. The level of aflatoxin contamination exhibited a positive average of 63.83 μg/kg and the maximum value reached 733 μg/kg, which was sourced in a sample collected in the year 2018.
In the year 2017, the average of positives for aflatoxins was higher than in the following years with the value of 147.74 μg/kg (p < 0.01), and in the year 2019, the positive samples exhibited much lower contamination levels of aflatoxins, FUMs, and ZEN with positive averages of 10.46 μg/kg, 1944.99 μg/kg, and 62.88 μg/kg, respectively. In the year 2021, the contamination of trichothecenes type B and ZEN exhibited highest positive averages of 1285.93 μg/kg and 300.73 μg/kg, respectively, when compared to previous years (p < 0.01). These values were high enough to draw the public attention.
2.4. Regional Variation of Mycotoxin Occurrence in New-Season Corn
The regional variation of mycotoxin contamination in new-season corn was presented in Table 5 and the year-to-year variations of mycotoxin concentrations in different regions were shown in Figure 1. For Northeast China of Gansu province, the year-to-year variation of mycotoxins concentrations was not evaluated as the low sample number did not allow for this analysis. The results for each region of Northeast China (Heilongjiang, Jilin, and Liaoning provinces), North China (Hebei and Inner Mongolia provinces), East China (Shandong province), East China (Anhui and Jiangsu provinces), and Central China (Henan China) are described in detail as follows:
2.4.1. Northeast China
In samples from Northeast China, trichothecenes type B and ZEN were at the top prevalence ratio with 94.99% and 55.67%, respectively, in comparison with samples from other regions. The contamination levels of trichothecenes type B increased from 2019 and peaked in 2021 with a positive average of 1317.88 μg/kg. The prevalence of ZEN gradually increased from 2017 to 2021 in this region. In addition to trichothecenes type B and ZEN, FUMs were also prevalent in this sub dataset with 79.42% of positive samples, but the prevalence and contamination level of the positive average were lower than any other regions of China (p < 0.01). Aflatoxins were detected in the lowest fraction of samples (3.69%), and at the lowest positive average of 9.36 μg/kg (p < 0.01). The positive ratios and contamination levels of FUMs both peaked in samples from 2018.
2.4.2. North China
In North China, FUM was most frequently detected with an 89.95% positive rate, and its contamination peaked with a 100.00% positive rate and a high average concentration of 7016.97 μg/kg in the year 2018. The prevalence of trichothecenes type B was also at a relatively high level (80.90%), and 49.75% of the samples were detected as positive in terms of ZEN contamination in this region. Aflatoxins were detected in a positive fraction of 30.15% and at a relatively low average concentration of 15.36 μg/kg (p < 0.01).
2.4.3. East China (Shandong)
In Shandong province of East China, FUM was most dominating (90.05%. positive rate) reaching the highest level of positive average of 4699.88 μg/kg (p < 0.01). Trichothecenes type B and ZEN also exhibited a high prevalence of 76.96% and 59.16%, respectively, with averages of positives of 1207.20 µg/kg and 483.87 µg/kg, respectively, which were both the highest concentration obtained for any region investigated in this survey (p < 0.01, p < 0.01). Furthermore, the prevalence and levels of both trichothecenes type B and ZEN significantly increased from 2019 to 2021. Their positive averages were particularly high, and the concentrations of 1954.00 μg/kg and 722.00 μg/kg were detected, respectively, in trichothecenes type B and ZEN in the year 2021. Aflatoxins were detected in a low fraction of the samples (8.38%) and with a low positive average level (35.51 μg/kg) (p < 0.01), and the contamination level was higher in 2018 than in other years.
2.4.4. East China (Anhui and Jiangsu)
Aflatoxins were detected in 82.61% of samples from the Anhui and Jiangsu provinces, which was the highest percentage in all the invested regions, reaching a particularly higher average concentration of 103.08 µg/kg when compared to other regions (p < 0.01). Accordingly, high fractions and high levels were detected throughout the 5-year period, except in the year 2019, when aflatoxins were detected at a relatively low level with a positive average of 19.00 μg/kg, and even the prevalence remained at a high fraction of positive samples. FUM was most prevalent (92.03% positive rate) at a highest level of positive average of 4606.60 μg/kg (p < 0.01). The contamination of trichothecenes type B (p < 0.01) and ZEN (p < 0.01) was detected at the lowest levels relative to other regions in this survey.
2.4.5. Central China
FUM was the most frequently detected mycotoxin with 91.87% of positive samples, reaching the highest level with a positive average of 4707.84 μg/kg (p < 0.01). FUM concentrations were particularly high in the year 2018 and then tended to decrease between 2019 and 2021. Aflatoxins were detected in 64.23% of samples, with average concentrations of 61.62 μg/kg. Trichothecenes type B and ZEN were detected with positive rates of 82.52% and 43.09%, respectively.
2.5. Co-Occurrence of Mycotoxins in New-Season Corn
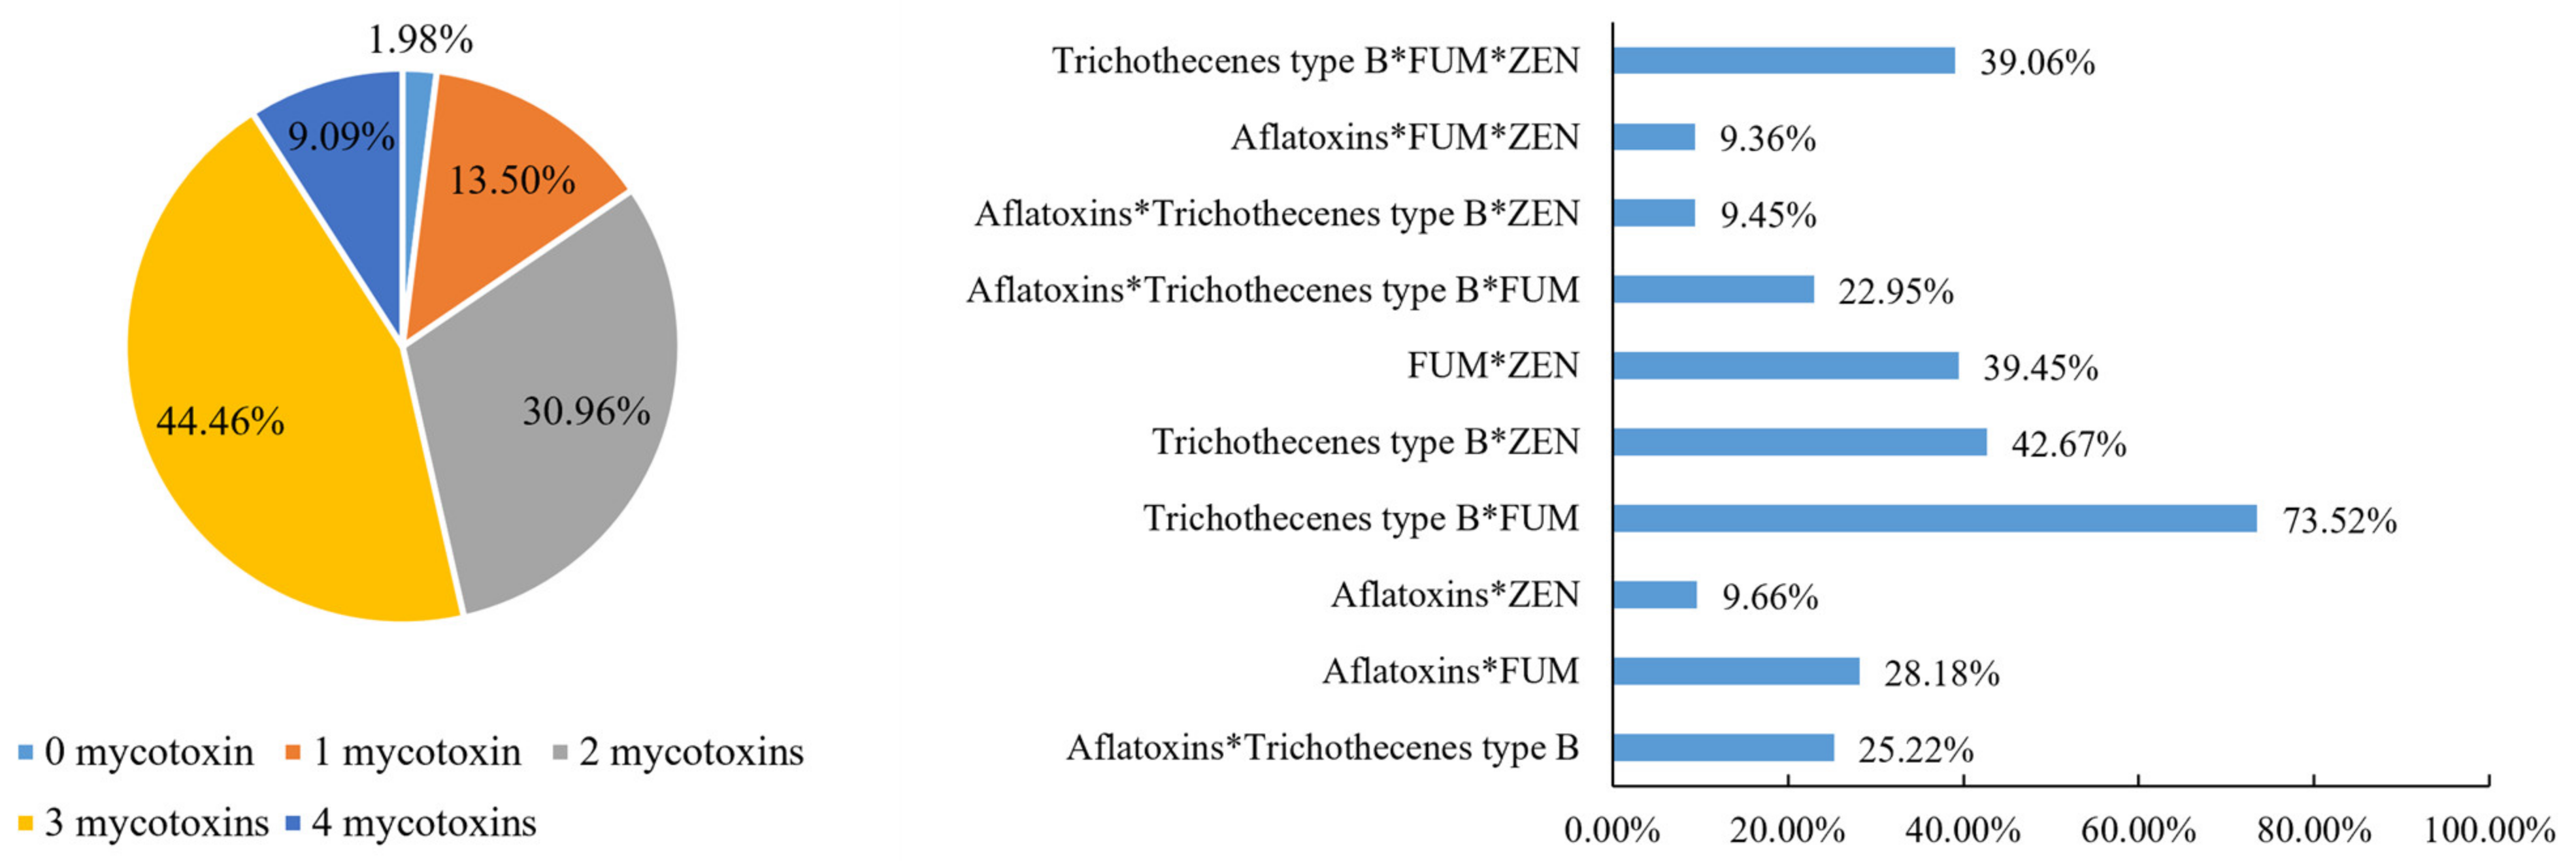
In order to analyze the co-occurrence of mycotoxins in new-season corn, the proportions of samples contaminated with either combination of mycotoxins were calculated in this study (Figure 2). Of all the samples, 75.42% contained two to three classes of mycotoxins, and 9.09% of the samples were contaminated with all four mycotoxins. The co-occurrence of trichothecenes type B and FUMs was most frequently observed, with the ratio of 73.52%. Trichothecenes type B and ZEN as well as ZEN and FUMs co-occurred in 42.67% and 39.45% of samples, respectively. The combination of three mycotoxins of ZEN, trichothecenes type B, and FUMs was detected in 39.06% of the samples.
In Figure 3, the combination of any two mycotoxins in new-season corn in the 5-year period were presented. The concentrations of trichothecenes type B and ZEN exhibited a positive correlation and their coefficient reached 0.775 (p < 0.0001). The concentrations of aflatoxins and FUMs also exhibited a positive correlation with a coefficient of 0.199 (p < 0.0001). Other mycotoxin combinations exhibited negative correlation coefficients in this survey.
3. Discussion
Mycotoxin contamination in feeds and raw materials was very common. In general, aflatoxins showed a low prevalence, while the Fusarium mycotoxins of FUMs and trichothecenes type B were more frequently detected, followed by ZEN. Even though there are only limited survey data available, these results can be supported by previously published studies. In one study conducted in China, mainly in the first half of 2009, the frequency of samples positive for ZEN, DON, and FUMs reached as high as 97.60%, 95.20%, and 82.70%, respectively [1]. In another 10-year mycotoxin survey on a global basis, FUMs, DON, and ZEN were investigated with 60.7%, 84.8%, and 58.2% of samples in the East Asian sub-dataset, and DON was even more prevalent than in samples from other regions worldwide [11]. With the high average contamination levels detected in Fusarium mycotoxins in this survey, we should see that the high-risk of trichothecenes type B, ZEN, and FUMs in feeds is a recurring issue in China and should draw serious attention. According to Gruber-Dorninger et al. [11], AFB1 was detected in 17.1% of samples from East Asia at a positive average concentration of 10 μg/kg, and the occurrence pattern of aflatoxins was similar in this survey, while the contamination level was much higher. From 2017 to 2021, with the increasing awareness of the aflatoxins’ toxicity, the aflatoxins risk has been alleviated gradually. The improved agriculture practices and grain storage conditions, as well as the rational application of aflatoxins detoxifier may have contributed to this significant shift in mycotoxin risk.
3.1. Occurrence of Mycotoxins in Different Feeds and Raw Materials
Aflatoxins are mainly produced by Aspergillus flavus or parasitic Aspergillus, and these species easily infect crops with high oil content [16], such as corn, peanut, and cottonseed [17]. The positive rate of aflatoxins in corn was found to be 16.50% with a relatively high positive average concentration of 63.28 μg/kg in this survey, while in other studies, the occurrence pattern may be varied due to the different sampling distribution or determination approaches. In a survey conducted from 2016 to 2017, the positive detection rate for AFB1 in corn collected from 21 provinces were 96.1% and the averages of positives were 5.8 μg/kg, and 4.1 μg/kg, in 2016 and 2017, respectively [18]. Meanwhile, in another study with 44 corn grains collected from three major corn-producing provinces in North China (Shandong, Hebei, and Henan) in 2014, aflatoxins exhibited 2.27% of positive samples and as high as 148.4 μg/kg of positive average concentration, indicating that aflatoxins are posing significant risks to corn in China, in terms of both prevalence and exposure level. Peanuts are also susceptible to aflatoxin contamination. A two-year survey conducted in the main peanut-producing regions of China has reported 95% of positive samples but mainly at low levels [19]. Peanut meal is the product resulting from the extraction of peanut oil, and aflatoxins may be highly enriched during this process. In the latest surveys of the years 2021 and 2020 scaled in China, aflatoxins were detected positively in all peanut meal samples with average concentrations of more than 100 μg/kg, which reached the highest values among all the investigated feed commodities in both years. In DDGS and corn gluten meal, as the corn by-products, the contamination of aflatoxins was also highly prevalent, which should be paid special attention to.
FUM is a type of mycotoxins produced primarily by the fungi Fusarium verticillioides and F. proliferatum, and these species mainly contaminate corn in the field, but can also infest wheat, barley, and oats [20]. The positive percentage and average concentration of the analyzed Fusarium mycotoxin FUM in the present study were rather high. In corn, the prevalence and average concentration of positives were 81.55% and 2618.81 μg/kg, respectively, which was similar to the results obtained in previous Chinese reports. In 2014, FB1 was detected as 100% positive with an average concentration of 116.5 μg/kg in the corn grains collected from the North China Plain [21]. In 2011, the FUMs’ positive rates in corn from Gansu, Shandong, Ningxia, and Inner Mongolia were 31.5%, 81.1%, 46.2%, and 53.6%, respectively, with concentrations ranging from ≤11 to 13,110 μg/kg [22], and in 2010, in the FUMs survey in corn from the main corn-producing provinces in China, FUM contamination exhibited the average concentrations of 3990, 845, and 665 μg/kg, respectively, in Liaoning, Shandong, and Henan [23].
Trichothecenes type B are represented by DON, which is produced by F. graminearum, Gibberella zeae, and F. culmorum, is the most common mycotoxin in cereals in China. These species can easily infest assorted cereal species, including corn, wheat, barley, and rice. Trichothecenes type B in this survey was highly detected in 70.56% of wheat and 95.31% of bran samples, with average concentrations of positives reaching 2129.29 μg/kg and 1469.40 μg/kg, respectively. With the representative studies on the mycotoxin contamination in wheat in China, DON was well proved to be most widespread, and even its contamination level varied with the average concentrations ranging from 240 μg/kg to 17,754 μg/kg depending on the different geographic regions of China [24,25]. DDGS exhibited the highest average levels of trichothecenes type B of all commodities, and this can be expected since the mycotoxins presented in the starting material can be extracted in DDGS. DON concentration by dry weight has been reported to be three times higher in DDGS than in the staring grains [26].
ZEN is mainly generated by F. graminearum, F. culmorum, F. semitectum, F. equiseti, and F. cerealis. ZEN is widely spread and easily contaminates barley, wheat, and soybeans, and especially corn, which is considered to be most susceptible to ZEN contamination. From 2017 to 2021, ZEN contamination was relatively severe in corn with a contamination level of 176.79 μg/kg, which was the highest value among all the investigated commodities. This result was supported by several published studies. From 2016 to 2017, the positive detection rate for ZEN in corn was 92.05% scaled in 21 provinces in China, and the positive average was 104.1 μg/kg in the year 2016 [18]. In another study that investigated the contamination of ZEN and its derivatives in corn, the positive rate for ZEN was 94% and the average concentration was 109.1 μg/kg [27]. Furthermore, the ZEN contamination level in grasses was relatively high, and even the prevalence was much lower than for other materials in this survey.
For all investigated mycotoxins, finished feeds exhibited high positive rates, especially for the Fusarium mycotoxins. Since the finished feeds are blends of different raw materials, it can be assumed that the finished feeds contain blends of mycotoxins which already exist in these starting materials. In addition, some mycotoxins can be produced during processing or storage. Thus, more studies are necessary to focus on the comprehensive survey on the patterns of mycotoxin contamination on different types of finished feeds and further assessment of feed safety and mycotoxin risk levels. In 2016, the positive rates for ZEN, AFB1, and DON were as high as 99.5%, 100%, and 100%, respectively [19], and it has also been reported that the detection rate of AFB1 in 200 dairy cow concentrates collected from 10 provinces in China reached 42% [28]. Compared with the previously obtained results, which showed a more severe mycotoxin exposure, the toxin prevalence was significantly reduced in the last 5 years, especially for aflatoxins. The knowledge and awareness about mycotoxin contamination is growing in China.
3.2. Regional Patterns of Mycotoxin Occurrence in New-Season Corn
Corn is one of the most important grains applied as a main feed raw materials in China. As presented in this survey, the prevalence and contamination levels of mycotoxins varied between years, and more significantly, regions also exhibited different patterns of mycotoxin occurrence. The large differences in mycotoxin occurrence could be due to the great diversity in climate conditions [29,30,31,32], together with multiple cultural practices across China, and as a large corn-producing country with complicated changing climatic conditions, different corn-producing arears could be favored by different toxic fugal growth and present different mycotoxin occurrence trends.
The regions of the Anhui, Jiangsu, and Henan provinces exhibited high prevalence and concentrations of aflatoxins, and the high frequency remained relatively stable from 2017 to 2021, which led to high exposure levels and a huge burden for animal production. It has been reported that crops are particularly susceptible to aflatoxin contamination during periods of drought, and the contamination can occur before harvest and continue to increase post-harvest under hot and humid conditions [32]. The variation of aflatoxin contamination among different regions reflects these associations well. The contamination level of aflatoxins was higher in the Anhui and Jiangsu provinces than in other investigated regions, and this could be largely due to the higher temperature and greater humidity in these semi-tropical southerner regions of China. In the global mycotoxin survey of a 10-year period, aflatoxins were detected prevalently at high concentrations in southern regions worldwide of Sub-Saharan Africa, Southeast Asia, and South Asia [11], which partly supported this result. Due to the climate changes, the contamination levels of aflatoxins presented regular variation trends from year to year. Generally, the concentrations spiked in the year 2018 in most of the investigated regions, and this could be associated with the more frequent typhoons during this period, coinciding with high rainfall in July and August leading to corn harvest in 2018. In the Henan province of Central China, the aflatoxin contamination level in 2017 was high, and this could be due to the relatively high temperature and high precipitation observed in August and September in 2017 which happened to be the harvest and storage periods of corn in that region.
The comparison of FUM occurrence showed that Shandong, Anhui, and Henan provinces obtained the highest contamination levels. Since FUM contamination can be favored by high temperatures and low precipitation around silking period [33], the year-by-year variation of FUM concentrations can be expected with the regular changes of weather conditions. Interestingly, the year-by-year variation trends of FUM concentrations exhibited the similar trends of aflatoxins in this survey, which suggested the similar key impacts of high temperature and drought during corn-producing periods on the levels of both aflatoxin and FUM contamination. Particularly in Hebei province of North China, a peak in average concentrations of FUM observed in 2018 could be associated with a higher temperature observed in summer, and at the same time Hebei happened to suffer from less precipitation, which may facilitate FUM production.
The occurrence of trichothecenes type B is high when corn flowers and matures with mild temperature and persistent rainfall, with high relative humidity being most important [32,34]. Accordingly, higher concentrations of trichothecenes type B were detected in samples from the temperate regions globally of North America, Northern Europe, Central Europe, and East Asia [11]. When the survey scope narrowed down to the main corn-producing areas in China, the northerner regions also presented a higher occurrence [1,15]. Trichothecenes type B concentrations in new-season corn varied from year to year in several regions. In Shandong province of East China, the concentration was exceptionally high in corn harvested in 2021. This peak value could correspond to the heavy rainfall caused by the typhoon attack in July 2021 during the main silking period of corn, followed by persistent relatively high precipitation in August, which is generally the main corn harvest and storage period. As recorded, the average precipitation in Shandong province was 778.9 mm from June to October in 2021, 64.5% more than that in the same period, and same as in Hebei province. The average precipitation of Hebei province in July reached 295.6mm, more than twice the annual average, which strengthened the key impact of high precipitation on the fugal growth and trichothecenes type B production.
ZEN is also mainly produced by the same DON-generating species and widely spread in temperate regions. For ZEN, the favored conditions are humidity and mild temperatures [11]. Similar with the trichothecenes type B contamination, ZEN contamination was more severe in northerner regions than others, where Shandong province was found to have the highest prevalence and concentrations, with the highest level up to 722.00 µg/kg and a positive rate of 88.00% in the year 2021.
3.3. Co-Occurrence of Mycotoxins in New-Season Corn
Generally, feeds and materials can be contaminated by different varieties of mycotoxins. With the development of mycotoxin research, there is increasing awareness of the need to take the co-occurrence of multi-mycotoxins into consideration. The co-exposure of mycotoxins could lead to additive or synergistic health risks as previously reported [35,36,37].
The co-occurrence of Fusarium mycotoxins was very common. In this survey, the most frequently observed mycotoxin combinations were Fusarium mycotoxins, especially trichothecenes type B and ZEN. Previously published studies suggested the high degrees of co-occurrence, e.g., on a global basis, the co-contamination ratios of DON and ZEN were 48%, 39%, and 28%, respectively, in samples of finished feeds, corn, and maize collected from 2008 to 2017 [11], while in China, the co-contamination ratio was reported to be 94.0% in all feed samples in 2011 [1]. We also calculated the correlation of concentrations for the combination of any two mycotoxins in new-season corn. The concentrations of trichothecenes type B and ZEN exhibited a highly positive correlation in the last five years. Even in a mycotoxin survey conducted in Africa, the concentrations of DON and ZEN were also detected with positive correlation coefficients of 0.543 and 0.319, respectively, in two different regions of Africa [14]. Therefore, co-contamination to animals is the rule rather than the exception on a global basis, and it is important to take into account the combined toxic effects of mycotoxins [11].
In addition, with the advances in multi-mycotoxin detection methods, there are also masked mycotoxins (e.g., 3- and 15-acetylated DON and DON glucoside) and new emerging mycotoxins (e.g., enniatins and beauvericin) detected in feeds and materials [12]. It has been reported that DON is usually well correlated with DON-3-glucoside and so is ZEN with ZEN-14-sulfate. Therefore, more studies are need to focus on detecting the derivatives of DON and ZEN, and their co-contamination and correlations should be further investigated in future studies.
4. Conclusions
In conclusion, the mycotoxin survey of 9329 samples in China from 2017 to 2021 indicated that mycotoxins are ubiquitously present in feeds. Each feed exhibited a distinct pattern of mycotoxin occurrence. Corn was detected with high contamination levels of Fusarium mycotoxins, wheat and bran were typically affected by trichothecenes type B, peanut meals were highly susceptible to aflatoxins, and corn by-products were concentrated with trichothecenes type B and ZEN. What should be paid special attention to is the fact that, as blends of feed raw materials, finished feeds exhibited a comparatively high prevalence of all mycotoxins.
New-season corn was commonly infested by mycotoxins and presented varied patterns of mycotoxin occurrence in different corn-producing regions of China. Climatic conditions are regarded as one of the determinant factors and drive distinct patterns of mycotoxin occurrence in each region. As reported in this survey, in Shandong province of East China, large fractions of new-season corn were polluted with high concentrations of Fusarium mycotoxins, and in the Anhui and Henan provinces, there were high contamination risks detected in aflatoxins and FUMs. From year to year, the levels of mycotoxin contamination varied along with the changes of regular climate conditions. For example, in southern regions of China, unusual high temperatures and/or heavy rainfalls caused by typhoon attacks could cause aflatoxins levels far in excess of the concentrations typically observed, and if hot weather and drought occur in summer, there could be a relatively high level of FUM pollution in corn. In temperate regions, if persistent rainfall occurs during the corn flowering and ripening periods, more severe exposures of DON and ZEN should be expected in that year. Mathematical modelling has been established and showed the potential changes in aflatoxin occurrence in Europe [38], while in China the modelling approaches and data for mycotoxin prediction are limited. With this perspective, the priority is to obtain solid scientific evidence on correlations of climate change and mycotoxin occurrence to allow for a comprehensive and appropriate mycotoxin risk warning system.
The co-occurrence of multi-mycotoxins generally exists in feeds. The risk assessment of co-exposure of mycotoxins is a significant challenge for the future. Studies have revealed that mycotoxins, not only regulated mycotoxins, but masked and new emerging toxins in feeds, potentially aggravate or change the negative effects on animal health [12]. Therefore, advanced detection tools, standardized analytical methods, and scientific research on health risks of combined mycotoxins are urgently required. In addition, strengthened mycotoxin surveillance and effective measures of mycotoxin prevention and control are vital to ensure feed and food safety in China. The application of targeted detoxification products is considered to be one of the most efficient, safe, and environmentally friendly measures for mycotoxin reduction. Meanwhile, good agriculture practices in all sectors, a mycotoxin early warning system, and further, a comprehensive mycotoxin control system should act together to ensure effective mycotoxin management and reduced public health risks.
5. Materials and Methods
5.1. Collection of Samples
A total of 9392 samples of feeds and raw materials were collected from 2017 to 2021 in a 5-year period. The dataset comprised 1188, 2084, 1867, 1610, and 2643 samples in each year from 2017 to 2021, respectively, and included samples of finished feed, such as poultry and swine feeds, samples of feed raw material, such as corn and wheat, samples of corn by-product, such as DDGS, and samples of grasses, such as silage and alfalfa. Samples of new-season corn were included in the corn samples and the dataset comprised 1160 samples collected from 10 provinces of Heilongjiang, Jilin, Liaoning provinces in Northeast China; Inner Mongolia and Hebei provinces in North China; Shandong, Jiangsu, and Anhui provinces in East China; Henan in Central China; and Gansu province in Northwest China. Sample numbers per commodity and new-season corn samples per region are given in Table 6 and Table 7, respectively.
Complete notes with detailed information surrounding the circumstances of the samples, including temperature, moisture, and water content were submitted with the samples. Original samples of 1 kg were collected and kept at 4 °C before being transported to the analytical Romer Labs in Wuxi, China [1]. Sampling, milling, and homogenization of a 100 g representative sub-sample were performed as described previously [12].
5.2. Mycotoxin Analysis
Samples from year 2017 with relatively complex matrices (n = 1012), such as finished feeds, were analyzed by Romer Labs in Wuxi, China. High Performance Liquid Chromatography (HPLC) was applied for the determination of mycotoxin concentrations of aflatoxins, trichothecenes type B, FUMs, and ZEN. Sample preparation, chromatographic conditions and parameters, and system program were specified by Guan et al. [1]. Limits of detection (LODs) for each mycotoxin were 0.3 μg/kg for AFB1, 0.1 μg/kg for AFB2, 0.1 μg/kg for AFG1, 0.1 μg/kg for AFG2, 10 μg/kg for ZEN, 50 μg/kg for DON, 25 μg/kg for FB1, and 25 μg/kg for FB2.
From the year 2018 to the year 2021, a total of 5996 samples with relatively complex matrices were determined with liquid chromatography—tandem mass spectrometry (LC-MS/MS) for the analysis of mycotoxin concentrations. LC-MS/MS is a multi-mycotoxin analysis method and a total of 18 mycotoxins, including 4 kinds of aflatoxins (AFB1, AFB2, AFG1, and AFG2), ZEN, 5 kinds of trichothecenes type B (DON, 3-Acetyl-Deoxynivalenol, 15-Acetyl-Deoxynivalenol, Nivalenol, and Fusarenon X), 4 kinds of trichothecenes type A (T-2, HT-2 toxin, Diacetoxyscirpenol, and Neosolaniol), 3 kinds of fumonisins (FB1, FB2, and FB3), and OTA can be detected simultaneously [12]. Procedures of analysis and quality control were performed as described previously [15]. LODs of this method for each mycotoxin were 0.5 μg/kg for AFB1, 0.5 μg/kg for AFB2, 0.5 μg/kg for AFG1, 0.5 μg/kg for AFG2, 10 μg/kg for ZEN, 10 μg/kg for DON, 10 μg/kg for FB1, 10 μg/kg for FB2, and 10 μg/kg for FB3.
For the remaining 2384 samples of feed raw materials with relatively simple matrices, such as corn, wheat, and bran, the method of enzyme-linked immunosorbent assay (ELISA) was performed for the analysis of mycotoxin concentrations. Procedures of sample preparation and analysis were operated with a commercially available test kit (AgraQuant® Assay, Romer Labs Diagnostic GmbH, Tulln, Austria) according to its operating instructions. LODs of this method for each mycotoxin were 2 μg/kg for AFB1, 25 μg/kg for ZEN, 250 μg/kg for DON, and 250 μg/kg for FUMs.
For all analyzed samples, when the mycotoxin concentrations were detected with higher values than the following threshold, the samples can be defined as mycotoxin-positive. The concentration threshold for each mycotoxin was defined as 1 μg/kg for the sum of AFB1, AFB2, AFG1, and AFG2, 32 μg/kg for ZEN; 50 μg/kg for trichothecenes type B; and 100 μg/kg for the sum of FB1, FB2, and FB3.
5.3. Statistical Analysis
Statistical analyses were performed using JMP 10.0 Statistics software (SAS Institute, Cary, NC, USA). Raw data were verified for normality and homogeneity of variance, and non-Gaussian distribution of the mycotoxin concentrations was presented in this survey. Therefore, the non-parametric test (Wilcoxon test) was applied for the variance analysis of raw data. Different letters in the same column indicate significant differences in the average of positives. Significance was declared at p ≤ 0.05 for all variables.
Analysis for year-to-year variations of the positive rates and average concentrations for each mycotoxin were performed for the feed commodities or regions with a sufficiently high number of samples, for the purpose of preventing single samples from exerting an unduly strong influence on the overall results.
Author Contributions
W.H.: Conceptualization, data analysis, investigation, writing—original draft and editing; S.G.: Writing—review and editing, supervision, project administration, validation; A.L.: Data analysis, investigation, resources; J.W.: Data analysis, resources; G.A.: Supervision, project administration, funding acquisition; U.H.: Supervision, project administration; G.S.: Supervision, project administration. All authors have read and agreed to the published version of the manuscript.
Funding
This research received no external funding.
Institutional Review Board Statement
Not applicable.
Informed Consent Statement
Not applicable.
Data Availability Statement
Not applicable.
Acknowledgments
We thank Dawei Zhang and Xingna Nie for sample preparation and performance of multi-mycotoxin LC-MS/MS analysis and ELISA analysis at Romer Labs of Wuxi, Jiangsu province, China. We also thank Ruqing Zhong, Qingtao Gao, and Kai Li from Institute of Animal Sciences (IAS) of Chinese Academy of Agricultural Sciences (CAAS) for the guidance of statistical analysis.
Conflicts of Interest
The authors declare no conflict of interest.
References
- Guan, S.; Gong, M.; Yin, Y.L.; Huang, R.L.; Ruan, Z.; Zhou, T.; Xie, M.Y. Occurrence of mycotoxins in feeds and feed ingredients in China. J. Food Agric. Environ. 2011, 9, 163–167. [Google Scholar] [CrossRef]
- Becker-Algeri, T.A.; Castagnaro, D.; de Bortoli, K.; de Souza, C.; Drunkler, D.A.; Badiale-Furlong, E. Mycotoxins in bovine milk and dairy products: A review. J. Food Sci. 2016, 81, 544–552. [Google Scholar] [CrossRef] [Green Version]
- Bryden, W.L. Mycotoxin contamination of the feed supply chain: Implications for animal productivity and feed security. Anim. Feed Sci. Technol. 2012, 173, 134–158. [Google Scholar] [CrossRef]
- Streit, E.; Schatzmayr, G.; Tassis, P.; Tzika, E.; Marin, D.; Taranu, I.; Tabuc, C.; Nicolau, A.; Aprodu, I.; Puel, O. Current situation of mycotoxin contamination and co-occurrence in animal feed—Focus on Europe. Toxins 2012, 4, 788–809. [Google Scholar] [CrossRef] [Green Version]
- Commission Regulation (EU) No 574/2011; Commission Regulation (EU) No 574/2011 of 16 June 2011 Amending Annex I to Directive 2002/32/EC of the European Parliament and of the Council as Regards Maximum Levels for Nitrite, Melamine, Ambrosia spp. and Carry-Over of Certain Coccidiostats and Histomonostats and Consolidating Annexes I and II Thereto. Official Journal of the European Union, European Commission: Brussels, Belgium, 2011.
- 2013/165/EU; Commission Recommendation of 27 March 2013 on the Presence of T-2 and HT-2 Toxin in Cereals and Cereal Products. Official Journal of the European Union, European Commission: Brussels, Belgium, 2013.
- GB 13078-2017; Hygienical Standard for Feeds. General Administration of Quality Supervision. Inspection and Quarantine of the People’s Republic of China and Standardization Administration: Beijing, China, 2017.
- Grenier, B.; Bracarense, A.P.F.; Schwartz, H.E.; Lucioli, J.; Cossalter, A.M.; Moll, W.D.; Schatzmayr, G.; Oswald, I.P. Biotransformation approaches to alleviate the effects induced by Fusarium mycotoxins in swine. J. Agric. Food Chem. 2013, 61, 6711–6719. [Google Scholar] [CrossRef]
- Dilkin, P.; Zorzete, P.; Mallmann, C.A.; Gomes, J.D.F.; Utiyam, C.E.; Oetting, L.L.; Correa, B. Toxicological effects of chronic low doses of aflatoxin B1 and fumonisin B1-containing Fusarium moniliforme culture material in weaned piglets. Food Chem. Toxicol. 2003, 41, 1345–1353. [Google Scholar] [CrossRef]
- Sanchis, V.; Magan, N. Environmental conditions affecting mycotoxins. In Mycotoxins in Food: Detection and Control; Magan, N., Olsen, M., Eds.; Woodhead Publishing Ltd.: Cambridge, UK, 2004; pp. 174–189. [Google Scholar] [CrossRef]
- Gruber-Dorninger, C.; Jenkins, T.; Schatzmayr, G. Global mycotoxin occurrence in feed: A ten-year survey. Toxins 2019, 11, 375. [Google Scholar] [CrossRef] [Green Version]
- Kovalsky, P.; Kos, G.; Nährer, K.; Schwab, C.; Jenkins, T.; Schatzmayr, G.; Sulyok, M.; Krska, R. Co-Occurrence of Regulated, Masked and Emerging Mycotoxins and Secondary Metabolites in Finished Feed and Maize—An Extensive Survey. Toxins 2016, 8, 363. [Google Scholar] [CrossRef] [Green Version]
- Rodrigues, I.; Naehrer, K. A three-year survey on the worldwide occurrence of mycotoxins in feedstuffs and feed. Toxins 2012, 4, 663–675. [Google Scholar] [CrossRef]
- Gruber-Dorninger, C.; Jenkins, T.; Schatzmayr, G. Multi-mycotoxin screening of feed and feed raw materials from Africa. World Mycotoxin J. 2018, 11, 369–383. [Google Scholar] [CrossRef]
- Hao, W.; Li, A.P.; Wang, J.Y.; An, G.; Guan, S. Mycotoxin Contamination of Feeds and Raw Materials in China in Year 2021. Front. Vet. Sci. 2022, 9, 929904. [Google Scholar] [CrossRef]
- Mahoney, N.E.; Cheng, L.W.; Palumbo, J.D. Fate of aflatoxins during almond oil processing. J. Food Prot. 2021, 84, 106–112. [Google Scholar] [CrossRef]
- Sun, X.D.; Su, P.; Shan, H. Mycotoxin contamination of maize in China. Compr. Rev. Food Sci. Food Saf. 2017, 16, 835–849. [Google Scholar] [CrossRef] [Green Version]
- Ma, R.; Zhang, L.; Liu, M.; Su, Y.T.; Xie, W.M.; Zhang, N.Y.; Dai, J.F.; Wang, Y.; Rajput, S.A.; Qi, D.S.; et al. Individual and combined occurrence of mycotoxins in feed ingredients and complete feeds in China. Toxins 2018, 10, 113. [Google Scholar] [CrossRef] [Green Version]
- Ding, X.X.; Li, P.W.; Bai, Y.Z.; Zhou, H.Y. Aflatoxin B1 in post-harvest peanuts and dietary risk in China. Food Control 2012, 23, 143–148. [Google Scholar] [CrossRef]
- Blacutt, A.A.; Gold, S.E.; Voss, K.A.; Gao, M.; Glenn, A.E. Fusarium verticillioides: Advancements in understanding the toxicity, virulence, and niche adaptations of a model mycotoxigenic pathogen of maize. Phytopathology 2018, 108, 312–326. [Google Scholar] [CrossRef] [Green Version]
- Xing, F.; Liu, X.; Wang, L.; Selvaraj, J.N.; Jin, N.; Wang, Y.; Zhao, Y.; Liu, Y. Distribution and variation of fungi and major mycotoxins in pre-and post-nature drying maize in North China Plain. Food Control 2017, 80, 244–251. [Google Scholar] [CrossRef]
- Wei, T.; Zhu, W.; Pang, M.; Liu, Y.; Dong, J. Natural occurrence of fumonisins B1 and B2 in corn in four provinces of China. Food Addit. Contam. Part B Surveill. 2013, 6, 270–274. [Google Scholar] [CrossRef]
- Feng, Y.Z.; Lu, X.H.; Tao, B.; Pang, M.H.; Liu, Y.C.; Dong, J.G. Natural occurrence of fumonisins b1 and b2 in corn from three main production provinces in China. J. Food Prot. 2011, 74, 1374–1378. [Google Scholar] [CrossRef]
- Xu, W.; Han, X.; Li, F. Co-occurrence of multi-mycotoxins in wheat grains harvested in Anhui province, China. Food Control 2019, 96, 180–185. [Google Scholar] [CrossRef]
- Zhao, Y.; Guan, X.; Zong, Y.; Hua, X.; Xing, F.; Wang, Y.; Wang, F.; Liu, Y. Deoxynivalenol in wheat from the Northwestern region in China. Food Addit. Contam. Part B Surveill. 2018, 11, 281–285. [Google Scholar] [CrossRef]
- Schaafsma, A.W.; Limay-Rios, V.; Paul, D.E.; Miller, J.D. Mycotoxins in fuel ethanol co-products derived from maize: A mass balance for deoxynivalenol. J. Sci. Food Agric. 2009, 89, 1574–1580. [Google Scholar] [CrossRef]
- Han, Z.; Jiang, K.; Fan, Z.; Di Mavungu, J.D.; Dong, M.; Guo, W.; Fan, K.; Campbell, K.; Zhao, Z.; Wu, Y. Multi-walled carbon nanotubes-based magnetic solid-phase extraction for the determination of zearalenone and its derivatives in maize by ultra-high performance liquid chromatography-tandem mass spectrometry. Food Control 2017, 79, 177–184. [Google Scholar] [CrossRef] [Green Version]
- Han, R.W.; Zheng, N.; Wang, J.Q.; Zhen, Y.P.; Xu, X.M.; Li, S.L. Survey of aflatoxin in dairy cow feed and raw milk in China. Food Control 2013, 34, 35–39. [Google Scholar] [CrossRef]
- Miraglia, M.; Marvin, H.J.P.; Kleter, G.A.; Battilani, P.; Brera, C.; Coni, E.; Cubadda, F.; Croci, L.; De Santis, B.; Dekkers, S.; et al. Climate change and food safety: An emerging issue with special focus on Europe. Food Chem. Toxicol. 2009, 47, 1009–1021. [Google Scholar] [CrossRef]
- Magan, N.; Medina, A.; Aldred, D. Possible climate-change effects on mycotoxin contamination of food crops pre- and postharvest. Plant Pathol. 2011, 60, 150–163. [Google Scholar] [CrossRef]
- Wu, F.; Bhatnagar, D.; Bui-Klimke, T.; Carbone, I.; Hellmich, R.; Munkvold, G.; Paul, P.; Payne, G.; Takle, E. Climate change impacts on mycotoxin risks in US maize. World Mycotoxin J. 2011, 4, 79–93. [Google Scholar] [CrossRef] [Green Version]
- Paterson, R.R.M.; Lima, N. How will climate change affect mycotoxins in food? Food Res. Int. 2010, 43, 1902–1914. [Google Scholar] [CrossRef] [Green Version]
- Janse van Rensburg, B.; McLaren, N.W.; Flett, B.C. Grain colonization by fumonisin-producing Fusarium spp.and fumonisin synthesis in South African commercial maize in relation to prevailing weather conditions. Crop Prot. 2017, 102, 129–136. [Google Scholar] [CrossRef]
- Van Asselt, E.D.; Booij, C.J.; van der Fels-Klerx, H.J. Modelling mycotoxin formation by Fusarium graminearum in maize in The Netherlands. Food Addit. Contam. Part A Chem. Anal. Control Expo. Risk Assess. 2012, 29, 1572–1580. [Google Scholar] [CrossRef]
- Dabrowski, M.; Obremski, K.; Gajecka, M.; Gajecki, M.T.; Zielonka, L. Changes in the subpopulations of porcine peripheral blood lymphocytes induced by exposure to low doses of zearalenone (ZEN) and deoxynivalenol (DON). Molecules 2016, 21, 557. [Google Scholar] [CrossRef] [PubMed] [Green Version]
- Harvey, R.B.; Edrington, T.S.; Kubena, L.F.; Elissalde, M.H.; Rottinghaus, G.E. Influence of aflatoxin and fumonisin B1-containing culture material on growing barrows. Am. J. Vet. Res. 1995, 56, 1668–1672. [Google Scholar] [PubMed]
- Kubena, L.F.; Edrington, T.S.; Harvey, R.B.; Buckley, S.A.; Phillips, T.D.; Rottinghaus, G.E.; Casper, H.H. Individual and combined effects of fumonisin B1 present in Fusarium moniliforme culture material and T-2 toxin or deoxynivalenol in broiler chicks. Poult. Sci. 1997, 76, 1239–1247. [Google Scholar] [CrossRef] [PubMed]
- Battilani, P.; Toscano, P.; Van der Fels-Klerx, H.J.; Moretti, A.; Camardo Leggieri, M.; Brera, C.; Rortais, A.; Goumperis, T.; Robinson, T. Aflatoxin B1 contamination in maize in Europe increases due to climate change. Sci. Rep. 2016, 6, 24328. [Google Scholar] [CrossRef]
- Schloerke, B.; Crowley, J.; Cook, D.; Briatte, F.; Marbach, M.; Thoen, E.; Elberg, A.; Larmarange, J. GGally: Extension to ‘ggplot2′. R Package Version 1.4.0. 2017. Available online: https://CRAN.Rproject.org/package=GGally (accessed on 7 November 2022).
- R Core Team. R: A Language and Environment for Statistical Computing. R Foundation for Statistical Computing. 2018. Available online: https://www.R-project.org/ (accessed on 7 November 2022).
Figure 1.
Year-to-year variation of mycotoxin concentrations in new-season corn from different regions of China. The horizontal axis showed harvest years from 2017 to 2021. Vertical axes exhibited percentages of positive rates with column charts and values of positive averages with line charts. Data points are shown if ≥20 samples per region were available.

Figure 2.
Mycotoxin co-occurrence in new-season corn from 2017 to 2021. Pie chart presented the percentages of different numbers of mycotoxin co-occurrence in new season corn samples from 2017 to 2021; Bar chart presented the percentages of different combinations of two to three mycotoxins in new season corn samples from 2017 to 2021. *, combination of different mycotoxins.

Figure 3.
Correlation of mycotoxin concentrations in new-season corn from 2017 to 2021.


Table 1.
Mycotoxin legislation in China (hygienical standard for feeds GB13078–2017).
| Item | Matrix | Allowable Level | |
|---|---|---|---|
| Aflatoxin B1, μg/kg | Feed material | Corn processing products, peanut cake (meal) | ≤50 |
| Vegetable oil (excluding corn oil and peanut oil) | ≤10 | ||
| Corn oil, peanut oil | ≤20 | ||
| Other vegetable feed materials | ≤30 | ||
| Feed product | Concentrated feeds for piglets and young birds | ≤10 | |
| Concentrated feeds for meat ducklings in later stage, growing ducks and laying ducks | ≤15 | ||
| Other concentrated feeds | ≤20 | ||
| Concentrated supplements for calves and lambs | ≤20 | ||
| Concentrated supplements during lactation | ≤10 | ||
| Other concentrated supplements | ≤30 | ||
| Compound feeds for piglets and young birds | ≤10 | ||
| Compound feeds for meat ducklings in later stage, growing ducks, and laying ducks | ≤15 | ||
| Other formulated feeds | ≤20 | ||
| OTA, μg/kg | Feed material | Cereals and processed products | ≤100 |
| Feed product | Compound feeds | ≤100 | |
| Zearalenone, μg/kg | Feed material | Corn and its processed products (excluding corn husk, sprayed corn husk, and corn starch powder) | ≤500 |
| Corn husk, sprayed corn husk, corn starch powder, and corn distiller’s grains | ≤1500 | ||
| Other vegetable feed materials | ≤1000 | ||
| Feed product | Concentrated supplements for calves, lambs, and lactation | ≤500 | |
| Compound feeds for piglets | ≤150 | ||
| Compound feeds for young sows | ≤100 | ||
| Compound feeds for other pigs | ≤250 | ||
| Deoxynivalenol, μg/kg | Feed material | Vegetable feed materials | ≤5000 |
| Feed product | Concentrated supplements for calves, lambs, and lactation | ≤1000 | |
| Other concentrated supplements | ≤3000 | ||
| Compound feeds for pigs | ≤1000 | ||
| Other compound feeds | ≤3000 | ||
| T-2 toxin, μg/kg | Feed material | Vegetable feed materials | ≤500 |
| Feed product | Compound feeds for pigs and poultry | ≤500 | |
| Fumonisins (B1 + B2), μg/kg | Feed material | Corn and its processed products, corn distiller’s grains products, corn silage, and corn straw | ≤60 |
| Feed product | Concentrated supplements for calves and lambs | ≤20 | |
| Concentrated supplements for horses and rabbits | ≤5 | ||
| Other ruminant concentrated supplements | ≤50 | ||
| Concentrated feeds for pigs | ≤5 | ||
| Concentrated feeds for poultry | ≤20 | ||
| Compound feeds for pigs, rabbits, and horses | ≤5 | ||
| Compound feeds for poultry | ≤20 | ||
| Compound feeds for fish | ≤10 | ||
Table 2.
General mycotoxin contamination from 2017 to 2021.
| Aflatoxins | Trichothecenes Type B | FUMs | ZEN | |
|---|---|---|---|---|
| 2017–2021 | ||||
| Sample number | 9329 | 9329 | 9057 | 9329 |
| Positive rate | 17.44% | 87.07% | 77.14% | 56.29% |
| Average of positives (μg/kg) | 49.80 | 838.89 | 1842.57 | 183.81 |
| Maximum (μg/kg) | 10,091 | 59,325 | 60,276 | 11,245 |
| Year 2017 | ||||
| Sample number | 1188 | 1188 | 916 | 1188 |
| Positive rate | 12.71% | 98.74% | 71.07% | 33.42% |
| Average of positives (μg/kg) | 87.15 a | 748.21 b | 1660.76 b | 300.57 a |
| Maximum (μg/kg) | 476 | 13,206 | 16,976 | 5416 |
| Year 2018 | ||||
| Sample number | 2083 | 2083 | 2083 | 2083 |
| Positive rate | 25.25% | 88.72% | 80.60% | 46.86% |
| Average of positives (μg/kg) | 81.13 a | 843.18 d | 2464.74 a | 209.19 b |
| Maximum (μg/kg) | 10,091 | 59,325 | 60,276 | 8247 |
| Year 2019 | ||||
| Sample number | 1828 | 1828 | 1828 | 1828 |
| Positive rate | 20.46% | 88.24% | 84.57% | 57.44% |
| Average of positives (μg/kg) | 26.79 b | 614.10 c | 1816.52 b | 74.20 c |
| Maximum (μg/kg) | 497 | 12,907 | 56,332 | 4686 |
| Year 2020 | ||||
| Sample number | 1604 | 1604 | 1604 | 1604 |
| Positive rate | 15.52% | 72.44% | 62.91% | 46.82% |
| Average of positives (μg/kg) | 33.59 b | 642.52 b | 1562.75 b | 204.84 b |
| Maximum (μg/kg) | 482 | 10,426 | 30,872 | 11,245 |
| Year 2021 | ||||
| Sample number | 2626 | 2626 | 2626 | 2626 |
| Positive rate | 12.45% | 88.61% | 80.05% | 79.09% |
| Average of positives (μg/kg) | 20.82 b | 1135.07 a | 1555.39 b | 197.37 b |
| Maximum (μg/kg) | 440 | 13,513 | 38,563 | 10,467 |
| Source of variance (year) | ||||
| p-values (Average of positives) | <0.01 | <0.01 | <0.01 | <0.01 |
a–d in the average of positives of the same column showed significantly different (p < 0.05).
Table 3.
Mycotoxin contamination in different feed commodities from 2017 to 2021.
| Aflatoxins | Trichothecenes Type B | FUMs | ZEN | ||
|---|---|---|---|---|---|
| Raw materials | |||||
| Corn | Sample number | 2873 | 2873 | 2873 | 2873 |
| Positive rate | 16.50% | 87.47% | 81.55% | 51.51% | |
| Average of positives (μg/kg) | 63.28 | 871.28 | 2618.81 | 176.79 | |
| Maximum (μg/kg) | 733 | 12,808 | 40,090 | 4686 | |
| Wheat | Sample number | 411 | 411 | 411 | 411 |
| Positive rate | 1.22% | 70.56% | 21.41% | 48.18% | |
| Average of positives (μg/kg) | 2.60 | 2129.29 | 332.31 | 105.50 | |
| Maximum (μg/kg) | 5 | 59,325 | 910 | 1205 | |
| Soybean meal | Sample number | 257 | 257 | 257 | 257 |
| Positive rate | 7.78% | 14.79% | 6.61% | 39.69% | |
| Average of positives (μg/kg) | 4.65 | 171.50 | 760.24 | 45.26 | |
| Maximum (μg/kg) | 35 | 597 | 6932 | 237 | |
| Peanut meal | Sample number | 69 | 69 | 69 | 69 |
| Positive rate | 100.00% | 4.35% | 7.25% | 4.35% | |
| Average of positives (μg/kg) | 417.72 | 77.67 | 50.40 | 37.33 | |
| Maximum (μg/kg) | 10,091 | 139 | 120 | 61 | |
| Bran | Sample number | 341 | 341 | 341 | 341 |
| Positive rate | 4.11% | 95.31% | 6.74% | 23.75% | |
| Average of positives (μg/kg) | 2.64 | 1469.40 | 214.48 | 78.33 | |
| Maximum (μg/kg) | 4 | 13,206 | 1069 | 619 | |
| Rice bran meal | Sample number | 64 | 64 | 64 | 64 |
| Positive rate | 15.63% | 89.06% | 10.94% | 51.56% | |
| Average of positives (μg/kg) | 67.40 | 307.93 | 341.29 | 106.73 | |
| Maximum (μg/kg) | 214 | 1458 | 583 | 847 | |
| Cottonseed meal | Sample number | 104 | 104 | 104 | 104 |
| Positive rate | 35.58% | 6.73% | 43.27% | 7.69% | |
| Average of positives (μg/kg) | 40.92 | 127.71 | 318.69 | 13.50 | |
| Maximum (μg/kg) | 531 | 557 | 3812 | 200 | |
| Corn by-products | |||||
| DDGS | Sample number | 197 | 197 | 197 | 197 |
| Positive rate | 26.40% | 98.48% | 86.80% | 87.82% | |
| Average of positives (μg/kg) | 31.94 | 2327.08 | 6065.33 | 560.16 | |
| Maximum (μg/kg) | 179 | 12,907 | 59,642 | 5416 | |
| Corn gluten meal | Sample number | 78 | 78 | 78 | 78 |
| Positive rate | 35.90% | 84.62% | 100.00% | 94.87% | |
| Average of positives (μg/kg) | 75.36 | 581.73 | 8363.50 | 2004.30 | |
| Maximum (μg/kg) | 469 | 2619 | 60,276 | 11,245 | |
| Grasses | |||||
| Silage | Sample number | 678 | 678 | 582 | 678 |
| Positive rate | 0.44% | 87.02% | 83.16% | 61.80% | |
| Average of positives (μg/kg) | 8.67 | 1207.96 | 716.88 | 208.55 | |
| Maximum (μg/kg) | 21 | 18,273 | 6533 | 8649 | |
| Alfalfa | Sample number | 161 | 161 | 105 | 161 |
| Positive rate | 4.97% | 55.28% | 36.19% | 19.88% | |
| Average of positives (μg/kg) | 115.00 | 317.11 | 163.18 | 339.69 | |
| Maximum (μg/kg) | 291 | 1049 | 281 | 2852 | |
| Oat grass | Sample number | 124 | 124 | 106 | 124 |
| Positive rate | 0.00% | 53.23% | 38.68% | 36.29% | |
| Average of positives (μg/kg) | - | 1728.85 | 381.76 | 484.53 | |
| Maximum (μg/kg) | 0 | 9363 | 1986 | 2622 | |
| Finished feeds | |||||
| Poultry feed | Sample number | 1857 | 1857 | 1857 | 1857 |
| Positive rate | 29.99% | 98.82% | 95.85% | 71.46% | |
| Average of positives (μg/kg) | 15.79 | 563.88 | 1437.82 | 120.13 | |
| Maximum (μg/kg) | 206 | 6176 | 17,052 | 1490 | |
| Swine feed | Sample number | 1418 | 1418 | 1418 | 1418 |
| Positive rate | 21.93% | 97.53% | 92.95% | 57.12% | |
| Average of positives (μg/kg) | 16.95 | 513.82 | 1116.00 | 83.39 | |
| Maximum (μg/kg) | 245 | 3620 | 13,254 | 857 | |
| Concentrate supplement | Sample number | 207 | 207 | 138 | 207 |
| Positive rate | 7.73% | 97.10% | 87.68% | 53.14% | |
| Average of positives (μg/kg) | 3.13 | 618.31 | 965.70 | 93.52 | |
| Maximum (μg/kg) | 14 | 5258 | 7669 | 717 | |
| TMR | Sample number | 470 | 470 | 437 | 470 |
| Positive rate | 2.77% | 95.74% | 93.36% | 71.91% | |
| Average of positives (μg/kg) | 8.54 | 621.77 | 554.15 | 89.36 | |
| Maximum (μg/kg) | 39 | 6492 | 7619 | 719 | |
Table 4.
Mycotoxin contamination in new-season corn from 2017 to 2021.
| Aflatoxins | Trichothecenes Type B | FUMs | ZEN | |
|---|---|---|---|---|
| 2017–2021 | ||||
| Sample number | 1153 | 1153 | 1153 | 1153 |
| Positive rate | 31.40% | 84.04% | 87.16% | 50.13% |
| Average of positives (μg/kg) | 63.83 | 807.12 | 3549.65 | 203.41 |
| Maximum (μg/kg) | 733 | 6849 | 41,600 | 3017 |
| Year 2017 | ||||
| Sample number | 176 | 176 | 176 | 176 |
| Positive rate | 28.98% | 80.68% | 88.07% | 32.95% |
| Average of positives (μg/kg) | 147.74 a | 650.35 b | 3602.13 bc | 205.28 b |
| Maximum (μg/kg) | 476 | 3010 | 41,600 | 2095 |
| Year 2018 | ||||
| Sample number | 216 | 216 | 216 | 216 |
| Positive rate | 46.76% | 91.20% | 94.44% | 28.70% |
| Average of positives (μg/kg) | 72.67 b | 483.56 b | 4743.70a | 97.28 b |
| Maximum (μg/kg) | 733 | 2530 | 20,837 | 454 |
| Year 2019 | ||||
| Sample number | 207 | 207 | 207 | 207 |
| Positive rate | 32.37% | 78.74% | 80.68% | 40.58% |
| Average of positives (μg/kg) | 10.46 c | 532.03 b | 1944.99 c | 62.88 b |
| Maximum (μg/kg) | 118 | 2610 | 17,040 | 582 |
| Year 2020 | ||||
| Sample number | 207 | 207 | 207 | 207 |
| Positive rate | 24.15% | 77.29% | 78.26% | 46.86% |
| Average of positives (μg/kg) | 51.96 b | 706.16 b | 3941.64 b | 113.91 b |
| Maximum (μg/kg) | 482 | 4670 | 23,480 | 1572 |
| Year 2021 | ||||
| Sample number | 347 | 347 | 347 | 347 |
| Positive rate | 26.80% | 88.47% | 91.35% | 79.83% |
| Average of positives (μg/kg) | 53.05 b | 1285.93 a | 3400.62 c | 300.73 a |
| Maximum (μg/kg) | 331 | 6849 | 18,320 | 3017 |
| Source of variance (year) | ||||
| p-values (average of positives) | <0.01 | <0.01 | <0.01 | <0.01 |
a–c in the average of positives of the same column showed significantly different (p < 0.05).
Table 5.
Mycotoxin contamination in new-season corn of different regions from 2017 to 2021.
| Aflatoxins | Trichothecenes Type B | FUMs | ZEN | |
|---|---|---|---|---|
| Northeast China | ||||
| Sample number | 379 | 379 | 379 | 379 |
| Positive rate | 3.69% | 94.99% | 79.42% | 55.67% |
| Average of positives (μg/kg) | 9.36 c | 889.63 b | 1678.28 c | 115.44 b |
| Maximum (μg/kg) | 44 | 4670 | 11,193 | 726 |
| North China | ||||
| Sample number | 199 | 199 | 199 | 199 |
| Positive rate | 30.15% | 80.90% | 89.95% | 49.75% |
| Average of positives (μg/kg) | 15.36 c | 842.73 b | 3379.15 b | 176.69 b |
| Maximum (μg/kg) | 256.63 | 3430 | 18,320 | 1572 |
| East China (Shandong) | ||||
| Sample number | 191 | 191 | 191 | 191 |
| Positive rate | 8.38% | 76.96% | 90.05% | 59.16% |
| Average of positives (μg/kg) | 35.51 c | 1207.20 a | 4699.77 a | 483.87 a |
| Maximum (μg/kg) | 188.00 | 6849.00 | 22,200.00 | 3017.00 |
| East China (Anhui and Jiangsu) | ||||
| Sample number | 138 | 138 | 138 | 138 |
| Positive rate | 82.61% | 71.01% | 92.03% | 35.51% |
| Average of positives (μg/kg) | 103.08 a | 479.16 c | 4606.60 a | 100.24 b |
| Maximum (μg/kg) | 733.00 | 2310.00 | 19,800.00 | 563.87 |
| Central China | ||||
| Sample number | 246 | 246 | 246 | 246 |
| Positive rate | 64.23% | 82.52% | 91.87% | 43.09% |
| Average of positives (μg/kg) | 61.62 b | 501.16 c | 4707.84 a | 152.18 b |
| Maximum (μg/kg) | 605.00 | 2430.00 | 41,600.00 | 2095.36 |
| Source of variance (region) | ||||
| p-values (Average of positives) | <0.01 | <0.01 | <0.01 | <0.01 |
a–c. in the average of positives of the same column showed significantly different (p < 0.05).
Table 6.
Total sample numbers per commodity per year.
| Year 2017 | Year 2018 | Year 2019 | Year 2020 | Year 2021 | Total | |
|---|---|---|---|---|---|---|
| Raw materials | ||||||
| Corn | 289 | 540 | 469 | 665 | 910 | 2873 |
| Wheat | - | 113 | - | 72 | 226 | 411 |
| Soybean meal | 23 | 66 | 49 | 63 | 56 | 257 |
| Peanut meal | - | 36 | - | 25 | 8 | 69 |
| Bran | 59 | 102 | 66 | 49 | 65 | 341 |
| Rice bran meal | 31 | - | 12 | 9 | 12 | 64 |
| Cottonseed gluten meal | - | 40 | 51 | - | 13 | 104 |
| Flaked Corn | - | 21 | - | - | - | 21 |
| Corn by-products | ||||||
| DDGS | 65 | 50 | 40 | 15 | 27 | 197 |
| Corn gluten meal | - | 20 | 22 | 27 | 20 | 89 |
| Sprayed corn husk | - | - | 7 | 3 | 11 | 21 |
| Corn germ meal | - | - | 10 | - | - | 10 |
| Grasses | ||||||
| Silage | 96 | 118 | 116 | 105 | 243 | 678 |
| Alfalfa | 56 | 36 | 14 | 39 | 16 | 161 |
| Oat | 18 | - | 12 | 30 | 64 | 124 |
| Soybean husk | - | - | 11 | 3 | 6 | 20 |
| Finished feeds | ||||||
| Poultry feed | 155 | 353 | 645 | 270 | 434 | 1857 |
| Swine feed | 294 | 468 | 182 | 124 | 350 | 1418 |
| Concentrate supplement | 69 | 38 | 40 | 26 | 34 | 207 |
| Total mixed ration (TMR) | 33 | 83 | 121 | 85 | 148 | 470 |
Table 7.
Samples of new-season corn per region per year.
| Year 2017 | Year 2018 | Year 2019 | Year 2020 | Year 2021 | Total | |
|---|---|---|---|---|---|---|
| Heilongjiang | 12 | 11 | 12 | 21 | 27 | 83 |
| Jilin | 16 | 21 | 17 | 11 | 28 | 93 |
| Liaoning | 28 | 41 | 58 | 36 | 40 | 203 |
| Hebei | 19 | 30 | 29 | 25 | 72 | 175 |
| Shandong | 13 | 25 | 34 | 38 | 81 | 191 |
| Henan | 49 | 57 | 24 | 60 | 56 | 246 |
| Anhui and Jiangsu | 27 | 31 | 21 | 16 | 43 | 138 |
| Inner Mongolia | 12 | - | 12 | - | - | 24 |
| Gansu | - | - | - | 7 | - | 7 |
Disclaimer/Publisher’s Note: The statements, opinions and data contained in all publications are solely those of the individual author(s) and contributor(s) and not of MDPI and/or the editor(s). MDPI and/or the editor(s) disclaim responsibility for any injury to people or property resulting from any ideas, methods, instructions or products referred to in the content. |
© 2023 by the authors. Licensee MDPI, Basel, Switzerland. This article is an open access article distributed under the terms and conditions of the Creative Commons Attribution (CC BY) license (https://creativecommons.org/licenses/by/4.0/).
Share and Cite
MDPI and ACS Style
Hao, W.; Guan, S.; Li, A.; Wang, J.; An, G.; Hofstetter, U.; Schatzmayr, G. Mycotoxin Occurrence in Feeds and Raw Materials in China: A Five-Year Investigation. Toxins 2023, 15, 63. https://doi.org/10.3390/toxins15010063
AMA Style
Hao W, Guan S, Li A, Wang J, An G, Hofstetter U, Schatzmayr G. Mycotoxin Occurrence in Feeds and Raw Materials in China: A Five-Year Investigation. Toxins. 2023; 15(1):63. https://doi.org/10.3390/toxins15010063
Chicago/Turabian StyleHao, Wei, Shu Guan, Anping Li, Jinyong Wang, Gang An, Ursula Hofstetter, and Gerd Schatzmayr. 2023. "Mycotoxin Occurrence in Feeds and Raw Materials in China: A Five-Year Investigation" Toxins 15, no. 1: 63. https://doi.org/10.3390/toxins15010063
Note that from the first issue of 2016, this journal uses article numbers instead of page numbers. See further details here.