Development of High-Throughput Sample Preparation Procedures for the Quantitative Determination of Aflatoxins in Biological Matrices of Chickens and Cattle Using UHPLC-MS/MS

 ,
,  , ,
, ,  ,
,  and
and 
Abstract
:1. Introduction
2. Results and Discussion
2.1. Sample Preparation
2.1.1. Plasma
2.1.2. Milk and Ruminal Fluid
2.1.3. Edible Animal Tissues
2.2. Liquid Chromatography
2.3. Mass Spectrometry
2.4. Method Validation
2.4.1. Linearity
2.4.2. Accuracy and Precision
2.4.3. Limit of Quantification (LOQ) and Limit of Detection (LOD)
2.4.4. Carry-Over
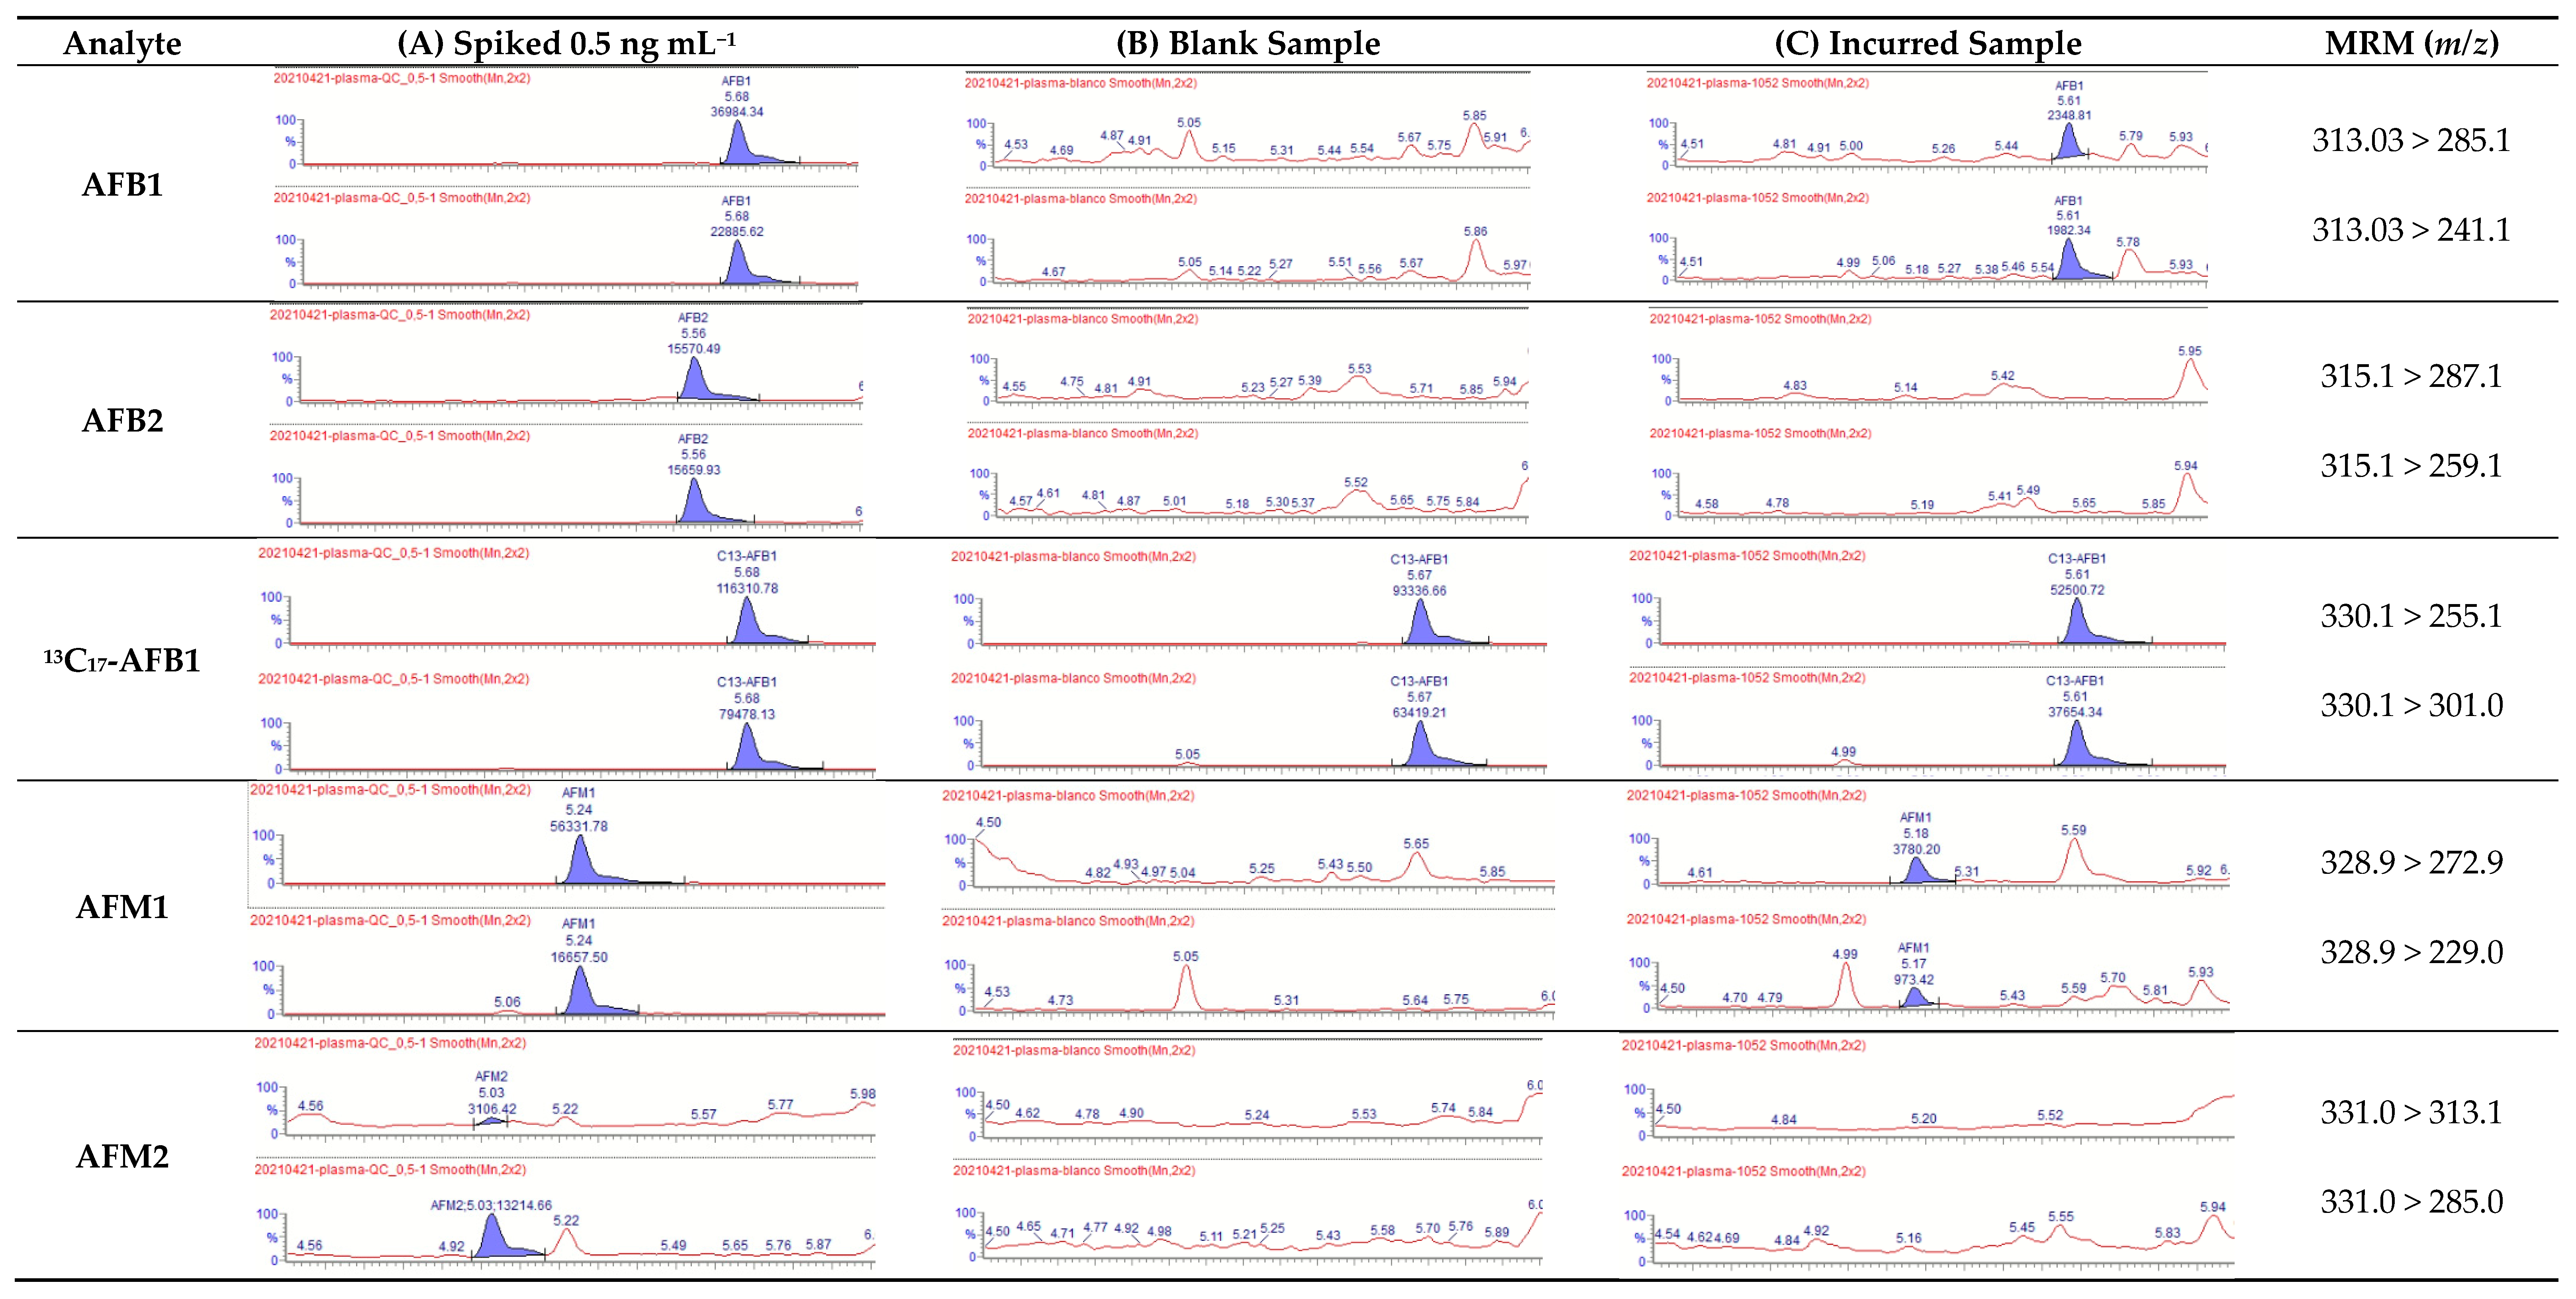
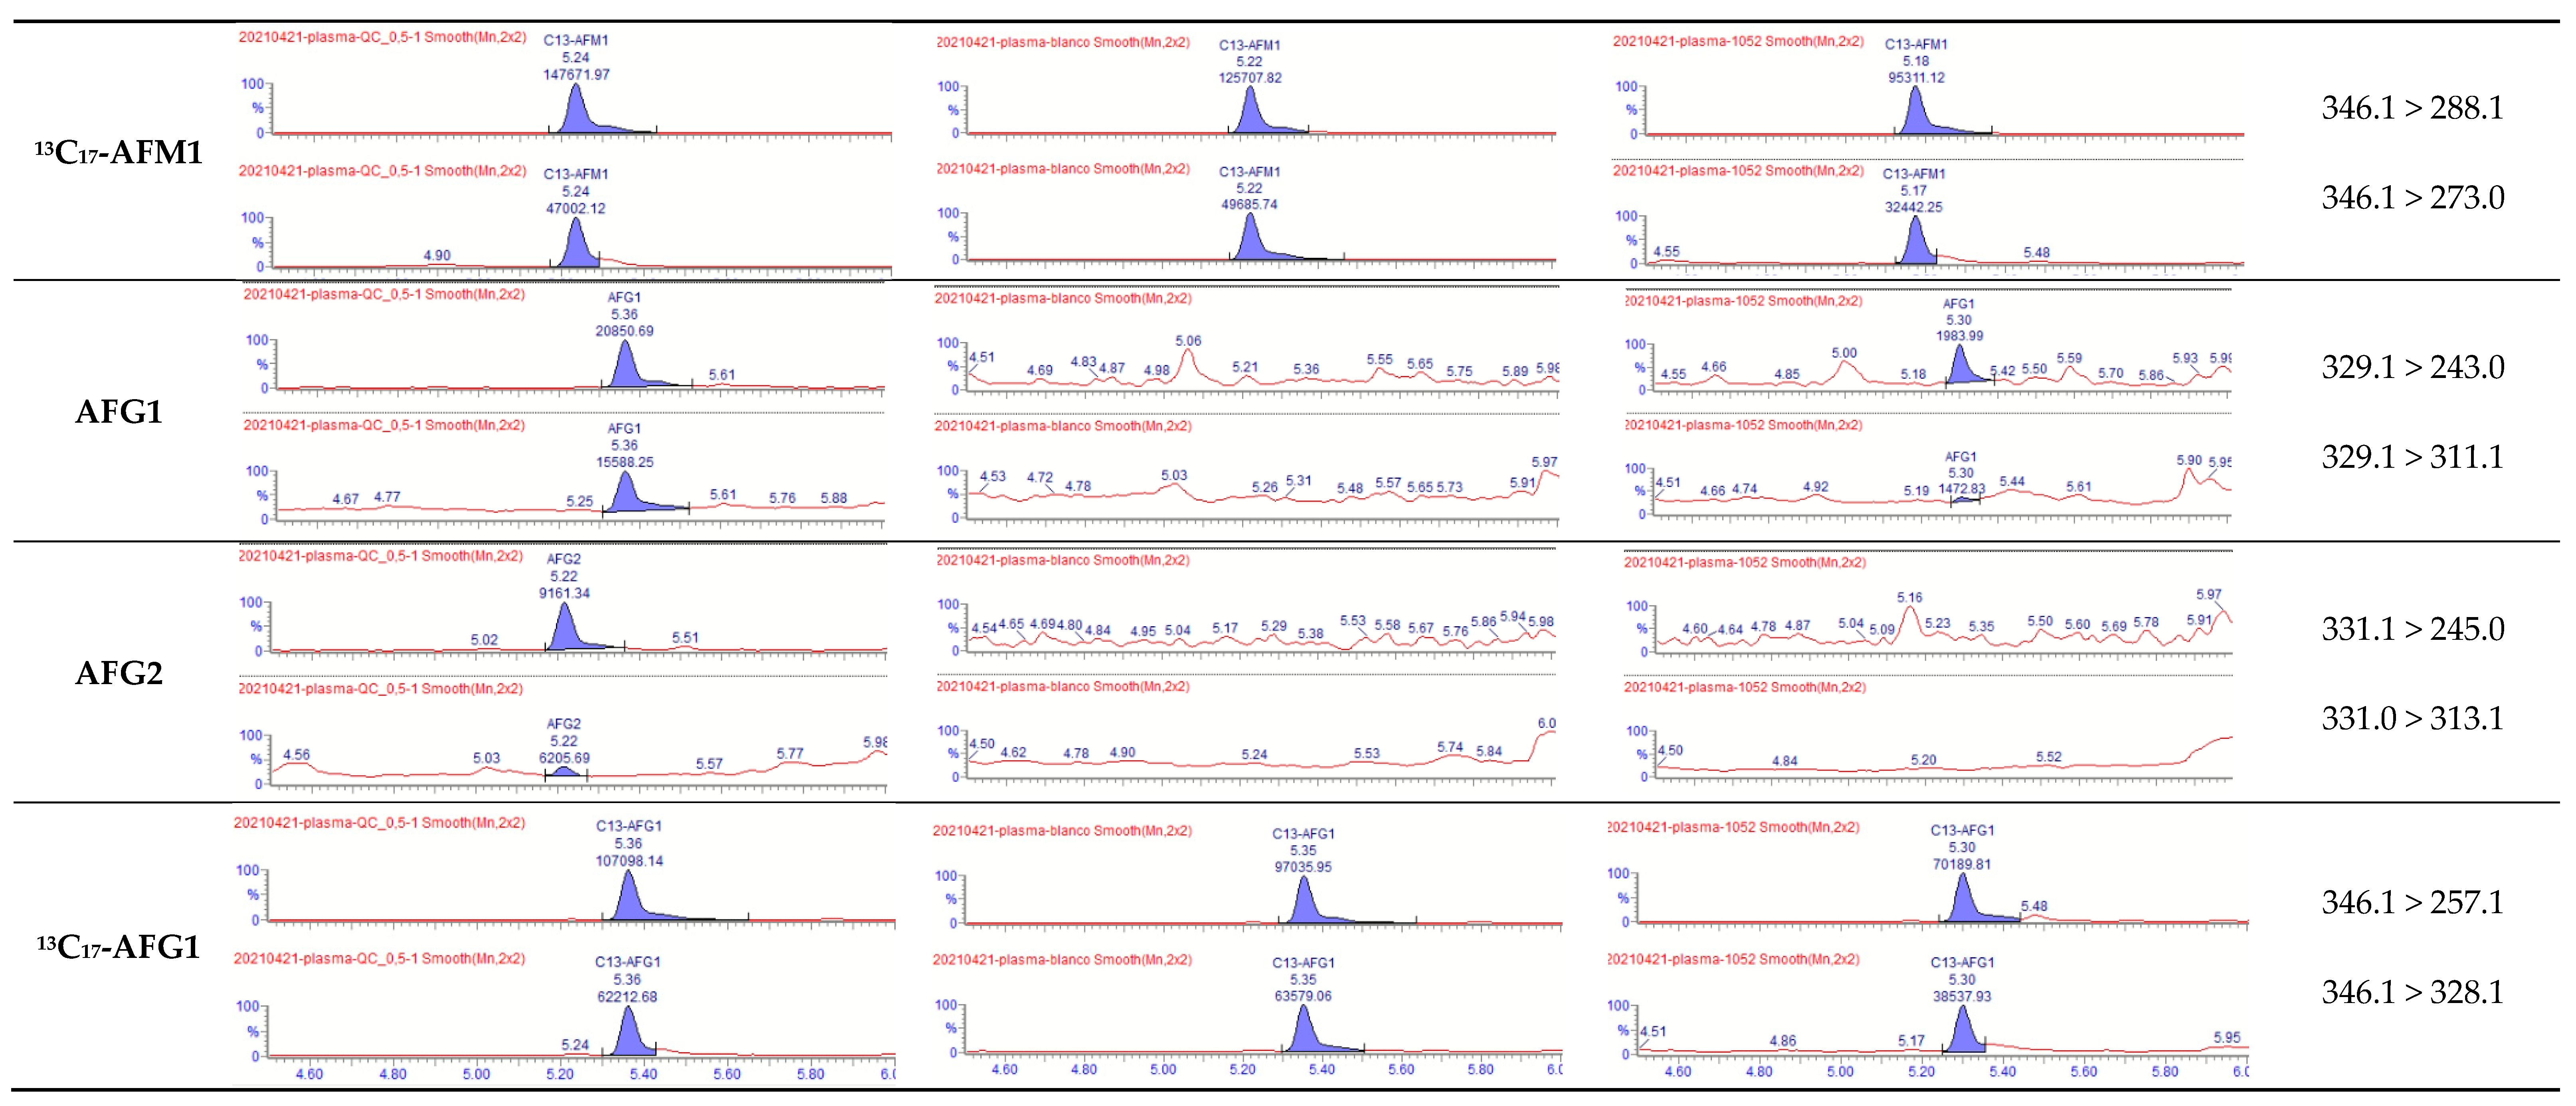
2.4.5. Selectivity
2.4.6. Stability
2.4.7. Extraction Recovery and Matrix-Effects
2.5. Analysis of Incurred Samples
3. Conclusions
4. Materials and Methods
4.1. Chemicals and Reagents
4.2. Preparation of Standard Solutions
4.3. Biological Samples
4.3.1. Blank Samples
4.3.2. Incurred Samples
4.4. Sample Pre-Treatment
4.4.1. Chicken and Cattle Plasma
4.4.2. Cattle Milk and Ruminal Fluid
4.4.3. Chicken Liver
4.4.4. Chicken Muscle
4.4.5. Egg
4.5. UHPLC-MS/MS Analysis for Quantification
4.6. Method Validation
4.6.1. Calibration Curves
4.6.2. Accuracy and Precision
4.6.3. Limit of Quantification and Limit of Detection
4.6.4. Carry-Over
4.6.5. Extraction Recovery, Matrix-Effects, and Process Efficiency
4.6.6. Storage Stability
Supplementary Materials
Author Contributions
Funding
Institutional Review Board Statement
Informed Consent Statement
Data Availability Statement
Acknowledgments
Conflicts of Interest
References
- Frenich, A.G.; Romero-Gonzalez, R.; Gomez-Perez, M.L.; Vidal, J.L.M. Multi-mycotoxin analysis in eggs using a QuEChERS-based extraction procedure and ultra-high-pressure liquid chromatography coupled to triple quadrupole mass spectrometry. J Chromatogr. A 2011, 1218, 4349–4356. [Google Scholar] [CrossRef] [PubMed]
- Al Jaal, B.A.; Jaganjac, M.; Barcaru, A.; Horvatovich, P.; Latiff, A. Aflatoxin, fumonisin, ochratoxin, zearalenone and deoxynivalenol biomarkers in human biological fluids: A systematic literature review, 2001–2018. Food Chem. Toxicol. 2019, 129, 211–228. [Google Scholar] [CrossRef] [Green Version]
- Kemboi, D.C.; Antonissen, G.; Ochieng, P.E.; Croubels, S.; Okoth, S.; Kangethe, E.K.; Faas, J.; Lindahl, J.F.; Gathumbi, J.K. A Review of the Impact of Mycotoxins on Dairy Cattle Health: Challenges for Food Safety and Dairy Production in Sub-Saharan Africa. Toxins 2020, 12, 222. [Google Scholar] [CrossRef] [Green Version]
- World Health Organisation, International Agency for Research on Cancer (IARC). Aflatoxins. In Monographs on the Evaluation of Carcinogenic Risks to Human; World Health Organisation, International Agency for Research on Cancer (IARC): Lyon, France, 2002; Volume 82, pp. 171–300. [Google Scholar]
- Cao, X.Q.; Li, X.F.; Li, J.; Niu, Y.H.; Shi, L.; Fang, Z.F.; Zhang, T.; Ding, H. Quantitative determination of carcinogenic mycotoxins in human and animal biological matrices and animal-derived foods using multi-mycotoxin and analyte-specific high performance liquid chromatography-tandem mass spectrometric methods. J. Chromatogr. B 2018, 1073, 191–200. [Google Scholar] [CrossRef]
- Chen, J.; Chen, K.J.; Yuan, S.B.; Peng, X.; Fang, J.; Wang, F.Y.; Cui, H.M.; Chen, Z.L.; Yuan, J.X.; Geng, Y. Effects of aflatoxin B-1 on oxidative stress markers and apoptosis of spleens in broilers. Toxicol. Ind. Health 2016, 32, 278–284. [Google Scholar] [CrossRef]
- Wang, H.; Zhou, X.J.; Liu, Y.Q.; Yang, H.M.; Guo, Q.L. Determination of aflatoxin M1 in milk by triple quadrupole liquid chromatography-tandem mass spectrometry. Food Addit. Contam. A 2010, 27, 1261–1265. [Google Scholar] [CrossRef]
- Xie, L.J.; Chen, M.; Ying, Y.B. Development of Methods for Determination of Aflatoxins. Crit. Rev. Food Sci. 2016, 56, 2642–2664. [Google Scholar] [CrossRef] [PubMed]
- Becker-Algeri, T.A.; Castagnaro, D.; de Bortoli, K.; de Souza, C.; Drunkler, D.A.; Badiale-Furlong, E. Mycotoxins in Bovine Milk and Dairy Products: A Review. J. Food Sci. 2016, 81, R544–R552. [Google Scholar] [CrossRef] [PubMed] [Green Version]
- Escriva, L.; Manyes, L.; Font, G.; Berrada, H. Mycotoxin Analysis of Human Urine by LC-MS/MS: A Comparative Extraction Study. Toxins 2017, 9, 330. [Google Scholar] [CrossRef] [PubMed] [Green Version]
- Chen, Z.Y.; Brown, R.L.; Menkir, A.; Cleveland, T.E. Identification of resistance-associated proteins in closely-related maize lines varying in aflatoxin accumulation. Mol. Breed. 2012, 30, 53–68. [Google Scholar] [CrossRef]
- Ochieng, P.E.; Scippo, M.L.; Kemboi, D.C.; Croubels, S.; Okoth, S.; Kang’ethe, E.K.; Doupovec, B.; Gathumbi, J.K.; Lindahl, J.F.; Antonissen, G. Mycotoxins in Poultry Feed and Feed Ingredients from Sub-Saharan Africa and Their Impact on the Production of Broiler and Layer Chickens: A Review. Toxins 2021, 13, 633. [Google Scholar] [CrossRef] [PubMed]
- Flores-Flores, M.E.; Gonzalez-Penas, E. Analysis of Mycotoxins in Peruvian Evaporated Cow Milk. Beverages 2018, 4, 34. [Google Scholar] [CrossRef] [Green Version]
- Debevere, S.; Cools, A.; De Baere, S.; Haesaert, G.; Rychlik, M.; Fievez, V.; Croubels, S. In Vitro Rumen Simulations Show a Reduced Disappearance of Deoxynivalenol, Nivalenol and Enniatin B at Conditions of Rumen Acidosis and Lower Microbial Activity. Toxins 2020, 12, 101. [Google Scholar] [CrossRef] [PubMed] [Green Version]
- Flores-Flores, M.E.; Gonzalez-Penas, E. An LC-MS/MS method for multi-mycotoxin quantification in cow milk. Food Chem. 2017, 218, 378–385. [Google Scholar] [CrossRef]
- Assaf, J.C.; Nahle, S.; Chokr, A.; Louka, N.; Atoui, A.; El Khoury, A. Assorted Methods for Decontamination of Aflatoxin M1 in Milk Using Microbial Adsorbents. Toxins 2019, 11, 304. [Google Scholar] [CrossRef] [Green Version]
- Neckermann, K.; Claus, G.; De Baere, S.; Antonissen, G.; Lebrun, S.; Gemmi, C.; Taminiau, B.; Douny, C.; Scippo, M.L.; Schatzmayr, D.; et al. The efficacy and effect on gut microbiota of an aflatoxin binder and a fumonisin esterase using an in vitro simulator of the human intestinal microbial ecosystem (SHIME (R)). Food Res. Int. 2021, 145, 110395. [Google Scholar] [CrossRef]
- Commission Regulation (EC) n° 1881/2006 of 19 December 2006 setting maximum levels for certain contaminants in foodstuffs. Off. J. Eur. Union 2006, L364, 5–24.
- Food and Drug Administration (FDA). Complicance Policy Guide (CPG) Sec 527.400. Whole Milk, Lowfat Milk, Skim Milk, Aflatoxin M1; Office of Regulatory Affairs, Center for Food Safety and Applied Nutrition: Rockville, MD, USA, 2005; pp. 1–3. [Google Scholar]
- Food and Drug Administration (FDA). Complicance Policy Guide (CPG) Sec 555.400. Foods—Adulteration with Aflatoxin; Office of Regulatory Affairs, Center for Food Safety and Applied Nutrition: College Park, MD, USA, 2005; pp. 1–2. [Google Scholar]
- Devreese, M.; De Baere, S.; De Backer, P.; Croubels, S. Quantitative determination of several toxicological important mycotoxins in pig plasma using multi-mycotoxin and analyte-specific high performance liquid chromatography-tandem mass spectrometric methods. J. Chromatogr. A 2012, 1257, 74–80. [Google Scholar] [CrossRef]
- Lauwers, M.; Croubels, S.; Letor, B.; Gougoulias, C.; Devreese, M. Biomarkers for Exposure as a Tool for Efficacy Testing of a Mycotoxin Detoxifier in Broiler Chickens and Pigs. Toxins 2019, 11, 187. [Google Scholar] [CrossRef] [Green Version]
- EFSA. Statement on the establishment of guidelines for the assessment of additives from the functional group ‘substances for reduction of the contamination of feed by mycotoxins’ 1 EFSA Panel on Additives and Products or Substances used in Animal Feed (FEEDA). EFSA J. 2010, 8, 1–8. [Google Scholar]
- Corcuera, L.A.; Ibanez-Vea, M.; Vettorazzi, A.; Gonzalez-Penas, E.; de Cerain, A.L. Validation of a UHPLC-FLD analytical method for the simultaneous quantification of aflatoxin B1 and ochratoxin a in rat plasma, liver and kidney. J. Chromatogr. B 2011, 879, 2733–2740. [Google Scholar] [CrossRef]
- Warth, B.; Braun, D.; Ezekiel, C.N.; Turner, P.C.; Degen, G.H.; Marko, D. Biomonitoring of Mycotoxins in Human Breast Milk: Current State and Future Perspectives. Chem. Res. Toxicol. 2016, 29, 1087–1097. [Google Scholar] [CrossRef] [PubMed]
- Cui, X.X.; Muhammad, I.; Li, R.; Jin, H.R.; Guo, Z.L.; Yang, Y.Q.; Hamid, S.; Li, J.R.; Cheng, P.; Zhang, X.Y. Development of a UPLC-FLD Method for Detection of Aflatoxin B1 and M1 in Animal Tissue to Study the Effect of Curcumin on Mycotoxin Clearance Rates. Front. Pharmacol. 2017, 8, 650. [Google Scholar] [CrossRef] [PubMed] [Green Version]
- Han, Z.; Zhao, Z.Y.; Song, S.Q.; Liu, G.; Shi, J.X.; Zhang, J.B.; Liao, Y.C.; Zhang, D.B.; Wu, Y.J.; De Saeger, S.; et al. Establishment of an isotope dilution LC-MS/MS method revealing kinetics and distribution of co-occurring mycotoxins in rats. Anal. Methods 2012, 4, 3708–3717. [Google Scholar] [CrossRef] [Green Version]
- Zhang, K.; Banerjee, K. A Review: Sample Preparation and Chromatographic Technologies for Detection of Aflatoxins in Foods. Toxins 2020, 12, 539. [Google Scholar] [CrossRef]
- Zhang, K.; Lia, C.D.; Prakash, S.; Conway, M.; Cheng, H.F. Interlaboratory Validation of a Stable Isotope Dilution and Liquid Chromatography Tandem Mass Spectrometry Method for the Determination of Aflatoxins in Milk, Milk-Based Infant Formula, and Feed. J. AOAC Int. 2018, 101, 677–685. [Google Scholar] [CrossRef]
- Tsagkaris, A.S.; Prusova, N.; Dzuman, Z.; Pulkrabova, J.; Hajslova, J. Regulated and Non-Regulated Mycotoxin Detection in Cereal Matrices Using an Ultra-High-Performance Liquid Chromatography High-Resolution Mass Spectrometry (UHPLC-HRMS) Method. Toxins 2021, 13, 783. [Google Scholar] [CrossRef] [PubMed]
- De Baere, S.; Osselaere, A.; Devreese, M.; Vanhaecke, L.; De Backer, P.; Croubels, S. Development of a liquid-chromatography tandem mass spectrometry and ultra-high-performance liquid chromatography high-resolution mass spectrometry method for the quantitative determination of zearalenone and its major metabolites in chicken and pig plasma. Anal. Chim. Acta 2012, 756, 37–48. [Google Scholar] [CrossRef]
- De Baere, S.; Croubels, S.; Novak, B.; Bichl, G.; Antonissen, G. Development and Validation of a UPLC-MS/MS and UPLC-HR-MS Method for the Determination of Fumonisin B1 and Its Hydrolysed Metabolites and Fumonisin B2 in Broiler Chicken Plasma. Toxins 2018, 10, 62. [Google Scholar] [CrossRef] [Green Version]
- Slobodchikova, I.; Vuckovic, D. Liquid chromatography—High resolution mass spectrometry method for monitoring of 17 mycotoxins in human plasma for exposure studies. J. Chromatogr. A 2018, 1548, 51–63. [Google Scholar] [CrossRef] [Green Version]
- Andrade, P.D.; da Silva, J.L.G.; Caldas, E.D. Simultaneous analysis of aflatoxins BI, B2, G-1, G2, M-1 and ochratoxin A in breast milk by high-performance liquid chromatography/fluorescence after liquid-liquid extraction with low temperature purification (LLE-LTP). J. Chromatogr. A 2013, 1304, 61–68. [Google Scholar] [CrossRef] [PubMed]
- Zhu, R.Y.; Zhao, Z.Y.; Yang, X.L.; Nie, D.X.; Xu, F.; Wu, A.B.; Song, S.Q. Determination of Mycotoxin Biomarkers in Eggs by Liquid Chromatography-Tandem Mass Spectrometry Coupled with Matrix Solid Phase Dispersion. Chin. J. Anal. Chem. 2015, 43, 994–1000. [Google Scholar]
- Braun, D.; Ezekiel, C.N.; Abia, W.A.; Wisgrill, L.; Degen, G.H.; Turner, P.C.; Marko, D.; Warth, B. Monitoring Early Life Mycotoxin Exposures via LC-MS/MS Breast Milk Analysis. Anal. Chem. 2018, 90, 14569–14577. [Google Scholar] [CrossRef] [PubMed]
- York, J.L.; Magnuson, R.H.; Schug, K.A. On-line sample preparation for multiclass vitamin, hormone, and mycotoxin determination in chicken egg yolk using LC-MS/MS. Food Chem. 2020, 326, 126939. [Google Scholar] [CrossRef] [PubMed]
- Ferlazzo, A.M.; Bruschetta, G.; Di Pietro, P.; Medica, P.; Notti, A.; Rotondo, E. Phospholipid composition of plasma and erythrocyte membranes in animal species by P-31 NMR. Vet. Res. Commun. 2011, 35, 521–530. [Google Scholar] [CrossRef]
- Chambers, E.; Wagrowski-Diehl, D.M.; Lu, Z.L.; Mazzeo, J.R. Systematic and comprehensive strategy for reducing matrix effects in LC/MS/MS analyses. J. Chromatogr. B 2007, 852, 22–34. [Google Scholar] [CrossRef]
- Saad-Hussein, A.; Taha, M.M.; Fadl, N.N.; Awad, A.H.; Mahdy-Abdallah, H.; Moubarz, G.; Aziz, H.; El-Shamy, K.A. Effects of airborne Aspergillus on serum aflatoxin B1 and liver enzymes in workers handling wheat flour. Hum. Exp. Toxicol. 2016, 35, 3–9. [Google Scholar] [CrossRef]
- Britzi, M.; Friedman, S.; Miron, J.; Solomon, R.; Cuneah, O.; Shimshoni, J.A.; Soback, S.; Ashkenazi, R.; Armer, S.; Shlosberg, A. Carry-Over of Aflatoxin B1 to Aflatoxin M1 in High Yielding Israeli Cows in Mid- and Late-Lactation. Toxins 2013, 5, 173–183. [Google Scholar] [CrossRef]
- Afshar, P.; Shokrzadeh, M.; Kalhori, S.; Babaee, Z.; Saravi, S.S.S. Occurrence of Ochratoxin A and Aflatoxin M1 in human breast milk in Sari, Iran. Food Control. 2013, 31, 525–529. [Google Scholar] [CrossRef]
- Rubert, J.; Leon, N.; Saez, C.; Martins, C.P.B.; Godula, M.; Yusa, V.; Manes, J.; Soriano, J.M.; Soler, C. Evaluation of mycotoxins and their metabolites in human breast milk using liquid chromatography coupled to high resolution mass spectrometry. Anal. Chim. Acta 2014, 820, 39–46. [Google Scholar] [CrossRef]
- Zhao, Z.Y.; Liu, N.; Yang, L.C.; Deng, Y.F.; Wang, J.H.; Song, S.Q.; Lin, S.H.; Wu, A.B.; Zhou, Z.L.; Hou, J.F. Multi-mycotoxin analysis of animal feed and animal-derived food using LC-MS/MS system with timed and highly selective reaction monitoring. Anal. Bioanal. Chem. 2015, 407, 7359–7368. [Google Scholar] [CrossRef]
- Hussain, Z.; Habib-ur-Rehman; Manzoor, S.; Tahir, S.; Mukhtar, M. Determination of liver and muscle aflatoxin B1 residues and select serum chemistry variables during chronic aflatoxicosis in broiler chickens. Vet. Clin. Path. 2016, 45, 330–334. [Google Scholar] [CrossRef] [PubMed]
- Tolosa, J.; Rodriguez-Carrasco, Y.; Ruiz, M.J.; Vila-Donat, P. Multi-mycotoxin occurrence in feed, metabolism and carry-over to animal-derived food products: A review. Food. Chem. Toxicol. 2021, 158, 112661. [Google Scholar] [CrossRef]
- Arroyo-Manzanares, N.; Campillo, N.; Lopez-Garcia, I.; Hernandez-Cordoba, M.; Vinas, P. High-resolution mass spectrometry for the determination of mycotoxins in biological samples. A review. Microchem. J. 2021, 166, 106197. [Google Scholar] [CrossRef]
- Oliveira, C.A.F.; Kobashigawa, E.; Reis, T.A.; Mestieri, L.; Albaquerque, R.; Correa, B. Aflatoxin B-1 residues in eggs of laying hens fed a diet containing different levels of the mycotoxin. Food Addit. Contam. A 2000, 17, 459–462. [Google Scholar] [CrossRef]
- Capriotti, A.L.; Caruso, G.; Cavaliere, C.; Foglia, P.; Samperi, R.; Lagana, A. Multiclass mycotoxin analysis in food, environmental and biological matrices with chromatography/mass spectrometry. Mass. Spectrom. Rev. 2012, 31, 466–503. [Google Scholar] [CrossRef]
- Emmanuel, K.T.; Els, V.; Bart, H.; Evelyne, D.; Els, V.; Els, D. Carry-over of some Fusarium mycotoxins in tissues and eggs of chickens fed experimentally mycotoxin-contaminated diets. Food Chem. Toxicol. 2020, 145, 111715. [Google Scholar] [CrossRef]
- Meerpoel, C.; Vidal, A.; Tangni, E.K.; Huybrechts, B.; Couck, L.; De Rycke, R.; De Bels, L.; De Saeger, S.; Van den Broeck, W.; Devreese, M.; et al. A Study of Carry-Over and Histopathological Effects after Chronic Dietary Intake of Citrinin in Pigs, Broiler Chickens and Laying Hens. Toxins 2020, 12, 719. [Google Scholar] [CrossRef] [PubMed]
- Michlig, N.; Repetti, M.R.; Chiericatti, C.; Garcia, S.R.; Gaggiotti, M.; Basilico, J.C.; Beldomenico, H.R. Multiclass Compatible Sample Preparation for UHPLC-MS/MS Determination of Aflatoxin M1 in Raw Milk. Chromatographia 2016, 79, 1091–1100. [Google Scholar] [CrossRef]
- Arce-Lopez, B.; Lizarraga, E.; Vettorazzi, A.; Gonzalez-Penas, E. Human Biomonitoring of Mycotoxins in Blood, Plasma and Serum in Recent Years: A Review. Toxins 2020, 12, 147. [Google Scholar] [CrossRef] [Green Version]
- Wang, L.; Zhang, Q.Y.; Yan, Z.; Tan, Y.L.; Zhu, R.Y.; Yu, D.Z.; Yang, H.; Wu, A.B. Occurrence and Quantitative Risk Assessment of Twelve Mycotoxins in Eggs and Chicken Tissues in China. Toxins 2018, 10, 477. [Google Scholar] [CrossRef] [PubMed] [Green Version]
- Ochieng, P.; Croubels, S.; Kemboi, D.; Okoth, S.; De Baere, S.; Cavalier, E.; Kang’ethe, E.; Faas, J.; Doupovec, B.; Gathumbi, J.; et al. Effects of aflatoxins and fumonisins alone or in combination on performance, health and safety of food products of broiler chickens, and mitigation efficacy of bentonite and fumonisin esterase. 2023; forthcoming article. [Google Scholar]
- Ochieng, P.; Kemboi, D.; Okoth, S.; De Baere, S.; Cavalier, E.; Kangethe, E.; Faas, J.; Doupovec, B.; Gathumbi, J.; Douny, C.; et al. Aflatoxins and Fumonisins Co-Contamination Effects on Laying Chickens and Use of Mycotoxin Detoxifiers as a Mitigation Strategy. 2023; forthcoming article. [Google Scholar]
- Kemboi, D.; Antonissen, G.; Ochieng, P.; Croubels, S.; De Baere, S.; Scippo, M.-L.; Okoth, S.; Kangethe, E.; Faas, J.; Doupovec, B.; et al. Efficacy of Bentonite and Fumonisin esterase in Mitigating the Effects of Aflatoxins and Fumonisins in Two Kenyan Cattle Breeds. J. Agric. Food Chem. 2022. [Google Scholar] [CrossRef]
- U.S. Department of Health and Human Services. VICH GL49(R): Guidance for Industry. Studies to Evaluate the Metabolism and Residue Kinetics of Veterinary Drugs in Food-Producing Animals: Validation of Analytical Methods Used in Residue Depletion Studies, Revision at Step 9 for Implementation at Step 7; U.S. Department of Health and Human Services, Food and Drug Administration, Center for Veterinary Medicine: Rockvill, MD, USA, 2015. [Google Scholar]
- Matuszewski, B.K.; Constanzer, M.L.; Chavez-Eng, C.M. Strategies for the assessment of matrix effect in quantitative bioanalytical methods based on HPLC-MS/MS. Anal. Chem. 2003, 75, 3019–3030. [Google Scholar] [CrossRef] [PubMed]
- Jurišić, N.; Schwartz-Zimmermann, H.E.; Kunz-Vekiru, E.; Moll, S.D.; Schweiger, W.; Fowler, J.; Berthiller, F. Determination of Aflatoxin Biomarkers in Excreta and Ileal Content of Chickens. Poult. Sci. 2019, 98, 5551–5561. [Google Scholar] [CrossRef]
- Vidal, A.; Mengelers, M.; Yang, S.; De Saeger, S.; De Boevre, M. Mycotoxin Biomarkers of Exposure: A Comprehensive Review. Compr. Rev. Food Sci. Food Saf. 2018, 17, 1127–1155. [Google Scholar] [CrossRef] [Green Version]
- Knecht, J.; Stork, G. Percentage and logarithmic procedures for calculation of calibration curves. Fresen. Z. Anal. Chem. 1974, 270, 97–99. [Google Scholar] [CrossRef]
- European Commission. Commission Decision 2002/657/EC, implementing Council Directive 96/23/EC concerning the performances of analytical methods and interpretation of results. Off. J. Eur. Communities 2002, L221, 29. [Google Scholar]
- Heitzman, R.J. (Ed.) Veterinary Drug Residues, Report Eur. 14126-EN; Commision of the EC: Brussels, Belgium; Luxembourg, 1994. [Google Scholar]
- European Medicines Agency. EMEA/CHMP/EWP/192217/2099 Rev. 1 Corr 2**, Committee for Medicinal Products for Human Use, Guideline on Bioanalytical Method Validation, Guideline Bioanalytical Method Validation (europa.eu); European Medicines Agency: London, UK, 2015. [Google Scholar]


| Analyte | Chemical Formula | MM a (g mol−1) | Precursor Ion (m/z) b | Product Ions (m/z) | CE c (eV) | Cone (V) | Retention Time (Min) | Internal Standard |
|---|---|---|---|---|---|---|---|---|
| AFB1 | C17H12O6 | 312.27 | 313.0 [M + H]+ | 241.1 d 285.1 | 34 23 | 35 35 | 4.55 | 13C17-AFB1 |
| AFB2 | C17H14O6 | 314.29 | 315.1 [M + H]+ | 259.1 d 287.1 | 25 24 | 30 30 | 4.48 | 13C17-AFB1 |
| AFG1 | C17H12O7 | 328.27 | 329.1 [M + H]+ | 243.0 d 311.1 | 23 18 | 35 35 | 4.38 | 13C17-AFG1 |
| AFG2 | C17H14O7 | 330.29 | 331.1 [M + H]+ | 245.0 d 313.1 | 26 22 | 30 30 | 4.30 | 13C17-AFB1 |
| AFM1 | C17H12O7 | 328.27 | 328.9 [M + H]+ | 229.0 272.9 d | 35 20 | 30 30 | 4.31 | 13C17-AFM1 |
| AFM2 | C17H14O7 | 330.29 | 331.0 [M + H]+ | 285.0 313.1 d | 21 15 | 35 35 | 4.22 | 13C17-AFM1 |
| 13C17-AFB1 | 13C17H12O6 | 329.15 | 330.1 [M + H]+ | 255.1 d 301.0 | 35 28 | 20 20 | 4.55 | / |
| 13C17-AFM1 | 13C17H12O7 | 345.15 | 346.1 [M + H]+ | 273.0 288.1 d | 25 25 | 30 30 | 4.31 | / |
| 13C17-AFG1 | 13C17H12O7 | 345.15 | 346.1 [M + H]+ | 257.1 d 328.1 | 25 20 | 40 40 | 4.38 | / |
| Component | Calibration Range (ng mL−1) | a | b | gof (%) | r | LOQ (ng mL−1) | LOD (ng mL−1) |
|---|---|---|---|---|---|---|---|
| AFB1 | 0.050–200.0 | 0.852 ± 0.018 | 0.0002 ± 0.0025 | 5.7 ± 2.5 | 0.9978 ± 0.0019 | 0.050 | 0.0029 |
| AFB2 | 0.050–200.0 | 0.957 ± 0.014 | 0.0063 ± 0.0122 | 6.5 ± 2.7 | 0.9972 ± 0.0022 | 0.050 | 0.0035 |
| AFG1 | 0.050–200.0 | 0.408 ± 0.001 | 0.0088 ± 0.0135 | 5.8 ± 0.8 | 0.9980 ± 0.0006 | 0.050 | 0.0069 |
| AFG2 | 0.050–200.0 | 0.159 ± 0.010 | −0.0022 ± 0.0030 | 6.8 ± 1.4 | 0.9973 ± 0.0010 | 0.050 | 0.0193 |
| AFM1 | 0.050–200.0 | 0.540 ± 0.043 | −0.0015 ± 0.0026 | 6.6 ± 1.1 | 0.9975 ± 0.0009 | 0.050 | 0.0035 |
| AFM2 | 0.50–200 | 0.147 ± 0.026 | 0.0063 ± 0.0066 | 4.8 ± 13 | 0.9984 ± 0.0008 | 0.100 | 0.0300 |
| Component | Theoretical Concentration (ng mL−1) | Mean Concentration ± SD (ng mL−1) | Precision, RSD (%) | Accuracy (%) |
|---|---|---|---|---|
| AFB1 | 0.050 a | 0.040 ± 0.004 | 10.2 | −20.9 |
| 0.050 b | 0.044 ± 0.006 | 12.7 | −11.6 | |
| 0.50 a | 0.49 ± 0.02 | 3.8 | −1.6 | |
| 0.50 b | 0.51 ± 0.05 | 10.1 | 1.9 | |
| 5.00 a | 5.26 ± 0.12 | 2.3 | 5.1 | |
| 5.00 b | 5.10 ± 0.33 | 6.4 | 2.0 | |
| 50.0 a | 44.0 ± 1.4 | 3.2 | −12.1 | |
| 50.0 b | 45.9 ± 3.3 | 7.2 | −8.1 | |
| AFB2 | 0.050 a | 0.056 ± 0.005 | 8.7 | 10.9 |
| 0.050 b | 0.041 ± 0.008 | 18.6 | −17.9 | |
| 0.50 a | 0.54 ± 0.02 | 3.9 | 7.5 | |
| 0.50 b | 0.50 ± 0.07 | 13.3 | 0.5 | |
| 5.00 a | 5.32 ± 0.25 | 4.7 | 6.4 | |
| 5.00 b | 4.95 ± 0.43 | 8.7 | −1.1 | |
| 50.0 a | 50.1 ± 1.2 | 2.4 | 0.2 | |
| 50.0 b | 50.6 ± 3.5 | 6.9 | 1.2 | |
| AFG1 | 0.050 a | 0.054 ± 0.009 | 16.3 | 7.3 |
| 0.050 b | 0.051 ± 0.015 | 30.4 | 1.8 | |
| 0.50 a | 0.50 ± 0.01 | 2.1 | −0.6 | |
| 0.50 b | 0.53 ± 0.07 | 13.0 | 6.2 | |
| 5.00 a | 4.88 ± 0.14 | 3.0 | −2.4 | |
| 5.00 b | 5.20 ± 0.68 | 13.0 | 4.1 | |
| 50.0 a | 48.2 ± 1.8 | 3.7 | −3.6 | |
| 50.0 b | 48.3 ± 2.2 | 4.5 | −3.4 | |
| AFG2 | 0.050 a | 0.037 ± 0.008 | 22.1 | −25.2 |
| 0.050 b | 0.048 ± 0.015 | 30.2 | −3.7 | |
| 0.50 a | 0.48 ± 0.01 | 3.1 | −4.9 | |
| 0.50 b | 0.51 ± 0.10 | 20.4 | 1.4 | |
| 5.00 a | 4.54 ± 0.31 | 6.8 | −9.2 | |
| 5.00 b | 4.98 ± 0.40 | 8.0 | −0.4 | |
| 50.0 a | 51.8 ± 2.5 | 4.8 | 3.6 | |
| 50.0 b | 50.8 ± 3.4 | 6.8 | 1.5 | |
| AFM1 | 0.050 a | 0.055 ± 0.003 | 6.2 | 9.0 |
| 0.050 b | 0.042 ± 0.008 | 19.4 | −15.6 | |
| 0.50 a | 0.51 ± 0.01 | 2.3 | 1.3 | |
| 0.50 b | 0.52 ± 0.10 | 18.5 | 4.4 | |
| 5.00 a | 4.95 ± 0.16 | 3.2 | −1.0 | |
| 5.00 b | 5.04 ± 0.31 | 6.1 | 0.8 | |
| 50.0 a | 49.6 ± 0.9 | 1.7 | −0.9 | |
| 50.0 b | 50.3 ± 6.4 | 12.8 | 0.7 | |
| AFM2 | 0.50 a | 0.55 ± 0.06 | 11.3 | 9.1 |
| 0.50 b | 0.49 ± 0.06 | 12.0 | −1.7 | |
| 5.00 a | 4.61 ± 0.10 | 2.2 | −7.8 | |
| 5.00 b | 4.75 ± 0.15 | 3.2 | −5.0 |
| Matrix | AFB1 | AFB2 | AFG1 | AFG2 | AFM1 | AFM2 |
|---|---|---|---|---|---|---|
| Analyte Concentration (µg kg−1) | ||||||
| Plasma (n = 8) | 0.063 ± 0.073 | ND | ND | ND | <LOQ | ND |
| Liver (n = 8) | 0.474 ± 0.210 | ND | <LOD | <LOD | <LOQ | <LOQ |
| Muscle (n = 8) | ND | ND | ND | ND | ND | ND |
| Egg (n = 8) | 0.039 ± 0.018 | <LOD | <LOD | ND | <LOQ | <LOD |
| Matrix | Component | Treatment Group | |||
|---|---|---|---|---|---|
| Control | AF | BEN | AF + BEN | ||
| Analyte Concentration (µg kg−1) | |||||
| Milk | AFB1 | ND | 0.068 ± 0.038 | ND | <LOQ |
| AFB2 | ND | <LOQ | ND | <LOQ | |
| AFM1 | 0.039 ± 0.025 | 0.862 ± 0.406 | <LOQ | 0.602 ± 0.309 | |
| AFM2 | <LOQ | ND | ND | <LOD | |
| AFG1 | ND | ND | ND | <LOQ | |
| AFG2 | ND | ND | ND | <LOQ | |
| Plasma | AFB1 | <LOD | 0.028 ± 0.014 | <LOQ | <LOQ |
| AFB2 | ND | ND | ND | ND | |
| AFM1 | <LOQ | 0.040 ± 0.018 | <LOQ | 0.026 ± 0.022 | |
| AFM2 | ND | ND | ND | ND | |
| AFG1 | <LOQ | <LOQ | <LOQ | <LOQ | |
| AFG2 | ND | ND | ND | ND | |
| Rumen fluid | AFB1 | <LOD | 0.337 ± 0.177 | <LOD | 0.369 ± 0.265 |
| AFB2 | <LOD | <LOQ | <LOD | <LOQ | |
| AFM1 | ND | <LOQ | ND | <LOQ | |
| AFM2 | <LOD | ND | <LOD | ND | |
| AFG1 | ND | ND | ND | ND | |
| AFG2 | ND | ND | ND | ND | |
Disclaimer/Publisher’s Note: The statements, opinions and data contained in all publications are solely those of the individual author(s) and contributor(s) and not of MDPI and/or the editor(s). MDPI and/or the editor(s) disclaim responsibility for any injury to people or property resulting from any ideas, methods, instructions or products referred to in the content. |
© 2023 by the authors. Licensee MDPI, Basel, Switzerland. This article is an open access article distributed under the terms and conditions of the Creative Commons Attribution (CC BY) license (https://creativecommons.org/licenses/by/4.0/).
Share and Cite
De Baere, S.; Ochieng, P.E.; Kemboi, D.C.; Scippo, M.-L.; Okoth, S.; Lindahl, J.F.; Gathumbi, J.K.; Antonissen, G.; Croubels, S. Development of High-Throughput Sample Preparation Procedures for the Quantitative Determination of Aflatoxins in Biological Matrices of Chickens and Cattle Using UHPLC-MS/MS. Toxins 2023, 15, 37. https://doi.org/10.3390/toxins15010037
De Baere S, Ochieng PE, Kemboi DC, Scippo M-L, Okoth S, Lindahl JF, Gathumbi JK, Antonissen G, Croubels S. Development of High-Throughput Sample Preparation Procedures for the Quantitative Determination of Aflatoxins in Biological Matrices of Chickens and Cattle Using UHPLC-MS/MS. Toxins. 2023; 15(1):37. https://doi.org/10.3390/toxins15010037
Chicago/Turabian StyleDe Baere, Siegrid, Phillis E. Ochieng, David C. Kemboi, Marie-Louise Scippo, Sheila Okoth, Johanna F. Lindahl, James K. Gathumbi, Gunther Antonissen, and Siska Croubels. 2023. "Development of High-Throughput Sample Preparation Procedures for the Quantitative Determination of Aflatoxins in Biological Matrices of Chickens and Cattle Using UHPLC-MS/MS" Toxins 15, no. 1: 37. https://doi.org/10.3390/toxins15010037