
A 3D Agent-Based Model of Lung Fibrosis


1
Institute for Condensed Matter Physics, Technische Universität Darmstadt, 64289 Darmstadt, Germany
2
Department of Computer Science, University of Surrey, Guildford GU2 7XH, UK
3
Biophysics Department, GSI Helmholtzzentrum für Schwerionenforschung GmbH, 64291 Darmstadt, Germany
*
Author to whom correspondence should be addressed.
Symmetry 2022, 14(1), 90; https://doi.org/10.3390/sym14010090
Submission received: 29 November 2021
/
Revised: 30 December 2021
/
Accepted: 3 January 2022
/
Published: 6 January 2022
(This article belongs to the Special Issue Networks in Cancer: From Symmetry Breaking to Targeted Therapy)
Abstract
:Understanding the pathophysiology of lung fibrosis is of paramount importance to elaborate targeted and effective therapies. As it onsets, the randomly accumulating extracellular matrix (ECM) breaks the symmetry of the branching lung structure. Interestingly, similar pathways have been reported for both idiopathic pulmonary fibrosis and radiation-induced lung fibrosis (RILF). Individuals suffering from the disease, the worldwide incidence of which is growing, have poor prognosis and a short mean survival time. In this context, mathematical and computational models have the potential to shed light on key underlying pathological mechanisms, shorten the time needed for clinical trials, parallelize hypotheses testing, and improve personalized drug development. Agent-based modeling (ABM) has proven to be a reliable and versatile simulation tool, whose features make it a good candidate for recapitulating emergent behaviors in heterogeneous systems, such as those found at multiple scales in the human body. In this paper, we detail the implementation of a 3D agent-based model of lung fibrosis using a novel simulation platform, namely, BioDynaMo, and prove that it can qualitatively and quantitatively reproduce published results. Furthermore, we provide additional insights on late-fibrosis patterns through ECM density distribution histograms. The model recapitulates key intercellular mechanisms, while cell numbers and types are embodied by alveolar segments that act as agents and are spatially arranged by a custom algorithm. Finally, our model may hold potential for future applications in the context of lung disorders, ranging from RILF (by implementing radiation-induced cell damage mechanisms) to COVID-19 and inflammatory diseases (such as asthma or chronic obstructive pulmonary disease).
1. Introduction
Lung fibrosis is characterized by the progressive aberrant accumulation of extracellular matrix (ECM) accompanied by the depletion of healthy epithelial tissue, which eventually result in poor gas exchange, increased lung stiffness, and death [1]. Despite having an idiopathic origin in most of the cases (referred to as idiopathic pulmonary fibrosis, IPF), radiation-induced lung fibrosis (RILF) is commonly observed in cancer patients treated with thoracic ionizing radiation, representing the major dose-limiting factor [2]. Regardless of the damage source, similar pathways have been identified in the pathophysiology of both IPF and RILF [3].
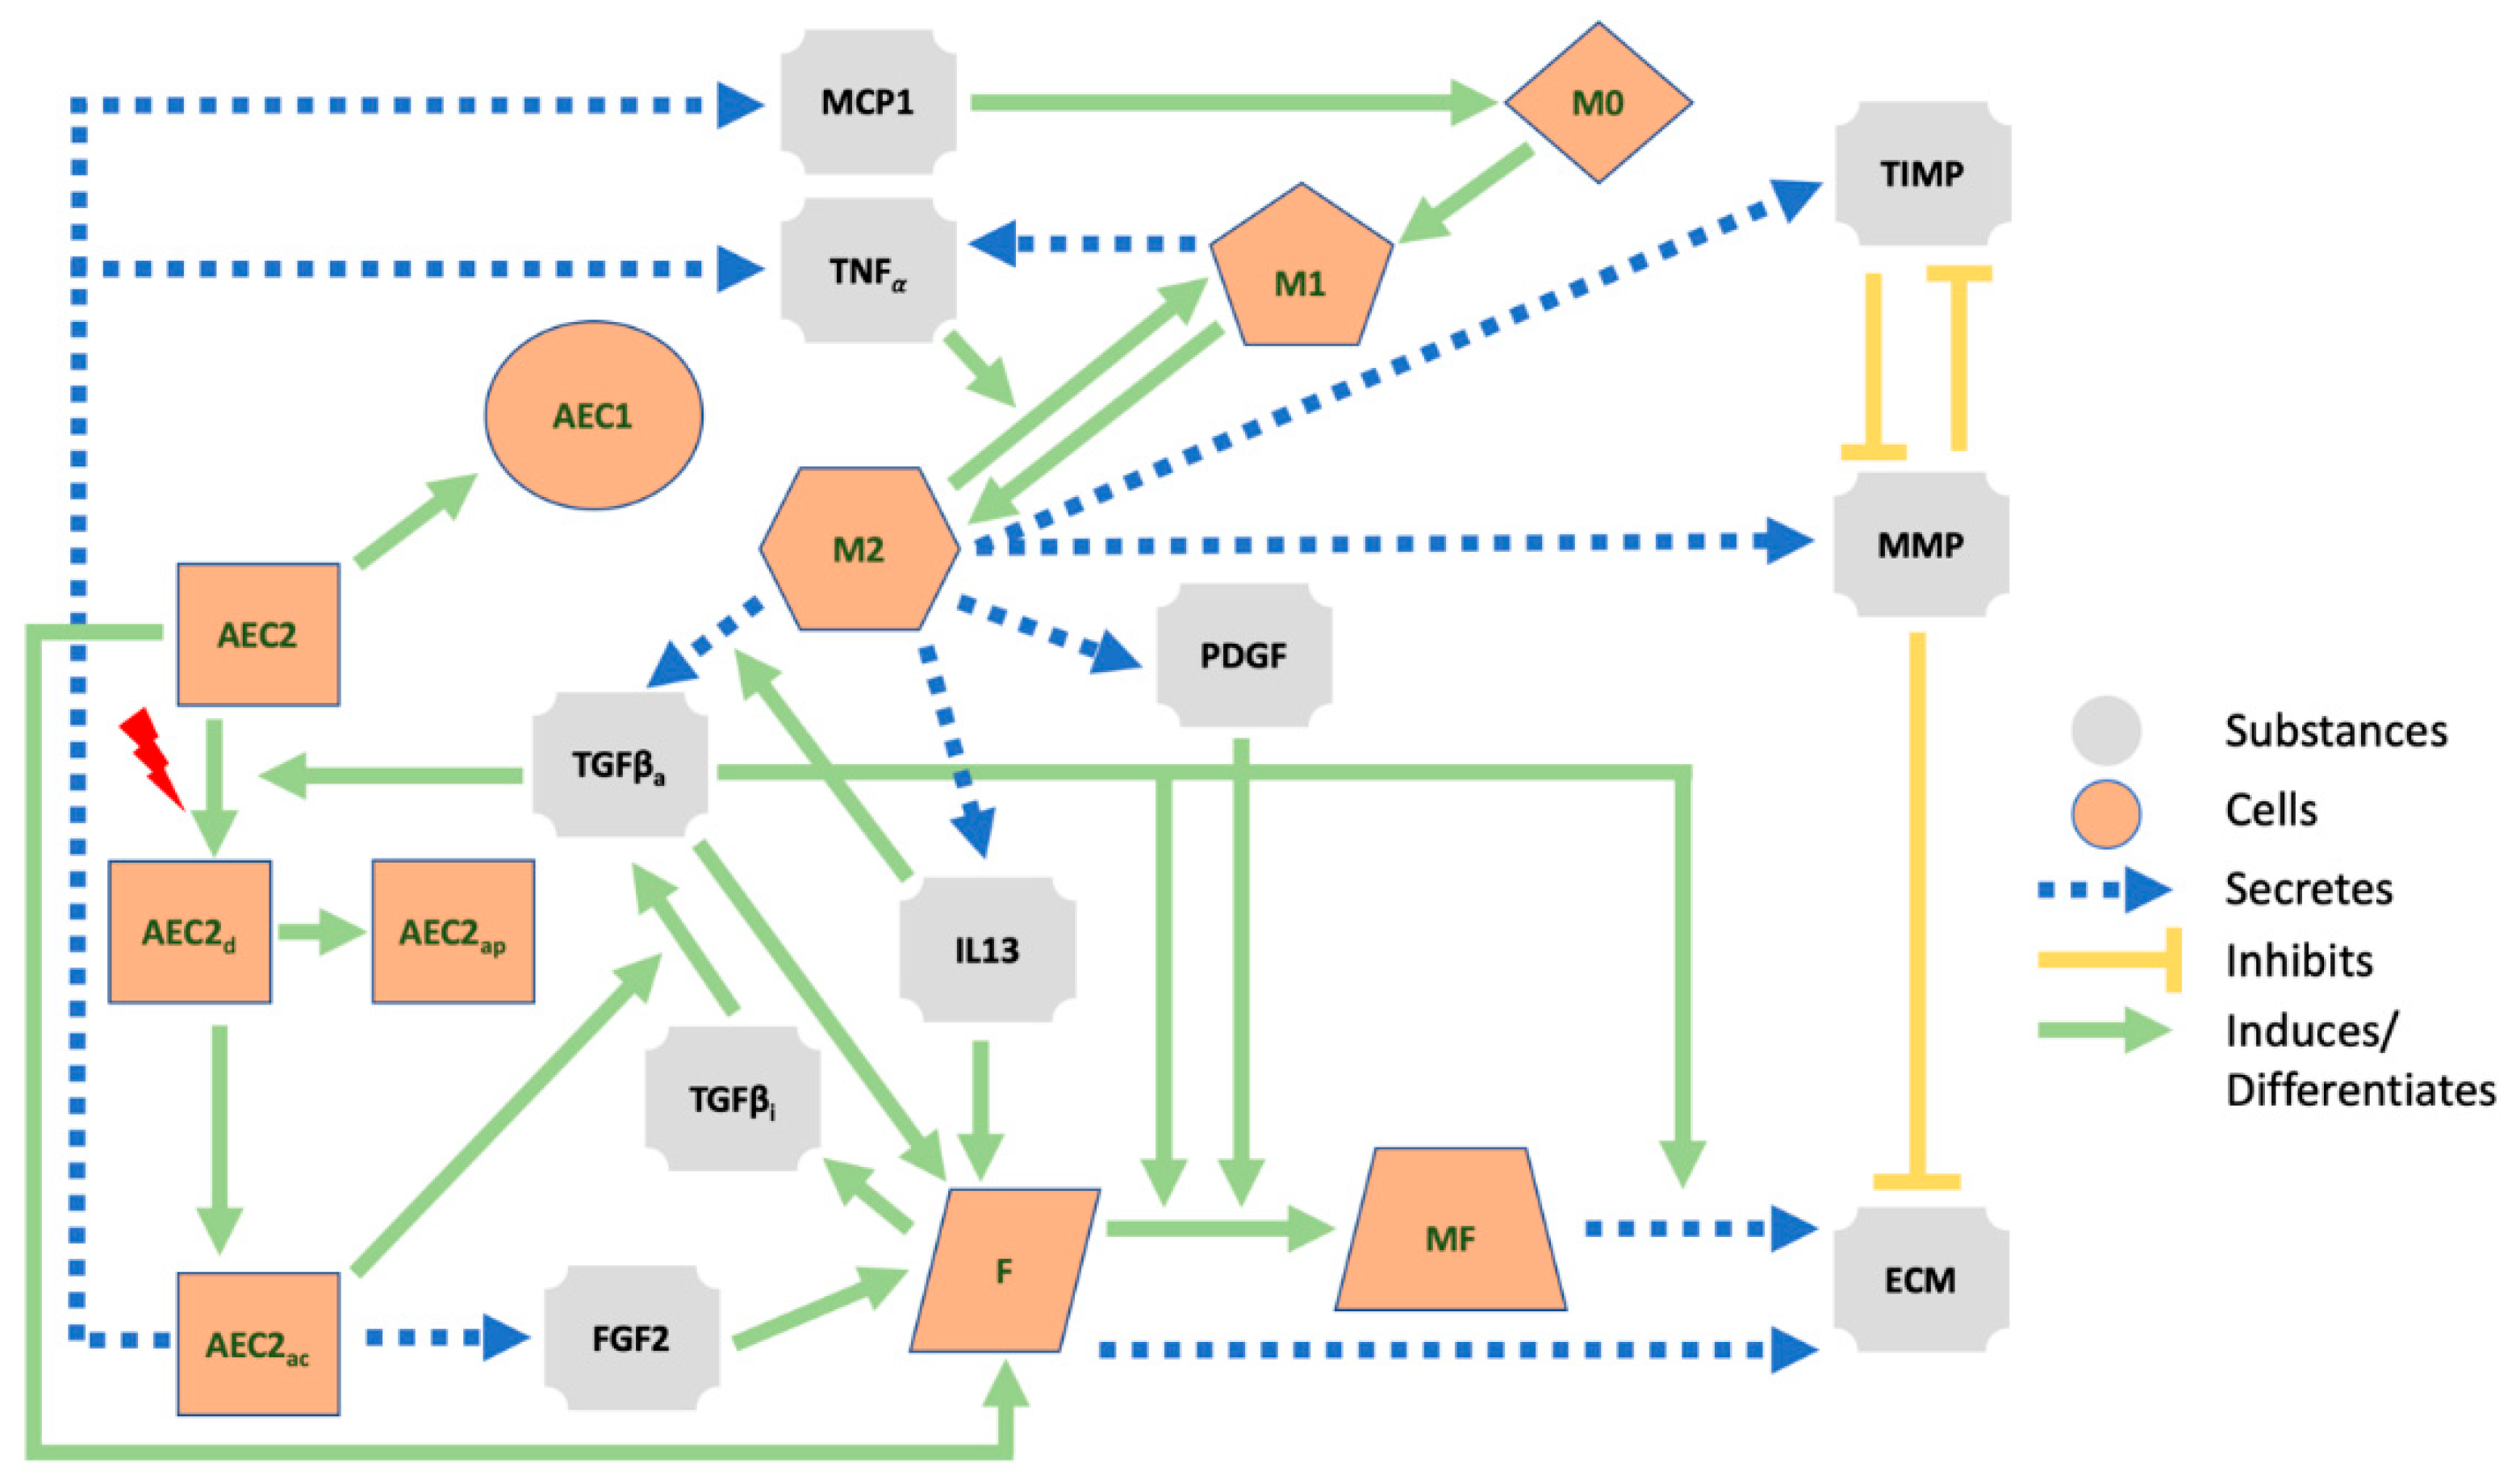
Fibrosis is thought to originate from the lung parenchyma, where more than 300 million alveoli, functional units responsible for gas exchange, reside [1,4,5]. The alveolar epithelium, which includes alveolar epithelial cells of types I (AECI, the actual gas exchanger) and II (AECII, stem cells responsible for the preservation of the epithelium) [6], can aberrantly react to injury and trigger inflammatory responses [7,8,9,10] (see Figure 1). When damaged AECII are unable to repair properly, they can either undergo apoptosis or activate and adopt a senescent phenotype [11]. If the latter occurs, AECII cells lose their progenitor capability (thus leading to AECI depletion) and release proinflammatory and profibrotic factors through the acquisition of a senescence-associated secretory phenotype (SASP) [3,10]. The deterioration of the epithelial membrane, along with the release of cytokines and chemokines, such as the tumor necrosis factor, TNFα, and the monocyte chemoattractant protein 1, MCP1 or CCL2, activates the Th1 immune response and allows monocyte-derived macrophages (M0, which later differentiate into classically activated or type I macrophages, M1) to breach into the alveolus [3,5]. M1 macrophages can then differentiate into their alternatively activated form, M2, and represent an additional source of TNFα, which is able to reverse the transition [12]. M2 macrophages, in turn, secrete a plethora of mediators (including the active form of the transforming growth factor beta, TGFβa [13,14], platelet-derived growth factor, PDGF [15], interleukin 13, IL13 [16], matrix metalloproteinases, MMP [17], and tissue inhibitors of metalloproteinases, TIMPs [17] which affect several cellular species. Among these, fibroblasts are mesenchymal cells that secrete inactive TGFβ (TGFβi) [18], the ECM [19], and are able to differentiate into myofibroblasts. The ECM is degraded by the MMP, whose effect is inhibited by TIMP [20]. TGFβ (which can be activated by damaged AEC2 [21] and whose secretion by M2 is amplified by IL13 [22]), in its active form, increases the proliferation of fibroblasts [23], stimulates their differentiation into myofibroblasts [24], and damages healthy AEC2 cells [25]. IL13 further enhances the proliferation of fibroblasts [26] together with the basic fibroblast growth factor (bFGF or FGF2) secreted by the AEC2 [27,28], while PDGF triggers the differentiation of the fibroblasts [29]. Myofibroblasts deposit additional ECM [30] (a mechanism intensified by TGFβ [31]) and have a pivotal role in the remodeling process that takes place in the alveolar region. The population of mesenchymal cells can be further expanded through the epithelial–mesenchymal transition (EMT), a process by which activated AEC2 differentiate into fibroblasts and/or myofibroblasts [32]. The overall effect is an increase in the number of ECM-secreting cells that leads to the abnormal accumulation of the ECM.
Although the chain of events presented in Figure 1 above highlights a causal link between the lung damage and the fibrosis onset, it only unfolds the backbone of a disease that is far from being fully understood [3]. The motivation to elucidate this link stems from multiple factors, including the lack of animal models that thoroughly reflect the human complexity and the time needed for the fibrosis to fully develop [33]. In light of these considerations, in-silico or computational models represent invaluable tools towards a better understanding of complex biological (among others) systems [34] and hold the potential for several clinical applications. In fact, at present, high-performance computers allow us to simulate experiments at a fast pace, with moderate costs and without the need for laboratories. In-silico modeling is nowadays applied in clinically relevant research, whose applications include, but are not limited to, drug design, clinical decision making, treatment optimization, and personalized medicine [35]. Computational models lay the foundations for personalized medicine and drug development: the parameters of a validated disease model can be calibrated to reflect patients-specific conditions and the simulation outputs employed to elaborate tailored therapies. Moreover, computational models are powerful tools for addressing a various number of diseases on multiple scales, ranging from the subcellular to the global, as recently shown for COVID-19 [36,37]. The use of the aforementioned models in biomedical frameworks has a well-defined pattern: the theoretical prototype is originally built on the basis of available in-vitro and/or in-vivo data and implemented in-silico; the model is then used to simulate existing data and altered until a good match between in-silico and laboratory data is observed; finally, in-silico models are used to predict new data for clinical studies [34].
Equation-based modeling and agent-based modeling are common and powerful approaches when it comes to implementing computational models, with the choice being mainly affected by the spatiotemporal scales of the simulated phenomenon [38]. On the one hand, equation-based models (EBMs) assume homogenous populations and consist of sets of ordinary or partial differential equations (ODEs or PDEs) that are evaluated at every time step and location [39,40]. On the other hand, heterogeneities among entities of the same species (i.e., randomness) in the simulation space can be recapitulated by agent-based models (ABM) in which interacting individual agents behave according to a set of rules [41,42]. While EBMs are better suited for fast time scales and small spatial scales (e.g., to represent diffusing molecules), ABMs can properly reproduce larger systems (such as cells and tissues) at slower time scales, with a special emphasis on agent–agent and agent–environment interactions [38]. Finally, hybrid agent-based models combine the methodologies described above by making extensive use of synchronization techniques and data feeding from one system to the other so that broader scenarios can be reproduced [42].
In this paper, we outline the implementation of a hybrid ABM of lung fibrosis by means of an innovative software simulation platform (namely, BioDynaMo [43]) and show that it has the potential to reproduce results from other studies. Key mechanisms extracted from reviewed literature are encoded into simple sets of rules and used to define the behaviors of the agents. Moreover, we include chemical mediators that diffuse through the extracellular space and allow for long- and short-range inter-agent interactions. We began by calibrating the parameters of our model in order to reproduce the homeostatic conditions of the distal lungs. When the homeostasis was established, we introduced damage sources of various intensities and stored the model’s readouts as the symmetry of the system was broken.
The goal of the present study is the development of a solid and up-to-date model to be later on employed as a research tool and further expanded with additional layers to suit specific use-cases. Both EBMs and ABMs of lung fibrosis can already be found in the literature [44,45,46,47,48], but while the use of the mean field approach in the former limits their ability to recapitulate the heterogeneous nature of the biological systems, the latter are typically implemented on small 2D spatial scales, the simulated time frames are short, and both the number of cells and geometrical structures do not reflect the features of the lungs. Our model seeks to overcome the major limitations of the previous models.
2. Materials and Methods
In the following sections, the implementation of our hybrid multi-agent-based model is detailed. More specifically, we (i) present the geometry and features of the simulation environment motivated by its morphological counterpart, (ii) describe how the diffusion and interaction of substances are implemented, and (iii) outline how agent behaviors are derived from previous works and the related parameters tuned.
2.1. Framework and Implementation
The simulation model is implemented with BioDynaMo 1.0 [43], an open-source software simulation platform that allows users to build and run multi-scale simulations. The elements of the simulation, i.e., the simulation space, the entities inside it, and the interaction rules, are encoded in the C++ language and simulations can be carried out on common laptops, even with limited computational resources, or cluster nodes. The source code for the model can be found in the supplementary material, while installation instructions for BioDynaMo are available at https://biodynamo.org/docs/userguide/ (accessed on 20 November 2021).
In BioDynaMo, discrete time is marked by simulation time steps (whose length can be defined by the user) and agents are instances of the Agent class. Variability between agents from different populations can be emphasized by defining custom attributes, which altogether define the state of an agent, whereas agent–agent and agent–environment interaction rules are wrapped in behaviors. Behaviors, in turn, are executed for each agent at every time step when certain conditions are satisfied. In addition, changes in the state of each agent, i.e., in one or more of its attributes, can be automatically stored during the simulation and made available for a subsequent graphical visualization of the simulation. Finally, standalone operations, executed once per time step (see [43] for more details), can be defined and used, for example, to gather data throughout the simulation (see Section 2.5).
Python 3.9 (more specifically the libraries SciPy, MatPlotLib, NumPy and ROOT) is used to gather and plot the outputs of different simulations.
Our simulations are performed on
- a MacBook Pro 2018 running macOS Big Sur on a 2.3 GHz Quad-Core Intel Core i5 processor with 8 GB RAM;
- a compute node of the Lichtenberg HPC system running CentOS 8.2 on 2x 2.3 GHz Intel Cascade-Lake AP 48-cores processor (96 total cores) with 384 GB RAM.
2.2. Building the Simulation Space
Human and mammary airways can be split in two subsystems: the proximal, ending with the terminal bronchioles, where conducting airways move air inside and outside the body, and the distal/peripheral, where the actual oxygen exchange takes place in the acinar airways [4]. Within the latter, further morphological structures can be distinguished: some 30,000 acini branch by irregular dichotomy for 8–9 generations, terminating with alveolar sacs. The non-terminal segments that make up the branches of an acinus are the alveolar ducts (256 per acinus on average [4]), onto which clusters of alveoli with common openings towards the lumen are localized (the same holds for alveolar sacs). Previous work has reported an average length of 730 µm and an average outer diameter of 600–699 µm for the alveolar ducts, which can be seen as hollow cylinders [49,50]. Given that the most common shape of a human alveolus is a three-quarter sphere [51] with an average diameter of 260 µm [52], we estimate that each duct should serve between 18 and 24 alveoli, arranged in 3 rings of 6–8 alveoli each [53] (a slightly larger value can be found from the ratio between the total number of alveoli and the total number of segments).
Our model aims to mechanistically replicate the onset of lung fibrosis on a scale bigger than the cellular one as the disease affects large portions of the pulmonary tissue. For this reason, we build our simulation space as a dichotomic tree structure (see Figure 2) that mimics a part of an acinus and choose the alveolar segments as agents. The tree expands along the z-axis in the 3D simulation space and each segment has the same length (that is, the average segment length from [49,50]), expressed in µm. Since the average segment length and outer diameter are similar, we replace the segments with the corresponding inscribed spheres (spherical-shaped agents are included in the BioDynaMo platform). The algorithm that we implement to build the structure is the following:
- Given the number of generations Ngen, define the number of segments as Nseg = 2Ngen − 1, the average segment length as avgSegLength, and the vector containing the coordinates of all the agents as Coords.
- Set the coordinates of the agent 0 (the first alveolar segment) to {0., 0., 0.} (i.e., the center of the simulation space), its unique index to 0, its origin to {0., 0., −avgSegLength/2}, and its end to {0., 0., avgSegLength/2}. Add {0., 0., 0.} to Coords.
- Loop (Nseg/2) times. At each step (starting from 1):
- a.
- Define the index of the father agent (i.e., the one from which branch 1 and branch 2 stem) as father = [(step + 1)/2] − 1.
- b.
- Project the coordinates of the father agent along its axis by avgSegLength.
- c.
- For each of the two new branches:
- i.
- Generate random polar and azimuthal angles θ and φ.
- ii.
- Rotate the projected father agent by θ and φ, keeping its origin fixed.
- iii.
- If the branch doesn’t overlap with the other agents already in the tree add its coordinates to Coords.
- iv.
- If the branch overlaps with any of the other agents already in the tree, go back to step i.
- Write Coords to a file, so that it can be used for multiple simulations.
Specifically, our tree branches at random angles for 7 generations and includes a total of 127 alveolar ducts, which fit inside a simulation volume of 10,000 µm3 (or 1 cm3). The ranges that we choose for θ and φ are [20°, 160°] and [45°, 89°], respectively, and are the smallest that allow the tree to fully develop without overlaps. Since the alveolar ducts could be further decomposed into multiple agents (i.e., the alveoli) made up of subagents (i.e., the cells, [54]), the agents in our model can be seen as meta-agents.
2.3. Extracellular Mediators
As mentioned above, we implement an hybrid agent-based model, which is a model that encompasses both entities, called agents and fluids, that can diffuse through the simulation volume. More specifically, we include in our simulations extracellular mediators that affect the agents’ environment. Mediators follow the general diffusion equation
where is the concentration of the mediator, is the isotropic diffusion coefficient, S is the source term (the cell secretion in our model), and is the decay coefficient. The given coefficients (see Table 1) are specified at the beginning of a simulation for each substance together with the initial concentrations, which we set to be flat across the whole simulation space.
In order to solve the partial differential equations (PDEs) in the form of Equation (1) for each of the substances, BioDynaMo implements multiple resolution schemes (we adopt the central difference method). To this end, both space and time are discretized: the diffusion grids (defined for each substance) split the simulation volume into evenly-spaced 3D boxes (whose size can be defined by the user), while a constant global defines the size of a time step. At each time step, the discretized concentration of each substance is updated within each box.
In our model, we set the resolution (that is, the number of diffusion grid boxes along each dimension) to 10 for each substance so that (i) the Courant-Friedrichs-Lewy (CFL) stability condition for the PDE solver is fulfilled (a necessary condition for the explicit version of the central finite difference method) and (ii) each box (with volume 1000 µm3) can enclose an agent (with diameter 700 µm). Moreover, we select the scheme “DiffuseWithOpenEdge” to make BioDynaMo run our simulations with open boundaries.
In order to support interactions among different substances (which are needed by our model as it simulates ECM and TIMP depletion by MMP and MMP depletion by TIMP), we extended BioDynaMo by implementing this feature in the diffusion source code. Specifically, we edited
- the function used to define substances at the beginning of a simulation so that both the depleting substance and the binding coefficient can be specified;
- the function that implements the central difference method by embedding the local depletion (i.e., , where is the binding coefficient and is the concentration of the depleting substance in the i-th box where the calculation is performed) into the decay term.
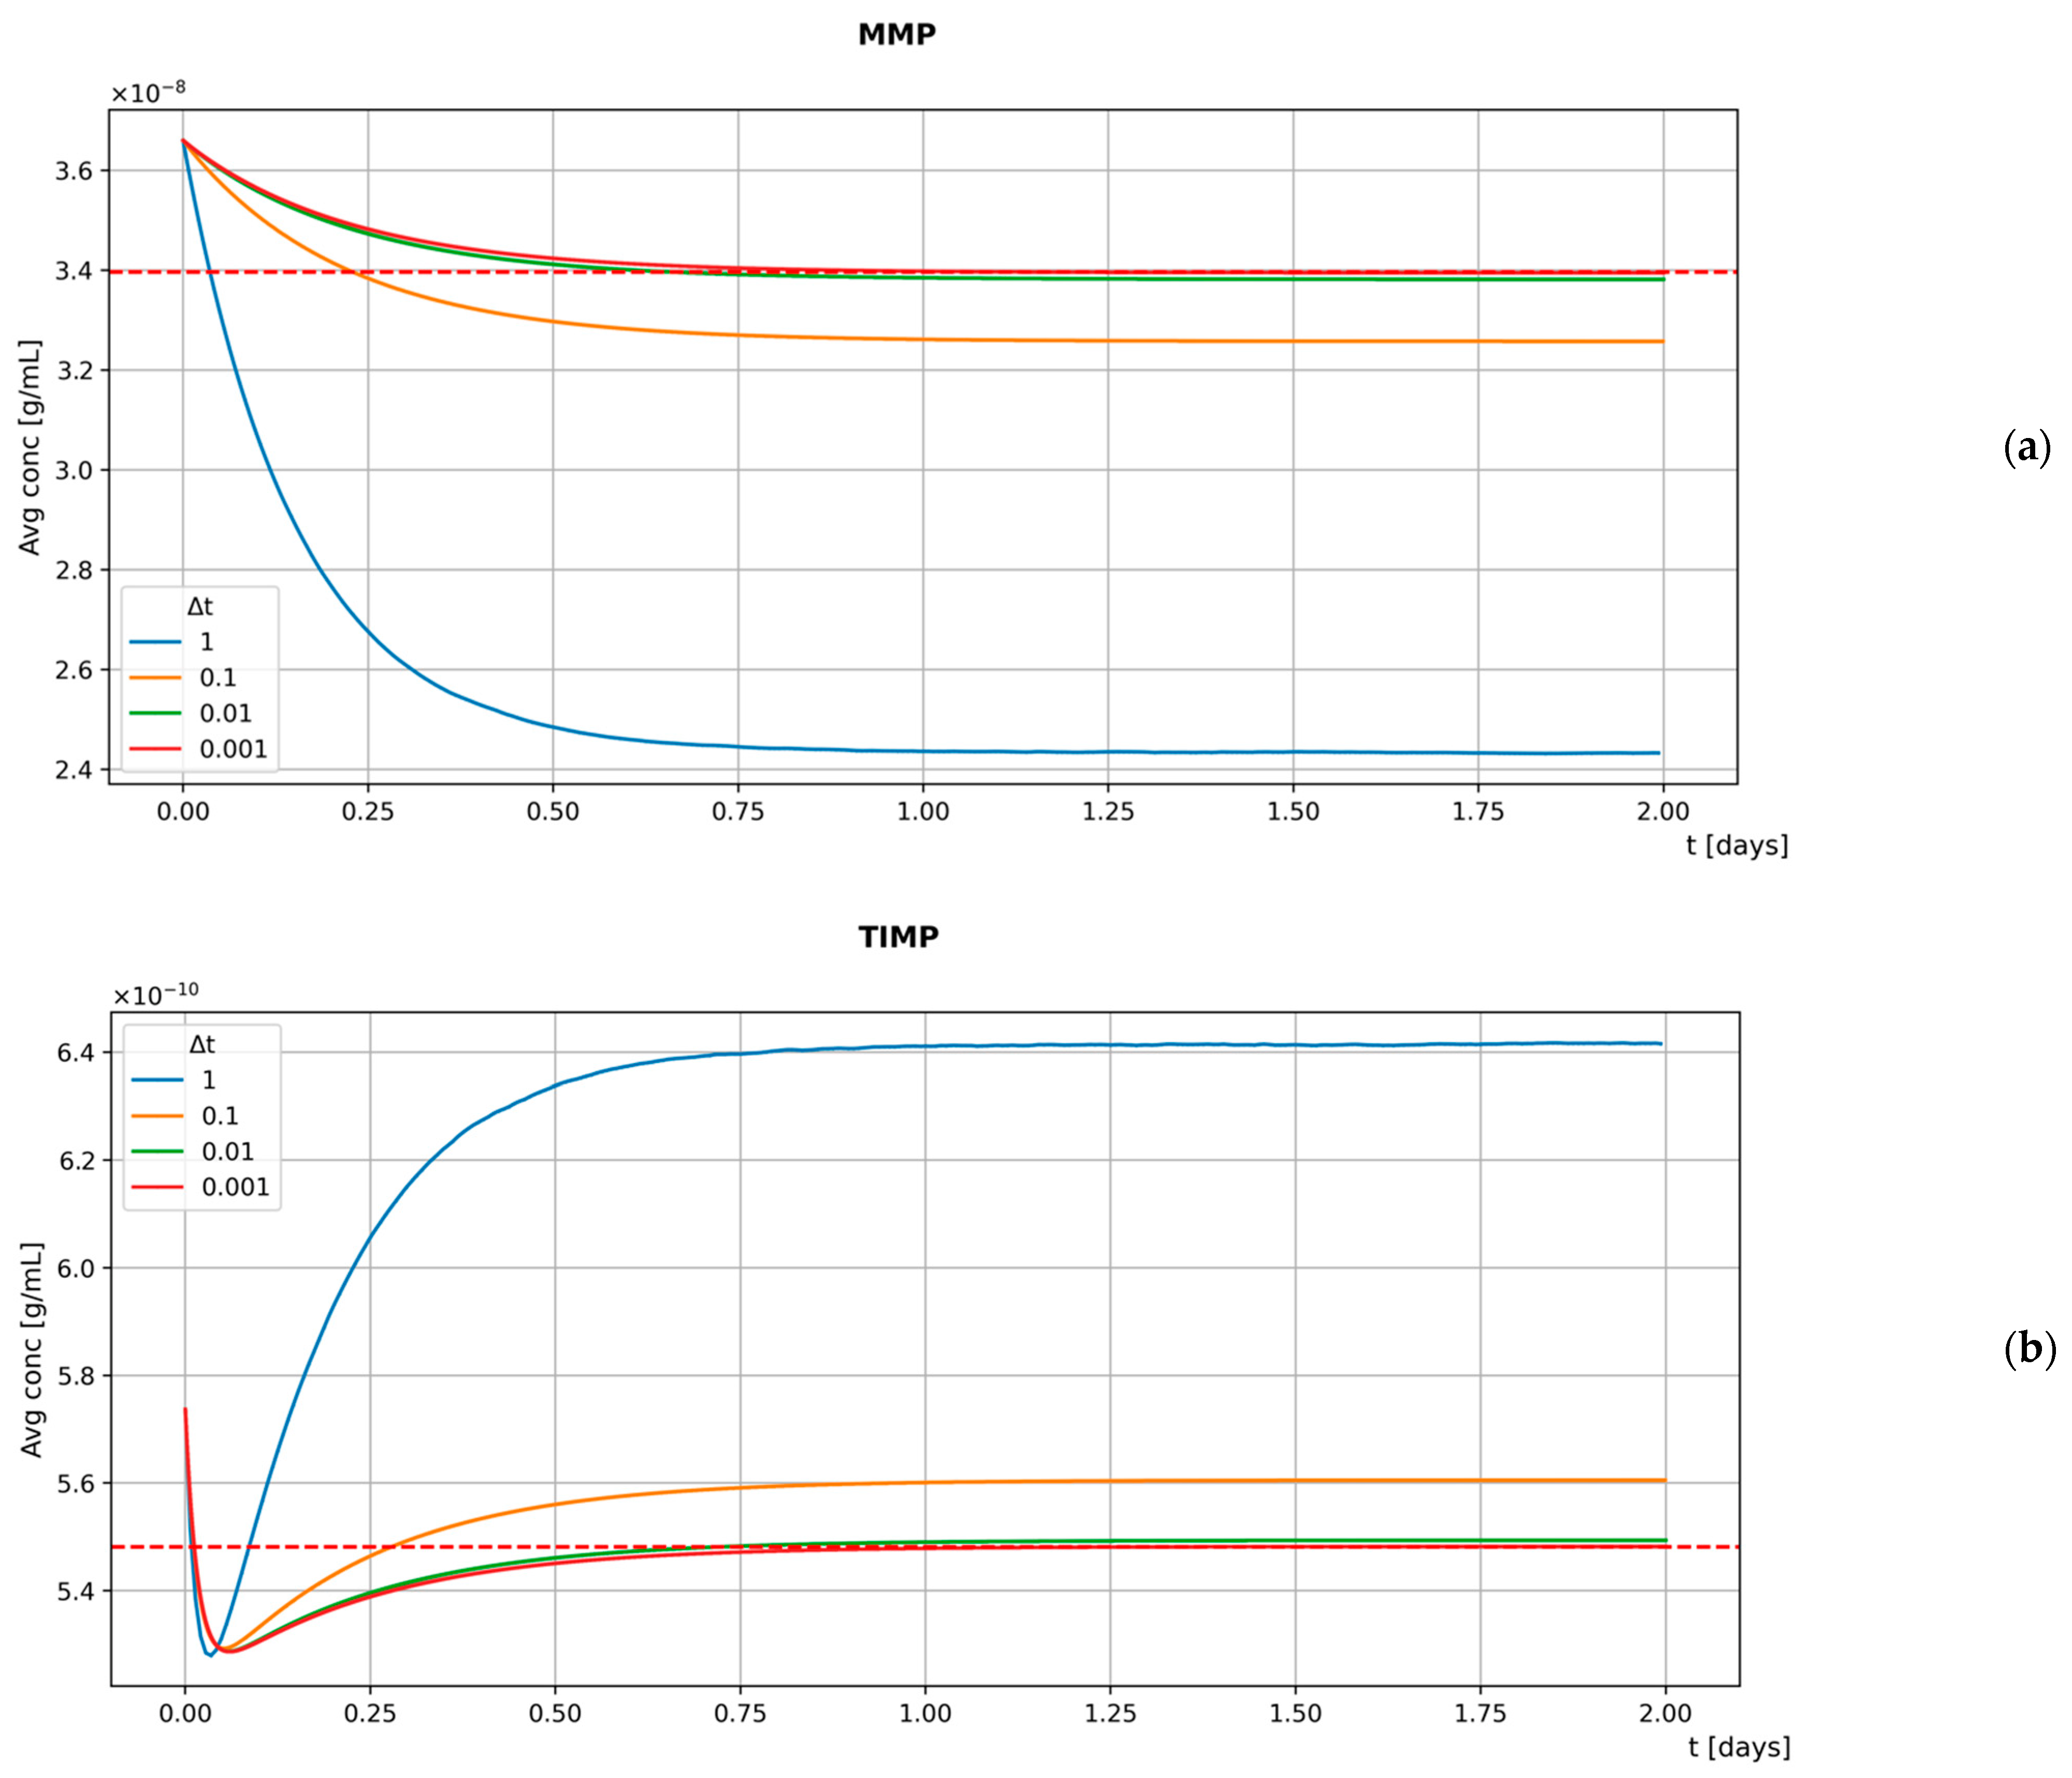
To assess whether our custom BioDynaMo is able to properly simulate interactions among different substances, we develop a basic model involving MMP and TIMP. The mediators are secreted by stationary agents located at the center of the diffusion grid boxes, with one agent per box. Our model is then used to simulate the diffusion and interaction of the substances for a time frame of 2 days with different values: 1 s, 0.1 s, 0.01 s, 0.001 s. As expected, the results presented in Figure 3 show a negative correlation between the size of the time step and the accuracy of the model. In fact, smaller values lead to greater agreement between the steady-state reached by the model and the theoretical results (represented by the dashed red line).
However, as decreases, the time needed to simulate the same time frame increases linearly. Therefore, we select 0.1 s (the default value provided by BioDynaMo is 1 s) as the best compromise between model accuracy and computational costs (note that the CFL stability condition for the PDE solver is still fulfilled after this choice). Further evidence on the robustness of our model to changes in is provided in Figure S2.
2.4. Hybrid Multi-Agent-Based Model
To build our hybrid multi-agent-based model, we follow the bottom-up approach: we gather observations found in the literature, then use this data to define the properties and behaviors on the microscale (i.e., on the agent level) and finally observe where these lead to on the macroscale. At any given time t, an agent is fully defined by the set of all its attributes that together determine its state. To specify the attributes of our agents and the interfaces to read and write them, we implement the class alveolarDuct, which extends the BioDynaMo Cell class. Each agent in our simulations is therefore an instance of alveolarDuct, whose data members store the initial and current number of cells for each cell type (see Table 2). Essential data members such as the cell position and diameter, as well as the methods to access them, are inherited from the base class Cell.
As soon as a new agent is added to the simulation, it gets assigned its behaviors. Computationally, this involves defining a list of sequential operations (examples can be found in Figure 1B from [43]), encapsulating them in a named structure, and, finally, adding the structure to a vector of behaviors that is attached to the agent. After a time step (the same used for the update of the concentration of the extracellular substances), each agent runs through all its behaviors; that is, it performs all the actions listed in each of them. Since all the agents in our simulations are alveolar ducts, they run the same behaviors at each time step. Nevertheless, since many behaviors depend on the local concentration of the mediators and different agents perceive different microenvironments, they evolve and act differently throughout the simulation.
The behaviors implemented in our model can be categorized, as shown in Table 3. As mentioned above, the behaviors share the same template but differ in the core section, which defines the actions that the agents must perform. Their implementation within the ABM is heavily influenced by the model of idiopathic pulmonary fibrosis, published in [48] as a mathematical formulation, where many aspects of the IPF are provided. Unless otherwise stated, concentration-dependent rates follow Michaelis-Menten kinetics
where represents the maximum value of the rate, is the local concentration of an extracellular substance, and is the concentration at which the rate reaches half of its maximum value. Agents can directly measure the local concentration (i.e., that of the diffusion box they are located in) of a substance at each time step and use this quantity to determine the variable rates of their behaviors. These measurements must be repeated at every time step as the extracellular environment evolves throughout the simulation.
The following subsections briefly outline each behavior.
2.4.1. Secretion Behaviors
Agents change the local concentration of a substance according to specific secretion rates. Given that the rates are known only for the initial number of cells, agents scale the rates with the current number of cells at every time step. Since each agent only keeps track of its own current number of cells (a property of the alveolar duct agents), the principle of local information exchange is not violated.
- PDGF/MMP/TIMP/IL13 secretion by M2, TNFα secretion by M1, TNFα/MCP1 secretion by active AEC2 (whose activation process is described in Section 2.4.4), and TGFβ secretion by fibroblasts have similar templates and depend on constant secretion rates.
- Both FGF2 secretion by active AEC2 and ECM secretion by myofibroblasts are increased by TGFβ. Similarly, TGFβ secretion by M2 is increased by IL13. In our model, these dynamic rates are expressed by
- As in [48], the constant secretion rate of ECM by fibroblasts is multiplied by the factor in Equation (6), where is the value at which the ECM saturates. When , secretion is stopped.
- Activated AEC2 cells transform the latent form of TGFβ secreted by fibroblasts into its active form. Within the same time step, they reduce the local concentration of TGFβi and increase that of TGFβa by the same amount given by Equation (7), where is a saturation constant.
2.4.2. Proliferation Behaviors
Since the number of agents is constant throughout a simulation, proliferation behaviors simply translate into updates in the number of cells, which are stored as attributes by the alveolar ducts. The proliferation behaviors thus make use of the internal methods of the agents as an interface to update the number of cells of a specific type.
- The proliferation of AEC2 is governed by a constant rate that allows for the survival of both the AEC2 and AEC1 populations. To do so, at every time step, the AEC2 population increases by a constant fraction.
- Proliferation of fibroblasts depends on the number of healthy AEC2 in homeostasis and is further increased by damage-associated mediators such as FGF2, TGFβa, and IL13. To uncouple the two mechanisms, we implement (i) the F_addition behavior by which the number of fibroblasts is incremented according to a fixed fraction of AEC2 (represented by the parameter ), and (ii) the F_proliferate that computes the fraction of newborn fibroblasts using the rate in Equation (8).
2.4.3. Differentiation Behaviors
Differentiation behaviors act by updating cell numbers in pairs.
- In AEC21_Differentiation and M12_Differentiation, the phenotypes of constant fractions of AEC2 and M1 are changed so that the AEC1 and M2 populations in homeostasis can survive.
- M0 cells act as a reservoir for M1 cells (hence indirectly for M2 cells) both in homeostasis and in inflammatory conditions. In our model, we implement two different mechanisms within the same behavior to ensure that a minimum number of M1 is always maintained. We define a constant rate for the M0 to M1 differentiation and use this value only if the concentration of MCP1 is too low to provide the M1 cells’ baseline. As the inflammation develops and the MCP1 can sustain the growth of M1 cells, we use the differentiation rate in Equation (9), where the last factor ensures that M1 cells never exceed M0 cells, as described in [48]. As stated before, the principle of local information exchange is not violated since each alveolar duct agent records only its number of M0 and M1 cells. Therefore, may assume different values for different agents.
- Fibroblast to myofibroblast and M2 to M1 differentiation are implemented in F_MF_Differentiation and M21_Differentiation. Since both are triggered by extracellular mediators, their templates are similar, and the rates that describe the transitions are outlined in the following equations
2.4.4. Activation Behaviors
In our model, damage is a special case of the differentiation behavior in which cells, instead of changing their type, change their state. In our model, AEC2 can be found in three different states: healthy, damaged, and activated. At the beginning of a simulation, a fraction of healthy AEC2 in each alveolar duct (specified by the parameter hitProbability) can be damaged. By running the AEC2_Activation behavior, agents can then update the state of a constant fraction (i.e., rates are fixed) of damaged cells and turn them into the activated state. We assume that activated and damaged AEC2 cannot be repaired.
2.4.5. Apoptosis Behaviors
To simulate apoptosis, cells are removed from the simulations using the same agent-based methods used for the proliferation, i.e., cell line-specific rates control the fraction of cells that is updated at each time step. With the exception of AEC2 (whose apoptotic rate is increased by TGFβ and oxidative stress as outlined in Equation (12)), all the rates are static.
At every time step, AEC2 apoptotic rates are updated for each agent according to the local TGFβ concentration.
2.5. Initial Conditions and Input/Output System
This section provides an overview of the data imported into (including the model parameters and their sources) and exported from the simulations and details how the I/O operations are implemented within the model.
Our model relies on two input sources: the list of cell positions and the parameter list. As detailed in Section 2.2, the former is provided by an algorithm that outputs different structures for every run as the branching angles are randomly drawn. To avoid running the building algorithm prior to each simulation, we save its output on a ROOT [58] file (a high-performance open-source data analysis framework developed at CERN) and feed multiple simulations with the same input. When the simulation platform is started, a function reads the list of cell positions and adds as many agents to the simulation setting as their “Position” attributes to one element of the list. The latter input source is a parameter list that consists of default parameters and custom parameters. Values for the default parameters are provided by BioDynaMo and can be overwritten by the user. We overwrite a few of them, as mentioned in the previous sections: the simulation time step, the size of the simulation volume, the resolution scheme for the PDEs, and the boundary conditions for the diffusion. Moreover, a list of almost 90 custom parameters (see the supplementary material) includes behavior-specific parameters (such as rates), substance-specific parameters (as shown in Section 2.3), and simulation-specific parameters (such as the names of input files and the number of simulation steps). When a new simulation instance is created, the file with the parameters list can be given as an argument so that its content becomes available to set up the simulation environment and the agents’ behaviors and attributes. As a side note, single parameter values can be specified using the inline-config option to further overwrite those in the parameters list. We take advantage of this feature to run multiple parallel simulations on the cluster nodes with different parameter sets.
The output of a simulation consists of: the time-evolution of the number of cells in each agent and the average concentration of the extracellular substances and (optionally) visualization data. To gather these data, we use the standalone operations provided by BioDynaMo and set a frequency for the measurements. Whenever the frequency is matched by the elapsed time steps, the following occurs
- An operation runs through all the agents, collects the number of cells for each cell type, and stores the information in a vector.
- Another operation exploits the agents as probes: it gathers their position, uses these positions to get the local concentration of all the substances, computes the average concentration for each substance, and finally stores the information in a vector (note that there is no measurement within the diffusion grid boxes where agents are not localized).
At the end of the simulation, each measurement is assigned its timestamp, and the vectors are exported to ROOT files [58]. If the Visualization parameter is set to true, the selected agent attributes are exported too, and their time-evolution can be visualized using ParaView.
Moreover, we implement a simple Python script to collect exported files from multiple simulations and generate graphical outputs showing the average of the measurements. The outputs are then used in a feedback system as inputs for the following simulation: in fact, the proliferation and differentiation rates, as well as the secretion rates, are adjusted according to the number of cells and the average concentrations, respectively. These parameters are then tuned until a stationary state is reached under homeostatic conditions (i.e., the concentration of the substances and the number of cells do not drift from the initial values listed in Table 1 and Table 2, respectively). For FGF2 (which is secreted by AEC2 in inflammatory conditions and is not explicitly included in the model from [48]), we assume that the necessary concentration to stimulate the same effect on fibroblasts proliferation as in [48] is that for which the following condition holds:
where the right-hand side of the equation comes from the mathematical model of IPF described in [48]; represents the concentration of damaged AEC2, while is the AEC2 saturation constant.
2.6. Sensitivity Analysis
Performing a full parameter sensitivity analysis is beyond the scope of this work due to its prohibitive time requirements. This notwithstanding, we selected five key parameters and performed a relative sensitivity analysis to assess how they affect the simulation outcomes. For each pair of altered parameter p and characteristic (or readout) c, the following indicators are computed:
where a is the amount of change in the parameter p (±10% in this work), and C is the measured outcome. is the index percentage of change and shows the relative change of the characteristic c with respect to the control value (i.e., in unaltered conditions) that occurs when the parameter p is altered by an amount a. The second indicator, , represents the sensitivity and quantifies the effect of the variation ±a in the parameter p on the characteristic c. Finally, the results are presented using a relative sensitivity map, where each row represents the relative sensitivities of a selected simulation readout to all the altered parameters (shown in the column headers). is computed as the ratio between each and the maximum absolute value of for that particular characteristic.
3. Results
3.1. Homeostasis
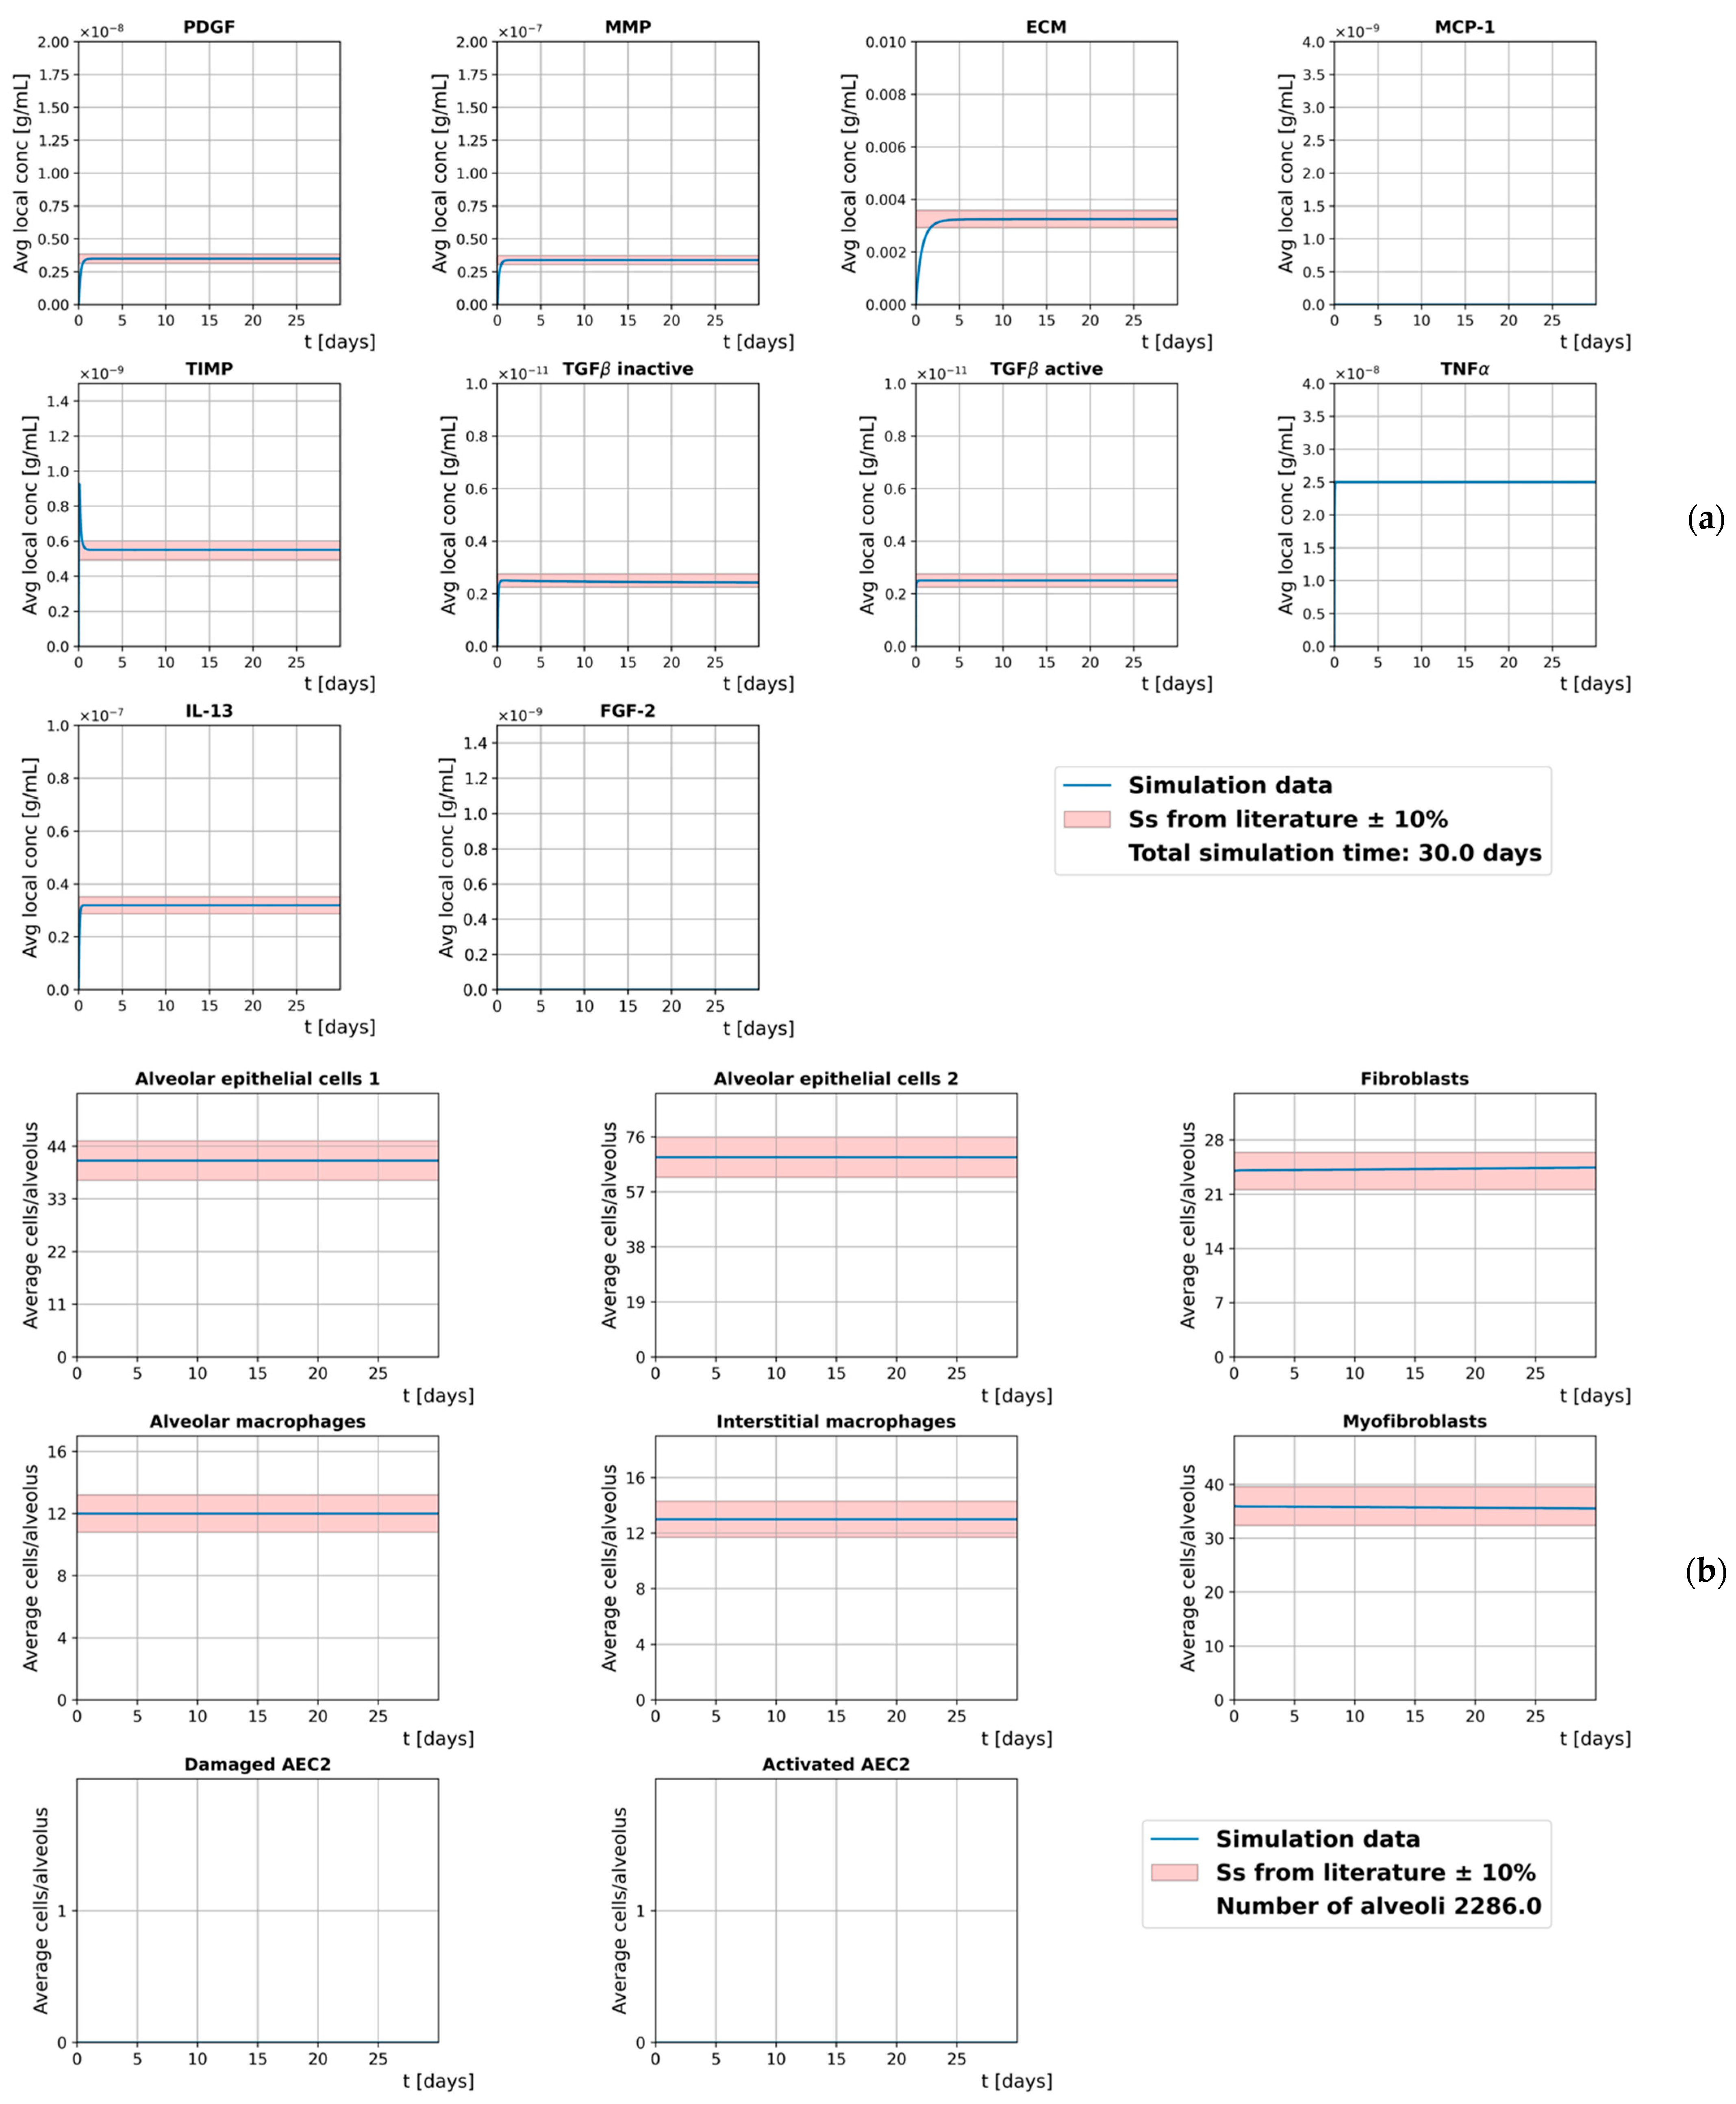
Our model is run without damaged cells to simulate ideal homeostasis during a time frame of 30 days. The initial conditions are listed in Table S1, and the results, shown in Figure 4, are expressed in terms of the average concentration of the cell-hosting diffusion grid and the average number of cells per alveolus. The positive amount of myofibroblasts is used to simulate initial light inflammatory conditions.
To assess the ability of our model to reproduce homeostatic conditions in which both the average local concentration of the extracellular mediators and the average number of cells reach the steady-state, we measure their relative change between day 5 and day 30, as follows
and provide ∆m for the two quantities in Figure S1.
We assume that both the cell number and the concentration of the extracellular mediators are already in steady-state at day 5 since they never exceed the 10% bands and their relative changes stay below 0.025% throughout the whole simulated time frame. However, a slight decrease in the number of myofibroblasts, coupled with an increase in the number of fibroblasts, shows a tendency of the model to shift towards fully homeostatic conditions.
3.2. Inflammation
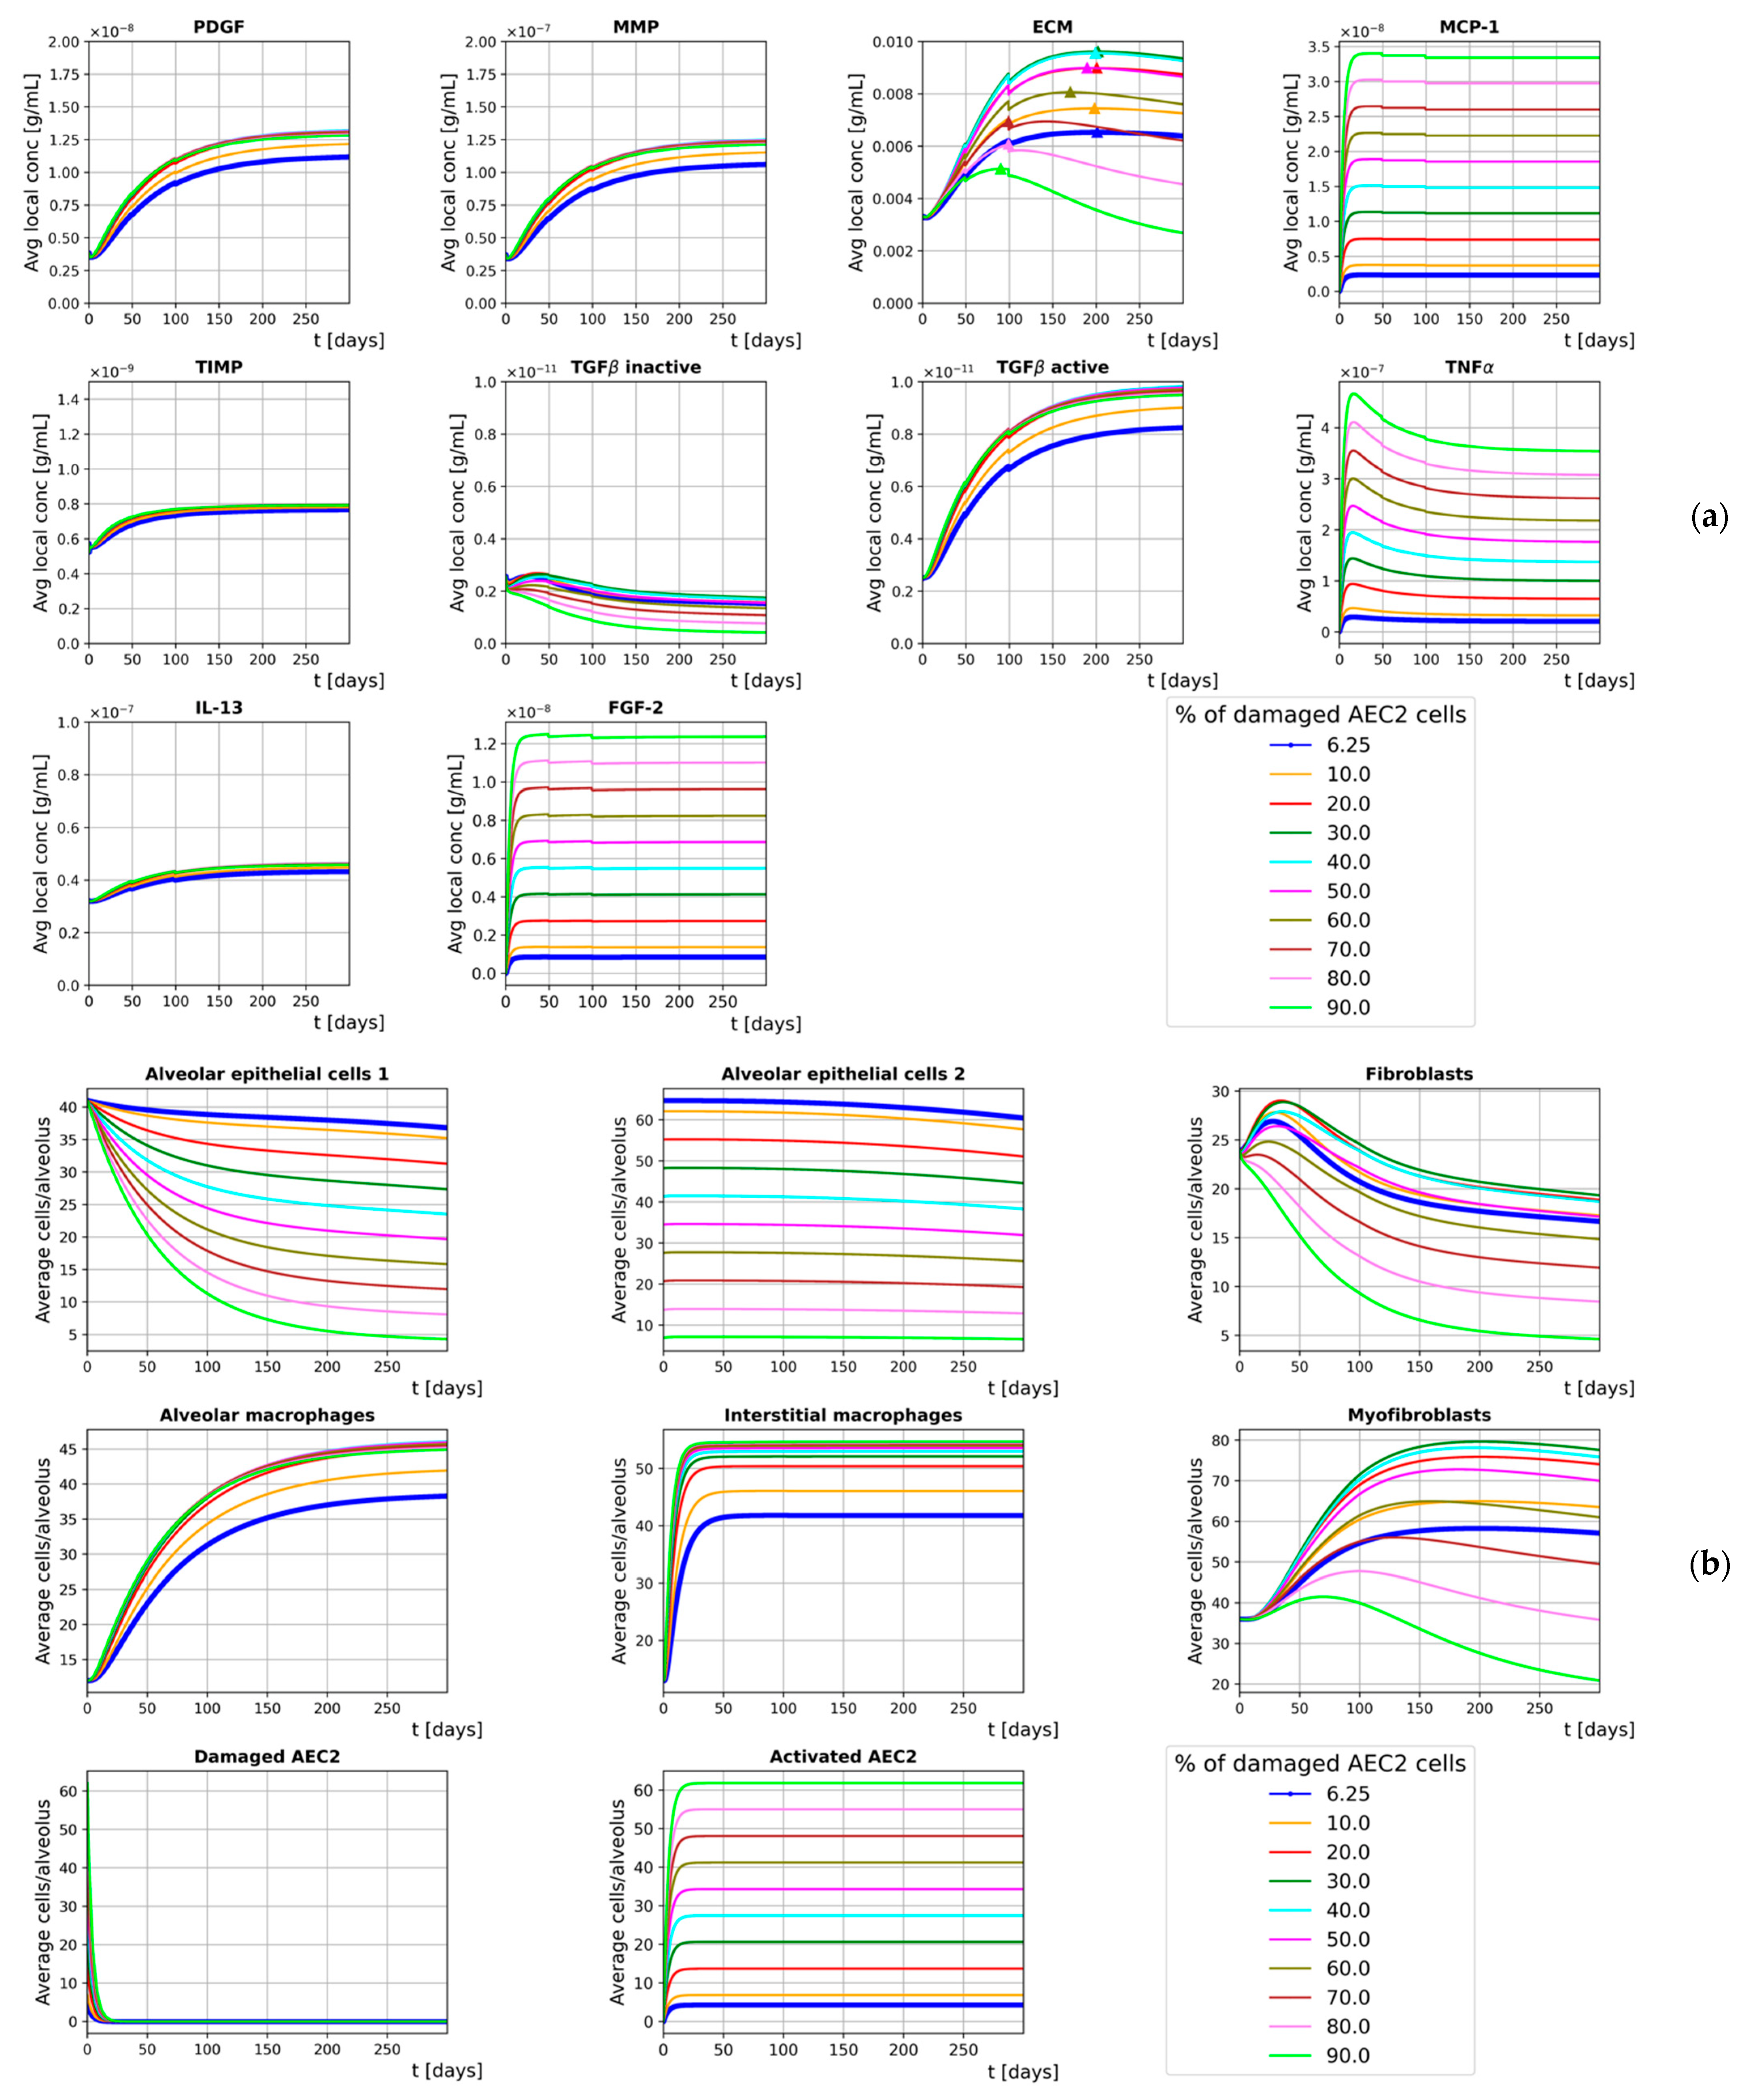
To simulate the onset of fibrosis, our model is run with an initial amount of damaged AEC2 cells and replicates a time frame of 300 days. Different runs are performed for different initial (average) fractions of damaged AEC2, where and the damage is heterogeneously spread over the simulation space (i.e., the fraction of damaged AEC2 cells within each alveolar duct is drawn from a normal distribution with average and ). More specifically, the value allows us to compare the results from our simulations against those shown in [48] since the study reports the steady-state ratio . Rather than a continuous damage (as proposed in [48]), healthy AEC2 cells in our model are damaged only at the beginning of the simulation and the active AEC2 cells cannot undergo apoptosis (i.e., they are never removed from the simulation). We make this assumption as our model aims to simulate the onset of lung fibrosis regardless of the cause for the damage to the AEC2 cells.
The initial conditions are listed in Table S1, and the results, shown in Figure 5, are expressed in Section 3.1.
Though with slower dynamics, our results (for ) are in agreement with those provided by Hao et al. [48]. ECM accumulation, a surrogate of lung fibrosis severity, shows incremental rises for . On the other hand, for the healthy AEC2 cells are unable to support the mesenchymal population, whose drop leads to a progressive decline in the final ECM concentration. This notwithstanding, we show that the loss of AEC2 progenitor cells is reflected by a sharp decline in the number of AEC1 cells that has been experimentally detected in lung fibrosis patients as a depletion in epithelial integrity [9].
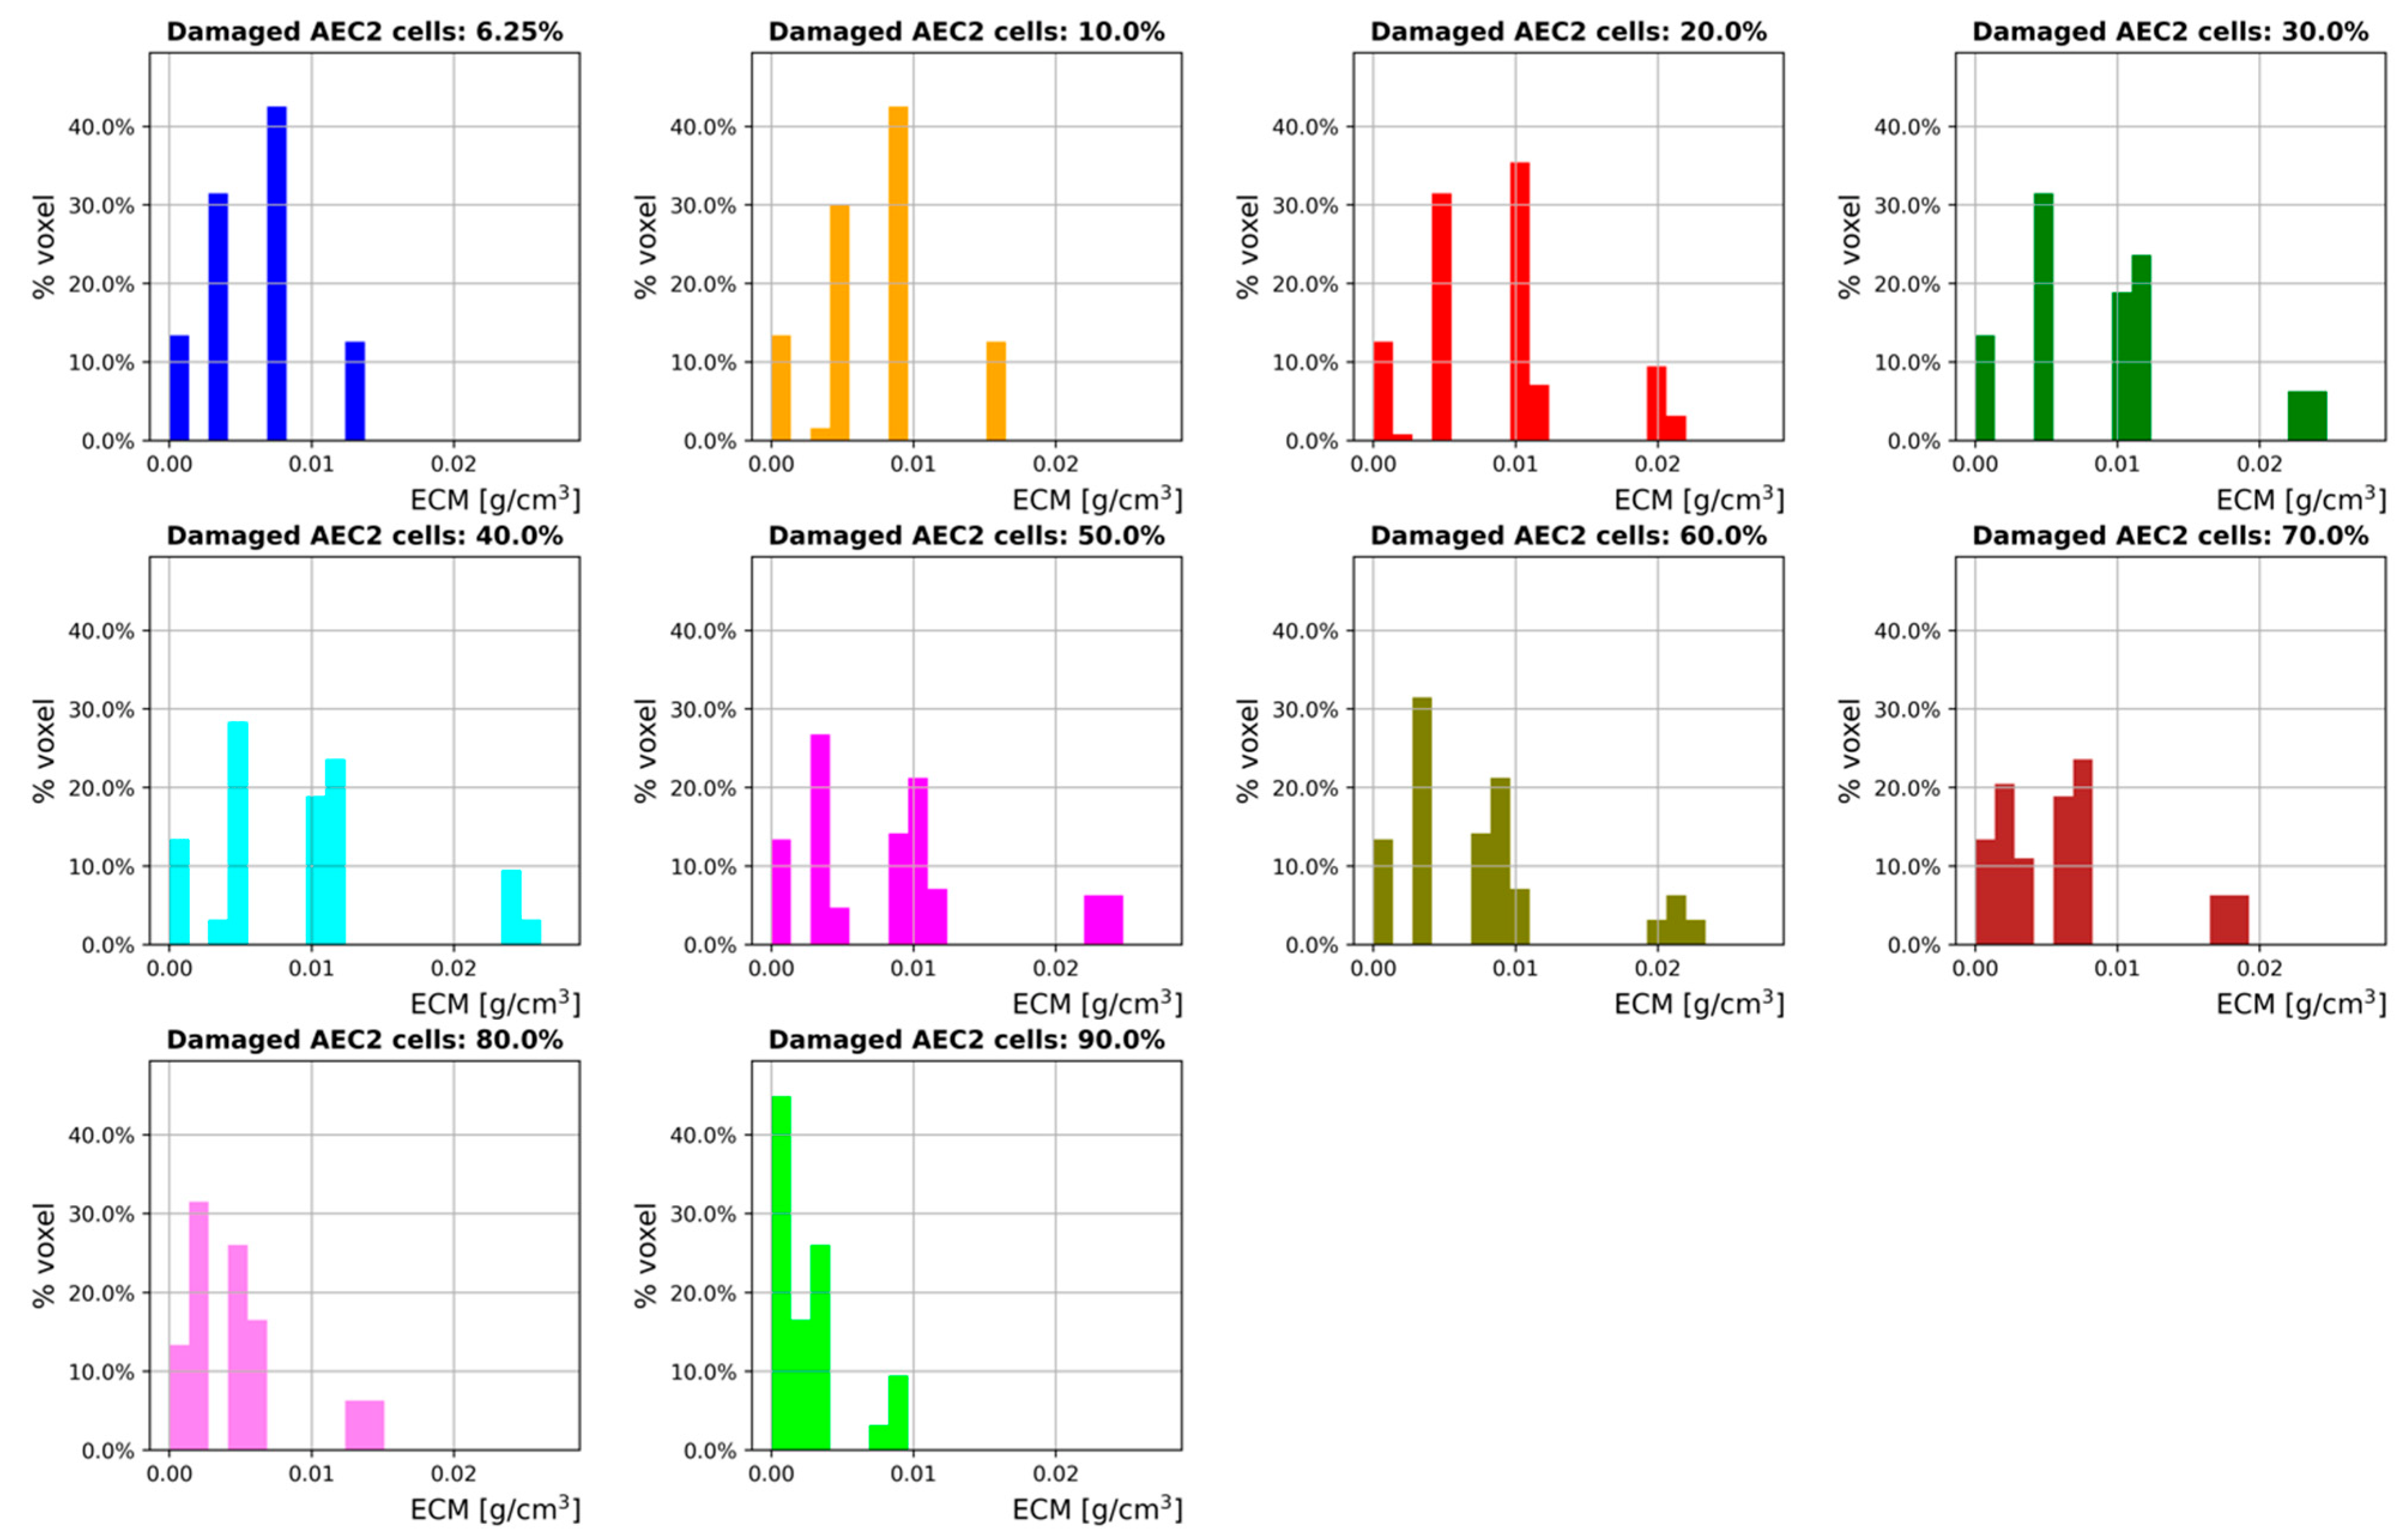
In order to assess how the degree of damage correlates with the ECM distribution across the simulation space, the ECM concentration in each cell-hosting voxel of the diffusion grid is measured during the last time step of the 300-days simulated time frame. By taking the ECM concentration as a surrogate for the attenuation coefficient (the use of which to monitor lung fibrosis is ordinary in the clinic [59]), we show the results through density distribution histograms in Figure 6.
Although Figure 6 provides the density distribution histograms for a late fibrotic phase only, the trends shown are qualitatively in agreement with the results provided in [59,60], where lung fibrosis is induced by radiotherapy in mice. As expected, a right shift is observed for , while the ECM density distributions progressively shift towards left for higher values. It should be noted here that this kind of simulation output could be compared (after an appropriate conversion) against clinical lung CT readings, a feature that cannot be provided by 2D models and/or averaging methods. The three-dimensionality of our model enables the emergence of peculiar patterns and provides additional information to the curves showing the average ECM concentration. Interestingly, multiple animal and human studies [59,60,61,62,63,64] have shown that higher irradiation doses (corresponding to larger amounts of initial damage) correlate well with sharper changes in CT density (and, therefore, ECM accumulation). This notwithstanding, the pathways that are triggered following greater initial damage to the AEC2 cells (as seen in radiotherapy treatments) have not been fully understood yet; therefore, we provide preliminary results and an introductory framework that can be employed for further research on radiation-induced lung fibrosis.
3.3. Sensitivity Analysis
We performed a parameter sensitivity analysis (see details and motivations in Section 2.6) by altering the following selected parameters: , , ECMsat, , and (definitions are provided in Section 2.4). Each parameter is altered by ±10%, and the characteristics (both the cell numbers and the substance concentrations) are measured after a simulated time frame of 30 days so that the steady-state is reached (in homeostatic conditions). The relative sensitivity of the simulation readouts to the parameters listed above is shown in Figure 7.
The sensitivity analysis showed that the impact of on the ECM concentration is stronger than that of any other parameter, including . In other words, the effect that TGFβ has on the ECM secretion by the myofibroblasts exceeds the increase/decrease in their number induced by the same variation in . Not surprisingly, has proved to be the parameter with the biggest impact (among the five selected) on almost 60% of the characteristics. In fact, it controls the number of macrophages, which in turn secrete upstream regulators of several mechanisms. Finally, as expected, the number of fibroblasts and myofibroblasts and the TGFβin (secreted by F) are mostly sensitive to .
4. Discussion
In this study, we outlined the development of a hybrid 3D ABM of lung fibrosis. The disease has been shown to be triggered by many factors, and its pathophysiology has not been fully understood yet. Within this context, mathematical models and computational simulations have the potential to shed light on its mechanistic progression and allow for the testing of potential treatment candidates beforehand without the need for laboratories.
The simulation space of our model consists of a partial acinus built from morphometric data, in which stationary alveolar ducts act as agents whose behaviors are derived from biological findings and previous computational models. Each agent encompasses six distinct cell types secreting ten different extracellular substances. The results that we provide show that the model can qualitatively simulate the onset of fibrosis and represent a valuable extendable framework that can reproduce further scenarios on smaller and larger spatial and temporal scales. It should be noted that while the model may be seen as static, the shared extracellular space acts as a mutable environment, thus making it a time-varying network in which geometry plays a strong role.
We first calibrated the parameters of our model so that it could reproduce stationary homeostatic conditions for a time frame of 30 days. Specifically, we adjusted the secretion, proliferation, differentiation, and apoptotic rates of the cells within the agents in order to reproduce and maintain the initial conditions provided by Hao et al. [48]. To assess whether the model was able to reach its steady-state and that both the concentration of the extracellular mediators and the number of cells did not drift from the experimental values, we measured their time evolution along with their relative change. We showed that the simulated values never exceeded the 10% threshold, while their relative change remained below 0.005% for the entire simulated time frame. It should be noted that the concentration of the substances shown in Figure 4, Figure 5 and Figure 6 is the average concentration measured within the cell-hosting voxels of the diffusion grids.
We performed a parameter sensitivity analysis on 5 selected parameters and assessed their impact on 14 different characteristics (namely, the number of cells and the substances’ concentration) in steady-state and homeostatic conditions. The analysis showed that, among the selected parameters, had the greatest impact on the majority of the simulation readouts, highlighting the central role of macrophages in the model.
The second step introduced the external damage: we investigated the effect of different fractions of damaged AEC2 cells at the beginning of the simulations and simulated heterogeneous damage by drawing those fractions from normal distributions with average and . It has to be noted that incorporating heterogeneous damage allowed our model to run more realistic simulations as the amount of damage is randomly distributed in human fibrotic lungs. Moreover, the presence of randomness in individual behavior is a distinctive feature of ABM that cannot be implemented within traditional averaging methods (such as EBMs). Heterogenous fractions of damaged AEC2 cells result in different distributions of MCP1 that, in turn, show different chemoattractant effects on M1 cells. This indirectly affects the number of M2 cells within each alveolar duct and alters the amount of secreted TGFβa, which is reflected by different ECM patterns. The curves provided in Figure 6, with show that our model can qualitatively reproduce the results of Hao et al. [48]. Further, by perturbing the steady-state stability that characterizes the homeostatic situation, the symmetry of the system is broken, and we observe its evolution through an irreversible process towards its final state. We also show that increasing the fraction of damaged AEC2 leads to a corresponding rise in the concentration of ECM for . Conversely, for we observed progressively decreasing amounts of ECM. The reason for this is the strong coupling between AEC2 cells and fibroblasts: as the fraction of damaged AEC2 cells exceeds the aforementioned threshold, the healthy AEC2 cells are no longer able to sustain the population of fibroblasts, an effect that is not counteracted by the additional FGF2 secreted by the active AEC2 cells. We further investigated the effects of different fractions of damaged AEC2 cells on the ECM distribution by measuring its concentration during the last time step of a 300-day simulation. The results, provided in Figure 6 as density distribution histograms, show a right shift of the ECM distribution for and a left shift for bigger values of .
Our study suffers from a few limitations worth noting. To begin with, the model simulates only a limited number of key pathways and cell types found in the distal airways (i.e., alveolar epithelial cells, fibroblasts, myofibroblasts, and macrophages) without taking into account oxygen diffusion and endothelial cells. Moreover, although the number of cells and the length scale of the geometrical framework were derived from in-vivo and in-vitro studies, our ABM was validated exclusively against in-silico experimental results. Finally, the cells secretion rates and the parameters describing the effect of extracellular mediators on cells secretion were adjusted with the aim of replicating experimental results and, thus, are not supported by any experimental finding.
The results provided in this paper prove that our ABM of lung fibrosis can successfully mimic the findings reported by previous studies. To the best of our knowledge, this is the first agent-based model of lung fibrosis implemented in three dimensions, supporting both substance diffusion and extracellular pathways on a geometrical framework that reflects morphometric data. Moreover, our model can simulate 30-day-long time frames with a time resolution of 0.1 s on a standard laptop. Accordingly, it may be employed as a starting point and easily extended for further use in the context of lung diseases (such as COVID-19 and asthma) by implementing additional layers of complexity, both on smaller and larger spatial scales as well as multiple sources of damage. Our multi-level damage approach might be of interest for simulating radiation-induced injuries as cells irradiated at different doses experience varying amounts of damage. The optimization of radiotherapy treatments and calculations of normal tissue complication probability after irradiation are examples of applications that suffer from the limitations of the analytical models; these applications could benefit from the 3D framework of this ABM. Indeed, even stochastic EBMs have been proven to provide fewer scenarios and emergent patterns than ABMs in biomedical contexts [65]. Moreover, the possibility to easily implement interpatient variability by changing the acinar structure, the density of alveolar ducts, the cell damage sensitivity, and the number of cells makes it well suited for studies of personalized medicine and the clinical testing of drugs.
Supplementary Materials
The following supporting information can be downloaded at: https://www.mdpi.com/article/10.3390/sym14010090/s1, Table S1: Model parameters, ZIP archive S1: Source code of the model, Figure S1: Cell numbers and extracellular mediators concentration relative change, Figure S2: Extracellular mediators average local concentration for different Δt values. References [27,28,48,55,56,66] are cited in the supplementary materials.
Author Contributions
Conceptualization, N.C.; methodology, N.C.; software, N.C.; writing—original draft preparation, N.C.; writing—review and editing, M.D. and R.B.; visualization, N.C.; supervision, M.D. and R.B. All authors have read and agreed to the published version of the manuscript.
Funding
We acknowledge support by the Deutsche Forschungsgemeinschaft (DFG–German Research Foundation) and the Open Access Publishing Fund of Technical University of Darmstadt.
Institutional Review Board Statement
Not applicable.
Informed Consent Statement
Not applicable.
Data Availability Statement
All the relevant data is contained within the article and its Supporting Information files.
Acknowledgments
Calculations for this research were conducted on the Lichtenberg high-performance computer of the TU Darmstadt.
Conflicts of Interest
The authors declare no conflict of interest.
References
- Richeldi, L.; Collard, H.R.; Jones, M.G. Idiopathic pulmonary fibrosis. Lancet 2017, 389, 1941–1952. [Google Scholar] [CrossRef]
- Jin, H.; Yoo, Y.; Kim, Y.; Kim, Y.; Cho, J.; Lee, Y.S. Radiation-induced lung fibrosis: Preclinical animal models and therapeutic strategies. Cancers 2020, 12, 1561. [Google Scholar] [CrossRef] [PubMed]
- Türkkan, G.; Willems, Y.; Hendriks, L.E.L.; Mostard, R.; Conemans, L.; Gietema, H.A.; Mitea, C.; Peeters, S.; De Ruysscher, D. Idiopathic pulmonary fibrosis: Current knowledge, future perspectives and its importance in radiation oncology. Radiother. Oncol. 2021, 155, 269–277. [Google Scholar] [CrossRef] [PubMed]
- Weibel, E.R.; Sapoval, B.; Filoche, M. Design of peripheral airways for efficient gas exchange. Respir. Physiol. Neurobiol. 2005, 148, 3–21. [Google Scholar] [CrossRef] [PubMed]
- Martinez, F.J.; Collard, H.R.; Pardo, A.; Raghu, G.; Richeldi, L.; Selman, M.; Swigris, J.J.; Taniguchi, H.; Wells, A.U. Idiopathic pulmonary fibrosis. Nat. Rev. Dis. Prim. 2017, 3, 220. [Google Scholar] [CrossRef] [PubMed]
- Weibel, E.R. Lung morphometry: The link between structure and function. Cell Tissue Res. 2017, 367, 413–426. [Google Scholar] [CrossRef]
- Sisson, T.H.; Mendez, M.; Choi, K.; Subbotina, N.; Courey, A.; Cunningham, A.; Dave, A.; Engelhardt, J.F.; Liu, X.; White, E.S.; et al. Targeted injury of type II alveolar epithelial cells induces pulmonary fibrosis. Am. J. Respir. Crit. Care Med. 2010, 181, 254–263. [Google Scholar] [CrossRef] [Green Version]
- Camelo, A.; Dunmore, R.; Sleeman, M.A.; Clarke, D.L. The epithelium in idiopathic pulmonary fibrosis: Breaking the barrier. Front. Pharmacol. 2014, 4, 111. [Google Scholar] [CrossRef] [Green Version]
- Selman, M.; Pardo, A. Role of epithelial cells in idiopathic pulmonary fibrosis: From innocent targets to serial killers. Proc. Am. Thorac. Soc. 2006, 3, 364–372. [Google Scholar] [CrossRef]
- Parimon, T.; Yao, C.; Stripp, B.R.; Noble, P.W.; Chen, P. Alveolar epithelial type II cells as drivers of lung fibrosis in idiopathic pulmonary fibrosis. Int. J. Mol. Sci. 2020, 21, 2269. [Google Scholar] [CrossRef] [Green Version]
- Yao, C.; Guan, X.; Carraro, G.; Parimon, T.; Liu, X.; Huang, G.; Mulay, A.; Soukiasian, H.J.; David, G.; Weigt, S.S.; et al. Senescence of Alveolar Type 2 Cells Drives Progressive Pulmonary Fibrosis. Am. J. Respir. Crit. Care Med. 2021, 203, 707–717. [Google Scholar] [CrossRef]
- Redente, E.F.; Keith, R.C.; Janssen, W.; Henson, P.M.; Ortiz, L.A.; Downey, G.P.; Bratton, D.L.; Riches, D.W.H. Tumor necrosis factor-α accelerates the resolution of established pulmonary fibrosis in mice by targeting profibrotic lung macrophages. Am. J. Respir. Cell Mol. Biol. 2014, 50, 825–837. [Google Scholar] [CrossRef] [Green Version]
- Broekelmann, T.J.; Limper, A.H.; Colby, T.V.; McDonald, J.A. Transforming growth factor β1 is present at sites of extracellular matrix gene expression in human pulmonary fibrosis. Proc. Natl. Acad. Sci. USA 1991, 88, 6642–6646. [Google Scholar] [CrossRef] [Green Version]
- Khalil, N.; Whitman, C.; Zuo, L.; Danielpour, D.; Greenberg, A. Regulation of alveolar macrophage transforming growth factor-β secretion by corticosteroids in bleomycin-induced pulmonary inflammation in the rat. J. Clin. Investig. 1993, 92, 1812–1818. [Google Scholar] [CrossRef] [Green Version]
- Nagaoka, I.; Trapnell, B.C.; Crystal, R.G. Upregulation of platelet-derived growth factor-A and -B gene expression in alveolar macrophages of individuals with idiopathic pulmonary fibrosis. J. Clin. Investig. 1990, 85, 2023–2027. [Google Scholar] [CrossRef] [Green Version]
- Hancock, A.; Armstrong, L.; Gama, R.; Millar, A. Production of interleukin 13 by alveolar macrophages from normal and fibrotic lung. Am. J. Respir. Cell Mol. Biol. 1998, 18, 60–65. [Google Scholar] [CrossRef]
- Selman, M.; Ruiz, V.; Cabrera, S.; Segura, L.; Ramírez, R.; Barrios, R.; Pardo, A. TIMP-1, -2, -3, and -4 in idiopathic pulmonary fibrosis. A prevailing nondegradative lung microenvironment? Am. J. Physiol. Cell. Mol. Physiol. 2000, 279, L562–L574. [Google Scholar] [CrossRef]
- Kelley, J.; Fabisiak, J.P.; Hawes, K.; Absher, M. Cytokine signaling in lung: Transforming growth factor-beta secretion by lung fibroblasts. Am. J. Physiol. 1991, 260, L123–L128. [Google Scholar] [CrossRef]
- Raghu, G.; Masta, S.; Meyers, D.; Narayanan, A.S. Collagen synthesis by normal and fibrotic human lung fibroblasts and the effect of transforming growth factor-beta. Am. Rev. Respir. Dis. 1989, 140, 95–100. [Google Scholar] [CrossRef]
- Lu, P.; Takai, K.; Weaver, V.M.; Werb, Z. Extracellular Matrix degradation and remodeling in development and disease. Cold Spring Harb. Perspect. Biol. 2011, 3, 124. [Google Scholar] [CrossRef]
- Morishima, Y.; Nomura, A.; Uchida, Y.; Noguchi, Y.; Sakamoto, T.; Ishii, Y.; Goto, Y.; Masuyama, K.; Zhang, M.J.; Hirano, K.; et al. Triggering the induction of myofibroblast and fibrogenesis by airway epithelial shedding. Am. J. Respir. Cell Mol. Biol. 2001, 24, 111. [Google Scholar] [CrossRef]
- Fichtner-Feigl, S.; Strober, W.; Kawakami, K.; Puri, R.K.; Kitani, A. IL-13 signaling through the IL-13α2 receptor is involved in induction of TGF-β1 production and fibrosis. Nat. Med. 2006, 12, 99–106. [Google Scholar] [CrossRef] [PubMed]
- Hetzel, M.; Bachem, M.; Anders, D.; Trischler, G.; Faehling, M. Different effects of growth factors on proliferation and matrix production of normal and fibrotic human lung fibroblasts. Lung 2005, 183, 225–237. [Google Scholar] [CrossRef] [PubMed]
- Gu, L.; Zhu, Y.J.; Yang, X.; Guo, Z.J.; Xu, W.B.; Tian, X.L. Effect of TGF-β/Smad signaling pathway on lung myofibroblast differentiation. Acta Pharmacol. Sin. 2007, 28, 382–391. [Google Scholar] [CrossRef] [Green Version]
- Hagimoto, N.; Kuwano, K.; Inoshima, I.; Yoshimi, M.; Nakamura, N.; Fujita, M.; Maeyama, T.; Hara, N. TGF-β1 as an Enhancer of Fas-Mediated Apoptosis of Lung Epithelial Cells. J. Immunol. 2002, 168, 6470–6478. [Google Scholar] [CrossRef] [PubMed] [Green Version]
- Saito, A.; Okazaki, H.; Sugawara, I.; Yamamoto, K.; Takizawa, H. Potential action of IL-4 and IL-13 as fibrogenic factors on lung fibroblasts in vitro. Int. Arch. Allergy Immunol. 2003, 132, 168–176. [Google Scholar] [CrossRef] [PubMed]
- Xiao, L. TGF-beta 1 induced fibroblast proliferation is mediated by the FGF-2/ERK pathway. Front. Biosci. 2012, 17, 2667. [Google Scholar] [CrossRef] [Green Version]
- Li, C.M.; Khosla, J.; Pagan, I.; Hoyle, P.; Sannes, P.L. TGF-β1 and fibroblast growth factor-1 modify fibroblast growth factor-2 production in type II cells. Am. J. Physiol.-Lung Cell. Mol. Physiol. 2000, 279, 1038–1046. [Google Scholar] [CrossRef]
- Boström, H.; Willetts, K.; Pekny, M.; Levéen, P.; Lindahl, P.; Hedstrand, H.; Pekna, M.; Hellström, M.; Gebre-Medhin, S.; Schalling, M.; et al. PDGF-A signaling is a critical event in lung alveolar myofibroblast development and alveogenesis. Cell 1996, 85, 863–873. [Google Scholar] [CrossRef] [Green Version]
- Zhang, K.; Rekhter, M.D.; Gordon, D.; Phan, S.H. Myofibroblasts and their role in lung collagen gene expression during pulmonary fibrosis: A combined immunohistochemical and in situ hybridization study. Am. J. Pathol. 1994, 145, 114–125. [Google Scholar]
- Petrov, V.V.; Fagard, R.H.; Lijnen, P.J. Stimulation of collagen production by transforming growth factor-β1 during differentiation of cardiac fibroblasts to myofibroblasts. Hypertension 2002, 39, 258–263. [Google Scholar] [CrossRef] [Green Version]
- Kim, K.K.; Kugler, M.C.; Wolters, P.J.; Robillard, L.; Galvez, M.G.; Brumwell, A.M.; Sheppard, D.; Chapman, H.A. Alveolar epithelial cell mesenchymal transition develops in vivo during pulmonary fibrosis and is regulated by the extracellular matrix. Proc. Natl. Acad. Sci. USA 2006, 103, 13180–13185. [Google Scholar] [CrossRef] [Green Version]
- Tashiro, J.; Rubio, G.A.; Limper, A.H.; Williams, K.; Elliot, S.J.; Ninou, I.; Aidinis, V.; Tzouvelekis, A.; Glassberg, M.K. Exploring animal models that resemble idiopathic pulmonary fibrosis. Front. Med. 2017, 4, 1211. [Google Scholar] [CrossRef] [Green Version]
- Brodland, G.W. How computational models can help unlock biological systems. Semin. Cell Dev. Biol. 2015, 47–48, 62–73. [Google Scholar] [CrossRef] [Green Version]
- Winslow, R.L.; Trayanova, N.; Geman, D.; Miller, M.I. Computational medicine: Translating models to clinical care. Sci. Transl. Med. 2012, 4, 112. [Google Scholar] [CrossRef] [Green Version]
- Saha, A.; Saha, B. Novel coronavirus SARS-CoV-2 (Covid-19) dynamics inside the human body. Rev. Med. Virol. 2020, 30, 1411. [Google Scholar] [CrossRef]
- Giordano, G.; Blanchini, F.; Bruno, R.; Colaneri, P.; Di Filippo, A.; Di Matteo, A.; Colaneri, M. Modelling the COVID-19 Epidemic and Implementation of Population-Wide Interventions in Italy; Springer: Berlin/Heidelberg, Germany, 2020; Volume 26, ISBN 4159102008837. [Google Scholar]
- Van Dyke Parunak, H.; Savit, R.; Riolo, R.L. Agent-Based Modeling vs. Equation-Based Modeling: A Case Study and Users’ Guide; Lecture Notes in Computer Science; Springer: Berlin/Heidelberg, Germany, 1998; Volume 1534, pp. 10–25. [Google Scholar]
- Murray, J.D. (Ed.) Mathematical Biology II. In Interdisciplinary Applied Mathematics; Springer: New York, NY, USA, 2003; Volume 18, ISBN 978-0-387-95228-4. [Google Scholar]
- Murray, J.D. (Ed.) Mathematical Biology I. In Interdisciplinary Applied Mathematics, 3rd ed.; Springer: New York, NY, USA, 2002; Volume 17, ISBN 978-0-387-95223-9. [Google Scholar]
- Bonabeau, E. Agent-based modeling: Methods and techniques for simulating human systems. Proc. Natl. Acad. Sci. USA 2002, 99, 7280–7287. [Google Scholar] [CrossRef] [Green Version]
- Cilfone, N.A.; Kirschner, D.E.; Linderman, J.J. Strategies for Efficient Numerical Implementation of Hybrid Multi-scale Agent-Based Models to Describe Biological Systems. Cell. Mol. Bioeng. 2015, 8, 119–136. [Google Scholar] [CrossRef] [Green Version]
- Breitwieser, L.; Hesam, A.; de Montigny, J.; Vavourakis, V.; Iosif, A.; Jennings, J.; Kaiser, M.; Manca, M.; Di Meglio, A.; Al-Ars, Z.; et al. BioDynaMo: A modular platform for high-performance agent-based simulation. Bioinformatics 2021, 19, 735. [Google Scholar] [CrossRef]
- Warsinske, H.C.; Wheaton, A.K.; Kim, K.K.; Linderman, J.J.; Moore, B.B.; Kirschner, D.E. Computational Modeling Predicts Simultaneous Targeting of Fibroblasts and Epithelial Cells Is Necessary for Treatment of Pulmonary Fibrosis. Front. Pharmacol. 2016, 7, 1452. [Google Scholar] [CrossRef] [Green Version]
- Rikard, S.M.; Athey, T.L.; Nelson, A.R.; Christiansen, S.L.M.; Lee, J.J.; Holmes, J.W.; Peirce, S.M.; Saucerman, J.J. Multiscale Coupling of an Agent-Based Model of Tissue Fibrosis and a Logic-Based Model of Intracellular Signaling. Front. Physiol. 2019, 10, 7566. [Google Scholar] [CrossRef] [PubMed] [Green Version]
- Brown, B.N.; Price, I.M.; Toapanta, F.R.; DeAlmeida, D.R.; Wiley, C.A.; Ross, T.M.; Oury, T.D.; Vodovotz, Y. An agent-based model of inflammation and fibrosis following particulate exposure in the lung. Math. Biosci. 2011, 231, 186–196. [Google Scholar] [CrossRef] [PubMed] [Green Version]
- Wellman, T.J.; Mondoñedo, J.R.; Davis, G.S.; Bates, J.H.T.; Suki, B. Topographic distribution of idiopathic pulmonary fibrosis: A hybrid physics- and agent-based model. Physiol. Meas. 2018, 39, 064007. [Google Scholar] [CrossRef] [PubMed]
- Hao, W.; Marsh, C.; Friedman, A. A mathematical model of idiopathic pulmonary fibrosis. PLoS ONE 2015, 10, e0135097. [Google Scholar] [CrossRef] [Green Version]
- Haefeli-Bleuer, B.; Weibel, E.R. Morphometry of the human pulmonary acinus. Anat. Rec. 1988, 220, 401–414. [Google Scholar] [CrossRef]
- Paulin, G.A.; Ouriadov, A.; Lessard, E.; Sheikh, K.; McCormack, D.G.; Parraga, G. Noninvasive quantification of alveolar morphometry in elderly never- and ex-smokers. Physiol. Rep. 2015, 3, 113. [Google Scholar] [CrossRef]
- Hansen, J.E.; Ampaya, E.P. Human air space shapes, sizes, areas, and volumes. J. Appl. Physiol. 1975, 38, 990–995. [Google Scholar] [CrossRef]
- Weibel, E.R. Morphometry of the Human Lung; Springer: Berlin/Heidelberg, Germany, 1963; ISBN 9783642875557. [Google Scholar]
- Yablonskiy, D.A.; Sukstanskii, A.L.; Woods, J.C.; Gierada, D.S.; Quirk, J.D.; Hogg, J.C.; Cooper, J.D.; Conradi, M.S. Quantification of lung microstructure with hyperpolarized 3He diffusion MRI. J. Appl. Physiol. 2009, 107, 1258–1265. [Google Scholar] [CrossRef] [Green Version]
- Wilensky, U.; Rand, W. An Introduction to Agent-Based Modeling; MIT Press: Cambridge, MA, USA, 2015; ISBN 978-0-262-73189-8. [Google Scholar]
- Dvorak, P.; Bednar, D.; Vanacek, P.; Balek, L.; Eiselleova, L.; Stepankova, V.; Sebestova, E.; Kunova Bosakova, M.; Konecna, Z.; Mazurenko, S.; et al. Computer-assisted engineering of hyperstable fibroblast growth factor 2. Biotechnol. Bioeng. 2018, 115, 850–862. [Google Scholar] [CrossRef]
- Kołodziej, M.; Sauer, D.G.; Beck, J.; Marek, W.K.; Hahn, R.; Jungbauer, A.; Dürauer, A.; Piątkowski, W.; Antos, D. Scale up of a chromatographic capture step for a clarified bacterial homogenate—Influence of mass transport limitation and competitive adsorption of impurities. J. Chromatogr. A 2020, 1618, 7253. [Google Scholar] [CrossRef]
- Stone, K.C.; Mercer, R.R.; Gehr, P.; Stockstill, B.; Crapo, J.D. Allometric relationships of cell numbers and size in the mammalian lung. Am. J. Respir. Cell Mol. Biol. 1992, 6, 235–243. [Google Scholar] [CrossRef]
- Brun, R.; Rademakers, F. ROOT—An object oriented data analysis framework. Nucl. Instrum. Methods Phys. Res. Sect. A Accel. Spectrom. Detect. Assoc. Equip. 1997, 389, 81–86. [Google Scholar] [CrossRef]
- Perez, J.R.; Lee, S.; Ybarra, N.; Maria, O.; Serban, M.; Jeyaseelan, K.; Wang, L.M.; Seuntjens, J.; Naqa, I. El A comparative analysis of longitudinal computed tomography and histopathology for evaluating the potential of mesenchymal stem cells in mitigating radiation-induced pulmonary fibrosis. Sci. Rep. 2017, 7, 110. [Google Scholar] [CrossRef] [Green Version]
- Zhou, C.; Moustafa, M.R.; Cao, L.; Kriegsmann, M.; Winter, M.; Schwager, C.; Jones, B.; Wang, S.; Bäuerle, T.; Zhou, P.K.; et al. Modeling and multiscale characterization of the quantitative imaging based fibrosis index reveals pathophysiological, transcriptome and proteomic correlates of lung fibrosis induced by fractionated irradiation. Int. J. Cancer 2019, 144, 3160–3173. [Google Scholar] [CrossRef] [Green Version]
- Mah, K.; Van Dyk, J. Quantitative measurement of changes in human lung density following irradiation. Radiother. Oncol. 1988, 11, 169–179. [Google Scholar] [CrossRef]
- Lehnert, S.; El-Khatib, E. The use of CT densitometry in the assessment of radiation-induced damage to the rat lung: A comparison with other endpoints. Int. J. Radiat. Oncol. Biol. Phys. 1989, 16, 117–124. [Google Scholar] [CrossRef]
- Du, F.; Liu, H.; Wang, W.; Zhang, Y.; Li, J. Correlation Between Lung Density Changes Under Different Dose Gradients and Radiation Pneumonitis—Based on an Analysis of Computed Tomography Scans During Esophageal Cancer Radiotherapy. Front. Oncol. 2021, 11, 19. [Google Scholar] [CrossRef]
- Schröder, C.; Engenhart-Cabillic, R.; Kirschner, S.; Blank, E.; Buchali, A. Changes of lung parenchyma density following high dose radiation therapy for thoracic carcinomas—An automated analysis of follow up CT scans. Radiat. Oncol. 2019, 14, 17. [Google Scholar] [CrossRef]
- Figueredo, G.P.; Siebers, P.O.; Owen, M.R.; Reps, J.; Aickelin, U. Comparing stochastic differential equations and agent-based modelling and simulation for early-stage cancer. PLoS ONE 2014, 9, e95150. [Google Scholar]
- Grazul-Bilska, A.T.; Luthra, G.; Reynolds, L.P.; Bilski, J.J.; Johnson, M.L.; Adbullah, S.A.; Redmer, D.A.; Abdullah, K.M. Effects of basic fibroblast growth factor (FGF-2) on proliferation of human skin fibroblasts in type II diabetes mellitus. Exp. Clin. Endocrinol. Diabetes 2002, 110, 176–181. [Google Scholar] [CrossRef]
Figure 1.
Schematic representation of the main cells, extracellular mediators, and pathways in lung fibrosis. AEC1 = alveolar epithelial cells type 1, AEC2 = alveolar epithelial cells type 2, AEC2d = damaged AEC2, AEC2ap = apoptotic AEC2, AEC2ac = activated AEC2, F = fibroblast, MF = myofibroblast, M1 = type 1 macrophage, M2 = type 2 macrophage, M0 = monocyte, MMP = matrix metalloproteinases, ECM = extracellular matrix, TIMP = tissue inhibitors of metalloproteinases, IL13 = interleukin 13, TGFβi = inactive form of the transforming growth factor beta, TGFβa = active form of the transforming growth factor beta, FGF2 = basic fibroblast growth factor, TNFα = tumor necrosis factor, PDGF = platelet-derived growth factor, MCP1 = monocyte chemoattractant protein 1.

Figure 2.
Graphical representation of the simulation space as a dichotomic tree structure.

Figure 3.
Time evolution of the average MMP (a) and TIMP (b) concentrations in a stationary simplified model simulation with different values.
Figure 3.
Time evolution of the average MMP (a) and TIMP (b) concentrations in a stationary simplified model simulation with different values.

Figure 4.
Time evolution of the extracellular mediators’ average local concentration (a) and the average number of cells per alveolus (b) in homeostatic conditions. Red bands show the steady-states from the literature ±10%.
Figure 4.
Time evolution of the extracellular mediators’ average local concentration (a) and the average number of cells per alveolus (b) in homeostatic conditions. Red bands show the steady-states from the literature ±10%.

Figure 5.
Time evolution of the extracellular mediators’ average local concentration (a) and the average number of cells per alveolus (b) with initial heterogeneous damage. Different colors show different initial average fractions of damaged AEC2, and the thicker lines are used for .
Figure 5.
Time evolution of the extracellular mediators’ average local concentration (a) and the average number of cells per alveolus (b) with initial heterogeneous damage. Different colors show different initial average fractions of damaged AEC2, and the thicker lines are used for .

Figure 6.
ECM distribution histograms for different initial fractions of damaged AEC2 cells (damage is heterogeneous). Shown is the ECM concentration from the cell-hosting voxels of the diffusion grid at the last time step of a 300-days simulated time frame. The ECM concentration is used as a surrogate for the Hounsfield CT units, while the voxel percentages represent the volume fraction filled with a certain amount of ECM.

Figure 7.
Relative parameter sensitivity map showing the impact of changes in the parameters on the characteristics. For each pair of characteristic c and parameter p, indicates the ratio between the sensitivity and the maximum absolute value of for that particular characteristic (i.e., computed over an entire row).


Table 1.
Model parameters for the extracellular substances.
| Extracellular Substance | Initial Concentration (g cm−3) | Diffusion Coefficient (cm2 day−1) | Decay Coefficient (day−1) | Source |
|---|---|---|---|---|
| TGFβa | 2.51 × 10⁻¹² | 4.32 × 10⁻² | 3.33 × 10² | [48] |
| TGFβi | 2.51 × 10⁻¹² | 4.32 × 10⁻² | 3.33 × 10² | Estimated |
| PDGF | 3.50 × 10⁻⁹ | 8.64 × 10⁻² | 3.84 | [48] |
| FGF2 | 0 | 5.62 × 10⁻² | 1.66 | [55,56] |
| TIMP | 5.74 × 10⁻¹⁰ | 4.32 × 10⁻² | 21.60 | [48] |
| ECM | 3.26 × 10⁻³ | 0 | 0.37 | [48] |
| MMP | 3.66 × 10⁻⁸ | 4.32 × 10⁻² | 4.32 | [48] |
| TNFα | 2.50 × 10⁻⁸ | 1.29 × 10⁻² | 55.45 | [48] |
| IL13 | 3.20 × 10⁻⁸ | 1.08 × 10⁻² | 12.47 | [48] |
| MCP1 | 0 | 1.73 × 10⁻¹ | 1.73 | [48] |
Table 2.
Model cell types and number.
| Cell Type | Cell Number per Alveolus 1 | Source |
|---|---|---|
| AEC 1 | 41 | [57] |
| AEC 2 | 69 | [57] |
| M1 | 13 | [57] |
| M2 | 12 | [57] |
| Fibroblasts | 24 | [48,57] |
| Myofibroblasts | 36 2 | [48,57] |
| M0 3 | 65 | [48,57] |
Table 3.
Agents behaviors.
| Secretion | Proliferation | Differentiation | Activation | Apoptosis | |
|---|---|---|---|---|---|
| AEC2_TNFaSecretion | M2_PDGFSecretion | F_Proliferate | AEC21_Differentiation | AEC2_Activation | Apoptosis |
| AEC2_MCP1Secretion | M2_MMPSecretion | F_Addition | F_MF_Differentiation | ||
| AEC2_FGF2Secretion | M2_TIMPSecretion | AEC2_Proliferate | M01_Differentiation | ||
| AEC2_TGFbSecretion | M2_TGFbSecretion | M12_Differentiation | |||
| F_TGFbSecretion | M2_IL13Secretion | M21_Differentiation | |||
| F_ECMSecretion | M1_TNFaSecretion | ||||
| MF_ECMSecretion |
Publisher’s Note: MDPI stays neutral with regard to jurisdictional claims in published maps and institutional affiliations. |
© 2022 by the authors. Licensee MDPI, Basel, Switzerland. This article is an open access article distributed under the terms and conditions of the Creative Commons Attribution (CC BY) license (https://creativecommons.org/licenses/by/4.0/).
Share and Cite
MDPI and ACS Style
Cogno, N.; Bauer, R.; Durante, M. A 3D Agent-Based Model of Lung Fibrosis. Symmetry 2022, 14, 90. https://doi.org/10.3390/sym14010090
AMA Style
Cogno N, Bauer R, Durante M. A 3D Agent-Based Model of Lung Fibrosis. Symmetry. 2022; 14(1):90. https://doi.org/10.3390/sym14010090
Chicago/Turabian StyleCogno, Nicolò, Roman Bauer, and Marco Durante. 2022. "A 3D Agent-Based Model of Lung Fibrosis" Symmetry 14, no. 1: 90. https://doi.org/10.3390/sym14010090
Note that from the first issue of 2016, this journal uses article numbers instead of page numbers. See further details here.