The Effect of Prolonged Running on the Symmetry of Biomechanical Variables of the Lower Limb Joints


1
Faculty of Sports Science, Ningbo University, Ningbo 315211, China
2
Research Academy of Grand Health, Ningbo University, Ningbo 315211, China
3
Auckland Bioengineering Institute, University of Auckland, Auckland 1010, New Zealand
4
Faculty of Informatics, Eötvös Loránd University, H-1053 Budapest, Hungary
5
Department of Sport, Physical Education and Health, Hong Kong Baptist University, Hong Kong 999077, China
*
Author to whom correspondence should be addressed.
Symmetry 2020, 12(5), 720; https://doi.org/10.3390/sym12050720
Submission received: 8 March 2020
/
Revised: 22 April 2020
/
Accepted: 1 May 2020
/
Published: 2 May 2020
Abstract
:The aim of this study was to examine whether there are kinematic and kinetic differences in the lower limb and whether the symmetry of the lower extremities is different after prolonged-running. Fifteen healthy male amateur runners (age: 22 ± 1 years, height: 173 ± 8 cm, mass: 65 ± 7 kg, BMI: 21.62 ± 2 kg/m2) were recruited as participants for this study. A Vicon eight-camera motion capture system and Kistler force plate were used to collect kinematic and kinetic parameters. A motorized treadmill, 15-point Borg scale and heart rate bands were used to monitor fatigue during a running-induced fatigue protocol. Paired sample T tests were used to check statistical difference (p = 0.05) between the lower limbs and the symmetry changes in pre-fatigue and post-fatigue running sessions. The symmetry angle (SA) of the knee flexion angle, hip flexion angle and hip extension angle in post-fatigue was significantly greater than in pre-fatigue, increasing by 4.32%, 10.71%, and 23.12%, respectively. Moreover, the SA of hip flexion moment increased by 2.61%. However, the knee extension velocity and hip flexion velocity became more symmetrical than in pre-fatigue (p < 0.05), the SA decreased by 5.91% and 5.45%, respectively. Differences in limb function during post-fatigue may lead to changes of symmetry in the lower limbs. The variables of asymmetry may be used as a compensation mechanism to maintain gait stability. Physical therapy assessment of fatigue injuries and long-distance running training programs may want to consider the changes in symmetry due to limb dominance.
1. Introduction
Symmetry is one of the basic concepts in mathematics and physics. In the study of biology, the usefulness of symmetry is often applied to morphology and systematics [1]. However, the morphological and functional characteristics of the human body are not completely symmetrical [2]. Previous research has shown that asymmetry has been observed in the upper limbs, with ~90% of individuals having more muscular asymmetry in the right upper limbs [3]. This may be caused by evolutionary characteristics and genetic predispositions [2].
Biomechanical studies on gait asymmetry have been focused on the clinical diagnosis of pathological populations [4], prosthetic technology of the disabled population [5], and performance and injury related research [6]. The gait of healthy populations was found to be not completely symmetrical [7], such as joint moments [8], joint angles [9], time parameters and vertical ground reactive forces (GRF) [10] in running gait. Sadeghi et al. (2003) studied two consecutive gait cycles in people without impairments and found that there was a significant difference between each peak muscle moment value [7]. As reported, the symmetry of the lower limb joints moment was not affected by running speed [11]. Previous studies on gait biomechanics generally assumed that the lower limbs were symmetrical, and only a unilateral limb was selected in the study to simplify the complexity of data collection [12]. Potential error caused by bilateral limb asymmetry was thus neglected [13]. The asymmetry data obtained between the limbs indicated that the performance characteristics of both limbs were different [13]. An understanding of the bilateral differences in the lower limbs and relationships with running biomechanics is of great significance for injury prevention and subsequent treatments and rehabilitation [4]. The asymmetry of running gait may lead to compensation in one limb in favor of the other limb with increasing loadings and muscle contraction dynamics [14]. Lower limb biomechanical studies of running injuries compared the injured limbs of injured runners with the dominant limbs of healthy runners [15]. However, the biomechanical parameters of the dominant and non-dominant lower limbs in running are not completely symmetrical [16], the default gait symmetry may affect the experimental outcomes [15]. Therefore, limb dominance may be used to explain limb asymmetry [13]. Niu et al. showed that the injury risk of the dominant leg was greater than that of the non-dominant leg [16]. Furthermore, inter-limb asymmetry was more apparent in the movement patterns with preferred limb dominance [17].
Exhaustion during prolonged running inevitably causes neuromuscular fatigue, which further leads to lower limb biomechanical changes [18]. Studies of biomechanical variability in post-fatigued are usually applied to unilateral limbs. As reported, a reduced body posture control was observed with running fatigue [19], which usually manifests itself as the change of biomechanical parameters [20]. Joint power generation and absorption are commonly used to quantify gait propulsion and stabilization, respectively [13]. Farris et al. found the net positive power of the bilateral lower limb joints was symmetrical in healthy gait [21]. Previous studies reported that running fatigue can increase the maximum knee extension angle, resulting in an increased medial arch load in the foot [22]. Researchers refer to this potential change as gait variability, which is a functional feature of the human regulation process [23]. Degache et al. reported that running fatigue reduces ankle stiffness and increases the range of motion (ROM) of the knee and hip joints, but with no significant change in joint moments [18]. Nevertheless, little attention has been paid to the relationship between fatigue and gait symmetry. Brown et al. [15] found no correlation between fatigue and limb dominance while comparing kinematic and dynamic changes in pre-fatigue and post-fatigue of the bilateral lower limbs. Wong et al. [24] demonstrated that prolonged walking increases the asymmetry and variability of the ankle joint in the elderly. Recent studies showed that gait symmetry in heathy populations changed with fatigue [8]. However, whether fatigue reduces symmetry in novice runners has not been fully investigated. Therefore, a potential difference in the running fatigue related biomechanical asymmetry in the lower limbs was proposed in the current study.
The purpose of this study was to explore whether there was asymmetry in the kinematics and kinetics of the joints in the lower extremities in pre-fatigue and post-fatigue and whether fatigue would increase asymmetry. Therefore, three hypotheses were proposed for this study: (1) There is biomechanical asymmetry in both limbs pre-fatigue. (2) There is biomechanical asymmetry in both limbs post-fatigue. (3) The biomechanical symmetry of both lower limbs changes (either increases towards 0% or decreases towards 100%) during post- fatigue running.
2. Materials and Methods
2.1. Subjects
Fifteen healthy male amateur runners volunteered as subjects in this study (age: 22 ± 1 years, height: 173 ± 8 cm, mass: 65 ± 7 kg, BMI: 21.62 ± 2 kg/m2). The dominant lower limb was defined as the preferred limb when kicking a ball. All participants had to meet the following requirements: (1) Each subject was an amateur rearfoot striking runner (the subjects ran less than 2–3 times a week for a running time <45 min and/or a running distance <10 km) [25]. (2) There was no lower limb deformity or general body deformity. (3) There had been no history of any injury in the trunk, pelvis or lower limbs in the previous 6 months prior to the study. (4) The right- side limb was the dominant limb. The study was approved by the Ethics Committee of the Research Institute in Ningbo University.
2.2. Test Protocol
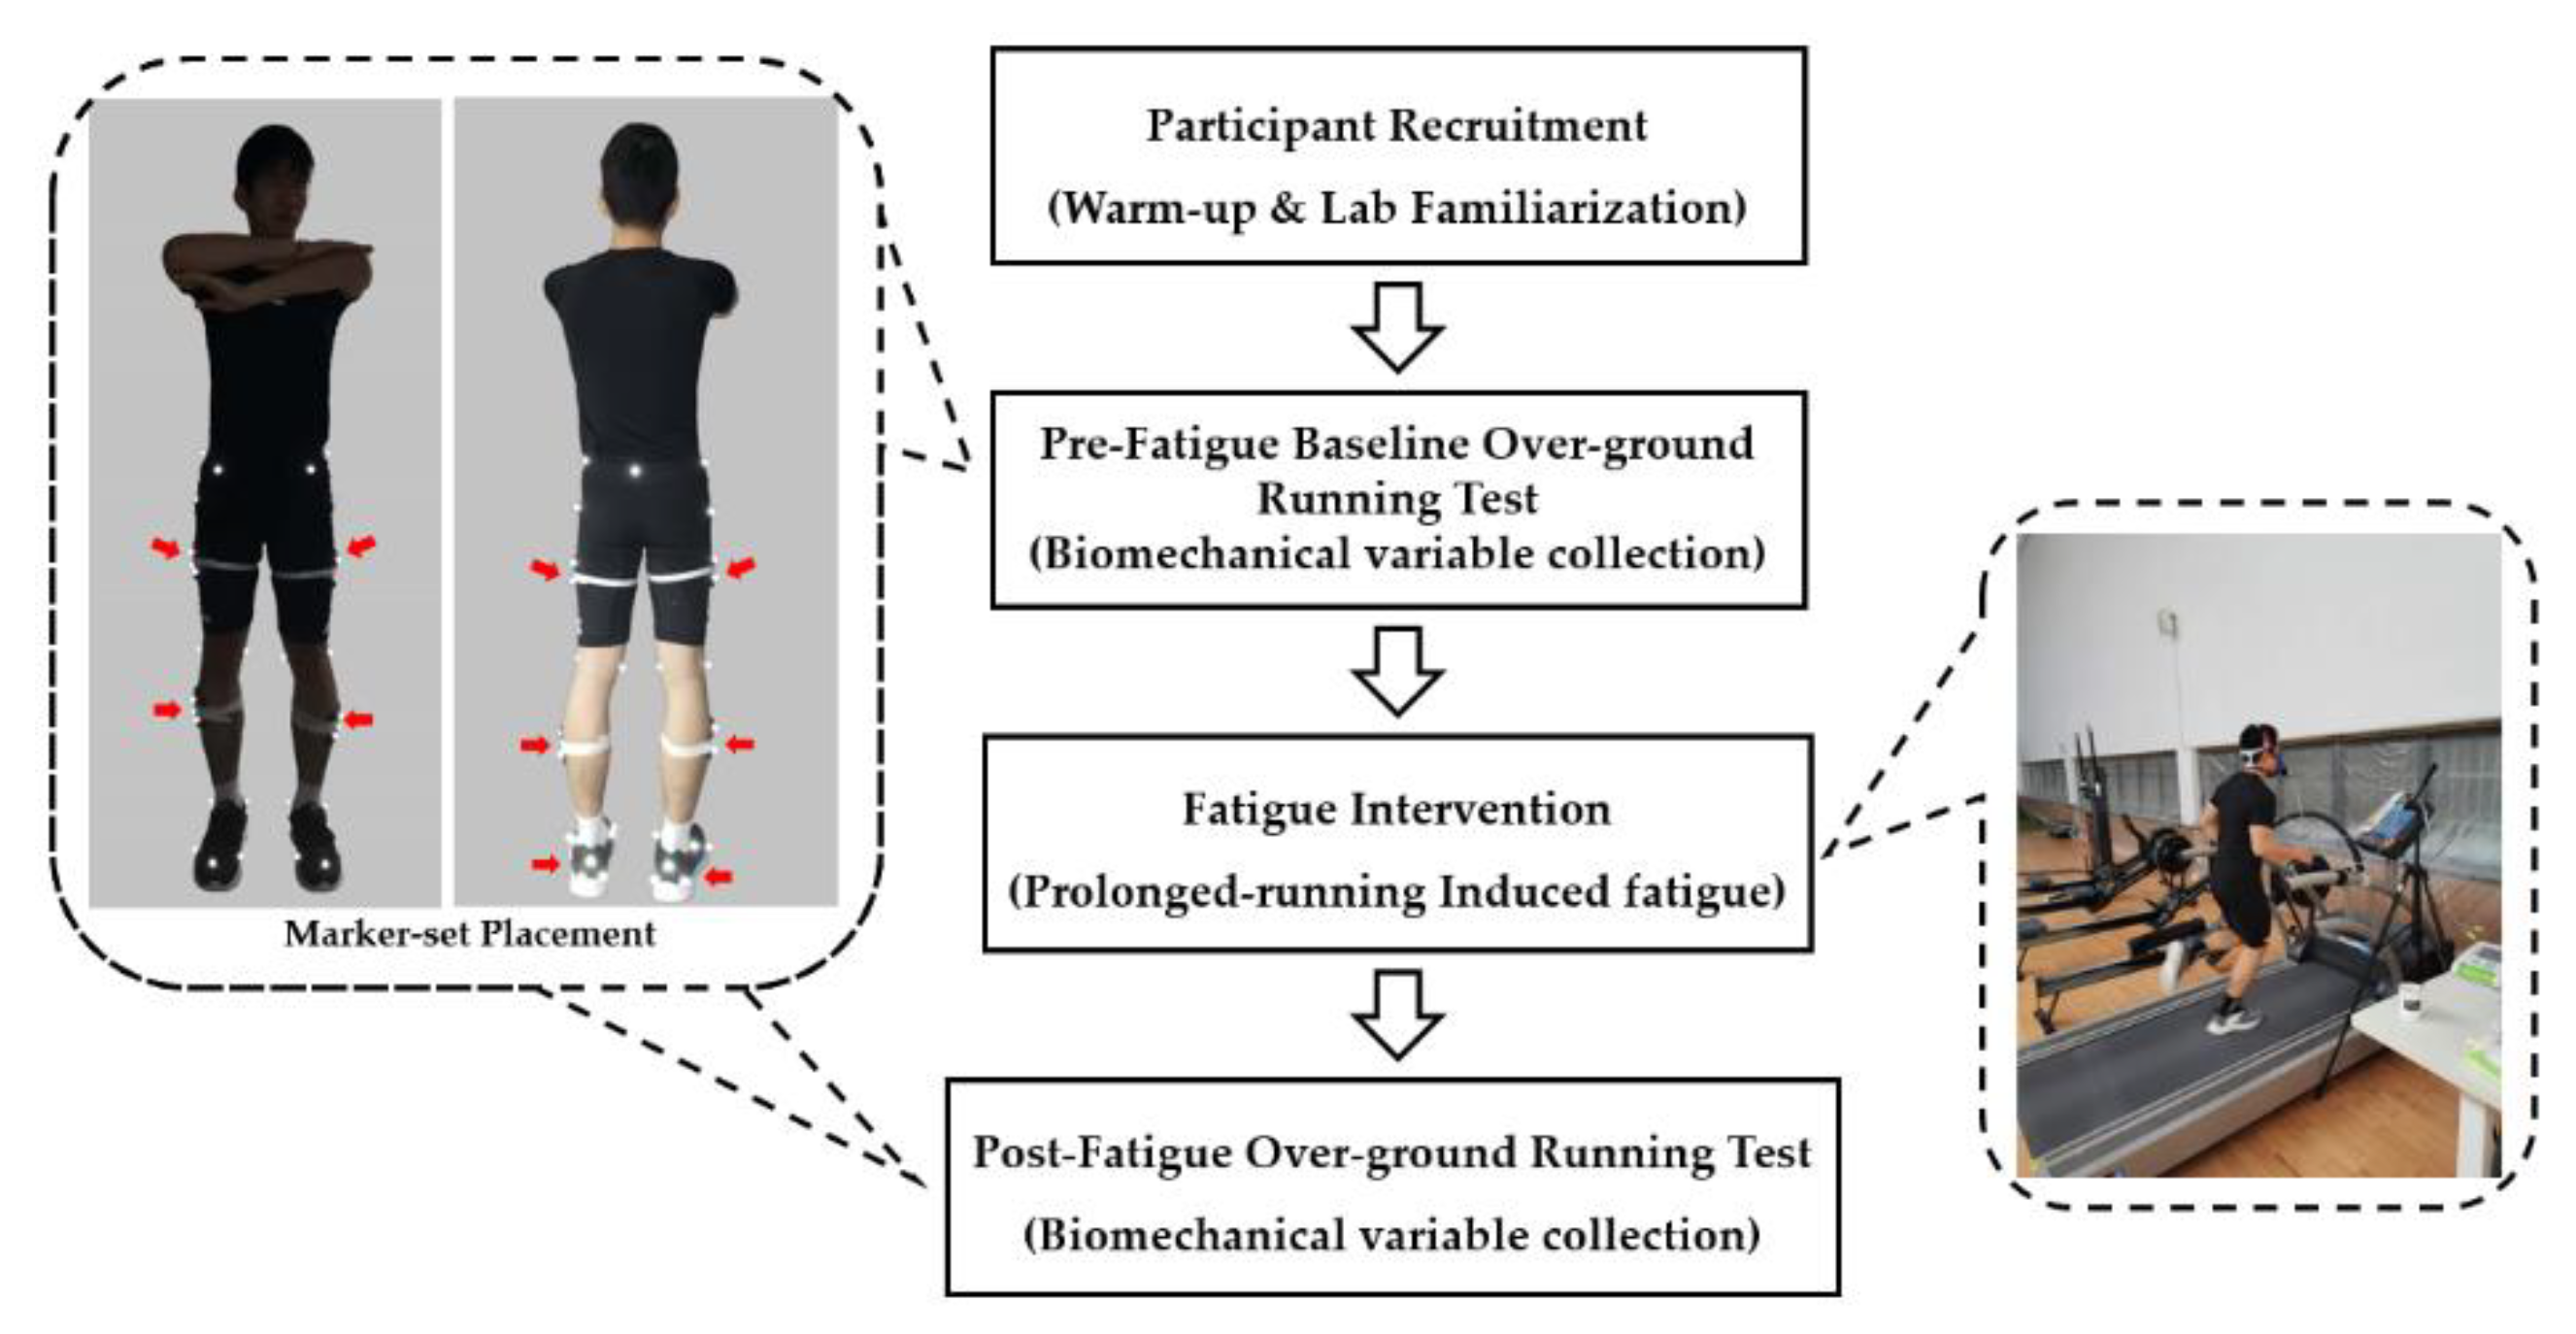
As presented in Figure 1, once participants were recruited, warm up and lab familiarization were conducted prior to biomechanical data collection. For the over-ground running test, the pre-fatigue baseline biomechanics data were collected. Following the previously established prolonged-running protocol [25], running-induced fatigue was conducted. For the over-ground running test, the post-fatigue biomechanics data were collected.
2.2.1. Biomechanical Variable Collection
As illustrated in Figure 1, the marker-set includes twenty-one infrared reflective markers and six infrared rigid clusters (highlighted in red), fixed onto both lower limbs in accordance with human anatomical landmarks to define the hip, knee and ankle joints [26]. The over-ground running test was conducted using an in-lab 25 m runway, facilitated with an eight- camera motion capture system (Vicon Metrics Ltd., Oxford, United Kingdom) and a Force plate (Kistler, Winterthur, Switzerland). The Vicon system was used to record the kinematics at a frequency of 200 Hz, and the force plate embedded in the middle of a 25-m runway was used to record the ground reaction force (GRF) at a frequency of 1000 Hz.
Participants were required to run at a comfortable pace during the over-ground running test pre- and post-fatigue intervention. A full foot (heel-toe) contact with the force plate was defined as a valid trial. Trials with adjusting steps, targeting the force plate or landing the force plate improperly (such as forefoot strike) were excluded for further data analysis. Four valid trials for the dominant and non-dominant limbs were collected. All participants performed the same biomechanical collection procedures in 5 min for the test setup (markers placement) after the running-induced fatigue protocol in the post-fatigue session, following our recent study design [27].
2.2.2. Running-Induced Fatigue Protocol
Prior to the prolonged running induced fatigue protocol, participants were introduced to the Borg Rating of the 15-point Borg scale (Ratings of Perceived Exertion, RPE, 6–20 Borg’s scale) [28]. As presented in Figure 1, a motorized treadmill (Satun h/p/cosmos, Nussdorf- Traunstein, Nußdorf, Germany) was set to a slope of 1% to mimic the outdoor running environment [29]. Participants then performed running as per the previously established running-induced fatigue protocol [25]. The 15-point Borg scale and heart rate monitor (Polar RS100, Polar Electro Oy, Woodbury, NY, USA) was used to record the perceived exertion and heart rate changes per minute during the fatigue intervention. As reported, either two consecutive minutes of 90% of maximum heart rate (HRmax = 220-age) or RPE > 17 (very hard) were considered as the point of human fatigue [25]. Participants reported RPE scores in the last 10-s of every minute during the intervention, and the corresponding heart rate was recorded. Initially, participants walked on a treadmill at a speed of 6 km/h. Then, the running speed was iteratively increased by 1 km/h every two minutes until RPE scores reached 13 (somewhat hard), which was defined as steady state speed. Participants then continued to run at the given steady state speed until reaching the fatigue point which lasted for at least two minutes. RPE scores at the start and end of the prolonged running induced fatigue protocol were selected for statistical comparison.
2.3. Data Processing
This study focused on the variation of the sagittal plane as of particular interest, due to the reported dominant variation in the sagittal plane during running [30]. A customized function in Visual 3D (c-motion Inc., Germantown, MD, USA) was used to process and calculate variables in the sagittal plane of the hip, knee and ankle joints using C3D files generated from Vicon Nexus Software. Bi-directional second-order low-pass Butterworth filters were used for the de-noising process of marker trajectories and the force plate signal [15]. The cut-off frequencies were 6 Hz and 50 Hz, respectively [31]. The models were first created using the recorded static marker position with the measured participants’ anthropometric parameters (height and mass). A participant’s individualized model was created with a defined joint motion axis and a scaled inertia center in each segment (pelvis, thigh, shank and foot). The inverse kinematics algorithm was performed in Visual 3D to calculate the joint angles and angular velocities. The calculated joint angles and collected ground reaction force were inputted to run the inverse dynamics algorithm, thus obtaining the joint moments.
Joint stiffness (Kjoint) (Equation (1)), as a discrete parameter, was used to evaluate and quantify the interaction between joint torque and joint range of motion [32].
Kjoint=ΔM/RoM
ΔM was defined as the change of ankle, knee, and hip joint moment during the stance phase. RoM was defined as the joint range of motion during stance [33].
The joint power (Pjoint) (Equation (2)) is usually used to indicate the type of action at a given point during movement [34].
Pjoint = Mjoint × ωjoint
Mjoint and ωjoint were defined as instantaneous joint moment and joint angle velocity, respectively [35]. For averaging purposes, the joint moment and power of each subject was normalized using body mass. Discrete maximum and minimum values of joint angle, joint angle velocity, joint moment, and joint power were selected for the statistics.
The time-varying data of the joint angles, moments, and powers were interpolated to a length of 100 data points for comparative analysis and statistics. Moment and power parameters were normalized using the respective weights. The biomechanical variables were averaged across each of the four successful trials for both pre-fatigue and post-fatigue conditions. The symmetry angle (SA) (Equation (3)), previously reported for right versus left parameters comparison [36,37], was used to evaluate the biomechanical symmetry of the subjects’ dominant limb and non-dominant limb.
X represents the value of the biomechanical variables in the right or left lower limb. A value of 0% for the SA indicates that the variable is complete symmetry [36], and 100% indicates completely asymmetry. In order to make the SA of each variable easier for comparison, all values were rectified to positive [37].
2.4. Statistical Analysis
SPSS Statistical Software (Version 19; SPSS, Inc., Chicago, IL, USA) was used to analyze the significance of biomechanical parameters in the dominant limb and non-dominant limb, and the SA significance in pre-fatigue and post-fatigue. The Shapiro-Wilks test was first used to check the normality of the data. The paired sample t-test was used to check the significance in the parameters that were normally distributed. The Wilcoxon test was used to check the parameters that were non- normally distributed. Repeated Measures Analysis of Variance was used to examine the significance of the RPE scores during running-induced fatigue intervention. The significance level was defined at p < 0.05.
3. Results
The RPE scores was 6.6 ± 0.13 during the pre-prolonged-running induced fatigue test session, which was significantly lower than the scores of the post running-induced fatigue session (18.33 ± 0.16, p < 0.05). The significant differences of the biomechanical variables between dominant and non-dominant limb in pre-fatigue are presented in Figure 2. For kinematics variables, the minimum value of hip extension angle (p = 0.02) and ankle plantar flexion angle velocity (p = 0.03) of the dominant limb were significantly larger than the non- dominant limb. The maximum value of the hip flexion angle was significantly lower in the dominant limb. For kinetic variables, the minimum value of hip extension power (p = 0.02) of the non-dominant limb was significantly lower than the dominant limb.
The significant differences of biomechanical variables between the dominant and non-dominant limb in post-fatigue are presented in Figure 3. For kinematic variables, the minimum value of ankle plantar flexion angle (p ≤ 0.01) and knee extension angle velocity (p = 0.02) of the dominant limb were significantly larger than the non-dominant limb. The maximum value of ankle dorsiflexion angle (p ≤ 0.01) of the dominant limb were significantly larger than the non-dominant limb. For kinetics variables, the minimum value of hip flexion power (p = 0.02) of the non-dominant limb were significantly lower than the dominant limb.
Significant differences in SA of ankle, knee, and hip biomechanical variables between pre-fatigue and post-fatigue are presented in Table 1, Table 2 and Table 3. For kinematic variables, the SA minimum of knee flexion (p = 0.02) and hip extension (p = 0.02) angle during post-fatigue were significantly larger than pre-fatigue session. However, the SA of maximum knee extension angle velocity (p = 0.02) and hip flexion angle velocity (p ≤ 0.01) during post- fatigue were significantly lower than the pre-fatigue session. The SA of the maximum of hip flexion angle (p ≤ 0.01) in post-fatigue were significantly larger than the pre-fatigue session. For kinetic variables, the SA of the maximum hip flexion moment (p = 0.02) in post-fatigue was significantly larger than the pre-fatigue session.
4. Discussion
In the current study, findings indicated that the biomechanical parameters in the dominant and non-dominant lower limbs were asymmetric between pre-fatigue and post- fatigue. These findings are consistent with hypothesis (1), (2) and (3). Specifically, the hip joint exhibited larger extension and smaller flexion in the dominant limb while the ankle joint has a smaller plantarflexion velocity during pre-fatigue over-ground running. The extension power of the hip joint was significantly lower than the non-dominant limb. The ankle dorsiflexion angle and knee extension velocity of the dominant limb are larger than the non- dominant limb, but the ankle plantarflexion angle and hip flexion moment were lower during the pre-fatigue session. RPE scores during post-fatigue were significantly greater than pre-fatigue, which suggested that the human body was in a fatigue state after the running- induced fatigue intervention protocol. The biomechanical symmetry of both lower limbs was changed in post-fatigued. The SA of the knee flexion angle, hip flexion angle, hip extension angle, and hip flexion moment increased during post-fatigue. Interestingly, the SA of the knee extension velocity and hip flexion velocity reduced significantly during post- fatigue, suggesting the symmetry of the flexion velocity in the knee joint and hip joint enhanced significantly.
Congenital slight asymmetry exists in the form and function of the human body [2]. The difference in this study, which was observed in the pre-fatigue session, may be related to the body’s biomechanical and neuromuscular asymmetry at baseline [13]. This study found that the left hip had a greater flexion, extension angle in the contact phase during pre-fatigue following over- ground running. This might be due to the relatively weak neuromuscular control of the non-dominant limb. Thereby, the range of motion of the hip joint was increased. The hip extension power of the dominant limb was significantly lower than that of the non-dominant limb, suggesting that the musculoskeletal system of the dominant limb had a better load absorption capacity. As a result, the non-dominant limb may be prone to damage from overuse [38]. Differences in bilateral limb kinetics were found to influence gait variations [2]. Excessive ankle flexion angle velocity of the dominant limb could provide forward acceleration for the body center of mass during stance, thus contributing to the propelling function of the dominant limb [13].
Generally, the propelling effect of the dominant limb and the stabilizing effect of the non- dominant limb are considered to be some of the reasons contributing to gait asymmetry [13]. The left lower limb showed a greater flexion moment in this study. Therefore, the asymmetry of the hip flexion moment was significantly enlarged. This can be explained by the fact that the hip flexion muscles of the non-dominant limb make a greater contribution to the control of body balance during stable gait [7]. A smaller ankle dorsiflexion angle was observed in the post-fatigue session. This may be due to the fact that the non-dominant limb, as the stable limb plantar flexors uses eccentric contractions to suppress the tibia during the forward progression over the foot, thus maintaining the balance of the center of gravity [39]. The knee maximum flexion velocity of the non-dominant limb was greater than the dominant limb, which are consistent with previous studies [8]. However, the knee maximum extension velocity was greater in the dominant limb, which may be due to the greater contribution from propulsion, which may be associated with the functional nature of the dominant limb [13].
While comparing the symmetry changes of the lower limbs during pre-fatigue and post- fatigue sessions, Brown et al. observed that the symmetry did not change as a result of fatigue [15]. However, the symmetry in a few variables during post-fatigue was significantly different from the findings of this study. In general, gait variability increased from fatigue-intervention [40]. The asymmetry of knee flexion angle, hip flexion angle, and hip extension angle was significantly enlarged. These results might be due to insufficient motor neuron drive by the central nervous system and peripheral changes at the muscular level under the fatigue condition [41,42]. Therefore, the biomechanical variability due to fatigue is not identical in both lower limbs. The risk of injury related to body control will increase [19]. In addition, the symmetry of the flexion velocity of the knee joint and hip joint was significantly enhanced. This may be explained as a compensation mechanism produced by the body during post-fatigue in order to maintain stability [40].
Some limitations should be considered in this study. First, the running-induced fatigue intervention was conducted on a treadmill while the biomechanics test was performed over the ground in the lab. Symmetrical variations in the sagittal plane were mainly investigated as the variable of interest. The inclusion of other planes may reveal comprehensively the inter-limb symmetry of asymmetry. An interval of no more than five minutes exists at the end of the fatigue protocol and at the start of the post-fatigue over-ground running test. Another limitation was that the location of the anatomical point was determined by palpation in this study, which may affect the accuracy of the marker calibration and the movement of the skin may reduce data accuracy. The final limitation was that only male participants were recruited, and findings are not generalizable for females, which needs to be considered in future studies.
5. Conclusions
The current study found that due to fatigue from prolonged running, the symmetry of the knee flexion angle, hip flexion angle, hip extension angle, and the hip flexion moment were reduced, while the knee extension velocity and hip flexion velocity were enhanced during running stance. These findings provide preliminary evidence that fatigue alters lower limb symmetry during running gait. According to the difference in motor function from limb dominance, the amateur runners’ lower limbs showed symmetry changes from prolonged running fatigue. The findings provide implications for potential fatigue-related injury risk and provide a reference for possibly reducing injury from long-distance running performance.
Author Contributions
Conceptualization, Z.G., Q.M., and Y.G.; methodology, Z.G. and Y.G.; software, Q.M.; validation, G.F., J.S.B.; formal analysis, Z.G., Q.M., and Y.G.; investigation, Z.G., Q.M., and Y.G.; resources, Y.G.; writing—original draft preparation, Z.G. and G.F.; writing—review and editing, J.S.B. and Y.G.; project administration, Y.G.; funding acquisition, Y.G. All authors have read and agreed to the published version of the manuscript.
Funding
This research was founded by the National Natural Science Foundation of China (81772423), National Key R&D Program of China (2018YFF0300903), and K. C. Wong Magna Fund in Ningbo University.
Conflicts of Interest
The authors declare no conflict of interest.
References
- Polak, M.; Trivers, R. The science of symmetry in biology. Trends Ecol. Evol. 1994, 9, 122–124. [Google Scholar] [CrossRef]
- Kujanova, M.; Bigoni, L.; Velemínská, J.; Velemínský, P. Limb bones asymmetry and stress in medieval and recent populations of Central Europe. Int. J. Osteoarchaeol. 2008, 18, 476–491. [Google Scholar] [CrossRef]
- Polk, J.D.; Stumpf, R.M.; Rosengren, K. Limb dominance, foot orientation and functional asymmetry during walking gait. Gait Posture 2017, 52, 140–146. [Google Scholar] [CrossRef] [PubMed] [Green Version]
- Kim, C.M.; Eng, J.J. Symmetry in vertical ground reaction force is accompanied by symmetry in temporal but not distance variables of gait in persons with stroke. Gait Posture 2003, 18, 23–28. [Google Scholar] [CrossRef]
- Song, Y.; Zhang, W.; Zhao, L.; Sun, D.; Huang, Y.; Gu, Y. Sports-related injuries sustained by disabled athletes in Winter Paralympic Games: A systematic review. J. Med. Imaging Health Inform. 2020, 10, 1136–1143. [Google Scholar] [CrossRef]
- Schache, A.G.; Wrigley, T.V.; Baker, R.; Pandy, M.G. Biomechanical response to hamstring muscle strain injury. Gait Posture 2009, 29, 332–338. [Google Scholar] [CrossRef]
- Sadeghi, H. Local or global asymmetry in gait of people without impairments. Gait Posture 2003, 17, 197–204. [Google Scholar] [CrossRef]
- Radzak, K.N.; Putnam, A.M.; Tamura, K.; Hetzler, R.K.; Stickley, C.D. Asymmetry between lower limbs during rested and fatigued state running gait in healthy individuals. Gait Posture 2017, 51, 268–274. [Google Scholar] [CrossRef]
- Haugen, T.A.; Danielsen, J.; McGhie, D.; Sandbakk, Ø.; Ettema, G. Kinematic stride cycle asymmetry is not associated with sprint performance and injury prevalence in athletic sprinters. Scand. J. Med. Sci. Sports 2017, 28, 1001–1008. [Google Scholar] [CrossRef]
- Zifchock, R.A.; Davis, I.; Hamill, J. Kinetic asymmetry in female runners with and without retrospective tibial stress fractures. J. Biomech. 2006, 39, 2792–2797. [Google Scholar] [CrossRef]
- Furlong, L.-A.; Egginton, N.L. Kinetic asymmetry during running at preferred and non-preferred speeds. Med. Sci. Sports Exerc. 2018, 50, 1241–1248. [Google Scholar] [CrossRef] [PubMed] [Green Version]
- Laughlin, W.A.; Weinhandl, J.T.; Kernozek, T.W.; Cobb, S.C.; Keenan, K.; O’Connor, K.M. The effects of single-leg landing technique on ACL loading. J. Biomech. 2011, 44, 1845–1851. [Google Scholar] [CrossRef] [PubMed]
- Sadeghi, H.; Allard, P.; Prince, F.; Labelle, H. Symmetry and limb dominance in able-bodied gait: A review. Gait Posture 2000, 12, 34–45. [Google Scholar] [CrossRef]
- Levine, D.; Richards, J.; Whittle, M.W. Whittle’s Gait Analysis-E-Book; Elsevier Health Sciences: Amsterdam, The Netherlands, 2012. [Google Scholar]
- Brown, A.M.; Zifchock, R.A.; Hillstrom, H.J. The effects of limb dominance and fatigue on running biomechanics. Gait Posture 2014, 39, 915–919. [Google Scholar] [CrossRef]
- Niu, W.; Wang, Y.; He, Y.; Fan, Y.; Zhao, Q. Kinematics, kinetics, and electromyogram of ankle during drop landing: A comparison between dominant and non-dominant limb. Hum. Mov. Sci. 2011, 30, 614–623. [Google Scholar] [CrossRef]
- Schiltz, M.; Lehance, C.; Maquet, D.; Bury, T.; Crielaard, J.-M.; Croisier, J.-L. Explosive Strength Imbalances in Professional Basketball Players. J. Athl. Train. 2009, 44, 39–47. [Google Scholar] [CrossRef] [Green Version]
- Luo, Z.; Zhang, X.; Wang, J.; Yang, Y.; Xu, Y.; Fu, W. Changes in Ground Reaction Forces, Joint Mechanics, and Stiffness during Treadmill Running to Fatigue. Appl. Sci. 2019, 9, 5493. [Google Scholar] [CrossRef] [Green Version]
- Winter, S.C.; Gordon, S.; Watt, K. Effects of fatigue on kinematics and kinetics during overground running: A systematic review. J. Sports Med. Phys. Fit. 2016, 57, 887–899. [Google Scholar]
- Anbarian, M.; Esmaeili, H.; Esmaili, H. Effects of running-induced fatigue on plantar pressure distribution in novice runners with different foot types. Gait Posture 2016, 48, 52–56. [Google Scholar] [CrossRef]
- Farris, D.J.; Sawicki, G.S. The mechanics and energetics of human walking and running: A joint level perspective. J. R. Soc. Interface 2011, 9, 110–118. [Google Scholar] [CrossRef] [Green Version]
- Fourchet, F.; Kelly, L.A.; Horobeanu, C.; Loepelt, H.; Taiar, R.; Millet, G.P. High-Intensity Running and Plantar-Flexor Fatigability and Plantar-Pressure Distribution in Adolescent Runners. J. Athl. Train. 2015, 50, 117–125. [Google Scholar] [CrossRef] [Green Version]
- Hanley, B.; Tucker, C.B. Gait variability and symmetry remain consistent during high-intensity 10,000 m treadmill running. J. Biomech. 2018, 79, 129–134. [Google Scholar] [CrossRef] [PubMed] [Green Version]
- Wong, D.W.-C.; Lam, W.-K.; Lee, W.C.-C. Gait asymmetry and variability in older adults during long-distance walking: Implications for gait instability. Clin. Biomech. 2020, 72, 37–43. [Google Scholar] [CrossRef]
- Koblbauer, I.F.; Van Schooten, K.; Verhagen, E.; Van Dieën, J.H. Kinematic changes during running-induced fatigue and relations with core endurance in novice runners. J. Sci. Med. Sport 2014, 17, 419–424. [Google Scholar] [CrossRef] [PubMed]
- Hannigan, J.; Pollard, C.D. Differences in running biomechanics between a maximal, traditional, and minimal running shoe. J. Sci. Med. Sport 2019, 23, 15–19. [Google Scholar] [CrossRef] [Green Version]
- Mei, Q.; Gu, Y.; Xiang, L.; Baker, J.S.; Fernandez, J. Foot Pronation Contributes to Altered Lower Extremity Loading After Long Distance Running. Front. Physiol. 2019, 10, 573. [Google Scholar] [CrossRef] [PubMed]
- Borg, G. Borg’s Perceived Exertion and Pain Scales; Human Kinetics: New Milford, CT, USA, 1998. [Google Scholar]
- Fourchet, F.; Girard, O.; Kelly, L.A.; Horobeanu, C.; Millet, G.P. Changes in leg spring behaviour, plantar loading and foot mobility magnitude induced by an exhaustive treadmill run in adolescent middle-distance runners. J. Sci. Med. Sport 2015, 18, 199–203. [Google Scholar] [CrossRef]
- Bezodis, I.N.; Kerwin, D.G.; Salo, A.I.T. Lower-Limb Mechanics during the Support Phase of Maximum-Velocity Sprint Running. Med. Sci. Sports Exerc. 2008, 40, 707–715. [Google Scholar] [CrossRef]
- Winter, D.A. Biomechanics and Motor Control of Human Movement; Wiley: New York, NY, USA, 2009. [Google Scholar]
- Günther, M.; Blickhan, R. Joint stiffness of the ankle and the knee in running. J. Biomech. 2002, 35, 1459–1474. [Google Scholar] [CrossRef]
- Butler, R.J.; Crowell, H.P.; Davis, I.M. Lower extremity stiffness: Implications for performance and injury. Clin. Biomech. 2003, 18, 511–517. [Google Scholar] [CrossRef]
- Pease, W.; Bowyer, B.; Kadyan, V. Human walking, Physical Medicine and Rehabilitation, Principles and Practice, 4th ed.; Lippincott Williams and Wilkins: Philadelphia, PA, USA, 2005; pp. 155–168. [Google Scholar]
- Sadeghi, H.; Allard, P.; Duhaime, M. Functional gait asymmetry in able-bodied subjects. Hum. Mov. Sci. 1997, 16, 243–258. [Google Scholar] [CrossRef]
- Zifchock, R.A.; Davis, I.; Higginson, J.; Royer, T. The symmetry angle: A novel, robust method of quantifying asymmetry. Gait Posture 2008, 27, 622–627. [Google Scholar] [CrossRef] [PubMed]
- Exell, T.A.; Irwin, G.; Gittoes, M.J.; Kerwin, D.G. Implications of intra-limb variability on asymmetry analyses. J. Sports Sci. 2012, 30, 403–409. [Google Scholar] [CrossRef] [PubMed]
- Zifchock, R.A.; Davis, I.; Higginson, J.; McCaw, S.; Royer, T. Side-to-side differences in overuse running injury susceptibility: A retrospective study. Hum. Mov. Sci. 2008, 27, 888–902. [Google Scholar] [CrossRef]
- Gray, E.G.; Basmajian, J.V. Electromyography and cinematography of leg and foot (“normal” and flat) during walking. Anat. Rec. Adv. Integr. Anat. Evol. Boil. 1968, 161, 1–15. [Google Scholar] [CrossRef]
- Meardon, S.; Hamill, J.; Derrick, T.R. Running injury and stride time variability over a prolonged run. Gait Posture 2011, 33, 36–40. [Google Scholar] [CrossRef]
- Gandevia, S.C. Spinal and supraspinal factors in human muscle fatigue. Physiol. Rev. 2001, 81, 1725–1789. [Google Scholar] [CrossRef]
- Jiang, C. The Effect of Basketball Shoe Collar on Ankle Stability: A Systematic Review and Meta-Analysis. Phys. Act. Health 2020, 4, 11–18. [Google Scholar] [CrossRef] [Green Version]
Figure 1.
Outline of the test protocol.

Figure 2.
Illustration of the significant difference in the parameters of the dominant and non-dominant lower limbs during pre-fatigue for the over-ground running test. Note: the dotted box indicates a statistically significant difference, p < 0.05. Left: Left lower limb (non-dominant). Right: Right (dominant) lower limb. The solid curve indicates the mean value at each time point. The shaded area indicates the standard deviation at each time point.

Figure 3.
Illustration of the significant difference in the parameters of the dominant and non-dominant lower limbs during post-fatigue for the over-ground running test. Note: the dotted boxes indicate a statistically significant difference, p < 0.05. Left: Left lower limb (non-dominant). Right: Right (dominant) lower limb. The solid curve indicates the mean value at each time point. The shaded area indicates the standard deviation at each time point.


Table 1.
The significance of symmetry angle (SA) in the variables of the ankle joint during pre- and post-fatigue session.
Table 1.
The significance of symmetry angle (SA) in the variables of the ankle joint during pre- and post-fatigue session.
| Joint Variables | Symmetry Angle (%) ± SD | ||
|---|---|---|---|
| Pre-Fatigue | Fatigue | p-Value | |
| Ankle | |||
| Dorsiflexion | 9.63 (6.98) | 13.67 (7.65) | 0.28 |
| Plantarflexion | 20.10 (12.53) | 21.66 (36.07) | 0.61 |
| Dorsiflexion velocity | 3.55 (3.36) | 3.61 (2.34) | 0.87 |
| Plantarflexion velocity | 5.19 (3.43) | 2.97 (3.32) | 0.11 |
| Dorsiflexion moment | 16.30 (14.54) | 22.45 (16.09) | 0.11 |
| Plantarflexion moment | 22.03 (20.49) | 28.69 (18.78) | 0.57 |
| Dorsiflexion power | 19.85 (16.73) | 26.98 (20.30) | 0.57 |
| Plantarflexion power | 18.67 (16.25) | 25.97 (19.59) | 0.50 |
| Stiffness | 18.66 (16.62) | 26.17 (19.59) | 0.31 |
Table 2.
The significance of SA in the variables of the knee joint during pre- and post-fatigue session.
Table 2.
The significance of SA in the variables of the knee joint during pre- and post-fatigue session.
| Joint Variables | Symmetry Angle (%) ± SD | ||
|---|---|---|---|
| Pre-Fatigue | Fatigue | p-Value | |
| Knee | |||
| Extension | 8.11 (7.36) | 22.25 (20.78) | 0.50 |
| Flexion | 4.66 (2.79) | 8.98 (4.23) | 0.02 * |
| Extension velocity | 8.94 (5.77) | 3.03 (1.70) | 0.02 * |
| Flexion velocity | 4.60 (4.58) | 4.39 (2.58) | 0.96 |
| Extension moment | 16.53 (13.18) | 29.17 (16.38) | 0.33 |
| Flexion moment | 14.87 (12.20) | 21.19 (15.37) | 0.19 |
| Extension power | 17.38 (9.50) | 16.48 (13.02) | 0.11 |
| Flexion power | 24.07 (13.88) | 25.47 (18.78) | 0.91 |
| Stiffness | 14.40 (12.71) | 22.06 (13.72) | 0.11 |
Note: “*” indicates the significance of SA in the bilateral lower limb (p < 0.05).
Table 3.
The significance of SA in the variables of hip joint during pre- and post- fatigue session.
Table 3.
The significance of SA in the variables of hip joint during pre- and post- fatigue session.
| Joint Variables | Symmetry Angle (%) ± SD | ||
|---|---|---|---|
| Pre-Fatigue | Fatigue | p-Value | |
| Hip | |||
| Flexion | 2.43 (1.71) | 13.14 (6.88) | 0.00 * |
| Extension | 18.12 (29.96) | 41.24 (34.76) | 0.02 * |
| Flexion velocity | 22.43 (16.47) | 16.98 (17.36) | 0.00 * |
| Extension velocity | 4.60 (4.58) | 4.39 (2.58) | 0.61 |
| Flexion moment | 3.01 (2.23) | 5.62 (3.37) | 0.02 * |
| Extension moment | 14.87 (12.20) | 21.19 (15.37) | 0.53 |
| Flexion power | 13.20 (12.91) | 22.11 (12.92) | 0.82 |
| Extension power | 13.12 (6.91) | 12.95 (8.85) | 0.91 |
| Stiffness | 6.04 (5.01) | 7.73 (8.46) | 0.53 |
Note: “*” indicates the significance of SA in the bilateral lower limb (p < 0.05).
© 2020 by the authors. Licensee MDPI, Basel, Switzerland. This article is an open access article distributed under the terms and conditions of the Creative Commons Attribution (CC BY) license (http://creativecommons.org/licenses/by/4.0/).
Share and Cite
MDPI and ACS Style
Gao, Z.; Mei, Q.; Fekete, G.; Baker, J.S.; Gu, Y. The Effect of Prolonged Running on the Symmetry of Biomechanical Variables of the Lower Limb Joints. Symmetry 2020, 12, 720. https://doi.org/10.3390/sym12050720
AMA Style
Gao Z, Mei Q, Fekete G, Baker JS, Gu Y. The Effect of Prolonged Running on the Symmetry of Biomechanical Variables of the Lower Limb Joints. Symmetry. 2020; 12(5):720. https://doi.org/10.3390/sym12050720
Chicago/Turabian StyleGao, Zixiang, Qichang Mei, Gusztáv Fekete, Julien S Baker, and Yaodong Gu. 2020. "The Effect of Prolonged Running on the Symmetry of Biomechanical Variables of the Lower Limb Joints" Symmetry 12, no. 5: 720. https://doi.org/10.3390/sym12050720
Note that from the first issue of 2016, this journal uses article numbers instead of page numbers. See further details here.