Foraging Is Determinant to Improve Smallholders’ Food Security in Rural Areas in Mali, West Africa
by
Sognigbe N’Danikou
1,2,*, 
Raymond Sognon Vodouhe
1,
Mauricio R. Bellon
3,
Amadou Sidibé
4 and
Harouna Coulibaly
4 1
Bioversity International, West and Central Africa Office, Cotonou 08 BP 0932, Benin
2
Laboratory of Genetics, Horticulture and Seed Sciences, Faculty of Agronomic Sciences, University of Abomey-Calavi, Abomey-Calavi BP 2549, Benin
3
Bioversity International, via dei Tre Denari, 472/a, Maccarese, 00057 Rome, Italy
4
Centre Régionale de la Recherche Agronomique de Sotuba, Institut d’Economie Rurale, Unité des Ressources Génétiques, Bamako BP 30, Mali
*
Author to whom correspondence should be addressed.
Sustainability 2017, 9(11), 2074; https://doi.org/10.3390/su9112074
Submission received: 3 October 2017
/
Revised: 29 October 2017
/
Accepted: 8 November 2017
/
Published: 10 November 2017
(This article belongs to the Special Issue Sustainable Food Innovation)
Abstract
:Studies on the enabling factors for household food security (HFS) most often used simplified econometric models looking into the links with a selected set of variables. In this research, a livelihood approach of HFS was used and aimed at determining the most significant livelihood assets for HFS in dryland agricultural systems. Elements of the five livelihood assets were assessed through questionnaire surveys with a random sample of 180 households, and six focus group discussions in three communities along the rural-urban continuum, in Southern Mali. The coping strategy index approach was used to evaluate household food security status. Non-parametric and parametric statistical tests were combined, as appropriate, to identify the most significant determinants of HFS status. Findings indicated that most determinant factors of HFS were the diversity of wild and cultivated food plants, and hunting (natural capital); access to clean water and irrigation (infrastructural capital); and off-farm employment (financial capital). HFS also improved along the urban-rural continuum and rural households with high natural capital seemed to be more food secure. Findings call for important investment to expand the natural capital (e.g., domestication of new crops and agricultural diversification) and infrastructural capital (irrigation facilities, clean water) of the rural households.
1. Introduction
Food insecurity and undernourishment are of global concern and the first millennium development goal (MDG1) was dedicated to halving the proportion of undernourished people in the world by end of 2015. Despite the substantial global performance towards achieving this goal, Sub-Saharan Africa (SSA) lagged behind [1]. Reports on the state of food insecurity in the world indicate that SSA has the highest prevalence of undernourishment (25% as of the year 2013, from 33% in 1990), with a little progress in the last decade [1,2]. Globally, absolute hunger is expected to decline below 8% of total population by 2030, but some groups such as SSA will remain disproportionally behind [3]. A projection by the United States Department of Agriculture indicates that food insecurity in SSA is expected to rise from 28.4% in 2015 to 30.4% in 2025 [4]. In this context, the rural poor continues to suffer nutritional deficiencies in Africa, and women and children are most vulnerable. Meanwhile, the tropical regions are recognized to possess a comparatively higher diversity of natural and cultivated food species that, a priori, should help to cope with food shortfalls and food insecurity if sustainably managed and adequately used.
It is recognized that reduction of hunger in this part of the world requires an integrated approach whereby local biodiversity would play a tremendous function in increasing agricultural productivity and strengthening resilience of the most vulnerable groups [1,5]. In this pursuit, the locally available agricultural biodiversity (ABD), also termed agrobiodiversity, is thought to represent an important asset to address nutritional deficiencies for better human health and development in a sustainable environment [6,7]. Agricultural biodiversity is a “broad term that includes all components of biological diversity of relevance to food and agriculture, and all components of biological diversity that constitute the agro-ecosystem: the variety and variability of animals, plants and micro-organisms, at the genetic, species and ecosystem levels, which are necessary to sustain key functions of the agro-ecosystem, its structure and processes” [5,8].
In this research, ABD was evaluated at the species level and is meant to include the biodiversity from the production systems (crops and wild annual and perennial plant species managed on-farm or collected in the common land, domesticated and hunted animals, fish and other aquatic animals, fungi, and useful insects), the diversity in the market place, and the diversity in the plates (dietary diversity).
In view of the weaknesses of the modern agricultural intensification model used so far, it is emphasized that humanity now needs to establish farming systems that bring intensification without simplification [5,9]. It is admitted that the revolutions in food production in the last decades have also generally threatened the continued existence of valuable biodiversity in agro-ecosystems and the associated knowledge [7]. Although there are arguments in favour of market strengthening to promote sustainable agriculture and food systems [10], a considerable disconnect is noted between people’s diets and local food sources. Agricultural homogenization affects not only the diets but also the resilience of food security at all levels [11]. The threats also carry with them new health issues. While there is a growing recognition of the need to conserve and use it, there is still lack of evidence of the benefits of ABD to achieving food and nutritional security [5,12]. In the same vein, demonstrating the causal relationships between ABD and its benefits to human livelihoods is a complex undertaking because of the complexity of the relationships that exist among them. Thus, most food security assessment projects have ignored natural capital. Therefore, the central question of this research was: which components of the livelihood assets are most determinant to smallholder households’ food security? Addressing this question is fundamental because the livelihood assets determine physical and financial access to and use of safe, nutritious and healthy food at all times [13]. This intimates that livelihood security underpins both the household food security and its nutrition security. Therefore, determining the main components of livelihood assets that are key to food security of the smallholders’ would help to identify the key points or levels where interventions are required to influence households’ food security in rural communities.
In this research, smallholders’ livelihood assets were characterized in Koutiala District in Mali, and it is hypothesized that the ABD rich rural households are more food secure.
2. Material and Methods
2.1. Survey Area
The study was carried out in Koutiala district in Sikasso region, Mali. The survey sites is part of a large scale study of the Dryland Systems by the Consultative Group on International Agricultural Research (CGIAR) research programme (DS-CRP). The survey sites fall under the Wa-Bobo-Sikasso (WBS) action transect (Figure 1). Koutiala is the cotton belt of Mali and belongs to Sikasso region were poverty incidence, depth and severity were highest, as indicated by results of the fourth general population census [14]. The same source indicated that Koutiala is the second-largest district in Sikasso region, after the regional capital Sikasso, and offers an opportunity to investigate livelihood assets and food security. This 2009 population census indicated that Koutiala comprised 580,453 inhabitants; with 76% living in rural areas, of which 51% were female and 49% male [14]. For further evaluation of the impacts of the planned interventions on agricultural systems and economic development in the area, one action (Kani) and one control site (Farakoro) were defined based on livelihood assets (natural and infrastructural). In addition, one intermediate site (N’Goutjina) was defined in order to monitor the effects of interventions along a gradient of different levels of social, financial, and human capitals in combination with natural capital, to achieve better nutrition and food security in the area (Table 1). The three villages are found along a gradient of remoteness, with Kani being the most rural and remote site, Farakoro the intermediate, and N’Goutjina a semi-urban site most closed to the main District capital where there are more intense economic activities.
2.2. Conceptual Framework of the Study
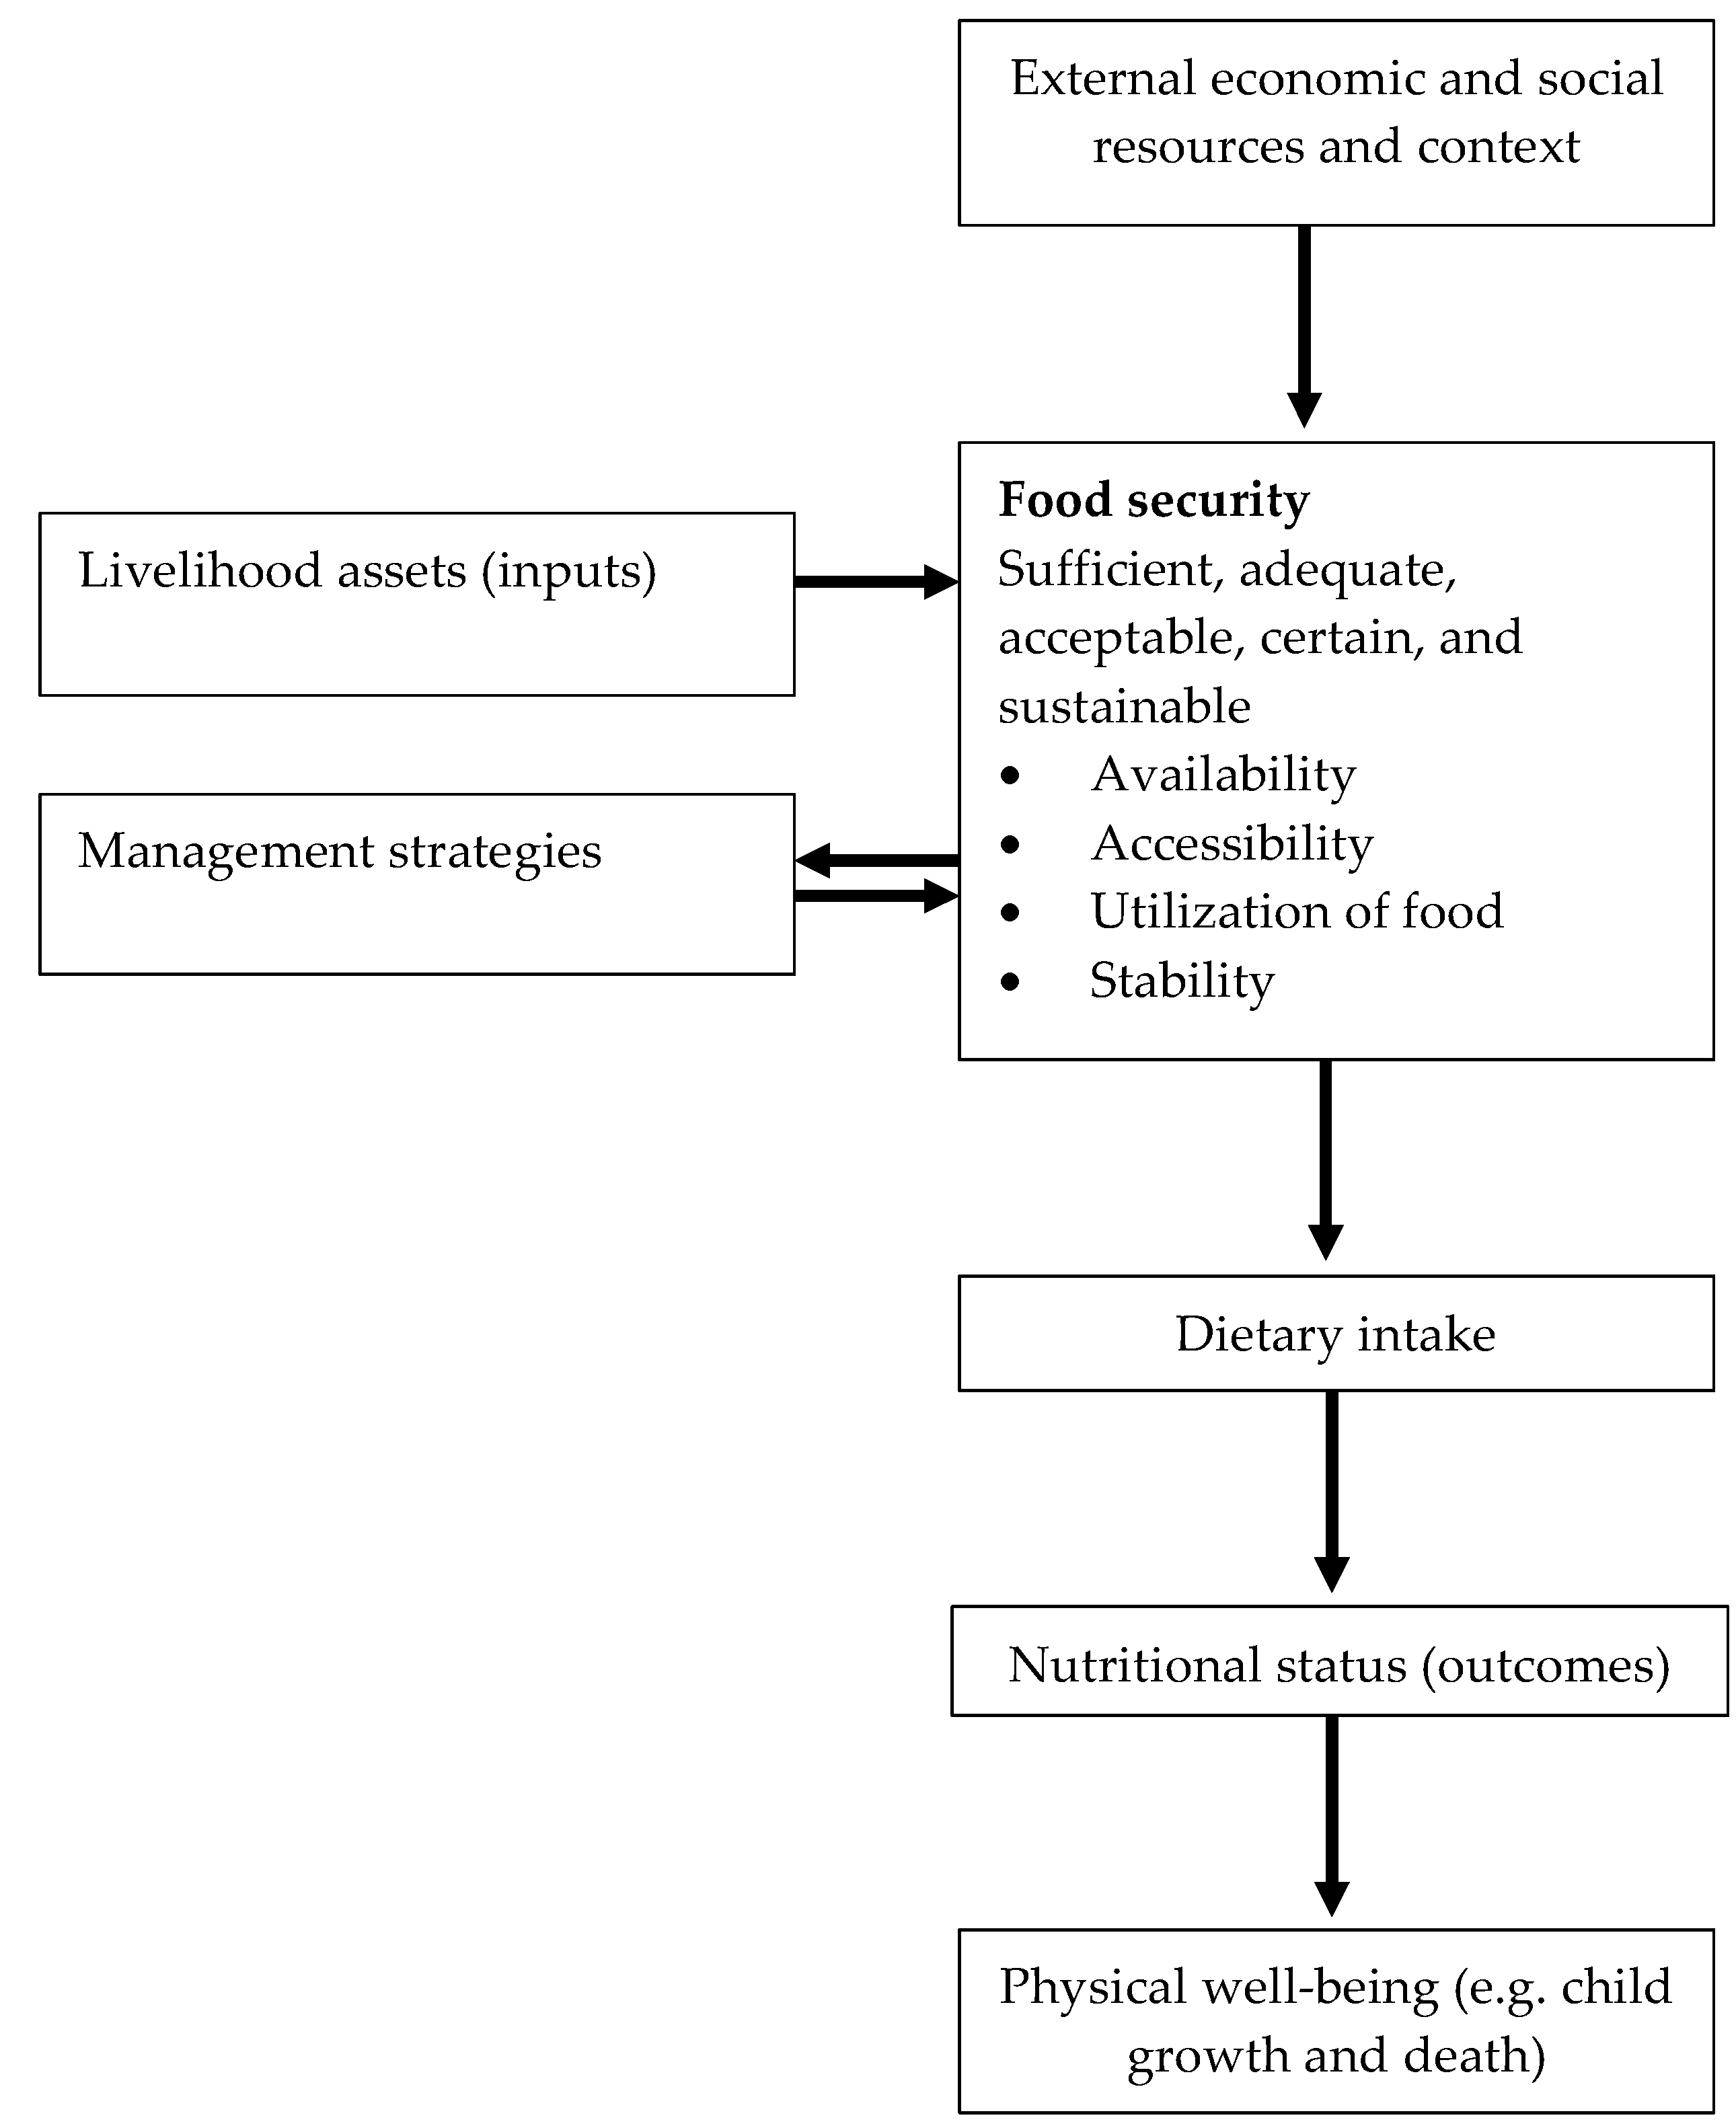
Food security is measured at different scales (household, community, regional and national) and is achieved when “all people, at all times, have physical, social and economic access to sufficient, safe and nutritious food to meet their dietary needs and food preferences for an active and healthy life” [13]. How best to measure household food (in) security has proven a persistent issue for researchers [15,16,17]. Conceptually, there are a number of (intrinsic and exogenous) factors affecting household food security in rural areas. Figure 2 maps the conceptual basis of this research which attempted to approach the extent to which components of the five livelihood assets (Table 2), improve food security in the dryland areas.
Generally, household food security status is evaluated under three main perspectives, viz., (i) the economic (household budget and consumption surveys); (ii) nutritional (individual caloric intake data); and (iii) household coping strategies. The first two perspectives require important investment into data collection and analysis (high level expertise, budget and time), while at the same time they can hardly capture dimensions on vulnerability or stability [17]. The third approach, while it does not capture calories consumed and spending in food items, directly captures physical (availability, accessibility, and utilization) and temporal (stability or vulnerability) dimensions of food security [16,17,18,19,20]. It also captures social and cultural dimensions of food security. The questions asked were straightforward and easy to understand by the respondents. The answers give clear indication of the severity of food insecurity and levels of household vulnerability. The households that frequently used drastic coping strategies such as maternal buffering or skipping days are likely to be poor and more vulnerable [17]. Based on these features and advantages, the household coping strategies approach was used in this research to evaluate the household food security status.
2.3. Data Collection
Beside the actual quantity and quality of food produced by households, there are other dimensions related to transport and infrastructure, household’s economic status, human resources, social network, and the overall natural environment that contribute to improved food security. Thus, the data collected was related to the household coping strategies as proxy to food security status (the response variable), and the five livelihood assets of the sustainable livelihood framework (as explanatory variables), which presumably interact with the overall external socioeconomic context to influence household food and nutrition security (Table 2).
2.4. Participants and Their Selection
A total of 180 households were randomly selected in the three villages (Kani, Farakoro and N’Goutjina) of Koutiala district to participate in the household survey. The selection was based on lists of all households living in the villages and only those involved in agricultural production (farming, animal raising and or collection of wild useful biodiversity in the nature) were selected to participate in the study. In the selected households, survey participants were (i) the male head of household together with the female that was later interviewed for the dietary diversity; and (ii) a mother in the household between 15–49 years old. In the cases where more than one mother of the household had these characteristics then one was chosen randomly. When none was available, the woman who customarily prepares food in the household was chosen, irrespective of age. The men participants in the survey provided general information on the livelihood assets, while women supplied information on the copping strategies of the household in the events of food shortage. Focus group discussions were also organized for men and women to collect gender-disaggregated data on ABD utilization at community level. Prior informed consents were obtained from all study participants.
2.5. Data Analysis
2.5.1. Household Assets and Their Links with Household Good Production
Descriptive statistics were determined on the socioeconomic characteristics of the surveyed households and their livelihood assets. The socioeconomic characteristics included the size of household agricultural land, size of household, size of family labour, and household wealth index. The wealth index was calculated using the Demographic and Health Surveys (DHS) method that is based on household’s ownership of selected assets, such as televisions and bicycles; materials used for housing construction; and types of water access and energy sources. Based on the tertiles of the wealth index, households were classified into three wealth categories, being the poorest, the middle and the richest classes.
Agricultural biodiversity, which gives an indication of food diversity, was also characterized by comparing Simpson and Shannon-Weaver’s diversity indices. Comparing both indices made it possible to check for consistency in the results, as there are differences in their sensitivity to rare species [21].
2.5.2. Food Security Assessment
Household food insecurity was assessed by measuring indicators of food availability, accessibility, utilization, and stability or vulnerability. In this end the coping strategy index (CSI) was used [16,17,18]. In total, 14 coping strategies were defined together with their attributed severity scores and how often households used them to cope with food scarcity (Appendix A). The CSI was used as a proxy of food insecurity index (FSI). The following formula was used:
where CSRi is the severity score of the coping strategy i and Freqi the frequency in which the given coping strategy was used by the household during the last 30 days that preceded the date of interview. FSI is an aggregated score and the higher the value, higher is the household food insecurity. Based on the FSI scores, households were classified into food secure, moderately food insecure and severely food insecure. For more details on the calculation of the coping strategy index, please refer to Maxwell [16].
2.5.3. Testing the Hypothesis
For the hypothesis, mixed-effect model fitted by the maximum likelihood, using location of informants and commodity groups as random variables, was used to test differential use of biodiversity by men and women. The effect of ABD in general and each of its components (annual crops, wild and semi-wild annual plants, agroforestry species, domesticated and hunted animals, fish and aquatic) on household food security was assessed using the Kruskal-Wallis test. The generalized linear models, with Poisson distribution, were also used to test the effects of the above agrobiodiversity components and their interactions on household food security.
In order to analyse the effects of livelihood assets on food security asset components with assumed or potential impact on household food security were taken into account (Table 2). For each capital asset only the elements that are most relevant to rural communities were measured. First, the random forest function under R statistical software was used to select the elements of the livelihood assets that had most significant effect on household food security. At each step the model was checked for its robustness and stability when selecting the most important variables. This was combined with the conditional inference tree models, using the “party” function, with the CTREE algorithm, to select elements of the livelihood assets that played as major indicators for household food security. The tree model is appropriate in cases where there is large number of explanatory variables and these can be a mix of continuous and categorical variables [22]. The tree-based models have a number of advantages in estimating a non-parametric regression relationship by binary recursive partitioning using conditional distributions. Such models are not based on any kind of distribution assumptions, and most importantly complex interactions with a large number of explanatory variables and nonlinear relationships that are difficult to examine with traditional statistical methods can be modelled. Further details on tree models and conditional inference tree-based classification can be found in Hothorn et al. [23] and Crawley [22]. Further analyses of the effects of the selected explanatory variables on food security were then tested using generalized linear models or generalized additive models as appropriate.
Multivariate analysis (multidimensional scaling plot) was also performed to map households’ distribution based on 151 asset variables. All statistical analyses were performed in R statistical software, version 3.4.0 [24].
3. Results
3.1. Site Remoteness and Household Assets
Households were characterized based on their livelihoods assets and use (Table 3). The data indicated higher average household size in remote site of Kani (27.77 ± 18.21) compared with Farakoro (25.38 ± 18.04) and N’Goutjina (14.70 ± 9.56) which are close to the main city. Family labour represents about a third of household size and both are slightly higher in rural areas (Kani and Farakoro) than in the semi-urban N’Goutjina. The size of available agricultural land was on average 8.35 ± 5.85 ha in N’Goutjina, 16.11 ± 9.59 ha in Farakoro 18.34 ± 9.78 ha in Kani. Nearly the entire available land was cultivated by the households in the three study sites.
The wealth classes were scattered within and among communities (Table 3). Data indicated that there were relatively higher proportions of poor and middle class households in N’Goutjina (81.67%), compared with Farakoro (61.67%) and Kani (56.67%).
Exploration of the use of natural capital by households for production purposes indicated that plant and animal species were used for several purposes in the study sites and the production objectives in the wet cropping season varied from one site to another (p < 0.001). On average, the richness of food crops and market commodities varied, respectively, from one site to another (p < 0.001). There was higher marketed diversity in Kani compared to Farakoro and N’Goutjina (p = 0.03), while the diversity of purchased products was higher in Farakoro comparative to the other communities. The production objective in N’Goutjina was rather more oriented to household self-consumption. The contribution of the wet season's crop species to food consumption (p < 0.001) and to income (p < 0.01) also significantly varied from one site to another. Households with higher marketed diversity tended to earn more from market exchanges (r = 0.73, p < 0.001). Fruits and seeds were the most commonly used plant parts.
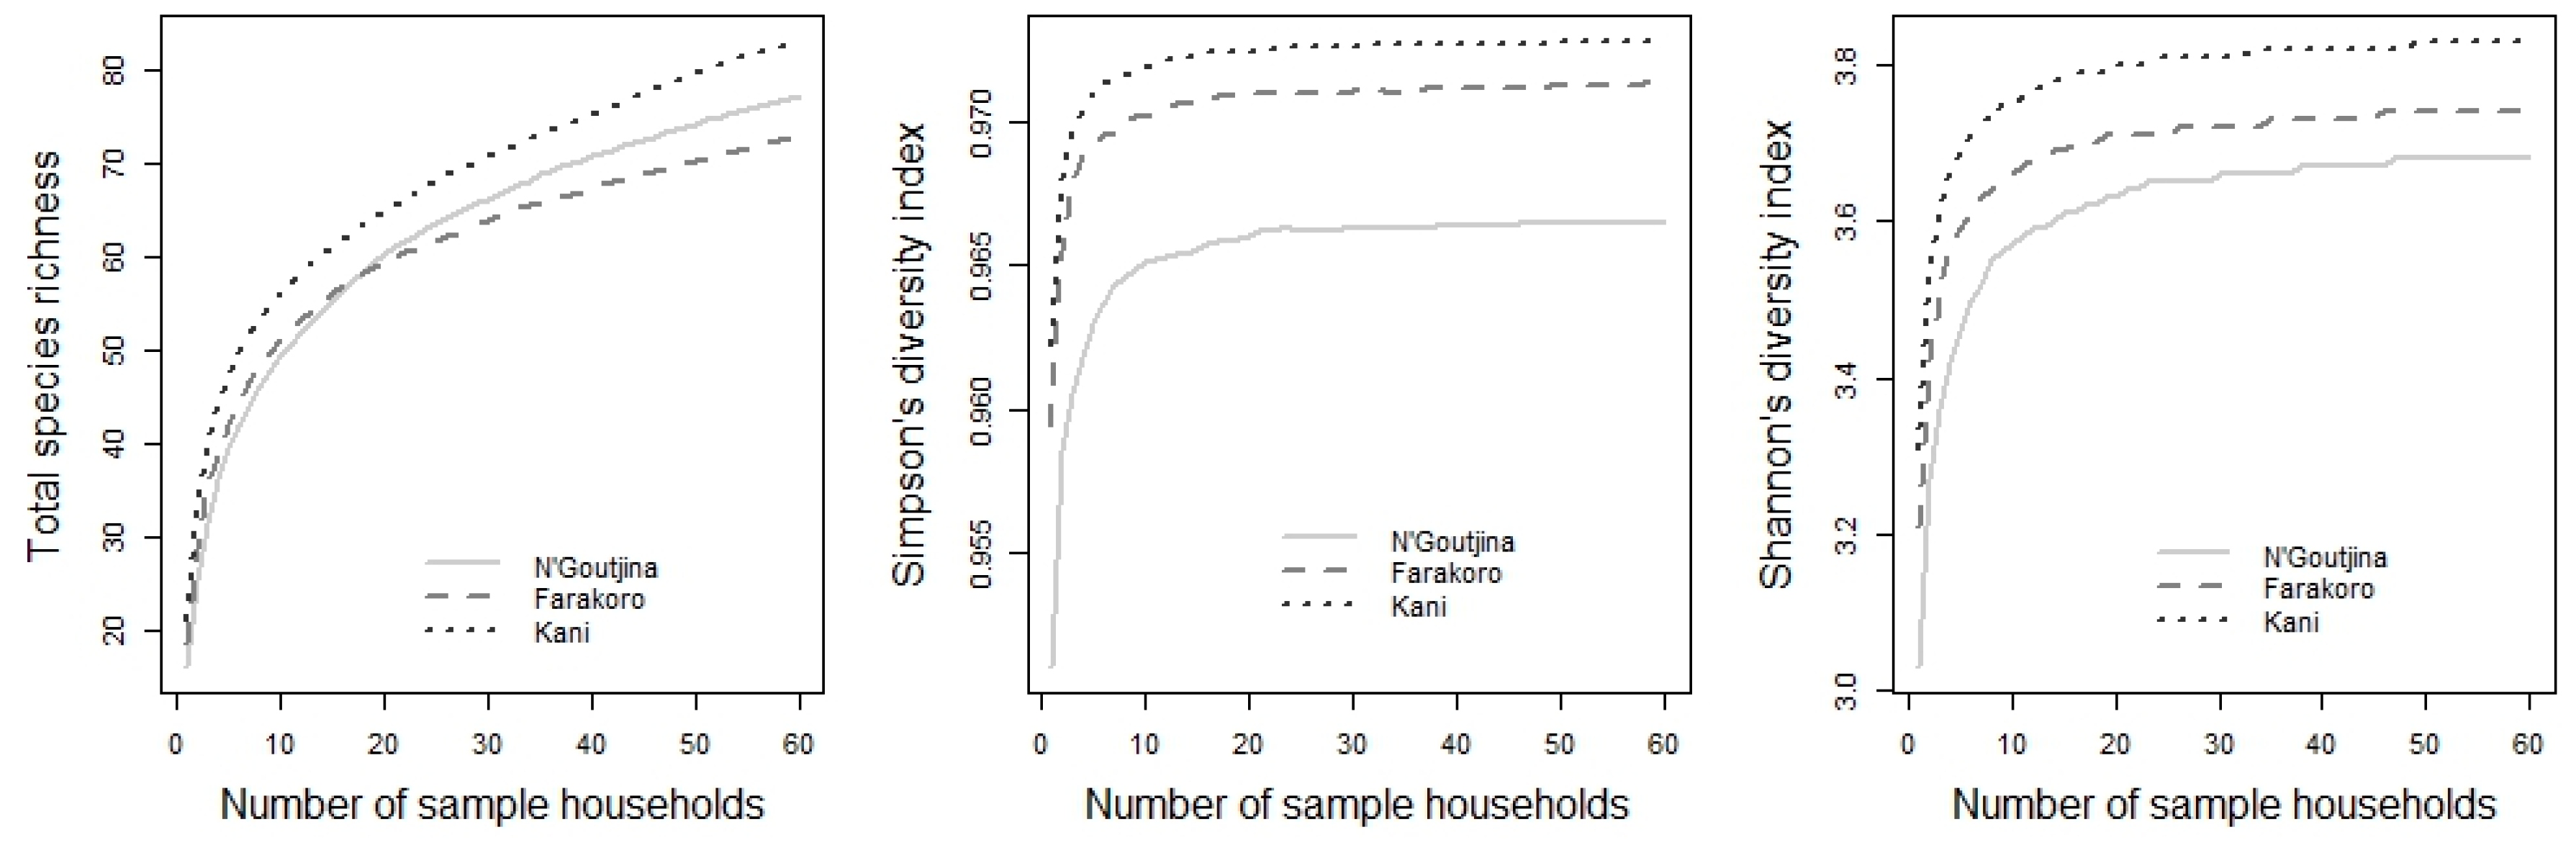
Results also indicated that households managed high plant and animal species diversity in the surveyed area. Overall, 104 plant and animal species were recorded. The plotted species richness as a function of the number of households in village indicated that 83, 77 and 73 species were managed respectively in Kani, N’Goutjina, and in Farakoro (Figure 3). The overall richness comprised 81 plant and 23 animal species. Generally, men groups reported higher agroforestry and wild or semi-domesticated plant species richness than women (p ≤ 0.001). However, the richness in other commodities (annual crops and animal breeds) was not significantly different between men and women.
Most grown crop species in the surveyed area included Pennisetum glaucum, Sorghum bicolor, Zea mays, Gossypium hirsutum, Vigna unguiculata and Arachis hypogea. These were the staple cereals and pulses, and cotton was the main cash crop in the area. Based on the relative frequencies of mentions, Parkia biglobosa, Vitellaria paradoxa, Adansonia digitata, and Mangifera indica remained the most commonly used tree species in each of the three communities.
3.2. Significance of the Natural Capital within and among Communities
Simpson’s index of diversity (SID) which takes into account the evenness of the diversity within the communities studied was explored. The values indicated a generally high species diversity managed by the communities (0.76 ≤ SID ≤ 0.91). The values of this index indicate that there is a high probability that two households randomly selected in any of the studied communities will use different species. Consequently, the dominance, measuring the probability that there will be dominant species in the communities, was very low. The highest diversity was noted in the annual crops, compared to other commodity groups (SID ≥ 0.90). The Kruskal-Walis test indicated a significant difference in the Simpson’s index of diversity between the commodity groups (p < 0.05). However, there was no significant difference between communities for Simpson’s index of diversity, all commodities put together (p = 0.83).
It was observed that people used a relatively higher diversity of wild animals and wild plants in Kani compared to those living in Farakoro and N’Goutjina. The Chi-square test indicated a very significant association of high area diversity of the rain-fed annual crops with the location of respondents (Chi-square = 54.10, p < 0.001). This index was higher in N’Goutjina (mean AD = 0.98 ± 0.51) compared to Farakoro (0.61 ± 0.40) and Kani (0.53 ± 0.28).
Alpha and beta diversity were also calculated, based on the five biodiversity components (Table 4). Alpha diversity is relatively homogenous for the three sites, while beta diversity was significantly higher in Kani (10.83) compared to N’Goutjina (8.33) and Farakoro (4.83). This means that there was an overall higher diversity of species managed by households in Kani compared to the other two communities.
3.3. Relationships between Livelihood Assets and Household Food Security
Exploring household level assets with potential effects on household food security, first the correlation between those variables and household food security was examined. Findings showed that high agricultural biodiversity was associated with greater food availability (r = 0.47, p < 0.001), and lower food insecurity (r = −0.24, p < 0.001). Also, and as expected, high household food availability translated into lower food insecurity (r = −0.35, p < 0.001). It was found that this overall relationship of ABD with household food security status was due to two main diversity components, viz., wild food plants collected in both dry and wet seasons, and hunting for food. Species richness in rain-fed annual food crops, food trees, and domesticated animal species had no significant relationship with the calculated food insecurity index. Higher aggregated wealth scores were also correlated with higher household food sufficiency (r = 0.24, p < 0.01) and low market infrastructure was associated with high food insecurity scores (r = 0.39, p < 0.001). Household food insecurity index had significant and negative correlations with richness of local varieties (r = −0.22, p < 0.01) and frequency of seed renewal (r = −0.22, p < 0.01). The households that managed higher diversity of local varieties were less food insecure, with a note that seeds of local varieties were rarely renewed. It was also observed a positive correlation between the number of spouse in household with the richness of wild food plants (r = 0.20, p < 0.01), but negatively correlated with food insecurity (r = −0.19, p < 0.05). Thus, households where the head is polygamous experienced low food insecurity. High food insecurity was correlated with increased participation in development programmes (r = 0.38, p < 0.001) and in social networks (r = 0.28, p < 0.001). This would mean that food insecure households participated more in social networks and development programmes. The most vulnerable households to food insecurity participated more in self-help, water and environmental management groups, and in neighbour village associations. For instance, the most food insecure households participated more in agricultural extension, livestock and (agro) forestry programmes. The existence of water dams in villages was significantly correlated with higher food availability (r = 0.53, p < 0.001), and with low food insecurity (r = −0.37, p < 0.001). High household food insecurity was also correlated with high risk taking (p < 0.05). It was also found that either agricultural, non-agricultural or self-employment (family business) were correlated with low food insecurity.
3.4. Testing the Effects of ABD and Socioeconomic Variables on Household Food Security
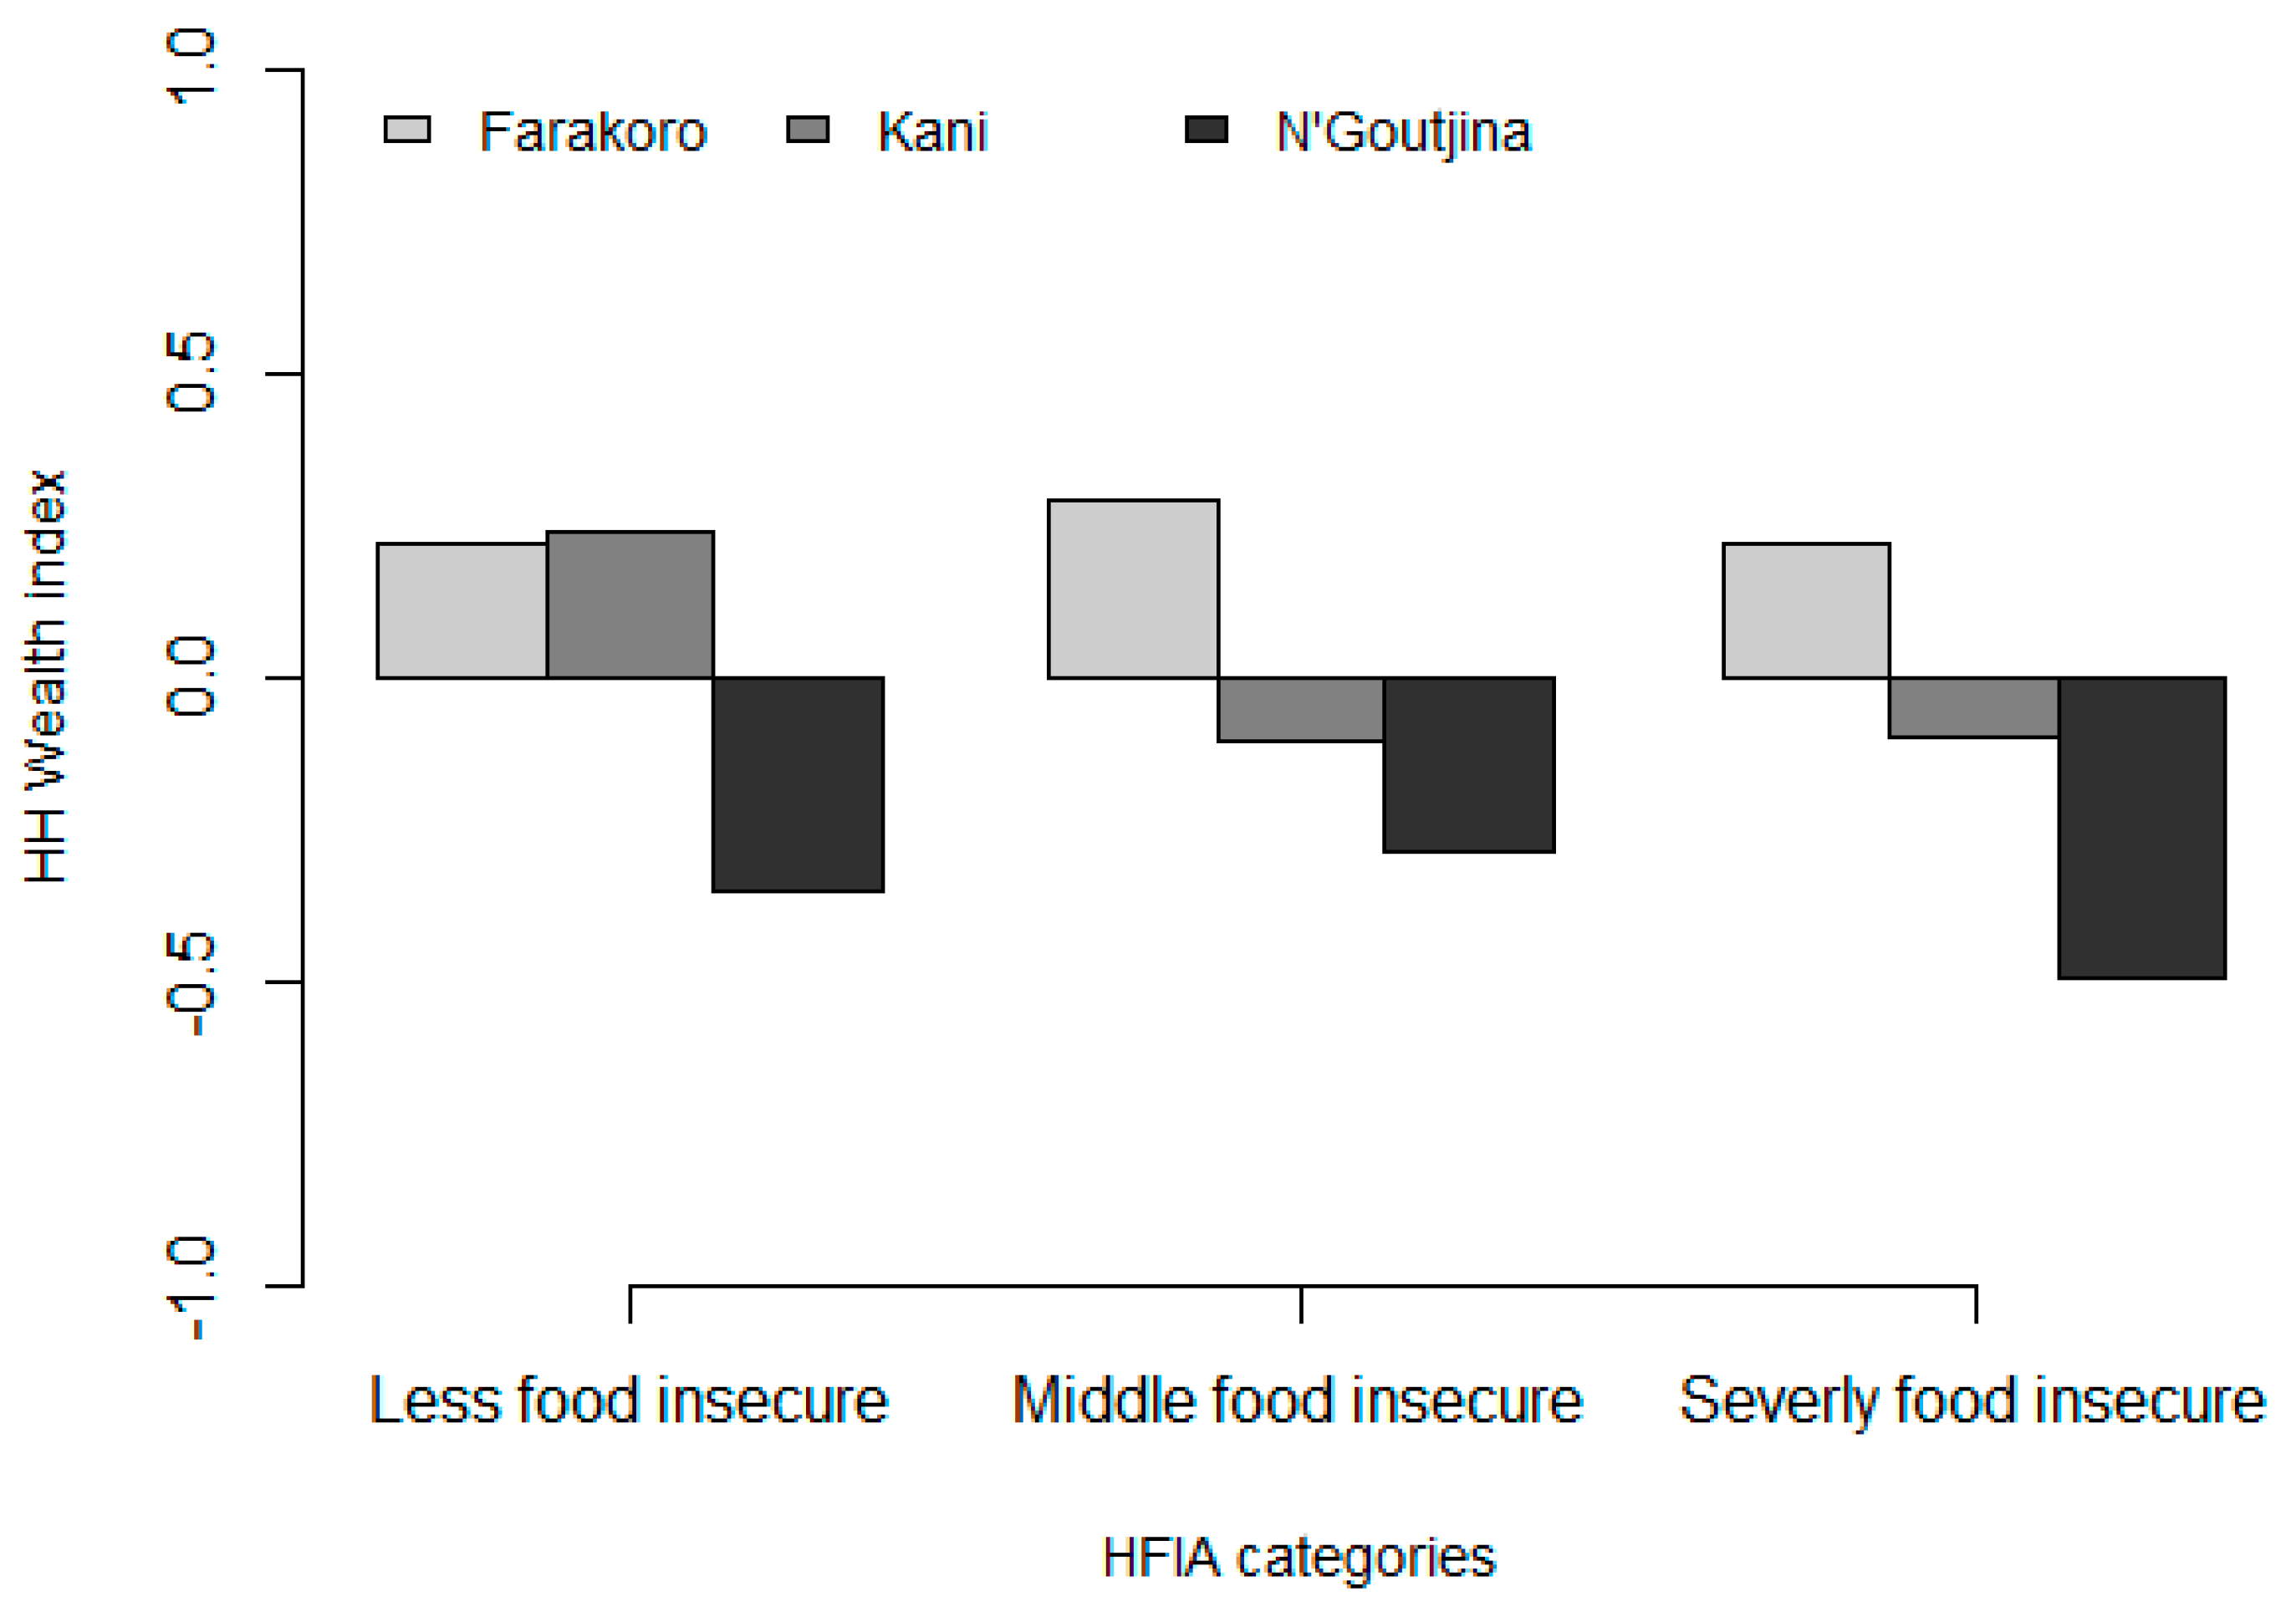
On average, household food insecurity index (FSI) was higher in Farakoro (33.03 ± 3.61), followed by N’Goutjina (30.43 ± 2.62) (Table 5). The lowest FSI was recorded in Kani (27.72 ± 6.07). Households living in Farakoro (7.83 ± 2.68) more frequently used a larger number of coping strategies compared to their peers in N’Goutjina (4.98 ± 3.50) and Kani (2.61 ± 2.44). However, severe coping strategies like maternal buffering or skipping days were recorded in only a single household in N’Goutjina, while few households were sometimes forced to borrow food or money to buy food, to eat the seed that was to be sown next season, to reduce the quantity of food, and/or to skip meals. The most commonly used coping strategies by most households were to eat less preferred foods and/or to reduce the variety of foods. The Kruskal-Wallis test indicated no statistically significant effect of the household size, family labour, community roles, overall available and cultivated land, the wealth status, and the area diversity index of rain-fed crops, on food security (p > 0.05). Specifically, on the relationship between wealth status and household food security (HFS), data indicated that all food insecurity levels are found in all the wealth classes (Figure 4). However, the diversity of wild food plants, hunted animals, and livestock had a significant effect on HFS (p < 0.01). It was also observed that HFS improved from one location to another along the urban-rural continuum.
The commodity groups that significantly contributed to food sufficiency are the diversity of cultivated rain-fed crops and the wild species harvested in the wet season, trees, and animal breeds and hunting. The off-season cropping and wild harvesting of plants in the dry season did not significantly affect households’ food coverage (p > 0.05). It is partially concluded that households that managed higher on-farm and wild plants and animal diversity were significantly more food secure.
3.5. Identification of the Livelihood Assets That Drive Household Food Security in the Survey Area
First, when considering only the elements that constituted each livelihood asset, the conditional inference tree models indicated that risk attitude of the head of household (for human capitals), the diversity of wild food plants managed in the wet season (for natural capital), income generated by non-agricultural employment (for financial capital), the number of roles in the community and social group memberships (for social capital), and the existence of water resources (dams and wells) (for physical or infrastructural capital) were the main factors that had most significant effects on household food security (p < 0.05), in the surveyed area (Table 6).
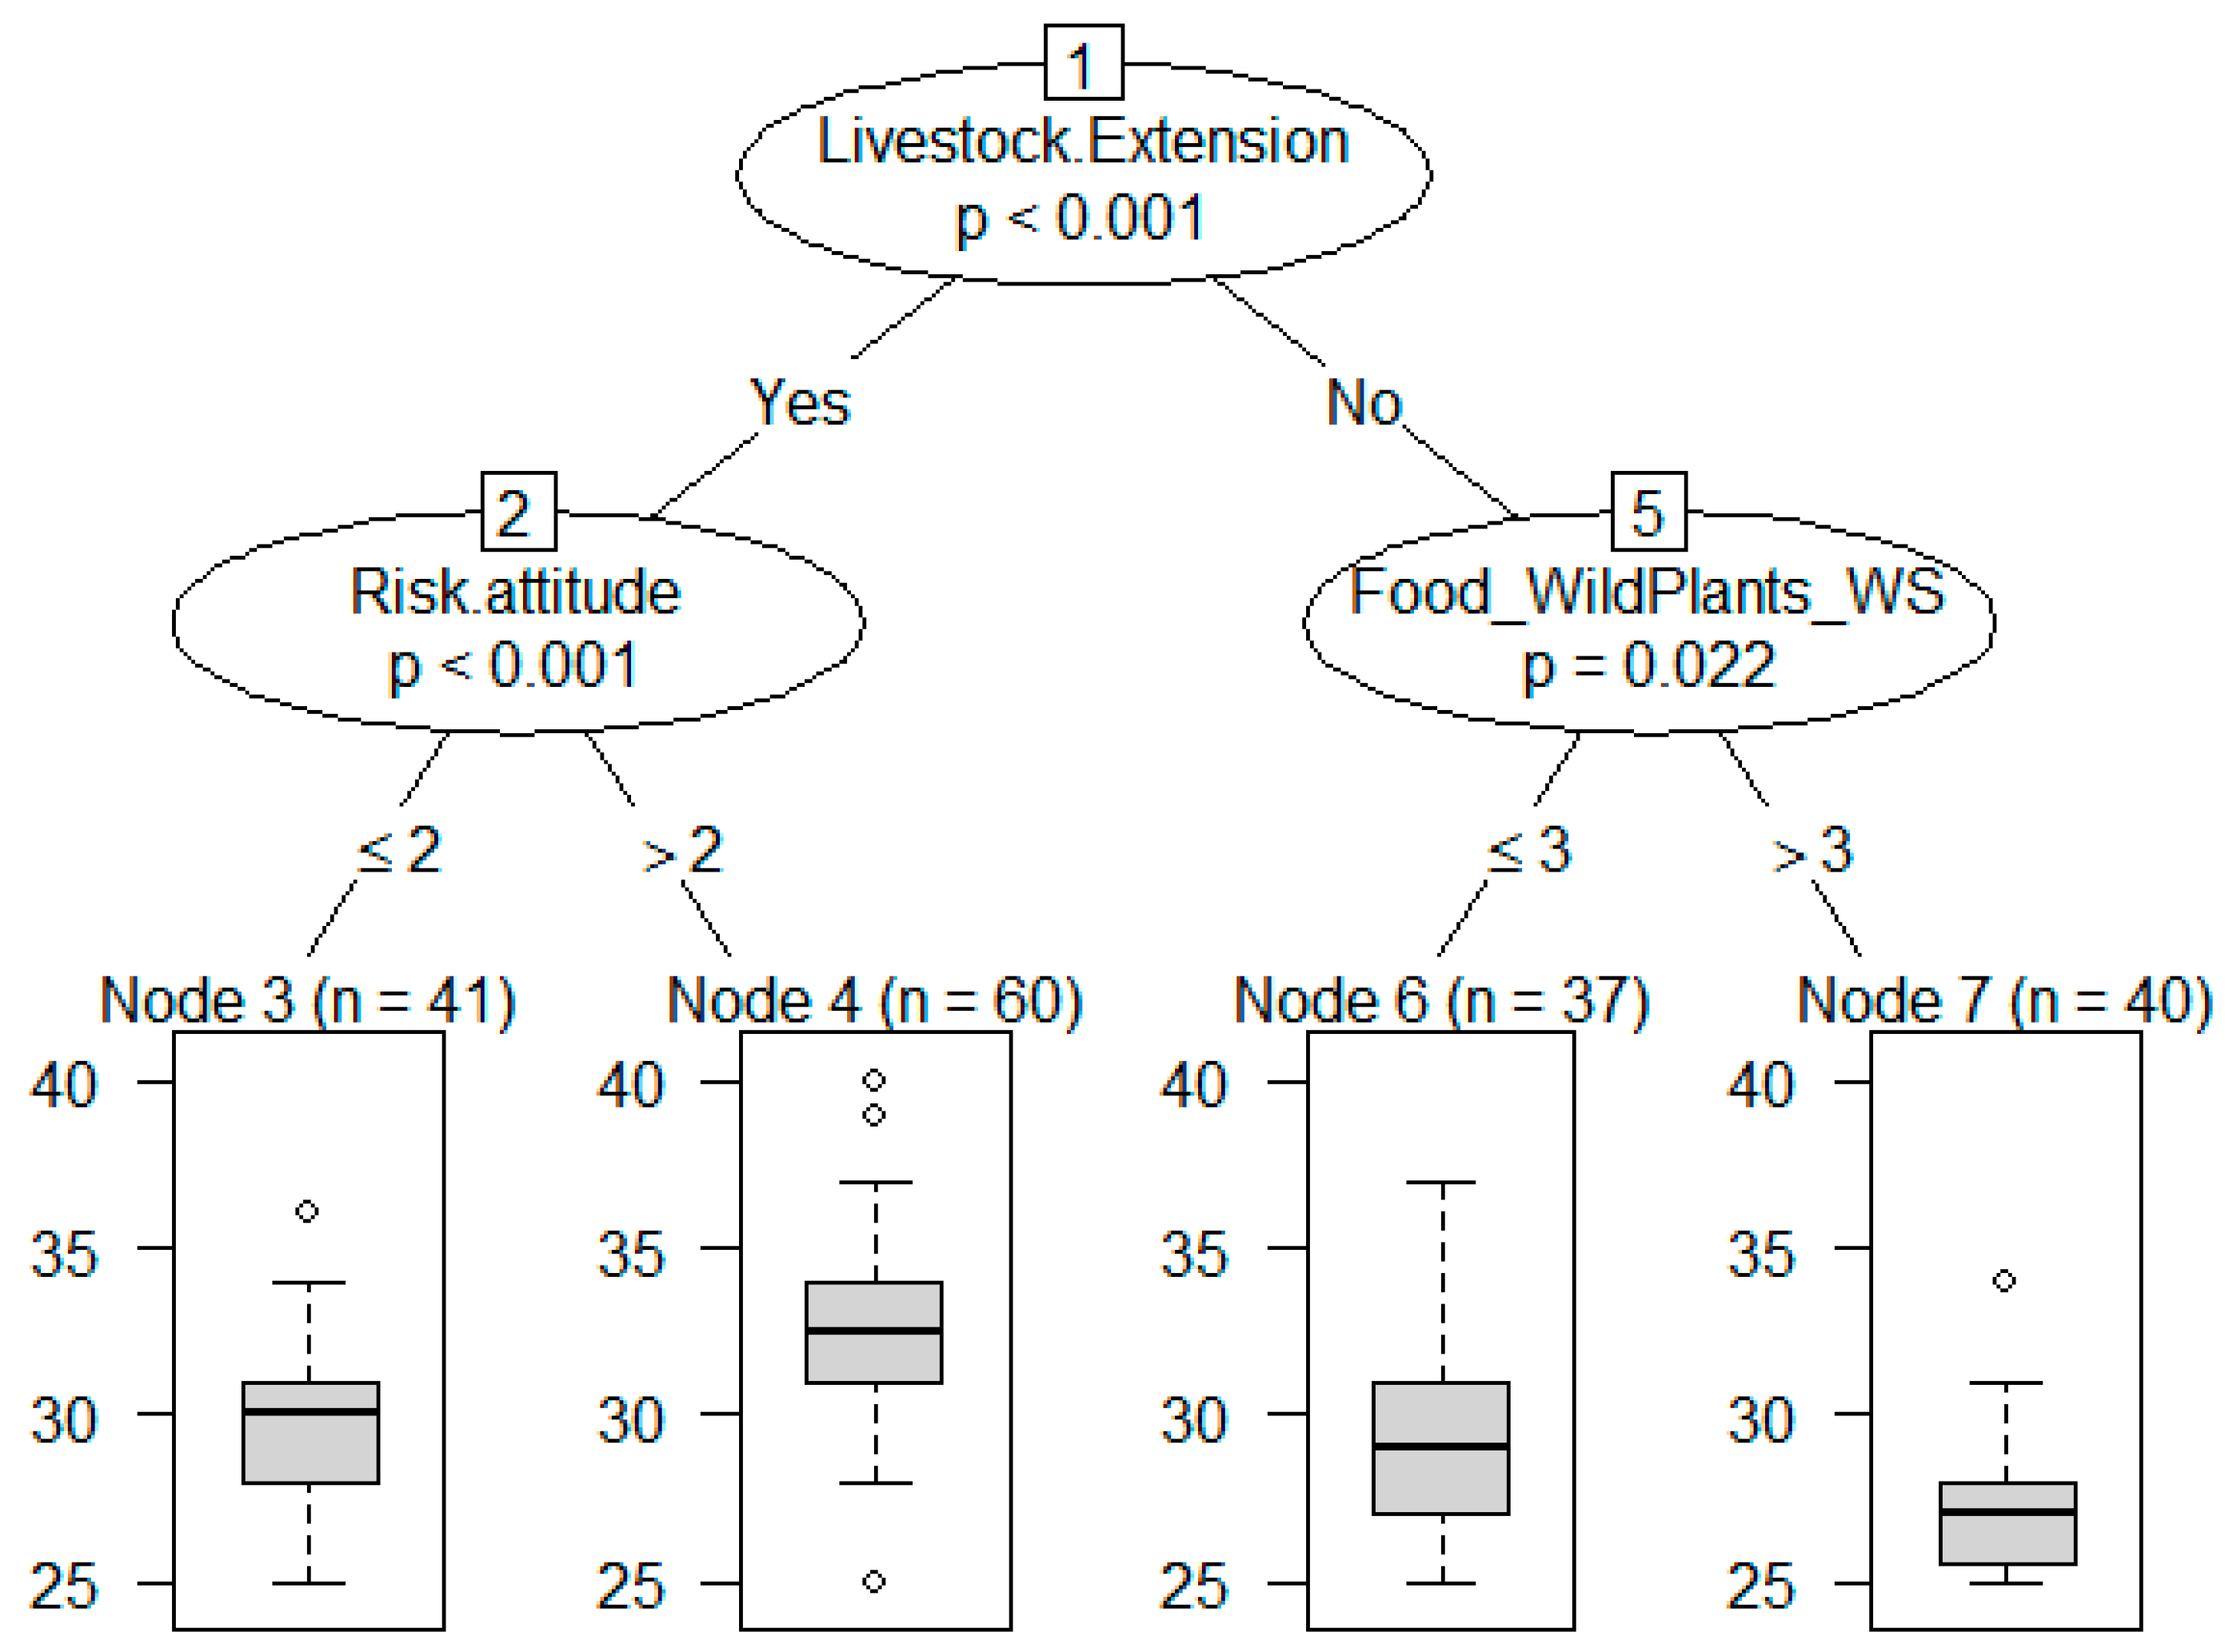
Secondly, the overall conditional inference tree model that integrated all livelihood assets, indicated that participation in the livestock extension programme (physical/infrastructural capital asset), the diversity of wild food plants managed by household during the wet season (natural capital asset), and the risk attitude of the household (human capital asset) were the most important indicators of household food security status (Figure 5). The most food insecure households participated more in the livestock extension programmes (p < 0.001). The livestock extension programmes provide advisory support to breeders, animal health monitoring and vaccination to prevent the risk of epidemics, introduction and dissemination of new animal breeds in collaboration with research. Among participants to these programmes, more vulnerable households took higher risks (FSI = 32.53) compared with the less vulnerable ones (FSI = 29.68). The more food secure households participated less in the livestock programmes. In this group, the diversity of wild food plants that were managed was determinant in meeting household food security. Those households that had access to higher diversity of wild food plants (from three different species onward) in the wet season, also considered as the lean season when farmers are tendering the newly grown crops, were more food secure (FSI = 27.25), compared to those households that managed fewer (less than three different species) wild food plants (FSI = 29.30). Examples of wild food plants playing decisive role in meeting household food security include Bombax costatum, Adansonia digitata, Vitellaria paradoxa, Vitex doniana, and Senna tora. While edible leaves and fruits of some species (e.g., Vitex doniana) were collected on both common and private lands for direct household consumption, others (e.g., Vitellaria paradoxa) were harvested and sold to provide substantial income to face difficult times of food shortage. The ratio of wild versus cultivated annual plants diversity was significantly higher (p < 0.01) in more food secure (34.39 ± 9.27%) than in moderately food insecure (32.34 ± 9.45%) and in severely food insecure households (28.97 ± 10.59%).
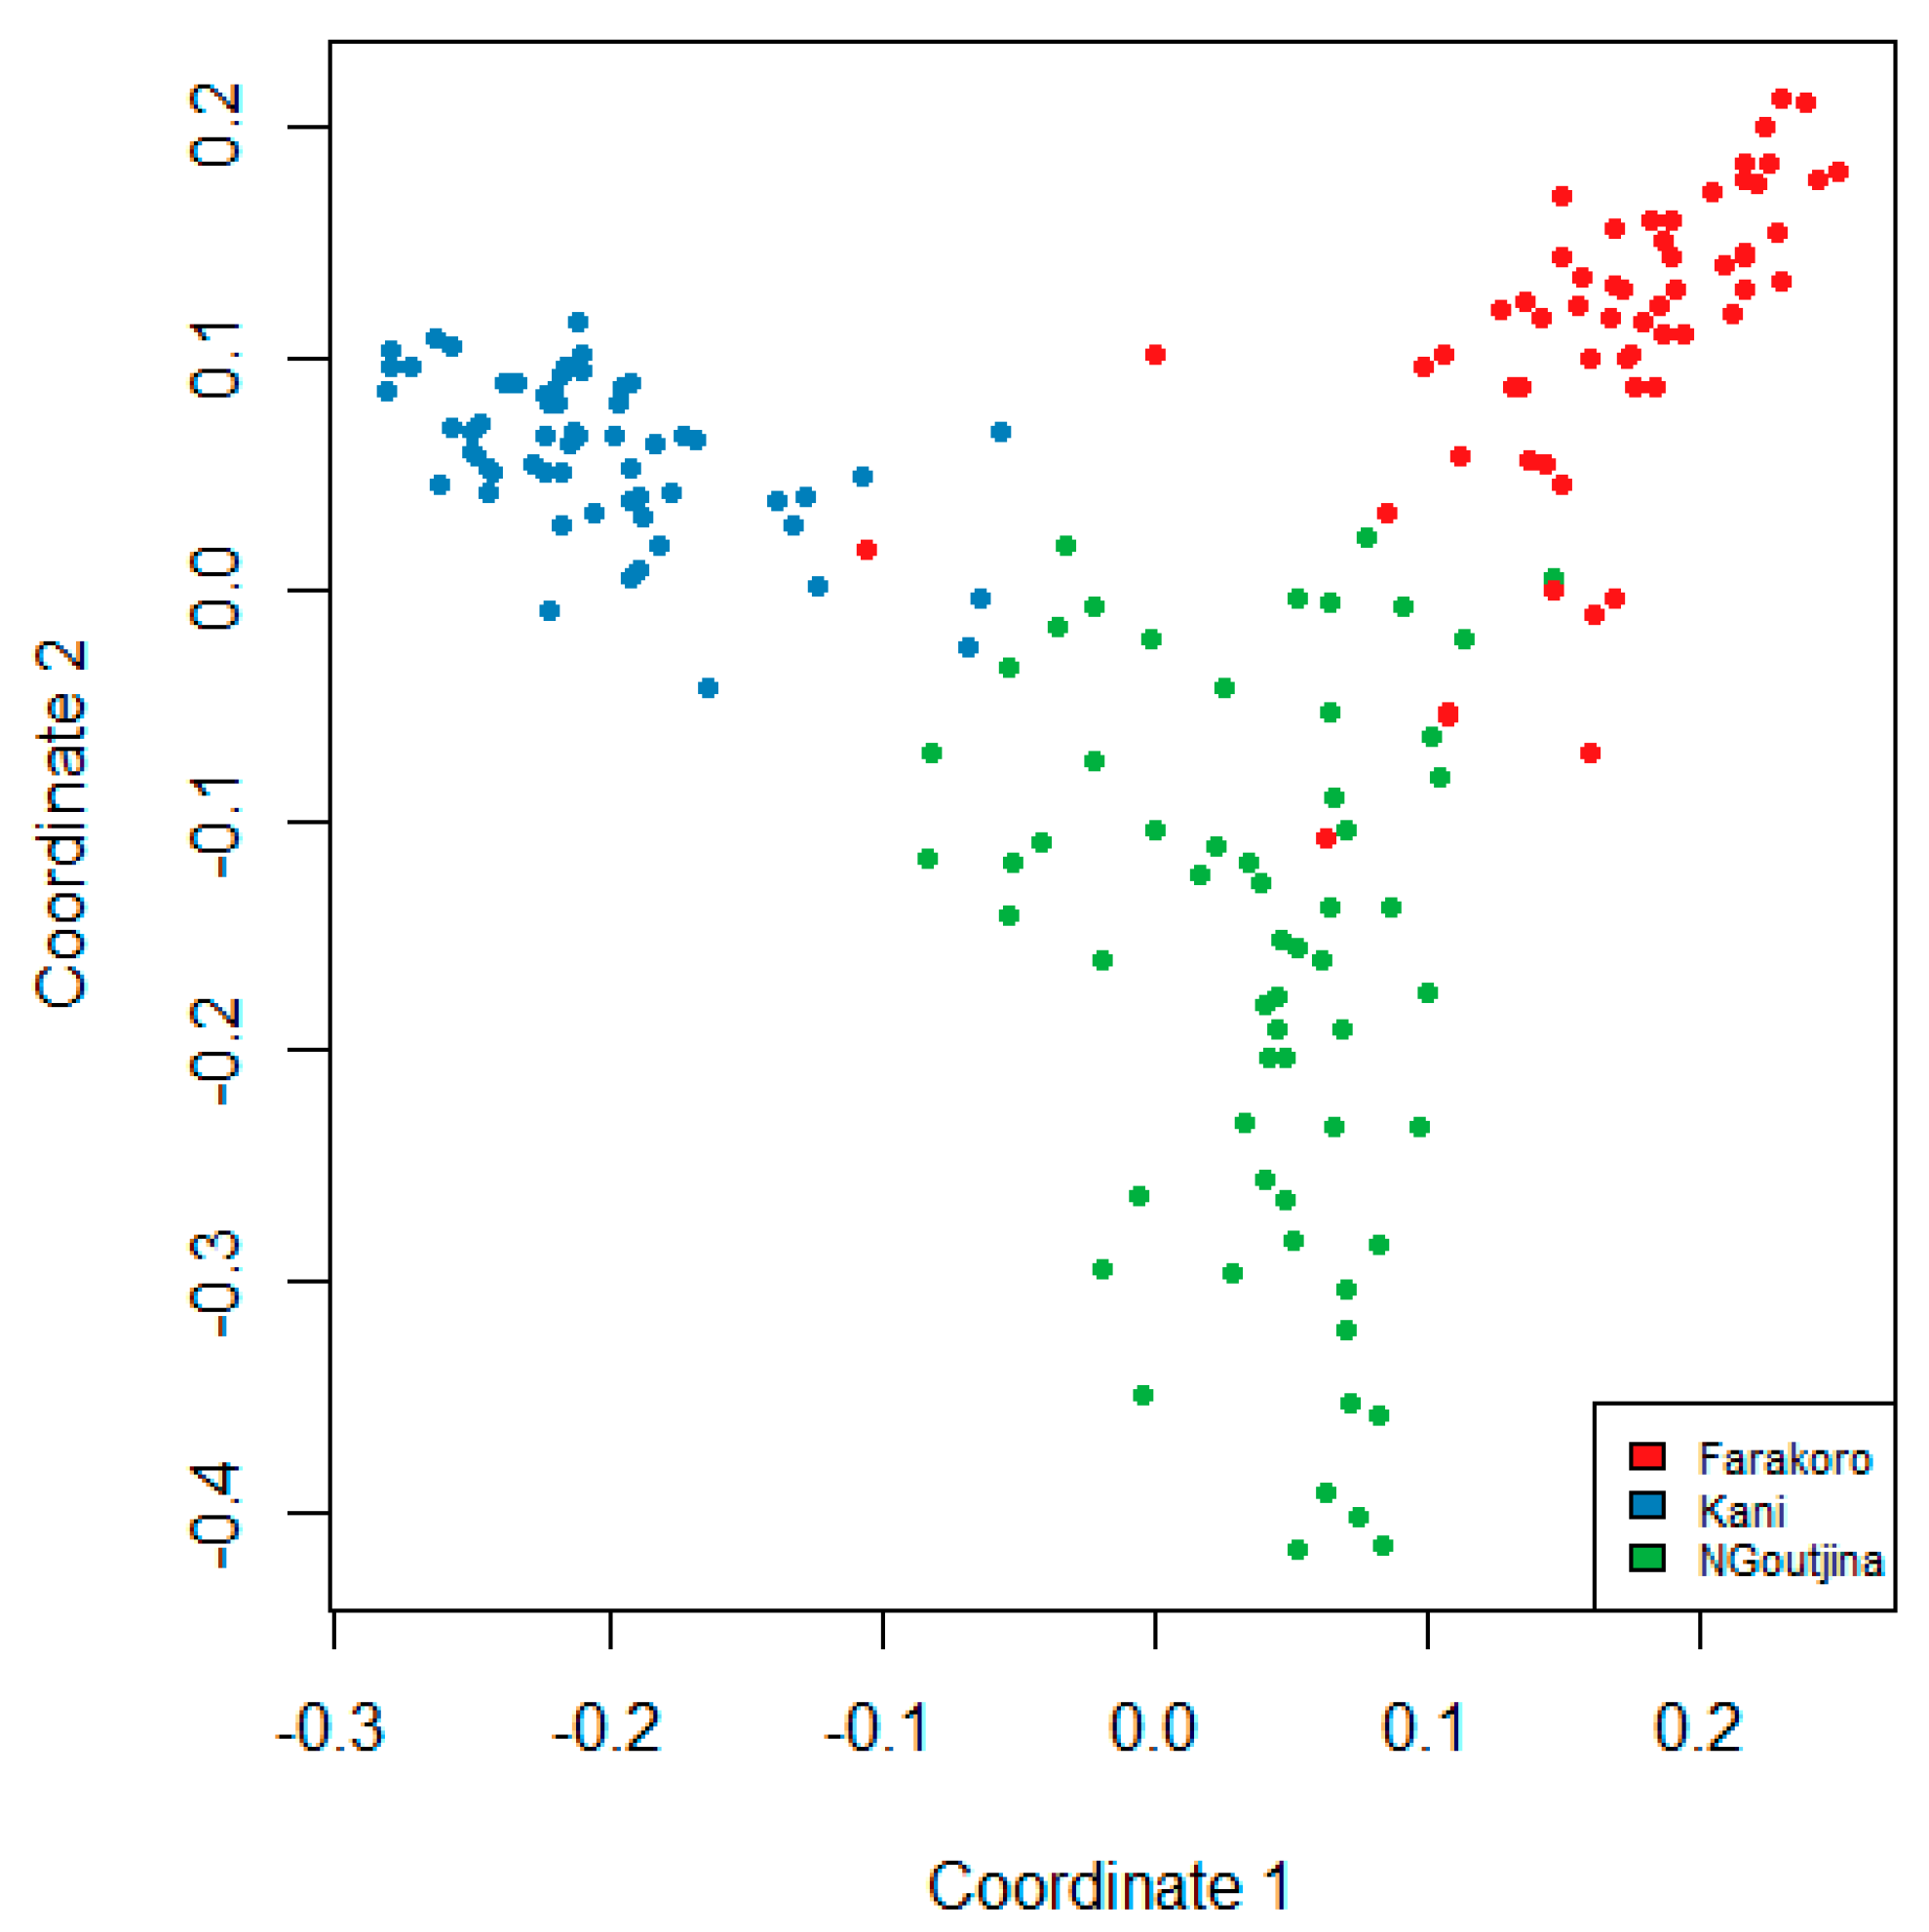
Performance of the tree models resulted in three vulnerability classes of households: the least (FSI = 28.23), the moderately (FSI = 29.68) and the severely vulnerable (FSI = 32.53) households. In relative terms, the severely vulnerable households were mainly located in Farakoro, and the least vulnerable ones were mainly found in Kani (Table 7). About 82% of the households living in Farakoro were severely vulnerable to food insecurity while 98% of those living in Kani were least vulnerable. In N’Goutjina, about 53% were moderately vulnerable while 27% and 18% were respectively least and severely vulnerable. This finding is supported by the result of the multivariate analysis (multidimensional scaling plot, based on 151 asset variables), which split the 180 households into three main clusters (Figure 6). The first cluster mainly contained households from Kani, which clustered apart and were very distant from those living in the other two communities.
Data also indicated that beyond the above-mentioned indicators, there were additional variables that needed attention. The households where members had extra-agricultural income sources, either from self-employment (family business), non-agricultural employment or sales of farm by-products (e.g., animal feed), were less vulnerable to food insecurity.
Also, the diversity of indigenous trees played important role in household food security, with households managing more than six different tree species being more food secure. The age of the women primarily preparing food for the household was also determinant, with the households with younger women being more food secure. However, these cannot operate in isolation, and their effects seemed not to be prominent when other variables are in play.
4. Discussion
4.1. Agricultural Biodiversity along the Urban-Rural Continuum
Urbanization is recognized to negatively impact on biodiversity and have led to concurrent dysfunctional food systems [7,25]. However, findings indicate that this should be contextualized. In this research it was shown that, in absolute terms, the diversity of useful wild species of plants and animals were higher in rural areas (Kani and Farakoro) compared to more urbanized human settings (N’Goutjina). Conversely, it was observed that the diversity of rain-fed annual crops per unit area (area diversity) was rather higher in the more urbanized settings compared to rural areas. An explanation for this trend might be the conversion of habitats of wild diversity into built habitat (buildings, sealed surfaces, and roads), with limited areas allocated for urban agricultural activities. In this context, farms are of smaller size in urban and peri-urban agriculture compared with that in rural areas where farms are of bigger size. However, the relative diversity per unit area is higher on small farm plots of peri-urban agriculture. This trend is consistent with studies indicating that peri-urban agriculture and home gardens are becoming more important in preserving and actively using the diversity of crops in major regions of the world [26,27]. This is favoured by the growing demand for local foodstuffs by a certain category of urban dwellers that certainly conserved some food habits in connection with their culture. It is known that vegetables and other horticultural species produced close to cities increase total agro-biodiversity. It should be noted that there are opportunities in semi-urban areas close to main markets to make more money from vegetable production, and women are the key actors. In this study, some vegetable species such as sweet pepper (Capsicum annuum), melon (Cucumis melo) and cucumber (Cucumis sativus), characteristic of peri-urban agriculture, were exclusively grown in N’Goutjina and Farakoro, which are relatively more urbanized than Kani. Another important result is the observed high beta diversity in Kani. This means that there is a comparatively higher diversity of overall useful biological resources managed by the households of that site. Lower beta diversity in Farakoro and N’Goutjina means lower dissimilarity between the diversity managed by the households that lived in those communities. N’Goutjina also seemed to manage higher tree species compared to the other two communities. N’Goutjina is very close to Koutiala and is a Carrefour, which facilitates selling fruits and other tree products at high price compared to the two others communities. This could support the environmental Kuznets curve hypothesis, which stipulates that humans become more aware of the value of the environment when their living conditions improve, if urbanization is assimilated with higher income per capita and high diversity of planted tree with improved environmental awareness [28].
4.2. Livelihood Assets and Household Food Security
Food security is a complex phenomenon that is under the effects of multiple and complex variables related to access to and control of resources, including human, financial, infrastructural, social, and natural assets [15,16]. Findings of this research indicated that area diversity of crops grown, family labour, land holding, community roles, and household size were not the primary determinants for household food security. The most important indicators of household food security status in rural Koutiala were, rather, the risk attitude of household head, the diversity of wild plants that were managed, off-farm employment or family business, social group membership, and access to water resources for crop irrigation and for livestock. It was clearly observed that wild food plants diversity (a component of the natural capital) was the most important ABD component that significantly improved household food security. Wild harvesting and hunting represented an important asset for the vulnerable households and the fact that households in Kani were less vulnerable could be explained by the high natural capital. In addition, an explanation for this relationship could be the coincidence of the household food shortage period with the abundance of wild foods in the rainy season, when farmers are waiting for crops to mature. This important role played by wild edible biological resources in human diets, food security and health has been recognized and demonstrated in a few studies [7,12,29]. The most vulnerable households also participated more in development programmes (physical asset) and social groups (social asset). This can be seen as “a last solution/strategy” to cope with their situation, when no employment opportunities (financial asset) are available. It was also observed that when vulnerability increases, the head of household takes higher risks (human capital) even though he has never seen anyone taking them before. This is like a “no way” situation where they explore all the possibilities that are available to them, with the hope that things will improve. The existence of dams (infrastructural asset) for agriculture and livestock also improved household food security status. The households that had better access to water resources had better food security status. It was reported that the households living in Farakoro had no market and no school infrastructures in their community. The poor access to market could partly explain the high proportion of vulnerable households in this community.
Several studies have attempted to elucidate the links between process indicators and the outcome indicators of food security. Overall, there is a small relationship between the process indicators and the measures of food security outcomes [17], and this supports the results. In fact, area-level production is itself determined by a number of biotic and abiotic factors. In the context of the dryland systems, the success or failure of crops is sometimes unpredictable. However, it is worth noting that in the current study the area-level production was not measured, but rather the area diversity was assessed as an alternative, as it is demonstrated that more diversified farms are more resilient, thus strengthening the local food systems and environmental sustainability [7,30,31,32,33,34,35].
5. Conclusions
Household food security involves a complex set of factors. In the dryland areas of West Africa characterized by high risks of crop failure, wild diversity and social networks provide safety nets for the rural poor, as demonstrated in this study. In the very difficult conditions, people relied on overall neglected and underutilized species in general and on wild food resources in particular, either for direct household consumption or as income sources to buffer shocks that might hit community members. An important implication of this for research would be to identify the species with the greatest contribution to household food security (HFS), their values (nutritional, economic, and cultural) to the rural poor, and to develop the best ways to increase accessibility and use. Research should therefore increase work on the domestication of the wild species with highest local value and contribution to HFS. The findings also highlighted the importance of local varieties and, ultimately, the contribution of the traditional seed systems, to HFS. It is found that the households with higher diversity of local crop varieties were less food insecure. In fact, this provides insurance owing to the adaptive traits of the traditional varieties which are often best adapted to marginal ecosystems and heterogeneous environment, and most resistant to pests and diseases. This calls for policy actions to strengthen the traditional seed system, which contributes over 90% of total farmers’ seed needs in Mali, and in most developing countries. National and regional seed policies must increase support to the multiplication and commercialization of quality seeds of both improved and promising local crop varieties. In this pursuit, an important support should be given to the traditional seed system, knowing that the bulk of varieties managed in this system are local, allowing smallholders to tap their intrinsic abiotic resistance traits. Government, through research and extension, should strengthen the capacities of the rural poor to manage risks. Particularly, livestock services should be enhanced in the study sites to provide food insecure households with alternative income from their herds. However, whether or not participation in development programmes, extension services, and social networks helped the households to lift out of food insecurity was not in the scope of this study. Further panel data needs to be collected on the surveyed households to be able to answer this question.
Supplementary Materials
The following are available online at https://www.mdpi.com/2071-1050/9/11/2074/s1, Dataset S1: Household food security and capital assets in Koutiala, Mali.
Acknowledgments
This research was undertaken in the framework of the West African Savannas and Dryland Systems CGIAR research program (WAS-DS CRP), financially supported by the CGIAR System’s Funds. Authors are grateful to Sibiry P. Traore of ICRISAT for sharing information on the project sites and to Gervais Ntandou-Bouzitou for his inputs during preparation of the study. Authors are also thankful to the local populations of Kani, Farakoro and N’Goutjina in Mali for their kind participation and for sharing their knowledge and information.
Author Contributions
S.N., R.S.V. and M.R.B. designed the research. S.N., R.S.V., M.R.B., A.S. and H.C. organized and supervised data collection. S.N. performed data analysis and wrote the manuscript. All authors read and improved the manuscript.
Conflicts of Interest
The authors declare no conflict of interest.
Appendix A

Table A1.
Sheet used to capture household coping strategies and their frequencies.
| In the Past 30 Days, If There Have Been Times When You Did Not Have Enough Food or Money to Buy Food, How Often Has Your Household Had to: | Relative Frequency (Freqi) | Severity Ranking (CSRi) | Score (CSRi × Freqi) | ||||
|---|---|---|---|---|---|---|---|
| Pretty Often? (>10 Times/Month) | From Time to Time? (3–10 Times/Month) | Rarely? (1–2 Times/Month) | Never? (0 Time/Month) | ||||
| a. | Be worried to lack food? | ||||||
| b. | Eat unwanted food? | ||||||
| c. | Eat less food diversity and keep eating the same foods? | ||||||
| d. | Rely on less preferred and less expensive foods? | ||||||
| e. | Gather wild food, hunt, or harvest immature crops? | ||||||
| f. | Borrow food, or rely on help from a friend or relative or purchase food on credit? | ||||||
| g. | Consume seed stock held for next season? | ||||||
| h. | Limit portion size at mealtimes? | ||||||
| i. | Restrict consumption of adults in order for small children to eat? | ||||||
| j. | Reduce number of meals eaten in a day? | ||||||
| k. | Completely lack food? | ||||||
| l. | Send household members to eat elsewhere or to beg? | ||||||
| m. | Go to bed without eating (stomach empty)? | ||||||
| n. | Skip entire days without eating? | ||||||
| TOTAL (FSI) | |||||||
References
- Food and Agriculture Organization of the United Nations; International Fund for Agricultural Development; World Food Programme. The State of Food Insecurity in the World. Strengthening the Enabling Environment for Food Security and Nutrition; FAO: Rome, Italy, 2014; p. 53. [Google Scholar]
- United Nations Development Programme. The Millennium Development Goals Report 2014; UNDP: New York, NY, USA, 2014; p. 56. [Google Scholar]
- Farming First, Food and Farming in 2030: Looking Ahead of the Post-2015 Development Agenda. 2014. Available online: http://www.farmingfirst.org/Post2015 (accessed on 25 September 2015).
- Rosen, S.; Meade, B.; Murray, A. International Food Security Assessment, 2015–2025; U.S. Department of Agriculture, Economic Research Service: Washington, DC, USA, 2015.
- Frison, E.A.; Cherfas, J.; Hodgkin, T. Agricultural biodiversity is essential for a sustainable improvement in food and nutrition security. Sustainability 2011, 3, 238–253. [Google Scholar] [CrossRef]
- Commission on Genetic Resources for Food and Agriculture. Biodiversity for Food Security and Nutrition. 30 Years of the Commission on Genetic Resources for Food and Agriculture; FAO: Rome, Italy, 2013; p. 4. [Google Scholar]
- Hodgkin, T.; Hunter, D.; Wood, S.; Demers, N. Agricultural biodiversity, food security and human health. In Connecting Global Priorities. Biodiversity and Human Health: A State of Knowledge Review; Romanelli, C., Cooper, D., Campbell-Lendrum, D., Maiero, M., Karesh, W., Hunter, D., Golden, C., Eds.; World Health Organization and the Secretariat of the Convention on Biological Diversity: Geneva, Switzerland, 2015; pp. 75–96. [Google Scholar]
- Food and Agriculture Organization of the United Nations. The International Organizations’ Contribution to the Implementation of the Programme of Work on Agricultural Biodiversity: How Far Have We Come? CBD: Rome, Italy, 2007; p. 69. [Google Scholar]
- Thrupp, L.A. Linking Agricultural Biodiversity and Food Security: The Valuable Role of Sustainable Agriculture. Int. Aff. 2000, 76, 265–281. [Google Scholar] [CrossRef] [PubMed]
- Remans, R.; DeClerck, F.A.; Kennedy, G.; Fanzo, J. Expanding the view on the production and dietary diversity link: Scale, function, and change over time. Proc. Natl. Acad. Sci. USA 2015, 112, E6082. [Google Scholar] [CrossRef] [PubMed]
- Khoury, C.K.; Bjorkman, A.D.; Dempewolf, H.; Ramirez-Villegas, J.; Guarino, L.; Jarvis, A.; Rieseberg, L.H.; Struik, P.C. Increasing homogeneity in global food supplies and the implications for food security. Proc. Natl. Acad. Sci. USA 2014, 111, 4001–4006. [Google Scholar] [CrossRef] [PubMed]
- Boedecker, J.; Termote, C.; Assogbadjo, A.E.; Van Damme, P.; Lachat, C. Dietary contribution of Wild Edible Plants to women’s diets in the buffer zone around the Lama forest, Benin—An underutilized potential. Food Secur. 2014, 6, 833–849. [Google Scholar] [CrossRef]
- Committee on World Food Security FAO, Reform of the Committee on the World Food Security; FAO: Rome, Italy, 2009; p. 12.
- Institut National de la Statistique du Mali. 4ème Recensement Général de la Population et de l’Habitat du Mali (RGPH), Résultats Définitifs. Série Démographique; Institut National de la Statistique du Mali: Bamako, Mali, 2011; p. 725. [Google Scholar]
- Wolfe, W.S.; Frongillo, E.A. Building household food-security measurement tools from the ground up. Food Nutr. Bull. 2001, 22, 5–12. [Google Scholar] [CrossRef]
- Maxwell, D.G. Measuring food insecurity: The frequency and severity of “coping strategies”. Food Policy 1996, 21, 291–303. [Google Scholar] [CrossRef]
- Hoddinott, J. Choosing Outcome Indicators of Household Food Security; International Food Policy Research Institute: Washington, DC, USA, 1999. [Google Scholar]
- Maxwell, D.; Ahiadeke, C.; Levin, C.; Armar-Klemesu, M.; Zakariah, S.; Lamptey, G.M. Alternative food-security indicators: Revisiting the frequency and severity of ‘coping strategies’. Food Policy 1999, 24, 411–429. [Google Scholar] [CrossRef]
- Maxwell, S.; Frankenberger, T. Household Food Security: Concepts, Indicators, Measurements: A Technical Review; IFAD and UNICEF: Rome, Italy, 1992. [Google Scholar]
- Gross, R.; Schoeneberger, H.; Pfeifer, H.; Preuss, H.-J. The four dimensions of food and nutrition security: Definitions and concepts. SCN News 2000, 20, 20–25. [Google Scholar]
- Colwell, R.K. Estimates: Statistical Estimation of Species Richness and Shared Species from Samples. Version 9.1.0 User's Guide; University of Connecticut: Storrs, CT, USA, 2013. [Google Scholar]
- Crawley, M.J. Tree Models. In The R Book, 2nd ed.; John Wiley & Sons, Ltd.: Silwood Park, UK, 2013; pp. 768–783. [Google Scholar]
- Hothorn, T.; Hornik, K.; Zeileis, A. Unbiased recursive partitioning: A conditional inference framework. J. Comput. Graph. Stat. 2006, 15, 651–674. [Google Scholar] [CrossRef]
- The R Core Team. R: A Language and Environment for Statistical Computing; R Foundation for Statistical Computing: Vienna, Austria, 2013. [Google Scholar]
- McKinney, M.L. Urbanization, Biodiversity, and Conservation. BioScience 2002, 52, 883–890. [Google Scholar] [CrossRef]
- Elyse Messer, A. World Crop Diversity Survives from Peri-Urban to Remote Rural Locations; Pennsylvania State University: State College, PA, USA, 2015. [Google Scholar]
- Watson, J.W.; Eyzaguirre, P.B. Home Gardens and In Situ Conservation of Plant Genetic Resources in Farming Systems. In Proceedings of the Second International Home Gardens Workshop, Witzenhausen, Germany, 17–19 July 2001; Watson, J.W., Eyzaguirre, P.B., Eds.; International Plant Genetic Resources Institute: Witzenhausen, Germany, 2002; p. 192. [Google Scholar]
- Dinda, S. Environmental Kuznets curve hypothesis: A survey. Ecol. Econ. 2004, 49, 431–455. [Google Scholar] [CrossRef] [Green Version]
- N’Danikou, S.; Achigan-Dako, E.G.; Wong, J.L.G. Eliciting Local Values of Wild Edible Plants in Southern Bénin to Identify Priority Species for Conservation. Econ. Bot. 2011, 65, 381–395. [Google Scholar] [CrossRef]
- Jarvis, D.; Fadda, C.; De Santis, P.; Thompson, J. Damage, Diversity and Genetic Vulnerability: The Role of Crop Genetic Diversity in the Agricultural Production System to Reduce Pest and Disease Damage. In Proceedings of the International Symposium, Rabat, Morocco, 15–17 February 2011; Bioversity International: Rome, Italy, 2012. [Google Scholar]
- Altieri, M.A.; Merrick, L. In situ conservation of crop genetic resources through maintenance of traditional farming systems. Econ. Bot. 1987, 41, 86–96. [Google Scholar] [CrossRef]
- Fanzo, J.; Hunter, D.; Borelli, T.; Mattei, F. Diversifying Food and Diets: Using Agricultural Biodiversity to Improve Nutrition and Health; Routledge: London, UK, 2013. [Google Scholar]
- Padulosi, S.; Thompson, J.; Rudebjer, P. Fighting Poverty, Hunger and Malnutrition with Neglected and Underutilized Species (NUS): Needs, Challenges and the Way Forward; Bioversity International: Rome, Italy, 2013. [Google Scholar]
- Padulosi, S.; Bergamini, N.; Lawrence, T. On farm conservation of neglected and underutilized species: Status, trends and novel approaches to cope with climate change. In Proceedings of the International Conference, Frankfurt, Germany, 14–16 June 2011; Bioversity International: Rome, Italy, 2012. [Google Scholar]
- Mulumba, J.; Nankya, R.; Adokorach, J.; Kiwuka, C.; Fadda, C.; De Santis, P.; Jarvis, D. A risk-minimizing argument for traditional crop varietal diversity use to reduce pest and disease damage in agricultural ecosystems of Uganda. Agric. Ecosyst. Environ. 2012, 157, 70–86. [Google Scholar] [CrossRef]
Figure 1.
Survey site.

Figure 2.
The conceptual framework for understanding household food security (source: adapted from Wolfe and Frongillo [15], Gross, Schoeneberger, Pfeifer and Preuss [20], and the Committee on World Food Security FAO [13]).

Figure 3.
Estimated total species richness, Simpson and Shannon’s diversity indices of useful biological resources in Koutiala, based on incidence data.
Figure 3.
Estimated total species richness, Simpson and Shannon’s diversity indices of useful biological resources in Koutiala, based on incidence data.

Figure 4.
Average household wealth index per HFIA category and per village. HFIA= Household Food Insecurity Access.
Figure 4.
Average household wealth index per HFIA category and per village. HFIA= Household Food Insecurity Access.

Figure 5.
Result of the conditional inference with all capitals showing the most important factors for household food security.
Figure 5.
Result of the conditional inference with all capitals showing the most important factors for household food security.

Figure 6.
The multidimensional scaling plot showing the distribution of households following coordinates 1 and 2.
Figure 6.
The multidimensional scaling plot showing the distribution of households following coordinates 1 and 2.

Table 1.
Characteristics of research sites.
| Number | Variables * | N’Goutjina | Farakoro | Kani |
|---|---|---|---|---|
| 1 | Number of households (2009 census) | 437 | 283 | 361 |
| Population, men (2009 census) | 1664 | 1157 | 1214 | |
| Population, women (2009 census) | 1704 | 1067 | 1274 | |
| 2 | Remoteness: Distance to Koutiala, the nearest main town (Km) | 9 | 24 | 40 |
| 3 | Access to public health services (1 = low, 2 = medium, 3 = high) | 3 | 2 | 2 |
| 4 | Access to private health services (1 = low, 2 = medium, 3 = high) | 3 | 1 | 1 |
| 5 | Existence of primary school (1 = yes; 0 = no) | 1 | 0 | 1 |
| 6 | Existence secondary school (1 = yes; 0 = no) | 0 | 0 | 0 |
| 7 | Existence of market (1 = yes; 0 = no) | 1 | 0 | 1 |
| 8 | Road quality (3 = Practicable in all seasons; 2 = Practicable for few months in year; 1 = Impracticable in all seasons) | 3 | 2 | 2 |
| 9 | Access to clean water (1 = low, 2 = medium, 3 = high) | 3 | 2 | 2 |
| 10 | Access to extension services (1 = low, 2 = medium, 3 = high) | 3 | 3 | 3 |
| 11 | Access to credit (1 = low, 2 = medium, 3 = high) | 2 | 1 | 1 |
| 12 | Access to adults education services (1 = low, 2 = medium, 3 = high) | 2 | 2 | 2 |
| 13 | Agricultural infrastructure development (1 = low, 2 = medium, 3 = high) | 2 | 2 | 2 |
| 14 | Freshwater and hydrography (ponds, streams, and rivers) (1 = low, 2 = medium, 3 = high) | 1 | 1 | 1 |
| 15 | Agricultural land (1 = small, 2 = medium, 3 = large) | 2 | 3 | 3 |
| 16 | Pasture land (1 = small, 2 = medium, 3 = large) | 2 | 3 | 3 |
* For variables 3, 4, 9, 10, 11, 12, 13, and 14: Low = more than 2 km away; Medium = 0.5 km–2 km away; High = less than 0.5 km away. For variables 15 and 16: Low = average per household below 5 ha; Medium = average per household between 5 ha and 15 ha; High = average per household above 15 ha.
Table 2.
Livelihood assets and elements measured in the community households.
| Variables | Elements Measured | |
|---|---|---|
| Response Variable | Food security index | 14 short term, food-based coping strategies |
| Explanatory Variables | Natural capital * | Land and freshwater resources Wild plants and animals, including aquatic resources and insects |
| Financial capital | Income from crops and livestock, feeds Employment Housing/habitat Market participation Household goods House and farm water holding facilities Other farm infrastructure | |
| Human capital | Household size Education Age Family labour Number of spouses in house | |
| Social capital | Ethnic background and role in community Networking | |
| Infrastructural or Physical capital | Road quality Schools Health systems Market infrastructure and institutional support Participation in development programmes Clean water Agricultural infrastructures | |
* Here the effect of land and freshwater resources is measured at community level as a random variable, while the main effects of other biological elements (crops, wild plant and animals, aquatic resources, insects) of the natural capital are part of agricultural biodiversity (ABD) and were measured at the household level.
Table 3.
Main household characteristics (N = 180, with 60 per site).
| Parameters (Average per Household) | N’Goutjina | Farakoro | Kani |
|---|---|---|---|
| Agricultural land | 8.35 ± 5.85 | 16.11 ± 9.59 | 18.34 ± 9.78 |
| Household size | 14.70 ± 9.56 | 25.38 ± 18.04 | 27.77 ± 18.21 |
| Family labour | 5.25 ± 4.03 | 10.98 ± 9.99 | 10.11 ± 7.35 |
| Wealth categories (DHS index-based) | |||
| Poorest (frequency, % in brackets) | 21(35.00) | 19(31.67) | 20(33.33) |
| Middle (frequency, % in brackets) | 28(46.67) | 18(30.00) | 14(23.33) |
| Richest (frequency, % in brackets) | 11(18.33) | 23(38.33) | 26(43.33) |
| Total | 60(100) | 60(100) | 60(100) |
Table 4.
Alpha and beta diversity per village.
| Sites | Alpha Diversity | Beta Diversity | p-Value |
|---|---|---|---|
| Farakoro | 23.67 | 4.83 | |
| Kani | 27.67 | 10.83 | p < 0.05 |
| N'Goutjina | 25.67 | 8.33 |
Table 5.
Average number of coping strategies used by households per site, the weighted sum to reflect frequency of use, and their aggregated food insecurity scores.
Table 5.
Average number of coping strategies used by households per site, the weighted sum to reflect frequency of use, and their aggregated food insecurity scores.
| Parameters (Average per Household) | N’Goutjina | Farakoro | Kani |
|---|---|---|---|
| Number of coping strategies used by households | 2.25 ± 1.55 | 3.13 ± 0.79 | 1.40 ± 1.20 |
| Weighted sum to reflect frequency of coping strategies used | 4.98 ± 3.50 | 7.83 ± 2.68 | 2.61 ± 2.44 |
| Food insecurity index of households | 30.43 ± 6.07 | 33.03 ± 3.61 | 27.71 ± 2.62 |
Table 6.
Most important indicators of the status of household food security based on recursive partitioning tree models *.
Table 6.
Most important indicators of the status of household food security based on recursive partitioning tree models *.
| Capital Assets | Most Important Indicators | Partitions | Average Insecurity Index | p-Value |
|---|---|---|---|---|
| Human capital | Risk attitude of the head of household | Low risk-taking High risk-taking | 29.11 31.62 | p < 0.001 |
| Natural capital | Richness of wild food plants managed in the wet season (WFPWS) | WFPWS ≤ 3 WFPWS > 3 | 30.87 28.03 | p = 0.02 |
| Financial capital | Income from non-agricultural employment (INAE) | INAE = No INAE = Yes | 30.82 20.11 | p = 0.007 |
| Social capital | Social group membership (SGM), number | SGM>8 | 31.49 | |
| Responsibilities in the community (RC), number | SGM ≤ 8 & RC ≤ 4 SGM ≤ 8 & RC > 4 | 28.64 29.92 | p < 0.001 | |
| Physical/infrastructural capital | Existence of water dams in village (EWDV) | EWDV = Yes | 27.75 | |
| Existence of open well in village (EOWV) | EWDV = No & EOWV = Yes EWDV = No & EOWV = No | 30.62 32.77 | p < 0.001 |
* To simplify the table, only variables that played as main indicators of household food security status were presented.
Table 7.
Vulnerability groups and there distribution within the studied communities (N = 178). Food insecurity index (FSI).
Table 7.
Vulnerability groups and there distribution within the studied communities (N = 178). Food insecurity index (FSI).
| Vulnerability Groups | n | FSI (Mean) | Villages | n’ | Between Communities (%) | Within Communities (%) | p-Value |
|---|---|---|---|---|---|---|---|
| Least vulnerable | 77 | 28.23 | Farakoro | 02 | 2.60 | 3.33 | |
| Kani | 59 | 76.62 | 98.33 | ||||
| N’Goutjina | 16 | 20.78 | 26.67 | ||||
| Moderately vulnerable | 41 | 29.68 | Farakoro | 08 | 19.51 | 13.33 | |
| Kani | 01 | 2.44 | 1.67 | p < 0.001 | |||
| N’Goutjina | 32 | 78.05 | 53.33 | ||||
| Severely vulnerable | 60 | 32.53 | Farakoro | 49 | 81.67 | 81.67 | |
| Kani | 0 | - | - | ||||
| N’Goutjina | 11 | 18.3 | 18.33 |
© 2017 by the authors. Licensee MDPI, Basel, Switzerland. This article is an open access article distributed under the terms and conditions of the Creative Commons Attribution (CC BY) license (http://creativecommons.org/licenses/by/4.0/).
Share and Cite
MDPI and ACS Style
N’Danikou, S.; Vodouhe, R.S.; Bellon, M.R.; Sidibé, A.; Coulibaly, H. Foraging Is Determinant to Improve Smallholders’ Food Security in Rural Areas in Mali, West Africa. Sustainability 2017, 9, 2074. https://doi.org/10.3390/su9112074
AMA Style
N’Danikou S, Vodouhe RS, Bellon MR, Sidibé A, Coulibaly H. Foraging Is Determinant to Improve Smallholders’ Food Security in Rural Areas in Mali, West Africa. Sustainability. 2017; 9(11):2074. https://doi.org/10.3390/su9112074
Chicago/Turabian StyleN’Danikou, Sognigbe, Raymond Sognon Vodouhe, Mauricio R. Bellon, Amadou Sidibé, and Harouna Coulibaly. 2017. "Foraging Is Determinant to Improve Smallholders’ Food Security in Rural Areas in Mali, West Africa" Sustainability 9, no. 11: 2074. https://doi.org/10.3390/su9112074
Note that from the first issue of 2016, this journal uses article numbers instead of page numbers. See further details here.