
Comparing the Influences of the D/H Ratio, Size, and Facade Design of an Enclosed Square on Its Perceptual Qualities as a Sustainable Urban Space in South Korea

Department of Urban Planning, Gachon University, Seongnam 13120, Korea
Sustainability 2017, 9(4), 675; https://doi.org/10.3390/su9040675
Submission received: 5 February 2017
/
Revised: 21 April 2017
/
Accepted: 21 April 2017
/
Published: 24 April 2017
(This article belongs to the Section Sustainable Urban and Rural Development)
Abstract
:This study examines the dominance of the D/H ratio as a design element for an enclosed urban square, long claimed by numerous urban designers. It claims that like the D/H ratio, other design elements significantly affect the perceptual quality of an enclosed square, but their impacts differ according to the context in which they are applied. The study reviews the literature pertaining to enclosures as an urban design strategy and design elements for an enclosed urban square. Then it presents a comparative analysis of the impact of the D/H ratio and other design elements such as the size of the square and the facade design using a visual assessment survey with computer-simulated images of urban squares. Results of the analysis support the argument that like the D/H ratio, the square size and its facade design have a considerable but distinctly different influence on users’ perceptions of urban squares.
1. Introduction
Yiftachel and Hedgcok state that social sustainability is “the continuing ability of a city to function as a long-term, viable setting for human interaction, communication and cultural development [1] (p. 140)”. Urban squares have been proposed as one of the most important types of places in a city that accommodate such human interaction, communication, and cultural activities [2,3]. Effective urban squares can play an important role in promoting the social sustainability of a city. Therefore, many cities impose regulations or design guidelines to secure the quality of such urban squares by controlling the design of the surrounding buildings and by designing the squares [4,5,6]. For example, the City of New York has design standards even for privately owned public squares and surrounding buildings [5]. Such regulations are more important in South Korea than in other countries where people do not have not much historic experience of enclosed urban squares for diverse social interactions, and have no intrinsic consensus or customs about the spatial characteristics of an effective urban square. This study aims to improve the understanding about the spatial elements of an enclosed urban square, which might contribute to the development of effective regulations for urban squares and their surroundings.
Regarding the spatial characteristics of effective urban squares, architects and urban designers have devoted a great deal of time and interest to the study of the relationship between the distance to height (D/H) ratio and enclosure [7]. First, with regard to the D/H ratio, although many of these designers have asserted strong and even dominant influences of the D/H ratio on the quality of enclosed urban spaces, there are also many other spatial elements that contribute to the quality of such spaces. In addition, while many studies on the relationship between spatial elements and user perception have assumed or implied that spatial elements are independent, free from the influence of other elements, such assumptions may not be valid. Urban spaces such as squares and streets have multiple interrelated elements that together influence the quality of these spaces. For example, the perception of comfort in a particular place may stem not only from visual familiarity or attractive scenery but also shading and temperature, a pleasant odor such as coffee, comfortable furniture, or even interesting but not intimidating activities of people inside the space [8]. Therefore, this study consists of a comparative analysis of multiple spatial elements related to an enclosed urban square rather than scrutiny of one element.
Second, with regard to enclosure, previous studies have focused on how to create enclosed spaces [9,10]. For example, Roger Trancik considered them integral to the design of the built environments for humans [10] (p. 61). However, “enclosure” is just a spatial strategy (a tool or a means) rather than a final goal. Perceptual qualities of spaces such as openness or coziness might more closely resemble such a final goal of design, and prioritizing which qualities (or goals) are more important than others distinctly might differ according to the context of a site or a project. Regarding such contextual differences of urban spaces, Carmona argues that we might judge a successful square designed for civic prestige unsuccessful as a “people place”—a “setting for informal public life” [3] (p. 179). Therefore, this study focuses not on the enclosure itself, but instead on the multiple perceptual qualities of an enclosed space.
The study begins by reviewing the extant literature on enclosed urban spaces, the D/H ratio, and other spatial elements for square design, and then continues by introducing the research hypotheses and research design. Finally, it provides a summary and an interpretation of the results of a comparative analysis.
2. Literature Review on the Enclosure and Design Elements for Urban Square Design
2.1. Enclosed Urban Squares
Camillo Sitte made one of the early arguments for the value of enclosed urban spaces. At the end of the 19th century, Sitte emphasized the enclosure as one of the most important features of urban spaces, particularly from an aesthetic perspective [11]. Later on, interest in enclosed urban spaces revived, particularly in the 1960s, when numerous urban theorists, including Jane Jacobs and William H. Whyte, began to emphasize the social function of public spaces [8,12]. For example, Roger Trancik emphasized the importance of the enclosure and denigrated public spaces of modernist cities as being too open and poorly defined [10]. Recently, Cliff Moughtin described an enclosed urban square as an “outdoor room” for diverse social activities [13].
As mentioned above, however, an enclosure is less a final goal than a strategy for achieving such a goal, and therefore, an enclosure itself does not indicate the creation of a “good” place. From this standpoint, Hillier even warned that the indiscriminate use of “enclosure” without deep contextual consideration could lead to more urban problems than solutions [14] (p. 64). When we judge a square as a “good” enclosed urban place, what does it actually mean? When Kevin Lynch suggested the D/H ratios between 2:1 and 3:1 for an enclosure [15], what kind of enclosed spaces could he have had in mind? In this case, they might have referred to piazzas full of diverse social activities in ancient European cities. However, such public spaces cover only special types of social activities, and we might need a larger variety of spaces to support diverse social activities. For example, in the case of the design of a community square fit for an informal social gathering or small community event such as a flea market, a designer might picture a cozy, closed space. On the other hand, in the case of the design of a square celebrating a national or religious event, the designer may picture a magnificent, open space.
In short, the sense of enclosure might be composed of a number of visual qualities such as openness, magnificence, and coziness, but which qualities take precedence over others depends on the context. The appropriate range of spatial criteria such as the D/H ratios might also differ from case to case. For this reason, this study analyzes various perceptual qualities of urban squares rather than the degrees of enclosure. Particularly, the study includes an analysis of openness, magnificence, coziness, dauntingness, and overall goodness of squares.
2.2. D/H Ratio for Enclosure
Architects and urban designers have long used the D/H ratio as a representative measure of an enclosure of an urban space such as a square or a street. For examples, Alberti suggested a D/H ratio of three to one for a proper enclosure of an urban square [16]. Lynch suggested a D/H ratio of two to one or three to one for a comfortable external enclosure [15] (p. 158). Jakle argued that when “the distance/height ratio falls below 1, space grows increasingly intimate, until eventually it is simply cramped. When distance/height equals 1, a balance is achieved, although ratios of 1, 2, or 3 are, according to Ashihara, more satisfying [17] (p. 48).” Some other researchers examined the relationship between the D/H ratios and people’s preference or perception of urban squares in quantitative ways [18,19,20]. Besides such discussions in the academia, this “ratio” theory has been broadly adopted in practice such as in design guidelines proposed by the public [21,22,23]. For example, the Scottish government suggested D/H ratios between 4:1 and 6:1 for an urban square [23]. These rules about the D/H ratios are based on the belief that the D/H ratio is a dominant design element for an enclosed square and that a square may have an ideal D/H ratio.
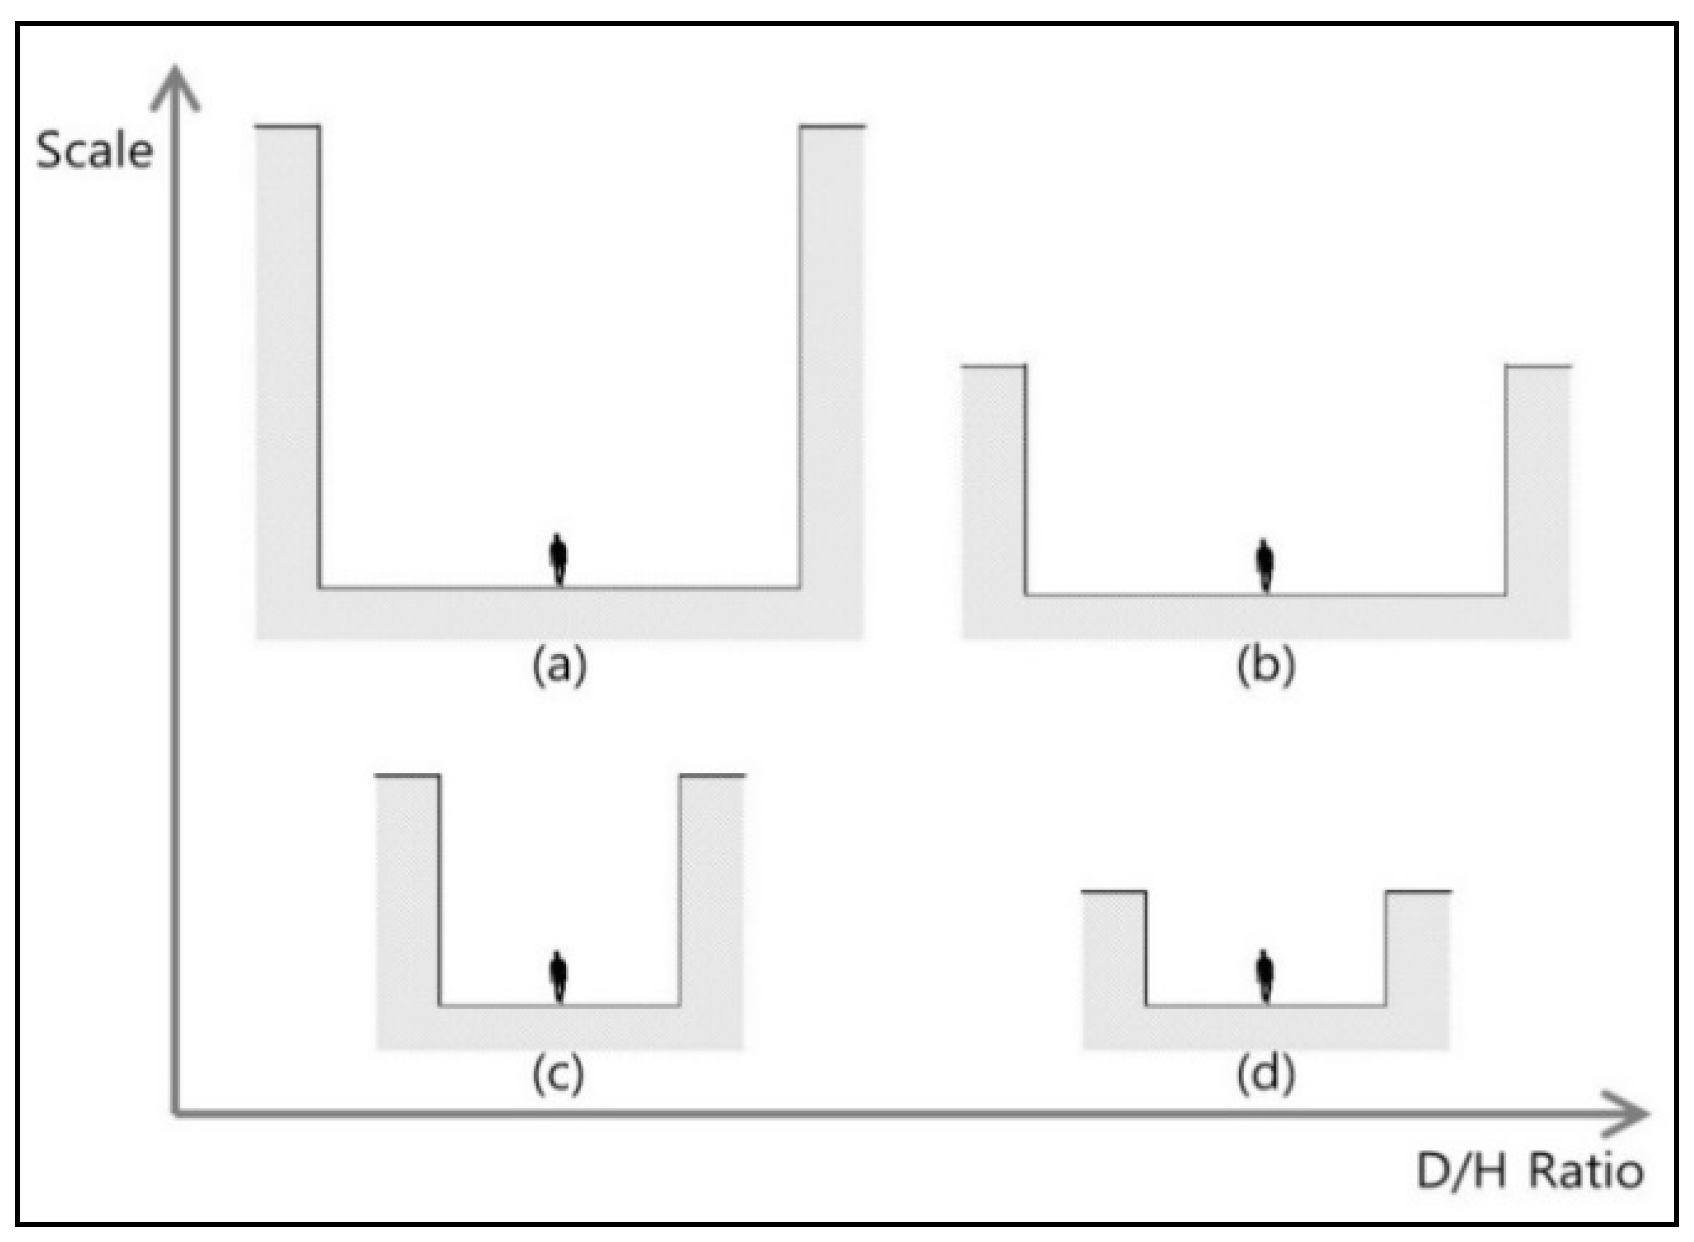
A person’s perception of an enclosed space, however, might be influenced by not only the D/H ratio but also other elements of squares such as their sizes, the architectural details, or the continuity of surrounding building facades. For instance, in Figure 1, (a) and (c) have the same D/H ratio of 1:1, but (a) is larger than (c) in scale. A person in (a) might have a different sense of enclosure from that of a person in (c). The former might feel the square (a) is open and magnificent while the latter might feel the square (c) is tight and cozy. By knowing only the D/H ratio, we cannot tell how a person might feel in such spaces.
Another example that disproves previous arguments about the D/H ratio is St. Peter’s Square, whose D/H ratio is more than 11/1. This space provides a good sense of enclosure for the square, and it is doubtful that St. Peter’s Square with a D/H ratio of 2/1 or 3/1 would proffer a more appropriate sense of enclosure, as Lynch argued [15]. One explanation is that the purpose of the St. Peter’s Square was different from that of general community squares that Lynch might have in mind. It was “so that the greatest number of people could see the Pope give his blessing, either from the middle of the facade of the church or from a window in the Vatican Palace” [24] (p. 175).
2.3. Other Design Elements for an Urban Square
Besides the D/H ratio, theorists have suggested that other elements may be integral to the design of an enclosed urban space. Such elements include the square size, the facade design of the surrounding buildings, the location and the size of the dominating building, objects in the square, patterns and materials of the ground plane, the landscape, and the site furniture [24]. However, these elements, unlike the D/H ratio, have not been emphasized or scrutinized with regard to their applications.
Among the design elements for urban squares, this study comprehensively analyzed the impacts of only the first two design elements—the square size and the facade design—on the quality of enclosed urban squares and compared them to the impact of the D/H ratio. The purpose was not to examine all of the elements. The main goal of this study is to demonstrate that first, other design elements influence enclosed urban squares as much as the D/H ratio does, and second, the design elements, including D/H ratios, influence perceptions of the quality of urban squares in distinct ways.
With regard to the influence of the size of urban squares, some theorists have suggested abstract principles while others have stressed concrete quantities for the ideal square. Sitte, for example, emphasized the relative size of a square to that of a building dominating it, that is, the proportion between them, rather than suggesting any concrete sizes for the ideal urban square [11] (pp. 177–187). He argued that the perceptual effect of the square size did not increase in proportion to its actual size. Lynch argued that certain sizes of urban squares might be more comfortable than others because of a human’s visual perception or body size, stating that “Most of the successful enclosed squares of the past have not exceeded 140 m in the smaller dimension” [15] (p. 157). For a similar reason, Jan Gehl proposed a maximum distance of 100 m for urban squares [25] (p. 35). In addition, Alexander recommended smaller sizes of squares, saying “They work best when they have a diameter of about 60 feet” [26] (p. 311).
With regard to facade design, Roger Trancik, who was heavily influenced by Sitte’s work, argued that the details of surrounding building facades such as “transparency, opacity, openings, and surface ornaments” affect the space as D/H ratios do [10] (p. 61). In addition, Léon Krier suggested that the architectural design of the surrounding buildings should be in harmony with the shapes of public spaces [27]. However, they did not suggest in detail how the design of building facades would affect people’s perception of the square.
3. Research Hypotheses
To accomplish the research goals to examine the generally claimed dominance of the D/H ratio over other design elements in affecting the perceptual qualities of urban squares and to show how different design elements affect the perception of the square differently, this study developed the following three operational hypotheses.
Hypothesis 1.
In addition to the D/H ratio of a square, its size and the facade design of the buildings surrounding it also significantly influence people’s evaluation of the visual qualities of the square.
Hypothesis 2.
With respect to the visual qualities that one might assess—such as openness, magnificence, coziness, or dauntingness—the D/H ratio of a square, the square size, and the facade design of its surrounding buildings influence people’s evaluation of the square differently.
Hypothesis 3.
With respect to the activities one might assess—such as wandering, informal gatherings, or formal events—the D/H ratio of a square, the square size, and the facade design of its surrounding buildings influence people’s evaluation of the squares differently.
4. Research Design
4.1. Visual Assessment Survey Design
To examine the hypotheses above, this study conducted a visual assessment survey [28] with 48 undergraduate students majoring in urban planning or architecture. The participants of the survey were recruited from urban design courses at a university in Korea. To control the impact of external factors that were outside the scope of this study, the survey included simulated images of urban squares instead of photographed images of real urban squares.
The independent variables were the three design elements (i.e., D/H ratios, sizes, and facade styles) reflected in the simulated images; the control variables were external factors related to the participants’ characteristics; and the dependent variables were the participants’ assessments of the simulated urban squares. A description of each set of variables follows.
4.2. Variables
4.2.1. Independent Variables
The research design included three D/H ratios—2:1, 5:1, and 10:1. The 2:1 or 3:1 ratio that theorists have suggested for comfortable enclosure [15,17] and the images of urban squares with D/H ratios smaller than 2:1 only slightly differ from those of squares with a D/H ratio of 2:1 when they are projected on a screen. Then, the research design included four different square sizes ranging from a 25 m × 25 m, in which people can easily see one another, to a 200 m × 200 m, a size close to that of St. Peter’s Square. Finally, regarding facade designs, the author applied a classic style with elaborate architectural details, a modern style with simple grid patterns, and an empty wall, which did not represent all the types of facade styles but differed from each other enough to test that influences could vary depending on the facade styles. The author did not use a finer classification of building facade styles for the following reasons. First, a finer classification of building facade styles would drastically increase the number of square images that the respondents should evaluate during the survey. For example, if five styles would be used instead of three, the total number of images would increase from 36 to 60. Such increase in the number of images and consequent extension of the survey time might distract the respondents. Second, the author was concerned that the respondents might not be able to distinguish the finely classified building styles developed in the Western countries such as Gothic, Baroque, Rococo, and Romanesque. Most South Koreans do not have significant experience of building styles other than modern styles because cities in South Korea have experienced rapid urbanization since the 1960s and most buildings have followed modern styles.
Finally, the survey included images of 36 urban squares covering all combinations of the three elements (i.e., three D/H ratios, four square sizes, and three facade designs) (Table 1).
4.2.2. Control Variables
In addition to the three design elements above, factors related with the participants’ characteristics—such as school year, experience traveling abroad, large city residence, and sex—were included as control variables in the analysis. First, regarding school year, the author grouped first- and second-year students as a lower grade group and the rest as an upper grade group as their prior knowledge about urban environments may have influenced their assessments. Second, regarding experience traveling abroad, the author classified the respondents according to travel locations and periods. Particularly, the participants’ experience traveling in Western cities may influence their scores because enclosed urban squares are more common in Western cities than in the Orient. Then, regarding large city residence, the author classified the respondents according to the population of the city in which they had lived for the longest time. Urban squares are more common in big cities than in small or medium cities. Therefore, the evaluation of those who have lived in big cities may differ from that of the rest. These variables are in Table 2 below.
4.2.3. Dependent Variables
The dependent variables were categorized into two groups: (1) Perceptual qualities of the square and (2) suitability of the square for suggested social activities. The enclosure of an urban square itself is less an ultimate goal than a strategy to create a good urban place for its users. The criteria for a good urban square include various dimensions—such as openness, coziness, and magnificence—which sometimes conflict. Moreover, priority among dimensions may change according to its expected uses. For example, a human-scale and cozy square might be suitable for informal social activities for a small neighborhood while a grand and magnificent square might be appropriate for formal national events. In addition, the proper D/H ratio for one case may differ from that of the other, which might be the same for the other design elements. Therefore, it is important that an architect be aware of how the elements influence such dimensions and the expected activities when designing urban squares.
For such reasons, as dependent variables, the study included the respondents’ assessments of the perceptual qualities of the five dimensions related with an enclosed urban square and for the suitability of the square for three types of social activities (Table 3). The respondents scored the images on a five-point Likert scale.
4.3. Process of the Computer Simulation and Visual Assessment Survey
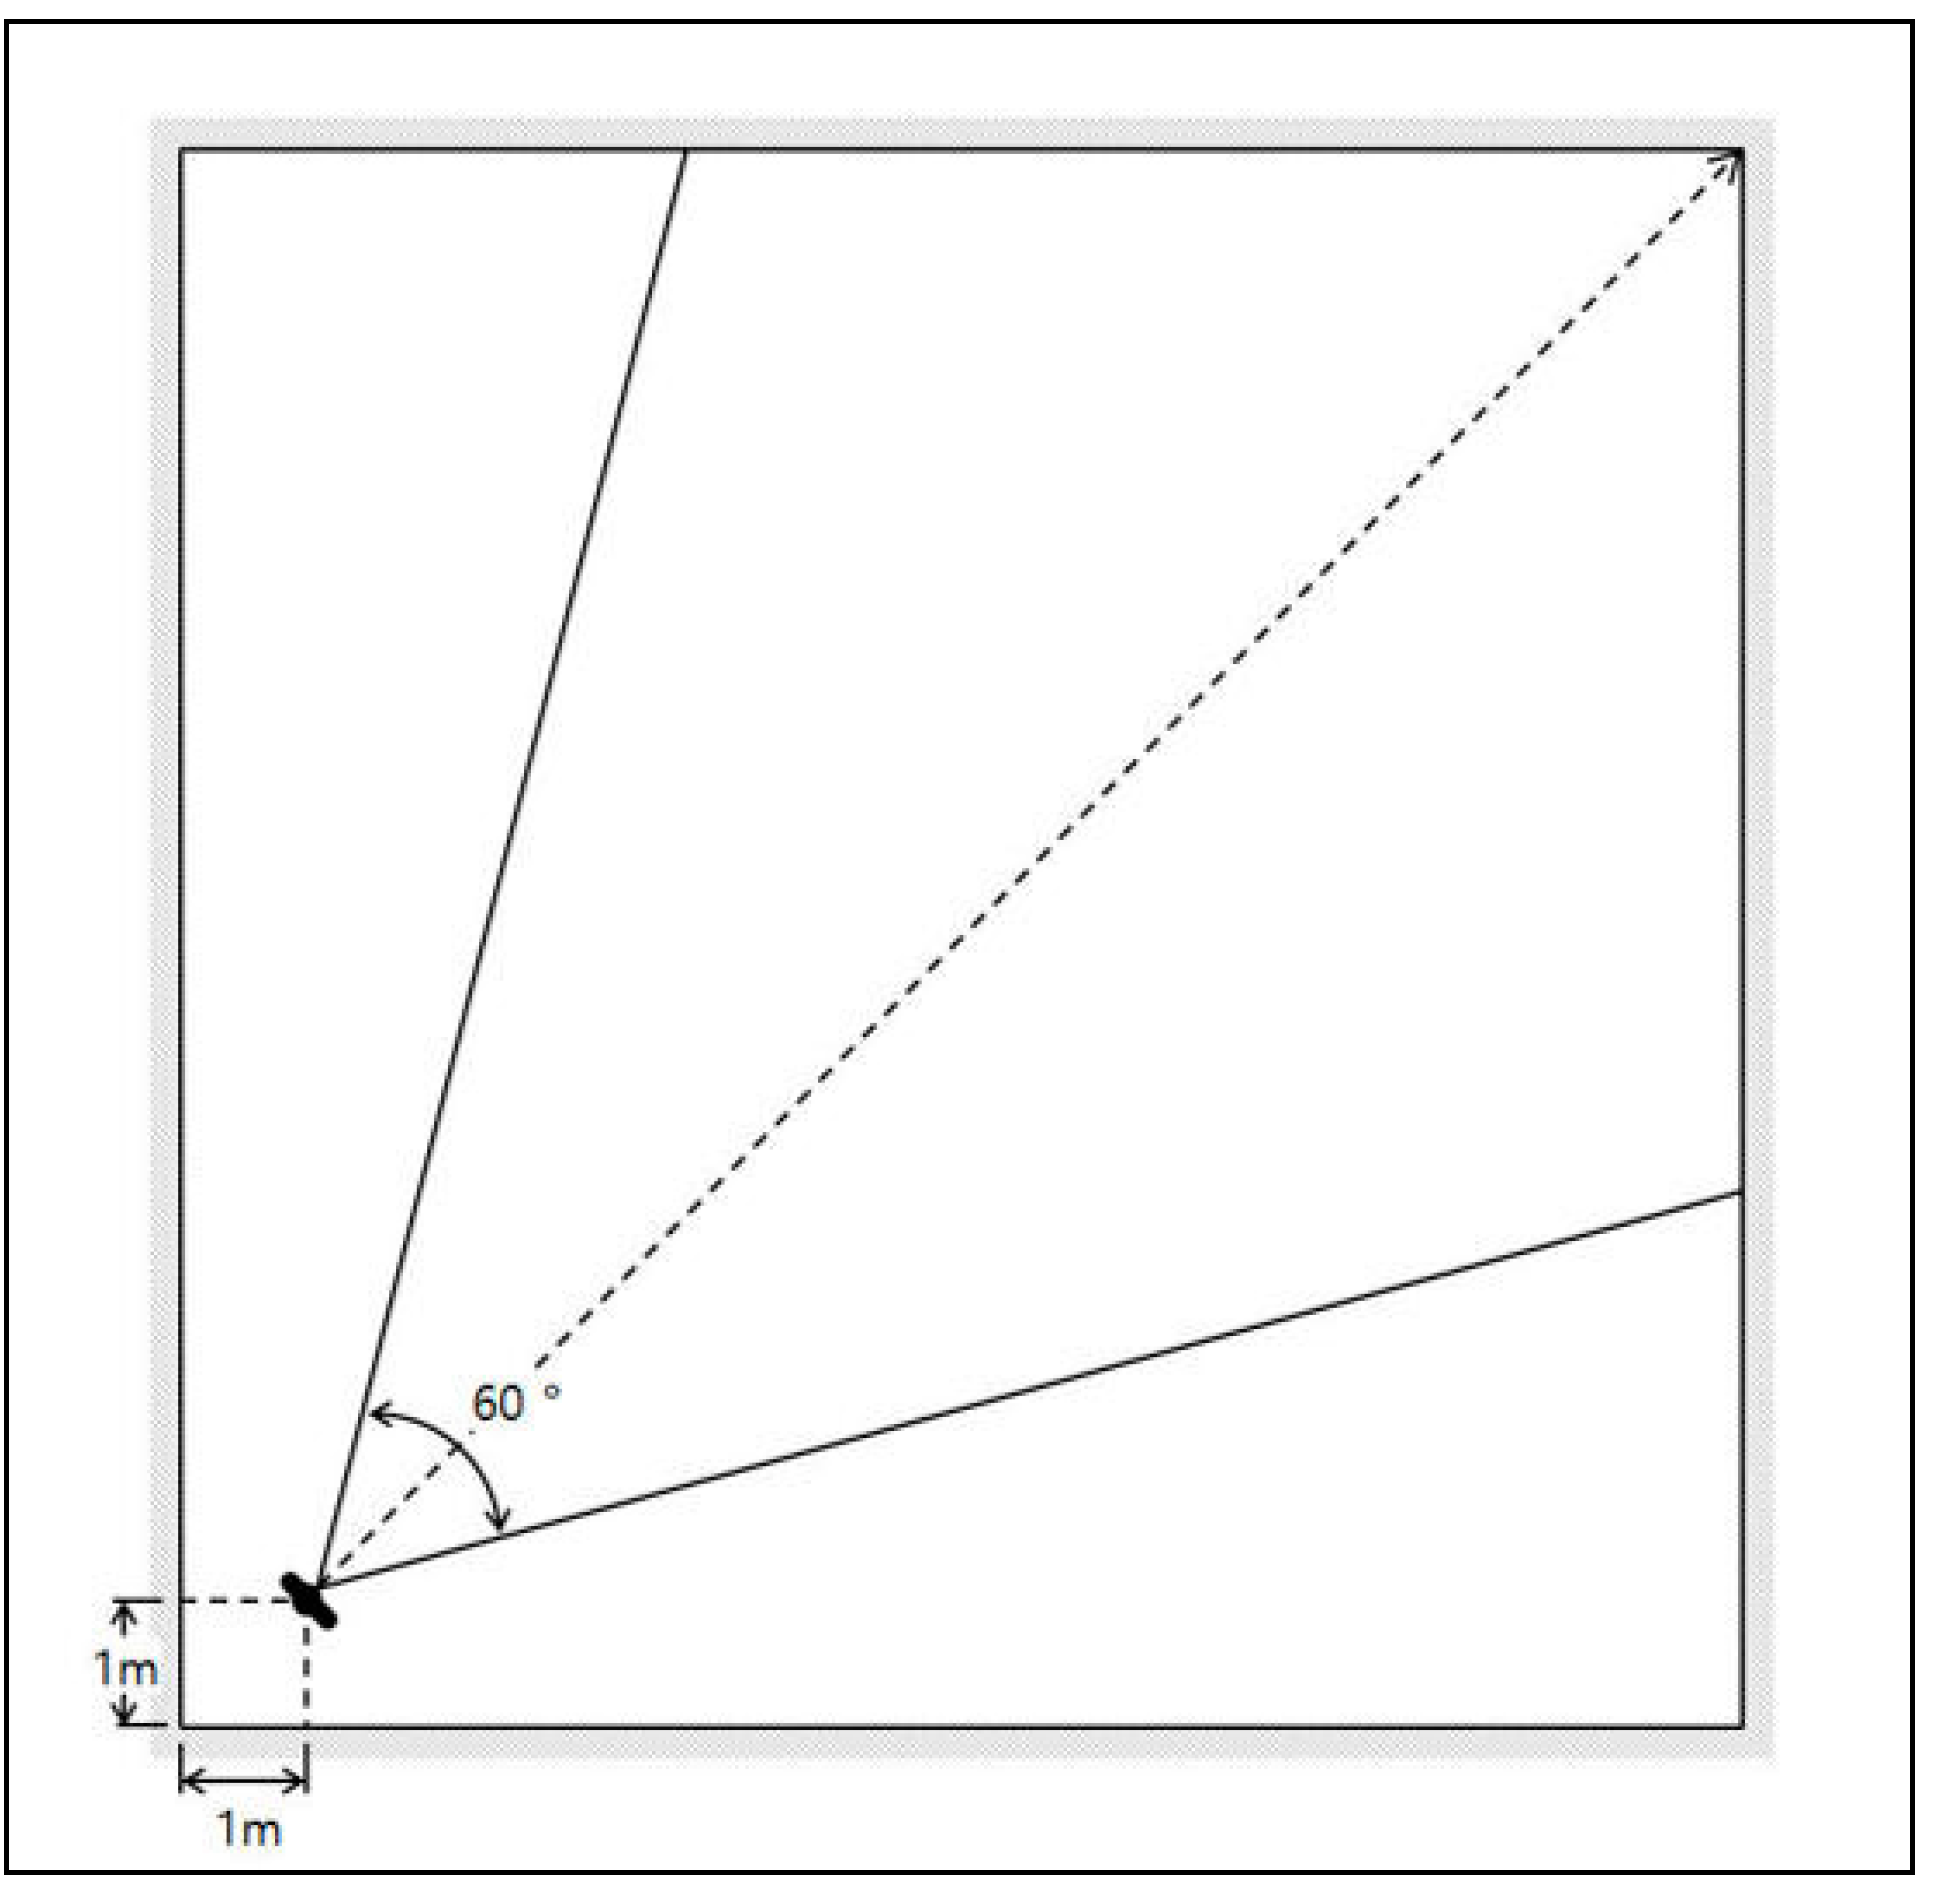
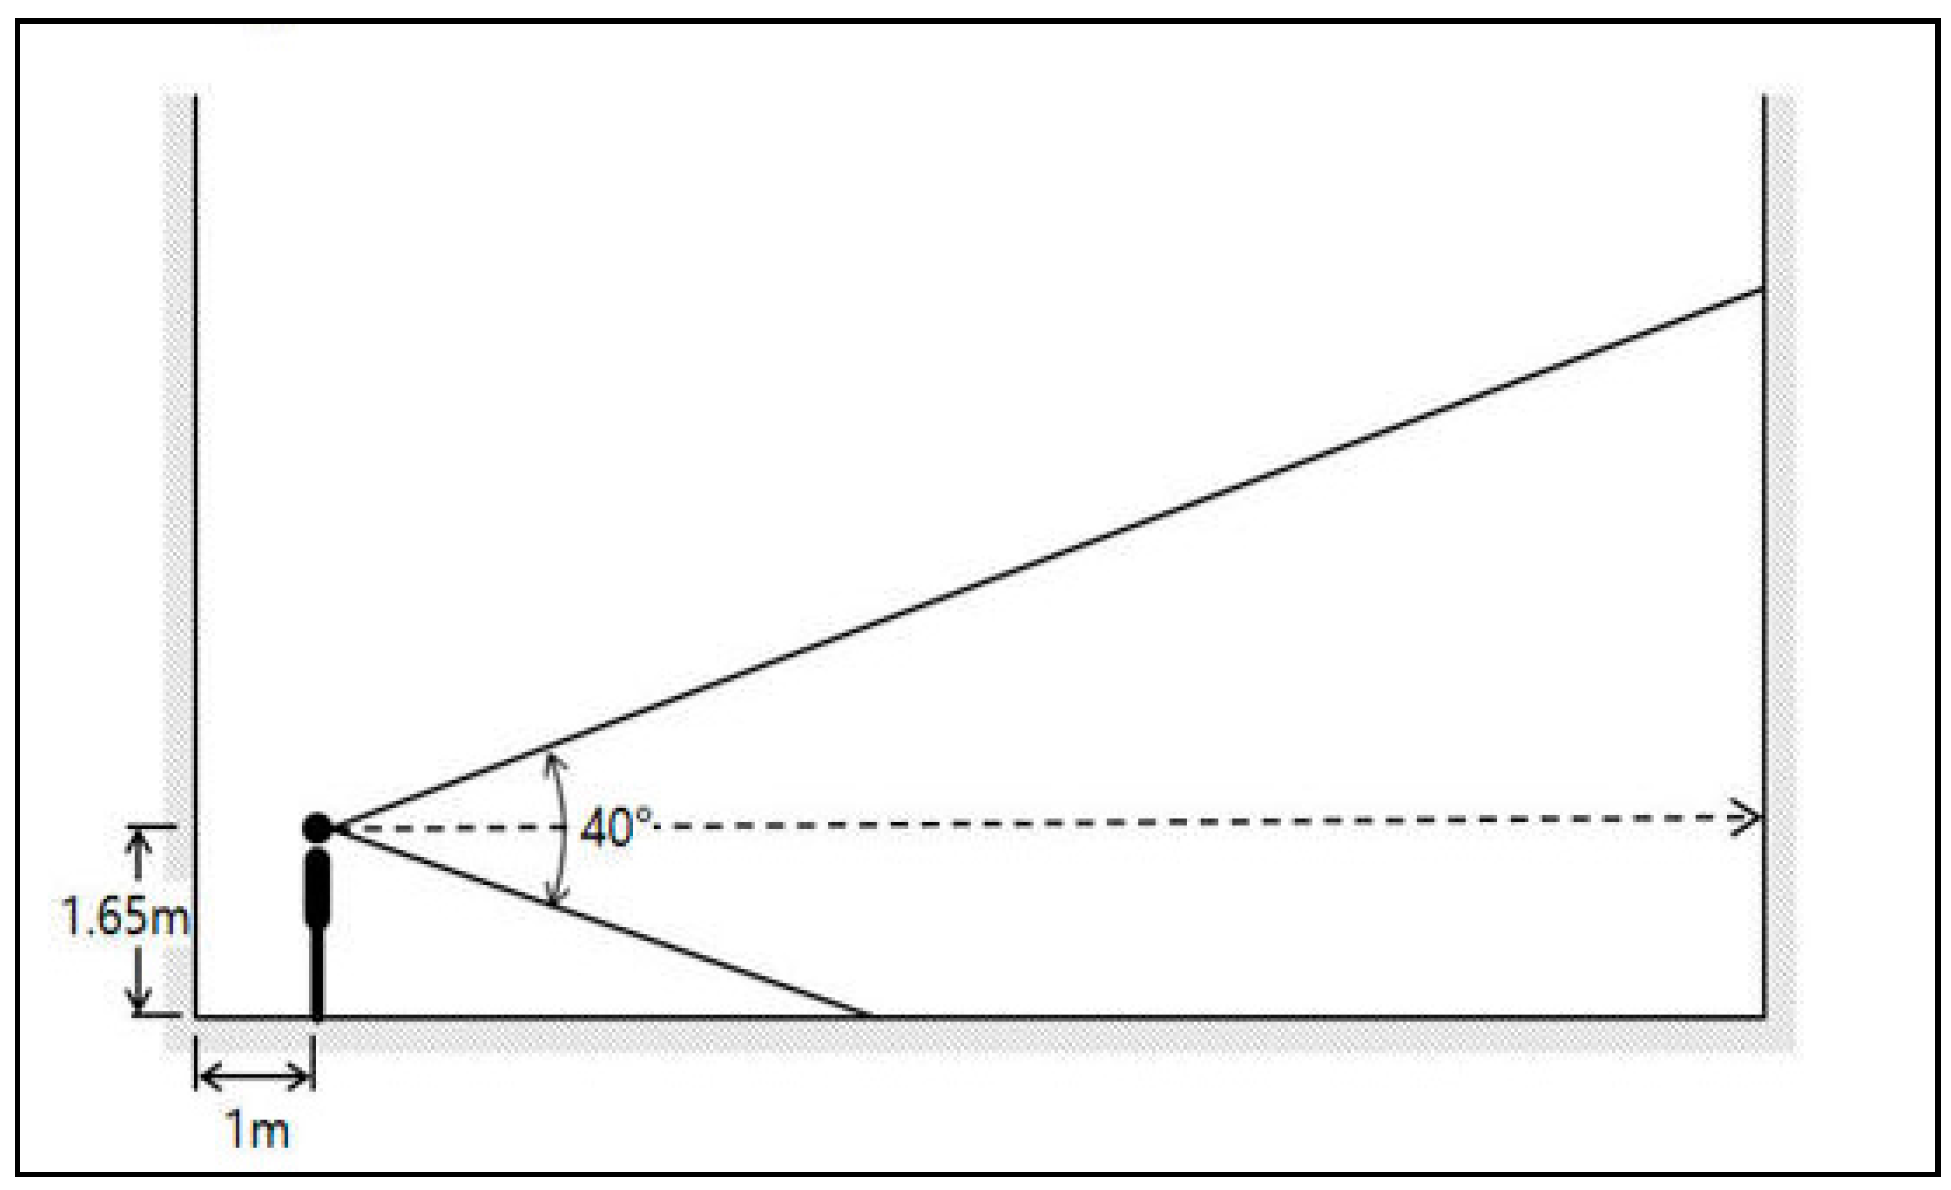
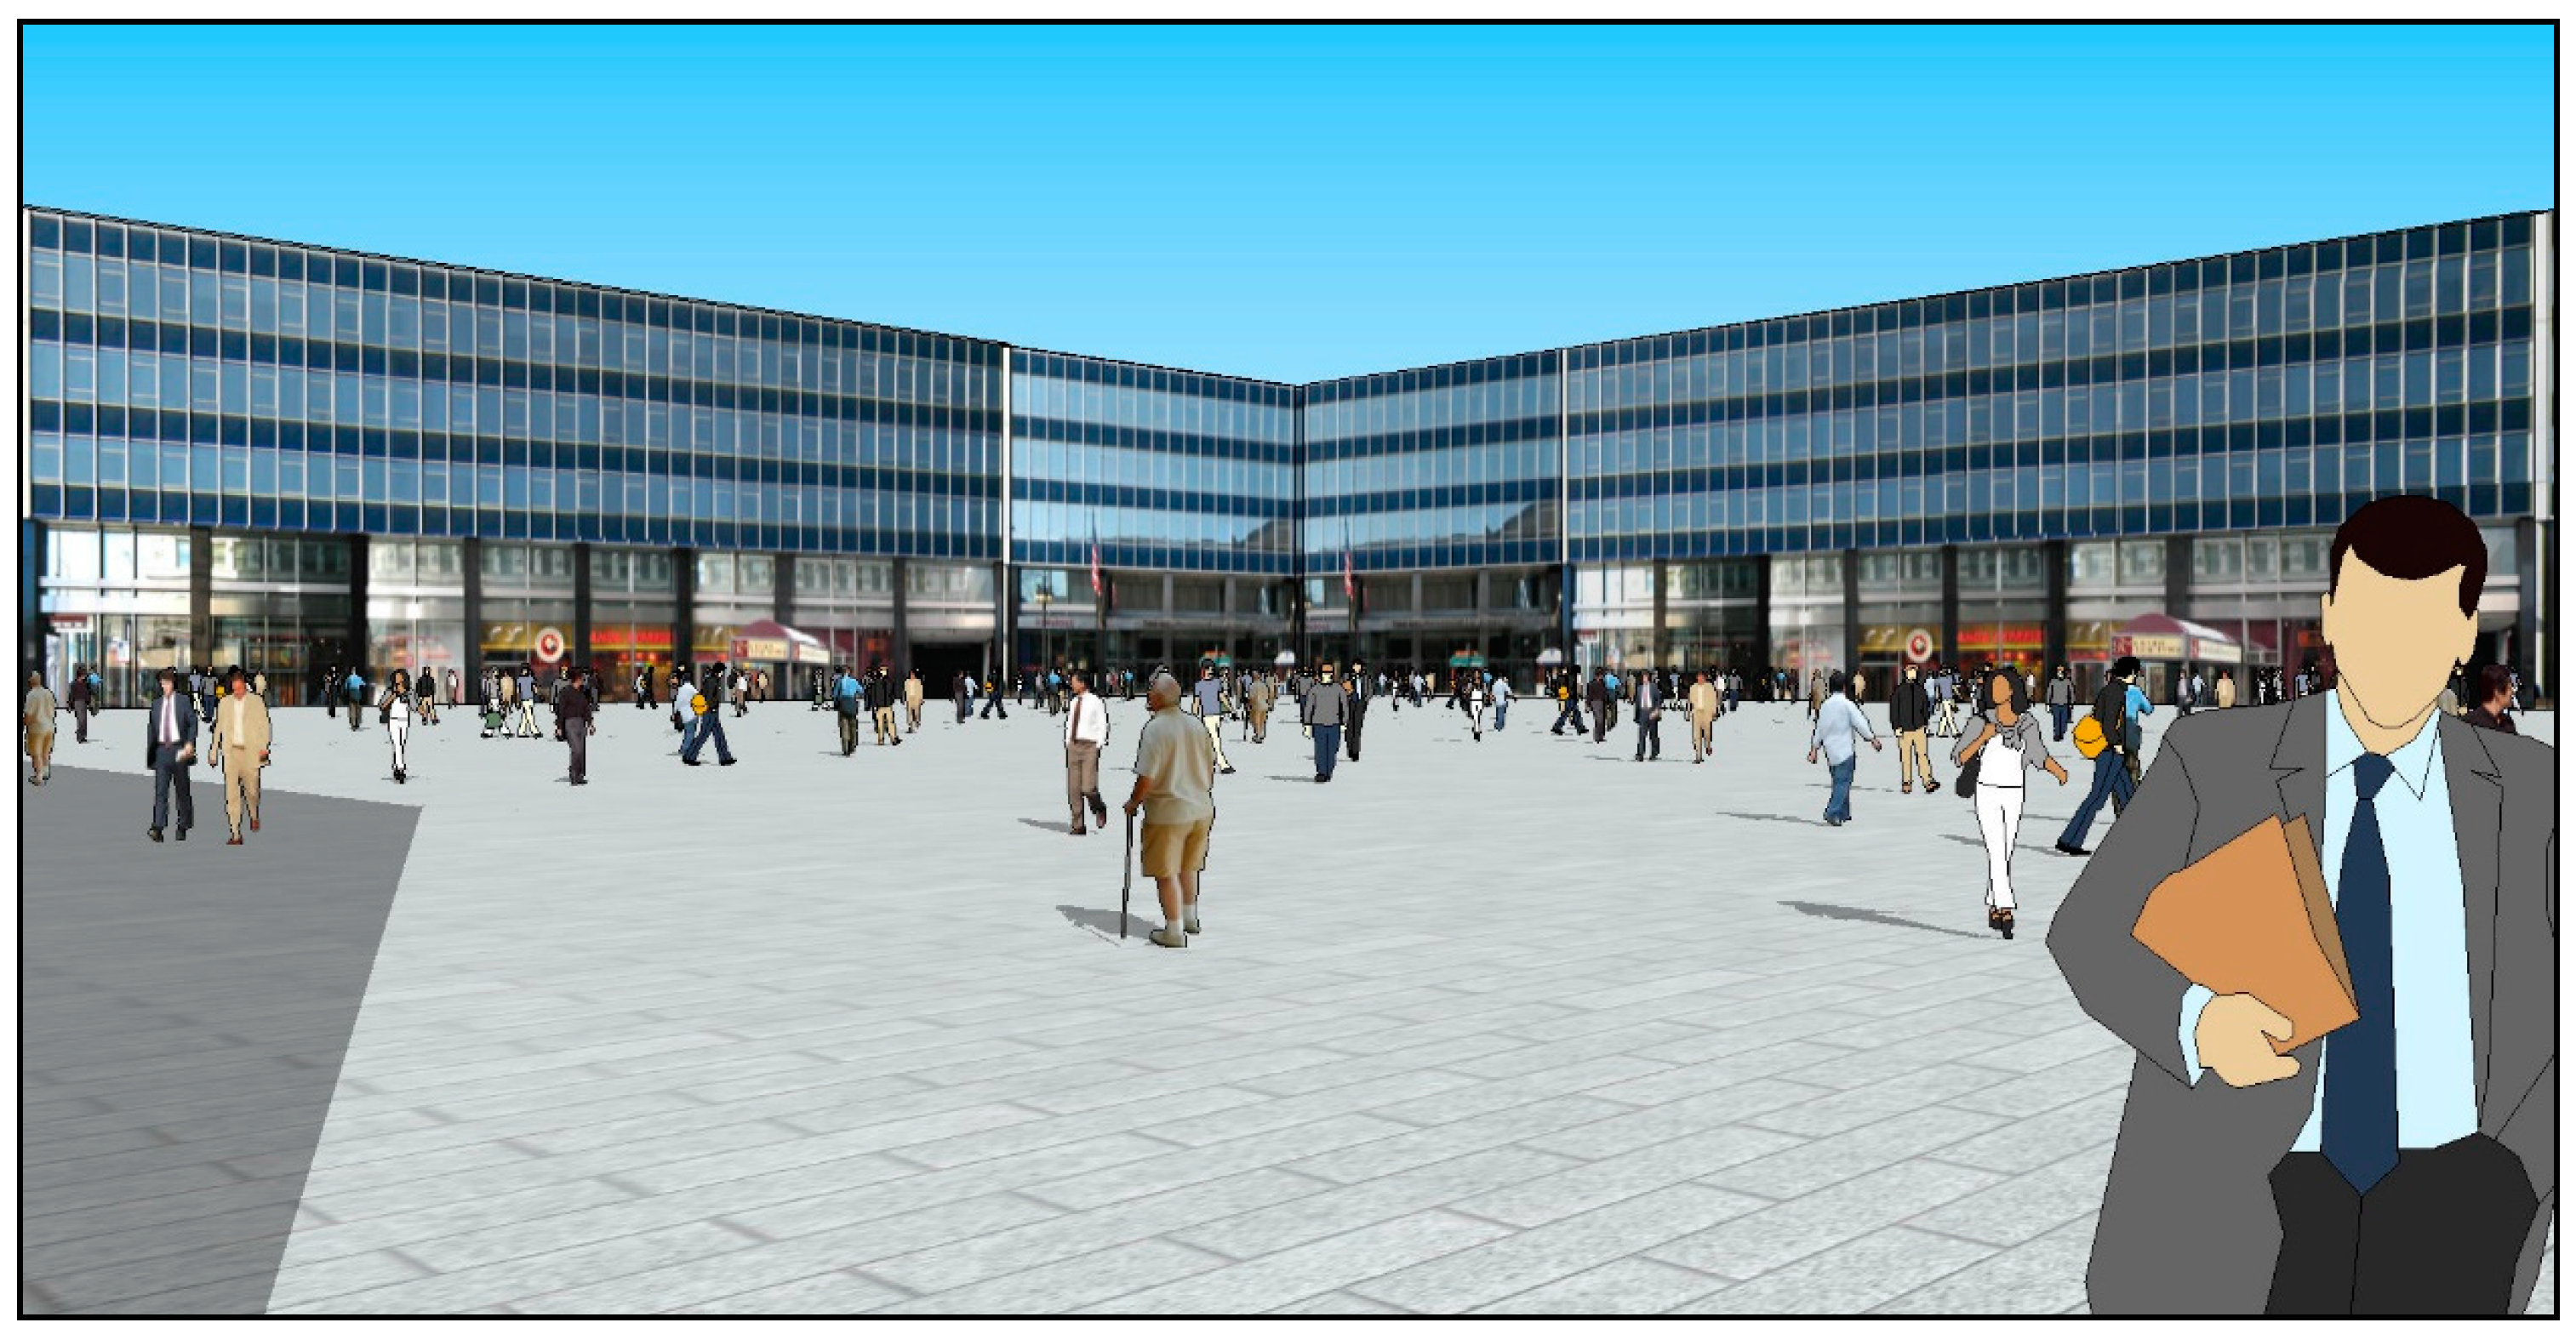
To simulate the 36 urban squares that cover all combinations of D/H ratios, square sizes, and facade designs listed in Table 1, this study used SketchUp Make 2016. After simulating the squares, the author took snapshots of the squares from the same location at the same vertical and horizontal angles (Figure 2 and Figure 3), selecting the position to simulate a scene that a person could see when entering from a corner of the square. The eye height was 165 cm, based on the average height of a Korean male (174.9 cm) [29].
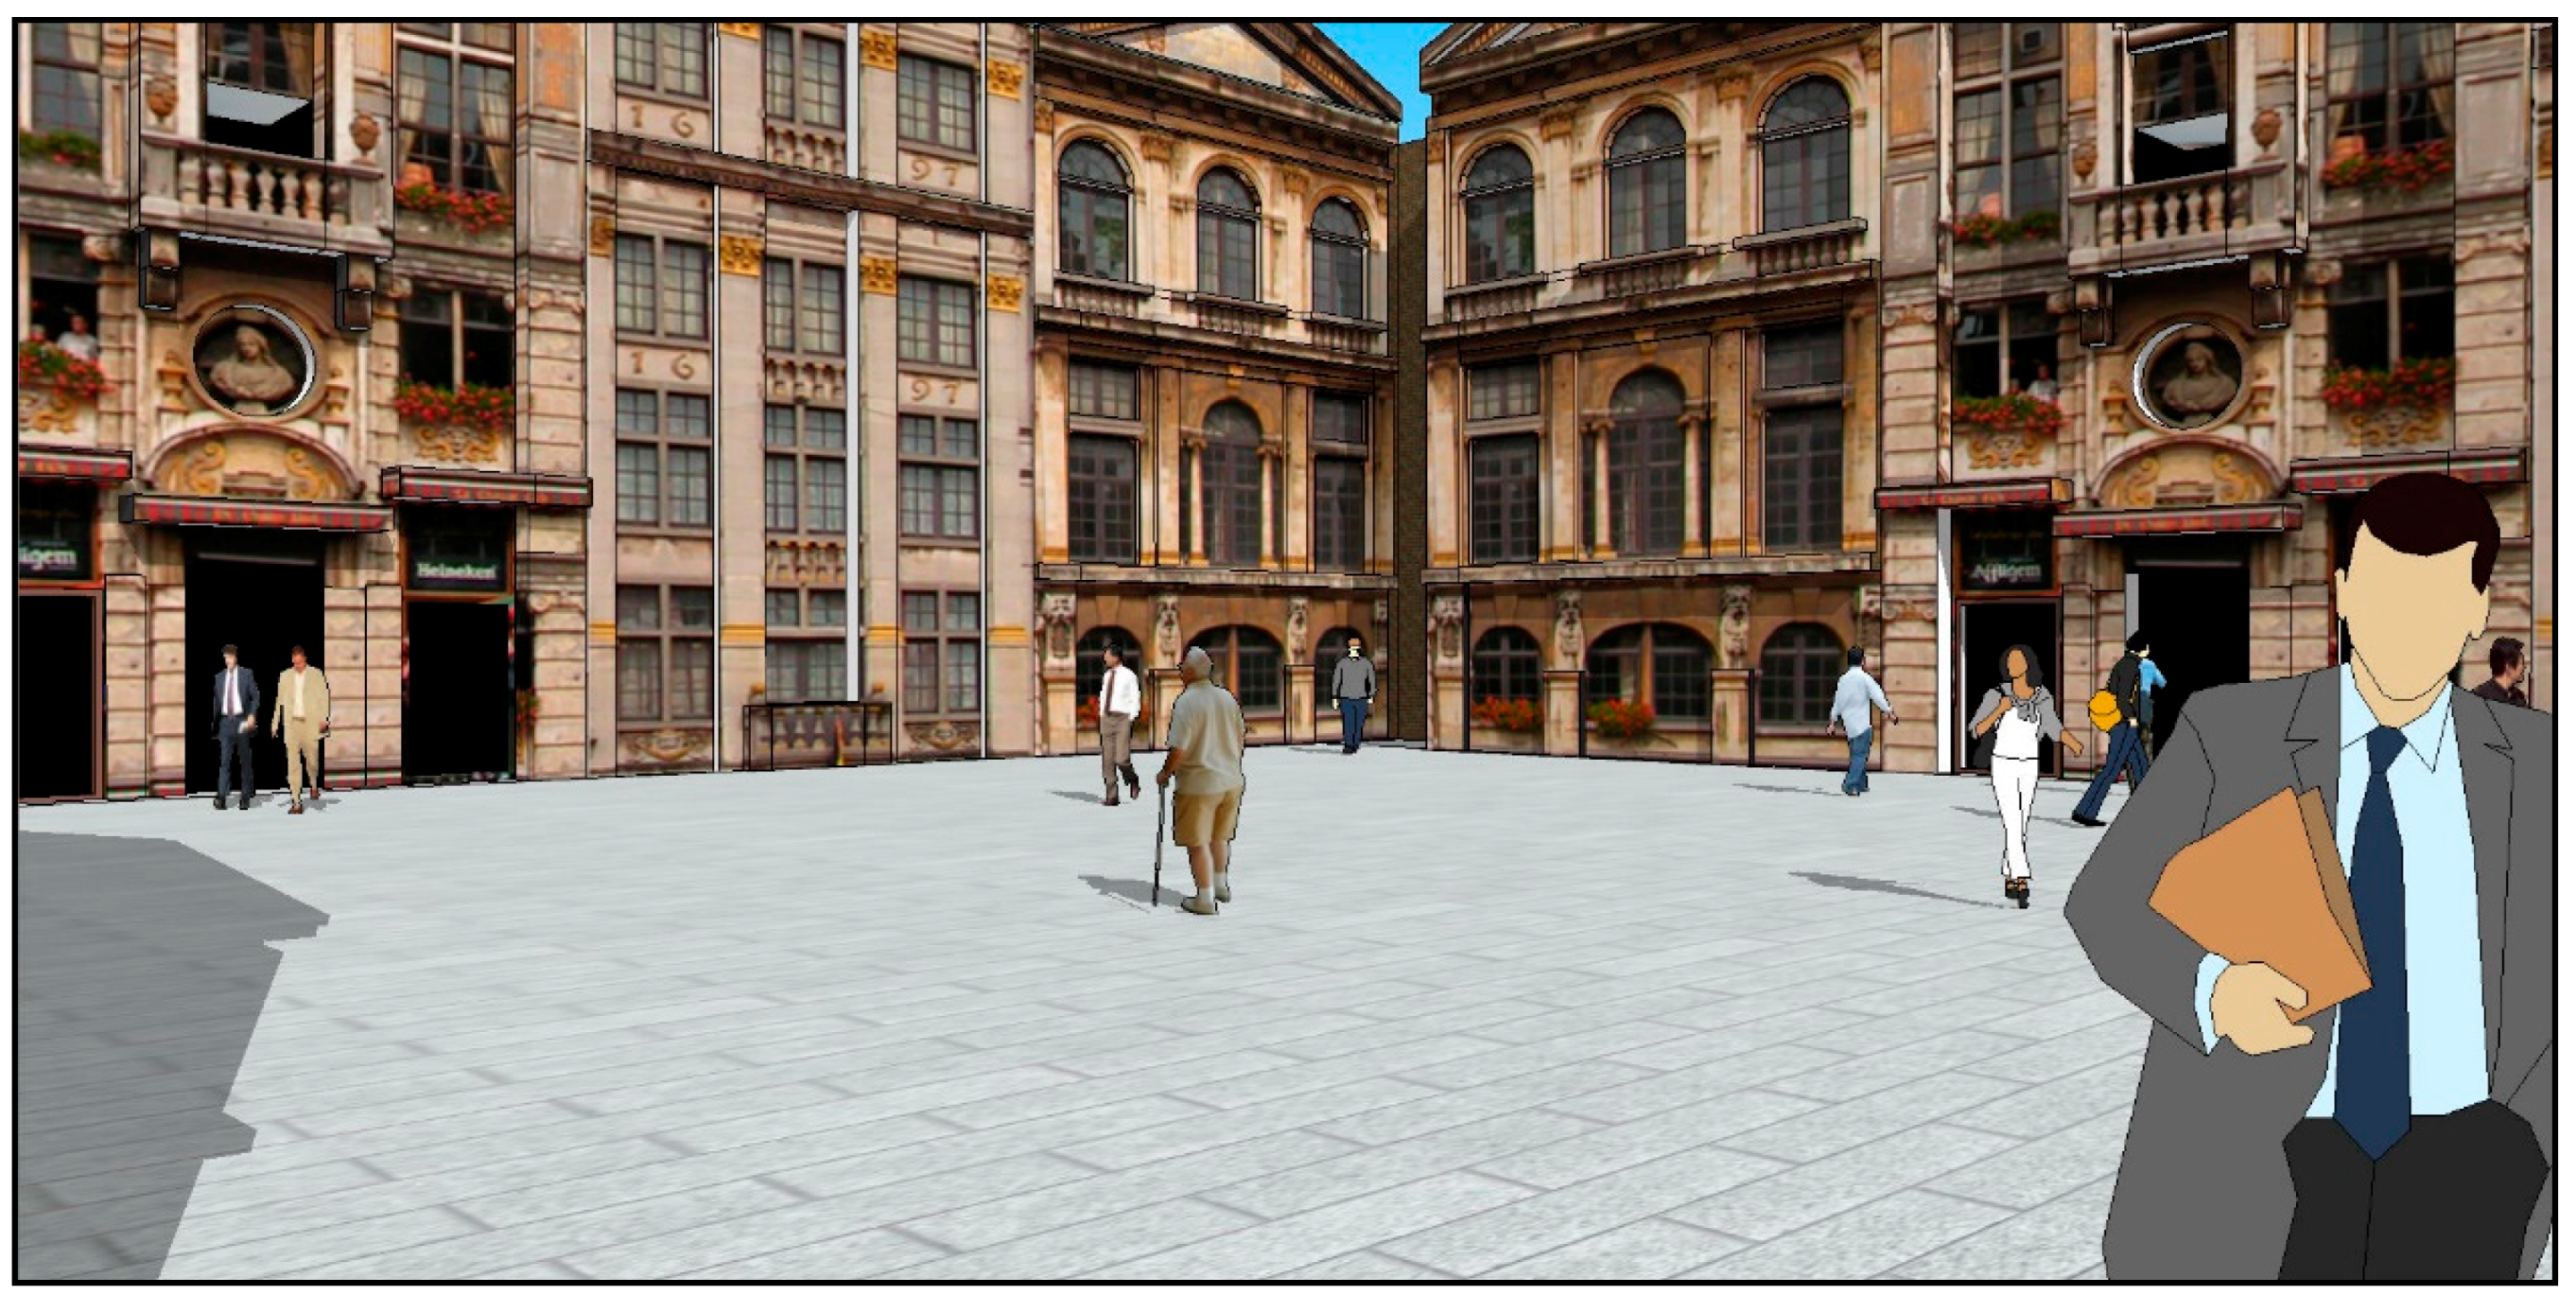
Groups with the same density of individuals (25 people per 25 × 25 m) were added to each simulated square as a reference for the scale of the square (Figure 4, Figure 5 and Figure 6), which was expected to help participants imagine real squares from the simulated images. After all, people are an important visual element composing the landscape of a square. This element was particularly helpful in the images of squares surrounded by empty walls, which would have provided few visual clues regarding scale.
The visual assessment survey was conducted in a classroom (approximately 10 × 10 m size). The author briefly explained to the 48 participants the purpose and procedure of the survey. A total of 36 simulated images were projected on a screen in a classroom in random order. Each image was presented for 30 s, and the participants marked the scores of the eight items on the five-point Likert scale for the image.
5. Descriptive Statistics
The research design consisted of an analysis of 13,824 records (48 respondents × 36 images × 8 questions), 1728 for each question (dependent variable), but several respondents skipped some questions during the survey. Finally, the final number of valid records was 13,768. The numbers of valid records for each dependent variable are shown in Table 4. The table also shows (1) the means and standard deviations of the dependent variables and (2) the frequencies and percentages of independent variables and control variables. First, regarding the distribution of dependent variables, all the means except one for “open” fell between 2.0 and 3.0, indicating that the respondents’ general assessments of the simulated squares were slightly less than “neutral”.
6. Results of the Analysis
The author estimated eight ordered logistic regression models to assess the impact of the three square design elements (i.e., D/H ratios, sizes, and facade designs) on the scores that the participants reported. Five models were for the five perceptual qualities of the computer-simulated squares (i.e., openness, magnificence, coziness, dauntingness, and overall goodness) and three models were for their suitability for three types of social activities (i.e., wandering alone, gathering with friends informally, and holding formal events).
Regarding the relationship between non-design control variables and eight dependent variables, at the five percent level of significance, the analysis revealed that all the control variables were significantly associated with the respondents’ evaluations for some, if not all, qualities of the squares. (Table 5 and Table 6). First, in regard to the variable “school year”, upper grade students’ evaluations were significantly different from lower grade students for three dependent variables. Second, in regard to the variable “experience traveling abroad”, both the traveled country and the time period were significantly associated with the respondents’ evaluations for some of the characteristics of the square. In the case of the overseas travelers, compared with the respondents that had no oversea trip, the evaluations of the respondents who had traveled to Western countries were significantly different for four dependent variables, while those of the respondents who had traveled to Eastern countries were significantly different only for two. In the case of the traveled time period, for five dependent variables, the evaluations of the respondents who traveled for more than six months were significantly different from those who did not. Third, in regard to the variable “large city residence”, the respondents residing in cities with a population greater than 1,000,000 and those residing in cities with a population between 500,000 and 1,000,000 were significantly different from those residing in cities less than 500,000 for three and four variables, respectively. Finally, in regard to “sex”, the rates of the male respondents were significantly different from those of the female respondents for four dependent variables.
Regarding the first hypothesis pertaining to the effectiveness of other design elements (i.e., size and facade design), Table 5 and Table 6 show that in addition to D/H ratios, the sizes of squares and the designs of surrounding facades are significantly associated with respondents’ evaluations of the qualities of squares and their suitability for the suggested activities. The only exception was the impact of model estimation on the suitability for formal events (Table 6). One explanation for this exception is that the range of events that respondents considered formal might be broader or more obscure than a wandering or informal gathering.
Regarding the second hypothesis regarding the differences among the effects of the design elements on the perceptual qualities of squares, the outcomes (Table 5) showed that the effects of D/H ratios, square sizes, and facade designs on the five perceptual qualities of squares differed from those of the others. For one, although the D/H ratios positively influenced the degrees of openness, coziness, and goodness, they negatively affected the degrees of magnificence and dauntingness. In addition, square sizes positively affected the degrees of magnificence and dauntingness, but negatively affected the degrees of openness, coziness, and goodness. Finally, both the classic and modern facade styles, compared with the reference category featuring an empty wall style, positively affected the degrees of all perceptual qualities of squares except dauntingness, which is generally considered to be a negative environmental quality. Moreover, the comparison between the classical and modern styles revealed that the former led to more positive responses than the latter for most qualities of squares (but in the case of dauntingness, it led to less negative responses).
Regarding the third hypothesis concerning the differences among the impacts of the design elements on the suitability of the square for social activities, the outcomes (Table 6) showed that the impacts of D/H ratios, square sizes, and facade styles on the suitability of squares for the suggested three activities also differed from the other characteristics. One finding was that D/H ratios positively affected suitability for all three activities of wandering alone, informal gathering with friends, and formal events. In addition, larger square sizes positively affected suitability for formal events but negatively affected it for others. Finally, compared with the reference category of empty wall style, both the classic and modern facade styles positively affected the suitability for wandering and informal gatherings, but only the classic facade style positively affected the suitability for formal events.
7. Discussion
This study examined the perceptual impacts of design elements for enclosed urban squares and compared the D/H ratios, which have been regarded as the most important design element for enclosed spaces with other design elements such as sizes and facade details. Confirming the proposed three hypotheses, the results of the analysis suggested that other design elements may have as significant an impact on the perceptual qualities of enclosed urban squares as D/H ratios and that the design elements, including D/H ratios, might function differently according to the perceptual qualities in question or the main purposes of the squares. For example, the D/H ratios positively influenced the degrees of openness and coziness, while larger square sizes positively affected the degrees of magnificence and dauntingness.
These findings suggest that urban designers could use evidence-based multiple tools as well as D/H ratios to design enclosed urban squares. In particular, the latter finding might have greater implications for practical urban square design. For example, a local government that needs a comfortable and accessible community square suitable for taking a walk alone or for spending time with friends can be recommended to develop the square or regulate the surrounding buildings to have a high D/H ratio, a small square size, and a classical facade design. It is advisable for a central government planning a magnificent square suitable for holding national events to develop the square with a low D/H ratio, a large square size, and a classical facade design. When a public planner needs to increase the openness of an existing square, he or she might develop a design guideline recommending modern facade designs for the surrounding buildings.
In addition to implications for practical square design, this study also provided a useful urban design research method that facilitates controlled experiments and enables researchers to examine the effects of urban design techniques. Controlled experiments or the examination of urban design techniques have been very difficult in urban design studies because innumerable external factors influence the designs of urban spaces in the real world and they are difficult to control.
Despite the contributions mentioned above, this study is limited in several ways. First, it examined only a limited number of design elements (i.e., three) and a small number of cases for each design element, which partially resulted from a concern that the inclusion of too many design elements would not only increase the complexity of the analysis but also decrease the concentration of the subjects who responded to the survey. In addition, the main purpose of this study was not a thorough examination of all design elements related to an urban square design. Instead, its purpose was to demonstrate the relative importance of design elements other than the D/H ratio and their impact on the perceptual qualities of enclosed urban squares and then compare their effects with those of the D/H ratio. However, future studies could provide a more complete set of guidelines for the use of design elements for urban square designs by including more design elements such as the transparency of surrounding facades [10].
Another limitation relates to the basic assumption applied to this analysis. That is the assumption of a linear relationship between quantitative elements such as D/H ratios and square sizes and the perceptual qualities of squares. The relationship, however, might not be linear and a specific quality or purpose of a design element might have an optimal point. However, this study leaves such a task to future studies for the same reason as that provided for the first limitation.
This study is also limited with regard to simulation technology. The computer-simulated images of urban squares used in this study presented drawbacks that included a limited field of view. Virtual-reality technology, which has only recently become viable for practical applications, could overcome this issue. In addition, this study has two limitations related to its generalizability. First, the participants in the visual assessment survey were students from a university. If a future study conducted a similar survey in diverse groups of students from other universities, general citizens, or urban design experts, the results of the survey might be more generalizable. Second, the respondents of the survey were Koreans who had different experiences with enclosed urban squares from citizens of other countries. Such cultural differences can affect their perception of urban squares [30]. Therefore, implications from the survey results might be applicable only to Korean cities. Finally, this study examined only enclosed urban squares. In other types of urban spaces such as streets, the design elements analyzed in the study might yield different results. For example, the way that people perceive the openness of a space while walking on a street may differ markedly from the way they perceive it while standing or sitting in an urban square.
8. Conclusions
This section is not mandatory, but can be added to the manuscript if the discussion is unusually long or complex.
Acknowledgments
This research was supported by the Gachon University research fund of 2015 (GCU-2015-0055).
Conflicts of Interest
The author declares no conflict of interest.
References
- Yiftachel, O.; Hedgcock, D. Urban social sustainability: The planning of an australian city. Cities 1993, 10, 139–157. [Google Scholar] [CrossRef]
- Dillard, J.; Dujon, V.; King, M.C. Understanding the Social Dimension of Sustainability; Routledge: New York, NY, USA, 2008. [Google Scholar]
- Satiroglu, E. Assessment of the Relationships between Urban Furniture and Urban Spaces. In Environmental Sustainability and Landscape Management; St. Kliment Ohridski University Press: Sofia, Bulgaria, 2016; pp. 694–702. [Google Scholar]
- City of Vancouver. Plaza Design Guidelines. Available online: http://vancouver.ca/docs/planning/plaza-design-guidelines-1992-november-17.pdf (accessed on 21 April 2017).
- Kayden, J.S.; The City of New York; The Municipal Art Society of New York. Privately Owned Public Space: The New York City Experience; John Wiley & Sons: New York, NY, USA, 2000. [Google Scholar]
- City and County of Denver Community Development Department. Urban Design Standards & Guidelines for 9th & Colorado. Available online: https://www.denvergov.org/content/dam/denvergov/Portals/646/documents/Zoning/other_regulations/Design-standards-guidelines/9th-colorado-urban_design_standards_and_guidelines.pdf (accessed on 21 April 2017).
- Sternberg, E. An integrative theory of urban design. J. Am. Plan. Assoc. 2000, 66, 265–278. [Google Scholar] [CrossRef]
- Whyte, W.H. The Social Life of Small Urban Spaces; Project for Public Spaces: New York, NY, USA, 1980. [Google Scholar]
- Booth, N.K. Basic Elements of Landscape Architectural Design; Waveland Press: Long Grove, IL, USA, 1989. [Google Scholar]
- Trancik, R. Finding Lost Space: Theories of Urban Design; Van Nostrand Reinhold: New York, NY, USA, 1986. [Google Scholar]
- Collins, G.R.; Sitte, C.; Collins, C.C. Camillo Sitte: The Birth of Modern City Planning; Courier Corporation: New York, NY, USA, 2006. [Google Scholar]
- Jacobs, J. The Death and Life of Great American Cities; Random House: New York, NY, USA, 1961. [Google Scholar]
- Moughtin, C. Urban Design: Street and Square, 3rd ed.; Routledge: Abingdon, UK, 2007. [Google Scholar]
- Hillier, B. Against enclosure. In Rehumanizing Housing; Teymur, N., Markus, T.A., Woolley, T., Eds.; Butterworths: London, UK, 1988; pp. 63–68. [Google Scholar]
- Lynch, K.; Hack, G. Site Planning, 3rd ed.; MIT Press: Cambridge, MA, UK, 1984. [Google Scholar]
- Alberti, L.B.; Bartoli, C.; Leoni, G. The Ten Books of Architecture: The 1755 Leoni Edition; Dover Publications: Mineola, New York, NY, USA, 1986. [Google Scholar]
- Jakle, J.A. The Visual Elements of Landscape; University of Massachusetts Press: Amherst, MA, USA, 1987. [Google Scholar]
- Im, S.-B. Visual preferences in enclosed urban spaces: An exploration of a scientific approach to environmental design. Environ. Behav. 1984, 16, 235–262. [Google Scholar] [CrossRef]
- Im, S.-B. Optimum w/h ratios in enclosed spaces: The relationship between visual preference and the spatial ratio. J. Archit. Plan. Res. 1987, 4, 134–148. [Google Scholar]
- Alkhresheh, M.M. Enclosure as a Function of Height-to-Width Ratio and Scale: Its Influence on User′s Sense of Comfort and Safety in Urban Street Space; The University of Florida: Gainesville, FL, USA, 2007. [Google Scholar]
- City of London. Illustrated Urban Design Principles. Available online: https://www.london.ca/business/Planning-Development/urban-design/Documents/Illustrated-Urban-Design-Principles.pdf (accessed on 7 September 2016).
- Chambers, W. Changing the Conversation: From Building Heights to Place Making. Available online: http://sdgreatstreets.org/wp-content/uploads/2011/07/Changing-the-Conversation-Building-Height.pdf (accessed on 7 September 2016).
- Haile, C. A Myth of Urban Design: The ‘Sense of Enclosure′ Theory. Available online: http://www.chrishaile.com/2012/01/a-myth-of-urban-design-the-sense-of-enclosure-theory/ (accessed on 25 August 2016).
- Memluk, M.Z. Designing urban squares. In Advances in Landscape Architecture; Özyavuz, M., Ed.; InTech: Rijeka, Croatia, 2013. [Google Scholar]
- Gehl, J. Cities for People; Island press: Washington, DC, USA, 2010. [Google Scholar]
- Alexander, C.; Ishikawa, S.; Silverstein, M.; Jacobson, M.; Fiksdahl-King, I.; Angel, S. A Pattern Language; Oxford University Press: New York, NY, USA, 1977. [Google Scholar]
- Krier, L. The Architecture of Community; Island Press: Washington, DC, USA, 2009. [Google Scholar]
- Ewing, R.; Handy, S. Measuring the unmeasurable: Urban design qualities related to walkability. J. Urban Des. 2009, 14, 8–25. [Google Scholar] [CrossRef]
- Bentham, J.; Cesare, M.; Stevens, G.A.; Zhou, B.; Bixby, H.; Cowan, M.; Fortunato, L.; Bennett, J.; Danaei, G.; Hajifathalian, K. A century of trends in adult human height. eLife 2016, 5, 1–29. [Google Scholar]
- Knez, I.; Thorsson, S. Influences of culture and environmental attitude on thermal, emotional and perceptual evaluations of a public square. Int. J. Biometeorol. 2006, 50, 258–268. [Google Scholar] [CrossRef] [PubMed]
Figure 1.
Combination of D/H ratios and scales.

Figure 2.
Horizontal field of view.

Figure 3.
Vertical fields of view.

Figure 4.
Simulation example 1 (D/H ratio: 2/1, square size: 25 × 25 m, facade style: Classic).

Figure 5.
Simulation example 2 (D/H ratio: 5/1, square size: 100 × 100 m, facade style: Modern).

Figure 6.
Simulation example 3 (D/H ratio: 10/1, square size: 200 × 200 m, facade style: Wall).


Table 1.
Combination of square design elements influencing the sense of enclosure.
| D/H Ratios | Square Sizes (Scale) | Facade Designs |
|---|---|---|
| 2:1 5:1 10:1 | 25 m × 25 m 50 m × 50 m 100 m × 100 m 200 m × 200 m | Classic Modern Empty Wall |
Table 2.
Control variables for the analysis.
| Variables | Data Coding | Reference Category |
|---|---|---|
| School year | Upper grade Lower grade | Lower grade |
| Experience traveling abroad (location) | Traveled in the West a Traveled in the East No overseas trip | No overseas trip |
| Experience traveling abroad (period) | Longer than six months Equal to or shorter than six months | Equal to or shorter than six months |
| Large city residence (population) | Over 1,000,000 Between 500,000 and 1,000,000 Under 500,000 | Under 500,000 |
| Sex | Male Female | Female |
a Respondents who have traveled both of western and eastern countries were coded as “Traveled in the West”.
Table 3.
Dependent variables for the analysis.
| Classification | Dependent Variables |
|---|---|
| Perceptual qualities of the square | Open Magnificent Cozy Daunting Good a |
| Suitability of the square for social activities | Wandering individually Gathering informally with friends Holding formal events such as a festival or a political rally |
a Overall assessment for the four dimensions.
Table 4.
Descriptive statistics of variables.
| Variables | Descriptive Statistics | ||
|---|---|---|---|
| Dependent Variables | Mean | Std. Deviation | Number |
| Open | 3.21 | 1.20 | 1724 |
| Magnificent | 2.37 | 1.12 | 1724 |
| Cozy | 2.46 | 1.07 | 1722 |
| Daunting | 2.47 | 1.20 | 1720 |
| Good | 2.66 | 0.95 | 1718 |
| Wandering | 2.76 | 1.09 | 1720 |
| Informal gathering | 2.92 | 1.09 | 1720 |
| Formal events | 2.76 | 1.12 | 1720 |
| Independent Variables | - | Percentage | Number |
| D/H ratios | - | 100 | 13,768 |
| 2/1 | - | 33.4 | 4597 |
| 5/1 | - | 33.2 | 4575 |
| 10/1 | - | 33.4 | 4596 |
| Square sizes | - | 100.0 | 13,768 |
| 25 × 25 m | - | 25.0 | 3437 |
| 50 × 50 m | - | 24.9 | 3425 |
| 100 × 100 m | - | 25.1 | 3450 |
| 200 × 200 m | - | 25.1 | 3456 |
| Facade designs | - | 100 | 13,768 |
| Classic style | - | 33.4 | 4600 |
| Modern style | - | 33.4 | 4604 |
| Empty wall | - | 33.1 | 4564 |
| Control Variables | - | Percentage | Number |
| School year | - | 100.0 | 1728 |
| Upper grades | - | 58.3 | 1008 |
| Lower grades | - | 41.7 | 720 |
| Countries traveled | - | 100.0 | 1728 |
| Western countries | - | 29.2 | 504 |
| Eastern countries | - | 52.1 | 900 |
| None | - | 18.8 | 324 |
| Travel period | - | 100.0 | 1728 |
| Over six months | - | 12.5 | 216 |
| Six months or shorter | - | 87.5 | 1512 |
| Residence in a large city (population) | - | 100.0 | 1728 |
| Over 1,000,000 | - | 70.8 | 1224 |
| 500,000~1,000,000 | - | 16.7 | 288 |
| Under 500,000 | - | 12.5 | 216 |
| Sex | - | 100.0 | 1728 |
| Male | - | 33.3 | 576 |
| Female | - | 66.7 | 1152 |
Table 5.
Ordered logistic regression estimates of square design variables and control variables on perceptual qualities of squares with odd ratios.
Table 5.
Ordered logistic regression estimates of square design variables and control variables on perceptual qualities of squares with odd ratios.
| Variables | Perceptual Qualities of Squares | ||||
|---|---|---|---|---|---|
| Open | Magnifice | Cozy | Daunting | Good | |
| Control variables | |||||
| Upper grades | 1.266 * | 0.777 * | 1.195 | 0.896 | 1.007 |
| Countries traveled a | |||||
| Western countries | 1.336 + | 1.196 | 1.624 ** | 0.871 | 1.398 * |
| Eastern countries | 1.311 * | 1.127 | 1.525 ** | 0.820 | 1.192 |
| Travel period over six months | 1.564 ** | 0.740 + | 0.927 | 0.544 ** | 0.576 ** |
| Residence in a large city (population) b | |||||
| Over 1,000,000 | 0.465 ** | 1.315 + | 0.868 | 1.445 * | 0.977 |
| 500,000~1,000,000 | 0.401 ** | 2.280 ** | 0.905 | 2.561 ** | 0.943 |
| Male | 1.139 | 0.863 | 1.257 * | 0.544 * | 1.133 |
| Independent variables | |||||
| D/H ratios | 1.387 ** | 0.850 ** | 1.139 ** | 0.764 ** | 1.085 ** |
| Square size | 0.998 ** | 1.008 ** | 0.990 ** | 1.011 ** | 0.996 ** |
| Facade design c | |||||
| Classic | 1.600 ** | 5.831 ** | 10.334 ** | 0.742 ** | 12.637 ** |
| Modern | 2.422 ** | 1.268 * | 5.521 ** | 0.331 ** | 10.186 ** |
| Pseudo R2 (Cox and Snell) | 0.289 | 0.266 | 0.316 | 0.326 | 0.292 |
| LR Chi2 | 587.9 ** | 533.3 ** | 655.0 ** | 679.4 ** | 592.9 ** |
| N | 1724 | 1728 | 1722 | 1720 | 1718 |
a The reference category for Countries traveled is “No overseas trip”; b The reference category for Residence in a large city is “Under 500,000”; c The reference category for Facade design is “Empty wall”; + p ≤ 0.1 two-tailed; * p ≤ 0.05 two-tailed; ** p ≤ 0.01 two-tailed.
Table 6.
Ordered logistic regression estimates of square design variables and control variables on the suitability of squares for personal and social activities with odd ratios.
Table 6.
Ordered logistic regression estimates of square design variables and control variables on the suitability of squares for personal and social activities with odd ratios.
| Variables | Suitability for Personal and Social Activities | ||
|---|---|---|---|
| Wandering | Informal Gathering | Formal Events | |
| Control variables | |||
| Upper grades | 0.856 | 0.866 | 0.702 ** |
| Countries traveled a | □ | ||
| Western countries | 1.086 | 1.329 + | 1.553 ** |
| Eastern countries | 1.112 | 1.140 | 1.156 |
| Travel period over six months | 0.725 * | 0.968 | 1.647 ** |
| Residence in a large city b | |||
| Over 1,000,000 population | 0.765 | 0.590 ** | 0.910 |
| 500,000~1,000,000 population | 0.711 + | 0.561 ** | 1.271 |
| Male | 1.280 * | 1.438 ** | 1.126 |
| Independent variables | |||
| D/H ratios | 1.134 ** | 1.116 ** | 1.066 ** |
| Square size | 0.991 ** | 0.993 ** | 1.006 ** |
| Facade Design c | |||
| Classic | 7.687 ** | 7.386 ** | 1.256 * |
| Modern | 5.610 ** | 6.703 ** | 0.852 |
| Pseudo R2 (Cox and Snell) | 0.283 | 0.263 | 0.089 |
| LR Chi2 | 572.9 ** | 524.2 * | 159.7 ** |
| N | 1720 | 1720 | 1720 |
a The reference category for Countries traveled is “No overseas trip”; b The reference category for Residence in a large city is “Under 500,000”; c The reference category for Facade design is “Empty wall”; + p ≤ 0.1 two-tailed; * p ≤ 0.05 two-tailed; ** p ≤ 0.01 two-tailed.
© 2017 by the author. Licensee MDPI, Basel, Switzerland. This article is an open access article distributed under the terms and conditions of the Creative Commons Attribution (CC BY) license (http://creativecommons.org/licenses/by/4.0/).
Share and Cite
MDPI and ACS Style
Kim, J. Comparing the Influences of the D/H Ratio, Size, and Facade Design of an Enclosed Square on Its Perceptual Qualities as a Sustainable Urban Space in South Korea. Sustainability 2017, 9, 675. https://doi.org/10.3390/su9040675
AMA Style
Kim J. Comparing the Influences of the D/H Ratio, Size, and Facade Design of an Enclosed Square on Its Perceptual Qualities as a Sustainable Urban Space in South Korea. Sustainability. 2017; 9(4):675. https://doi.org/10.3390/su9040675
Chicago/Turabian StyleKim, Jaecheol. 2017. "Comparing the Influences of the D/H Ratio, Size, and Facade Design of an Enclosed Square on Its Perceptual Qualities as a Sustainable Urban Space in South Korea" Sustainability 9, no. 4: 675. https://doi.org/10.3390/su9040675
Note that from the first issue of 2016, this journal uses article numbers instead of page numbers. See further details here.