Article

Decomposition of Net CO2 Emission in the Wuhan Metropolitan Area of Central China

1
College of Land Management, Huazhong Agricultural University, Wuhan 430070, China
2
School of Agricultural Resource and Economics, The University of Western Australia, Crawley 6009, Australia
*
Author to whom correspondence should be addressed.
Sustainability 2016, 8(8), 784; https://doi.org/10.3390/su8080784
Submission received: 1 June 2016 / Revised: 25 July 2016 / Accepted: 29 July 2016 / Published: 11 August 2016

Abstract

:
Policy-makers have been sharing growing concerns that climate change has significant impacts on human society and economic activates. Knowledge of the influencing factors of CO2 emission is the crucial step to reduce it. In this paper, both CO2 emission and CO2 sink on a city-level of the nine cities in Wuhan Metropolitan Area are calculated using the Intergovernmental Panel on Climate Change approach. Moreover, the logarithmic mean Divisia index (LMDI) model was employed to decompose the net CO2 emission from 2001 to 2009. Results showed that (1) the largest amount of CO2 emission comes from energy while the largest amount CO2 sink comes from cropland; (2) economic level (S) was the largest positive driving factor for net CO2 emission growth in the Wuhan Metropolitan Area, population (P) also played a positive driving role, but with very weak contribution; and as negative inhibiting factors, energy structure (E) and energy efficiency (C) significantly reduced the net CO2 emission.

1. Introduction

Policy-makers have been sharing growing concerns that climate change has significant impacts on human society [1]. Increasing greenhouse gas (GHGs) emission, driven by economic growth, makes government create sustainable economic schemes which decouple GHG emission and development, and knowledge of its influencing factors is of crucial importance for CO2 emission reduction [2]. Approaches that are popularly used for CO2 emission decomposition are mainly the Divisia index and Lyspeyres index. Despite being more complicated, the logarithmic mean Divisia index (LMDI) model is a preferred method than the other six index decomposition methods for its sound theoretical foundation and obvious improvement in achieving a more scientific result in the 1990s [3]. Decomposition index analysis originated from the early 1970s after the world oil crisis [4]; since then it has triggered the interests of researchers and analysts.
Currently, studies that use this method to decompose CO2 emission changes have been reported in all the major departments of many countries, including APEC members [1], the USA [2], the European Union [5], the U.K. [6], Spain [7], Brazil [8], Turkey [9], China [10,11,12], India [13], South Korea [14,15], Denmark, and Greece [16,17]. It was also found that the industry sector and economy-wide decomposition are the two most popular application areas for LMDI studies, followed by the electricity generation sector [18]. Recently, Kaivo et al. [19] conducted two types of mathematical decomposition analyses of China, the EU, and the USA by covering different sectors. For domestic studies, research that applied the logarithmic mean Divisia index (LMDI) method to decompose CO2 emissions are mainly focused on one sector, listed as transport [20], industry [21,22,23,24,25], energy [26,27,28], agriculture, or land use [20,29,30]. Moreover, several works have been conducted to decompose the total CO2 emissions on a city level, for instance, Beijing [2,24], Shanghai [2,24,30], Chongqing [24], Guangzhou [24,28], and Hong Kong [24], but CO2 sinks were also neglected by them.
The above researched have done excellent work to decompose CO2 emission, however, limitations still exits: (1) Most decomposition work was done to decompose CO2 emission from one sector, rather than total CO2 emissions from all aspects of human society and economic activities. The main advantage of a society-wide approach over a sector-wide approach is its ability to provide a fuller account of a region’s carbon footprint and to identify relative potentials (e.g., sinks), as well as challenges (e.g., emissions). Recent decomposition CO2 emission from one sector (energy/transport/manufacture, etc.) of Beijing, Shanghai, Chongqing, and Guangzhou have been well documented in previous studies [25,31], and have provided useful information for policy aiming to mitigate sector-wide emissions. In this study, we take a society-wide approach to assist carbon policy-making in a broader context; (2) though national studies are well-document by the need for cooperation among nations to solve this global environmental problem, they are not specific enough to conduct carbon trading at present [32]. Carbon reduction action happening on the local level will lead to more impractical effects when a carbon emissions trading system is imposed. Specifically, in-depth local knowledge on CO2 emission, rather than aggregated information at the national level, is what is needed most when designing and implementing a pilot carbon trading market in pilot cities, including Wuhan; and (3) for the several analyses conducted on the city level, their work decomposed the total CO2 emissions rather than net CO2 emissions, which neglected CO2 sinks and made the decomposition work inaccurate. To our knowledge, little attention has been paid to decomposition net CO2 emission at the city level in China.
Therefore, in this paper, (1) both CO2 emissions and CO2 sinks will be taken into account by containing four sectors and 27 subsets of main CO2 sources, and four sectors and 13 subsets of main CO2 sinks; (2) the composition work will be done at the city level, which will include the nine cities of the Wuhan Metropolitan Area; and (3) the net CO2 emissions from 2001 to 2009 will be used for decomposition.
The Wuhan Metropolitan Area is composed of Wuhan and eight other cities within 100 km; they are Huangshi, Ezhou, Huanggang, Xiaogan, Xianning, Xiantao, Tianmen, and Qianjiang (Figure 1, obtained from the official website of Hubei Provincial People’s Government: http://www.hubei.gov.cn/). The whole area is 58.1 × 10³ km2, with a population of 30.24 × 10⁶. Its GDP exceeded 1000 × 109 Yuan in 2013. It was launched as the first nationwide pilot area of resource-saving and environment-friendly society by China’s government since 2008. Moreover, Wuhan also became the seventh carbon emission trading center in China, following Beijing, Shanghai, Guangzhou, Shenzhen, Tianjin, and Chongqing in 2013. Another feature about the Wuhan Metropolitan Area case is that it is a so large a developing metropolitan entity that belongs to one province (Hubei) in China, thus the findings from this paper will deliver many more significant policy implications given the province-oriented governance scheme in environmental regulation. The national government’s goal is to cut the carbon emission intensity by 40%–45% according to the 50th session of Copenhagen Accord in 2009 [33], and a low-carbon development strategy of Wuhan aimed to reduce carbon emission by 56% in 2020 compared with that in 2002 by the reported from Reuters China in 2013. Moreover, more than 40% of its economy results from energy-intensive industries with high carbon emissions, which implies an impossible task. Hence, a deliberate investigation and a sound understanding on drivers behind CO2 emission would facilitate effective policy-making to achieve the target.

2. Methodologies and Data

2.1. Net CO2 Emissions

In this paper, net CO2 emission (NCE) equals total CO2 emission, deducting total CO2 sinks. The model can be written as follows:
N C E = C E i C S i
where C E i (i = 1 … 4) is the sum of CO2 emissions, C S i (i = 1, 4) is the sum of CO2 sinks.

2.2. CO2 Emissions

For CO2 emission, C E i (i = 1 … 4) represents the CO2 emission from energy, industry processes and product use, agriculture, forest, and other land use, waste [34]. They are calculated by the following methods:
(1) CO2 emissions from energy can be calculated through Equation (2):
C E e n e r g y = C E e p = T o n e p × α e p
where C E e n e r g y is the CO2 emission from the department of energy. T o n e p is the final consumption (double accounting can be avoided in this way) of energy( T o n e p ) and comes from The Statistical Yearbook of Hubei Province. α e p is the CO2 emission parameter, which can be drawn from the Intergovernmental Panel on Climate Change reference approach IPCC [34].
(2) CO2 emission from Industry Processes and Product Use could be estimated through Equation (3):
C E i n d u s t r y = C E i q = T o n i q × α i q
where C E i n d u s t r y is the CO2 emission from industry processes and product use. T o n i q is the amount of products from the industry sector and can be drawn from The Statistical Yearbook of Hubei Province. α i q is the CO2 emission parameter, which is drawn from IPCC [34].
(3) CO2 emissions from agricultural, forest and other land use change are more complicate and could be estimated through Equation (4):
C E ag r i c u l t u r e = C E a m + C E a n = A r e a a m × α a m + T o n a n × β a n
where C E ag r i c u l t u r e is the sum of two parts, C E a m (“a” refers to agriculture and m = 1, 2) and C E a n (“a” refers to agriculture and n = 1, 2, 3, 4). C E a m contains CO2 emissions from agricultural immigration and agricultural land plowing, it is the sum of the area of item m ( A r e a a m ) multiplied by their corresponding parameters ( α a m ). C E a n is the sum of CO2 emissions from the consumption of chemical fertilizer, pesticides, plastic membrane, and diesel fuel, and it equals to the multiplication of the weight of item “n” ( T o n a n ) multiplied by their corresponding parameters ( β a n ). The area of agricultural immigration and agricultural land plowing ( A r e a a m ) are derived from The Rural Statistical Yearbook of Hubei Province, which are the same for the consumption amounts of chemical fertilizer, pesticides, plastic membrane, and diesel fuel ( T o n a n ). α a m and β a n are drawn from those of Zhao et al. [30].
(4) CO2 emission from waste department could be estimated through Equation (5):
C E w a s t e = C E w = T o n w j × α w j
where C E w a s t e is the CO2 emission from the production from waste, C E w (w = 1, 2, 3) is the CO2 emission from incineration of waste, open burning of waste, and incineration of fossil liquid waste. T o n w j is the weight or volume of the above three aspects, j is the component of every aspects, which were derived from The Statistical Yearbook of Hubei Province and The Rural Statistical Yearbook of Hubei Province. α w j is the CO2 emission parameter of the j-th component of sector , which can be drawn from IPCC [34].

2.3. CO2 Sinks

(1) CO2 sinks include the CO2 sink from cropland, forest, grassland, and the change of land use types. CO2 sink from cropland could be estimated through the following method:
C S c r o p = C i = C f Y w ( 1 r ) / H i
where Ci is the CO2 sink of the crop i during its growth period; Cf is the rate of CO2 absorption; Yw is economic yield; r is the water content rate; Hi is economic parameter. The economic yield (Yw) is drawn from The Rural Statistical Yearbook of Hubei Province. The CO2 absorption rate (Cf), water content rate (r) and economic coefficient (Hi) of China’s main crops are derived from IPCC [34] and Li et al. [35].
(2) The CO2 sink from forest could be estimated through Equation (7):
C S f o r e s t = A r e a f o r e s t × β f o r e s t
where C S f o r e s t is the CO2 sink of forest. A r e a f o r e s t is the area of forest, and it is derived from The Second National Land Survey. β f o r e s t is the CO2 sink parameter, which can be derived from Li et al. [35].
(3) The CO2 sink from grassland could be estimated through Equation (8):
C S g r a s s l a n d = A r e a g r a s s l a n d × β g r a s s l a n d
where C S g r a s s l a n d is the CO2 sink of grassland. A r e a g r a s s l a n d is the area of grassland, and it is derived from The Second National Land Survey. β g r a s s l a n d is the CO2 emission parameter, which can be derived from Zhao et al. [30].
(4) The CO2 sink from land use change occurring in China are the cultivated land that was used for construction purposes and reforestation of marginal arable land; their CO2 sink could be estimated through the following Equation (9):
C S c h a n g e = Δ C S c o n s t r u c t i o n + Δ C S f a r m l a n d = A r e a r e f o r e s t × β f o r e s t f a r m l a n d + A r e a c o n s t r u c t i o n × β f a r m l a n d
where C S c h a n g e is the CO2 sink from changing of land use types. A r e a r e f o r e s t is the area of the reforestation of marginal arable land, A r e a c o n s t r u c t i o n is the area of cultivated land that was used for construction purpose, and they can be derived from The Second National Land Survey.
β f o r e s t f a r m l a n d is the difference between the CO2 sink parameters of forest and farmland, β f a r m l a n d is the parameter of the CO2 sink from farmland, which were derived from IPCC [34].

2.4. Decomposition Analysis of Net CO2 Emission

In order to find out the factors that influence the change of net CO2 emission, both additive and multiplicative forms of the LMDI can be employed to reach this goal. According to Ang [35], there exists a simple relationship between multiplicative decomposition and additive decomposition, which makes a separate decomposition using the multiplicative and additive schemes unnecessary. However, compared with multiplicative decomposition, additive decomposition decomposes the difference rather than ratio, which can fully reflect the direction of the factors’ effect. We have, thus, chosen the additive form in this analysis.
Therefore, we can define NCE as the sum of net CO2 emission for the whole Metro area, ncei is the net CO2 emission at the city level such that i is the nine cities of the Wuhan Metropolitan Area, e is the amount of fossil energy consumption, g is GDP, and P is the population; then the net CO2 emission decomposition equation can be established according to the additive form of the LMDI model as follows:
N C E = n c e e × e g × g P × P
When we assume that n c e e =   E (CO2 emission per unit of fossil energy consumption), e g =   C (fossil energy consumption per unit of GDP), g P =   S (GDP per capital), which can be named as energy structure, energy efficiency, economic level respectively. Then the index decomposition analysis equation can be expressed as:
N C E = n c e e × e g × g P × P = E × C × S × P
From year 0 (T0) and year t (Tt), the changes of net CO2 emission can be expressed as the following equation:
N C E = N C E t N C E 0
The decomposition analysis of net CO2 emission now can be expressed as follows:
Δ E = N C E t N C E 0 ln N C E t ln N C E 0 × ln e t ln e 0
Δ C = N C E t N C E 0 ln N C E t ln N C E 0 × ln c t ln c 0
Δ S = N C E t N C E 0 ln N C E t ln N C E 0 × ln s t ln s 0
P = N C E t N C E 0 ln N C E t ln N C E 0 × ln P t ln P 0
Finally, the changes of net CO2 emission can be expressed as the following equation:
Δ N C E = N C E t N C E 0 = Δ E + Δ C + Δ S + Δ P

3. Results

According to the IPCC list, both CO2 emissions and sinks of each city during the past decade are covered in this study, in an attempt to achieve a more precise result of the CO2 emissions in the Wuhan Metropolitan Area.

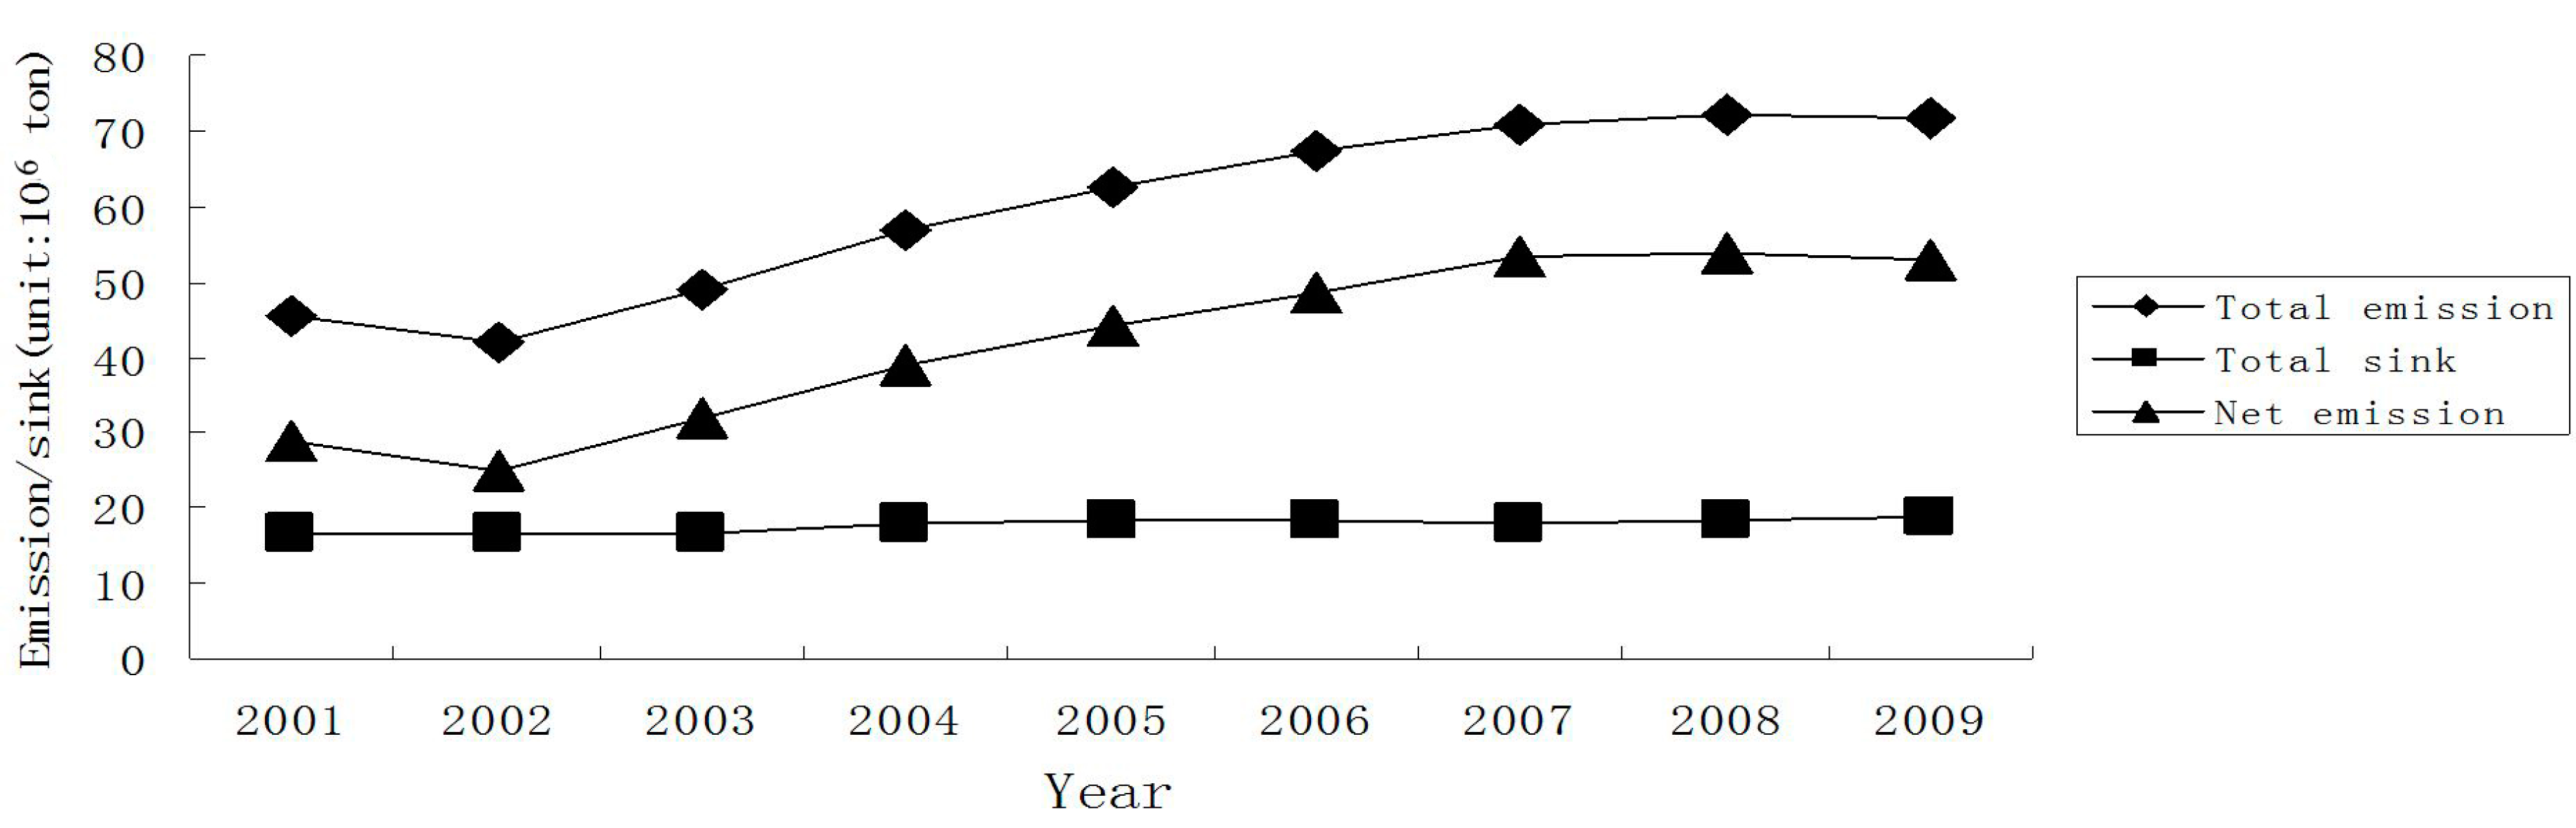
3.1. Net CO2 Emission in Wuhan Metropolitan Area from 2001 to 2009

According to the above methods and data, precise estimates of net CO2 emissions of the nine cities in the Wuhan Metropolitan Area from 2001 to 2009 were calculated. Table 1 summarizes the empirical results of the four sectors that contributed to CO2 emissions and four sectors that contribute to CO2 sinks from 2001 to 2009. The net CO2 emissions during this period are also listed in Table 1.
According to the results of Table 1, total CO2 emission of the Wuhan Metropolitan Area in 2001, total CO2 emission increase in 2009 increased by 58.89%, with the annual increasing rate of 6.54%. Table 1 also shows changes in CO2 emissions in each city from 2001 to 2009. CO2 emissions gradually increased in all cities, to differing extents, due to the rapid development of the Chinese economy. To be more specific, energy contributed the largest amount to CO2 emission, followed by the industry processes and product use, and then the CO2 emission from agriculture, forest, and other land use. The smallest amount of CO2 emission comes from waste.
Table 1 also indicates that total CO2 sinks of the Wuhan Metropolitan Area increased by 13.71% from 2001 to 2009, with the annual increasing rate of 1.52%. Specifically, cropland contributed the largest amount of CO2 sinks during this period, followed by CO2 sinks from forest. CO2 sinks from grassland were the smallest and showed a decreasing trend. Surprisingly, CO2 sinks coming from land use change is negative, which means land use change creates CO2 emissions during the period from 2001 to 2009. This is mainly due to the rapid process of urbanization and sprawling of cities. Area of farmland that was converted for construction use is much larger than that of reforestation of marginal arable land.
As explained above, by Equation (5), an accurate calculation of net CO2 emissions between 2001 and 2009 are calculated in this study. Generally, it shows a slightly increasing trend, net CO2 emissions in 2009 increased by 84.97% compared with that of 2001. However, the change of total CO2 emissions and sinks follow similar trends and are the same order of magnitude, so the net CO2 emissions during this period did not fluctuate significantly (see Figure 2).The net CO2 emissions remain unchanged due to the same changing trend of total CO2 emissions and total CO2 sinks from 2001–2009.
The annual increasing rate of net CO2 emission in the Wuhan Metropolitan Area was 9.55% from 2001 to 2009, higher than Chongqing (9.20%), Tianjin (7.74%), Shanghai (4.43%), and Beijing (1.87%) during the same period. In particular, the increasing rate of CO2 emission of most provinces and cities in China were much lower than their GDP increasing rate; this may explained as the lag effect.
Despite the net CO2 sink from 2001 to 2009 of the Wuhan Metropolitan Area not fluctuating significantly, there was a slightly higher increasing rate during 2003 to 2004 and this can be explained as the implementation of NO. 1 Document of Chinese Central Government, in which the national government began to provide agricultural subsidies to farmers who preserve their farmland. This policy promoted the farmers’ enthusiasm of grain planting greatly, so the CO2 sink from cropland increased rapidly in this year.
The changing trend of total CO2 emission and net CO2 emission of the Wuhan Metropolitan Area from 2001 to 2009 showed similar changing trends due to the relatively stable net CO2 sink from 2001 to 2009. From 2001 to 2002, both the total CO2 emission and net CO2 emission decreased, which can be explained by the decrease of CO2 emission from energy and agriculture departments. From 2003 to 2009, they both increased slightly, because rapid urbanization processes need large amounts of energy consumption and also large areas of farmland were converted into construction land.

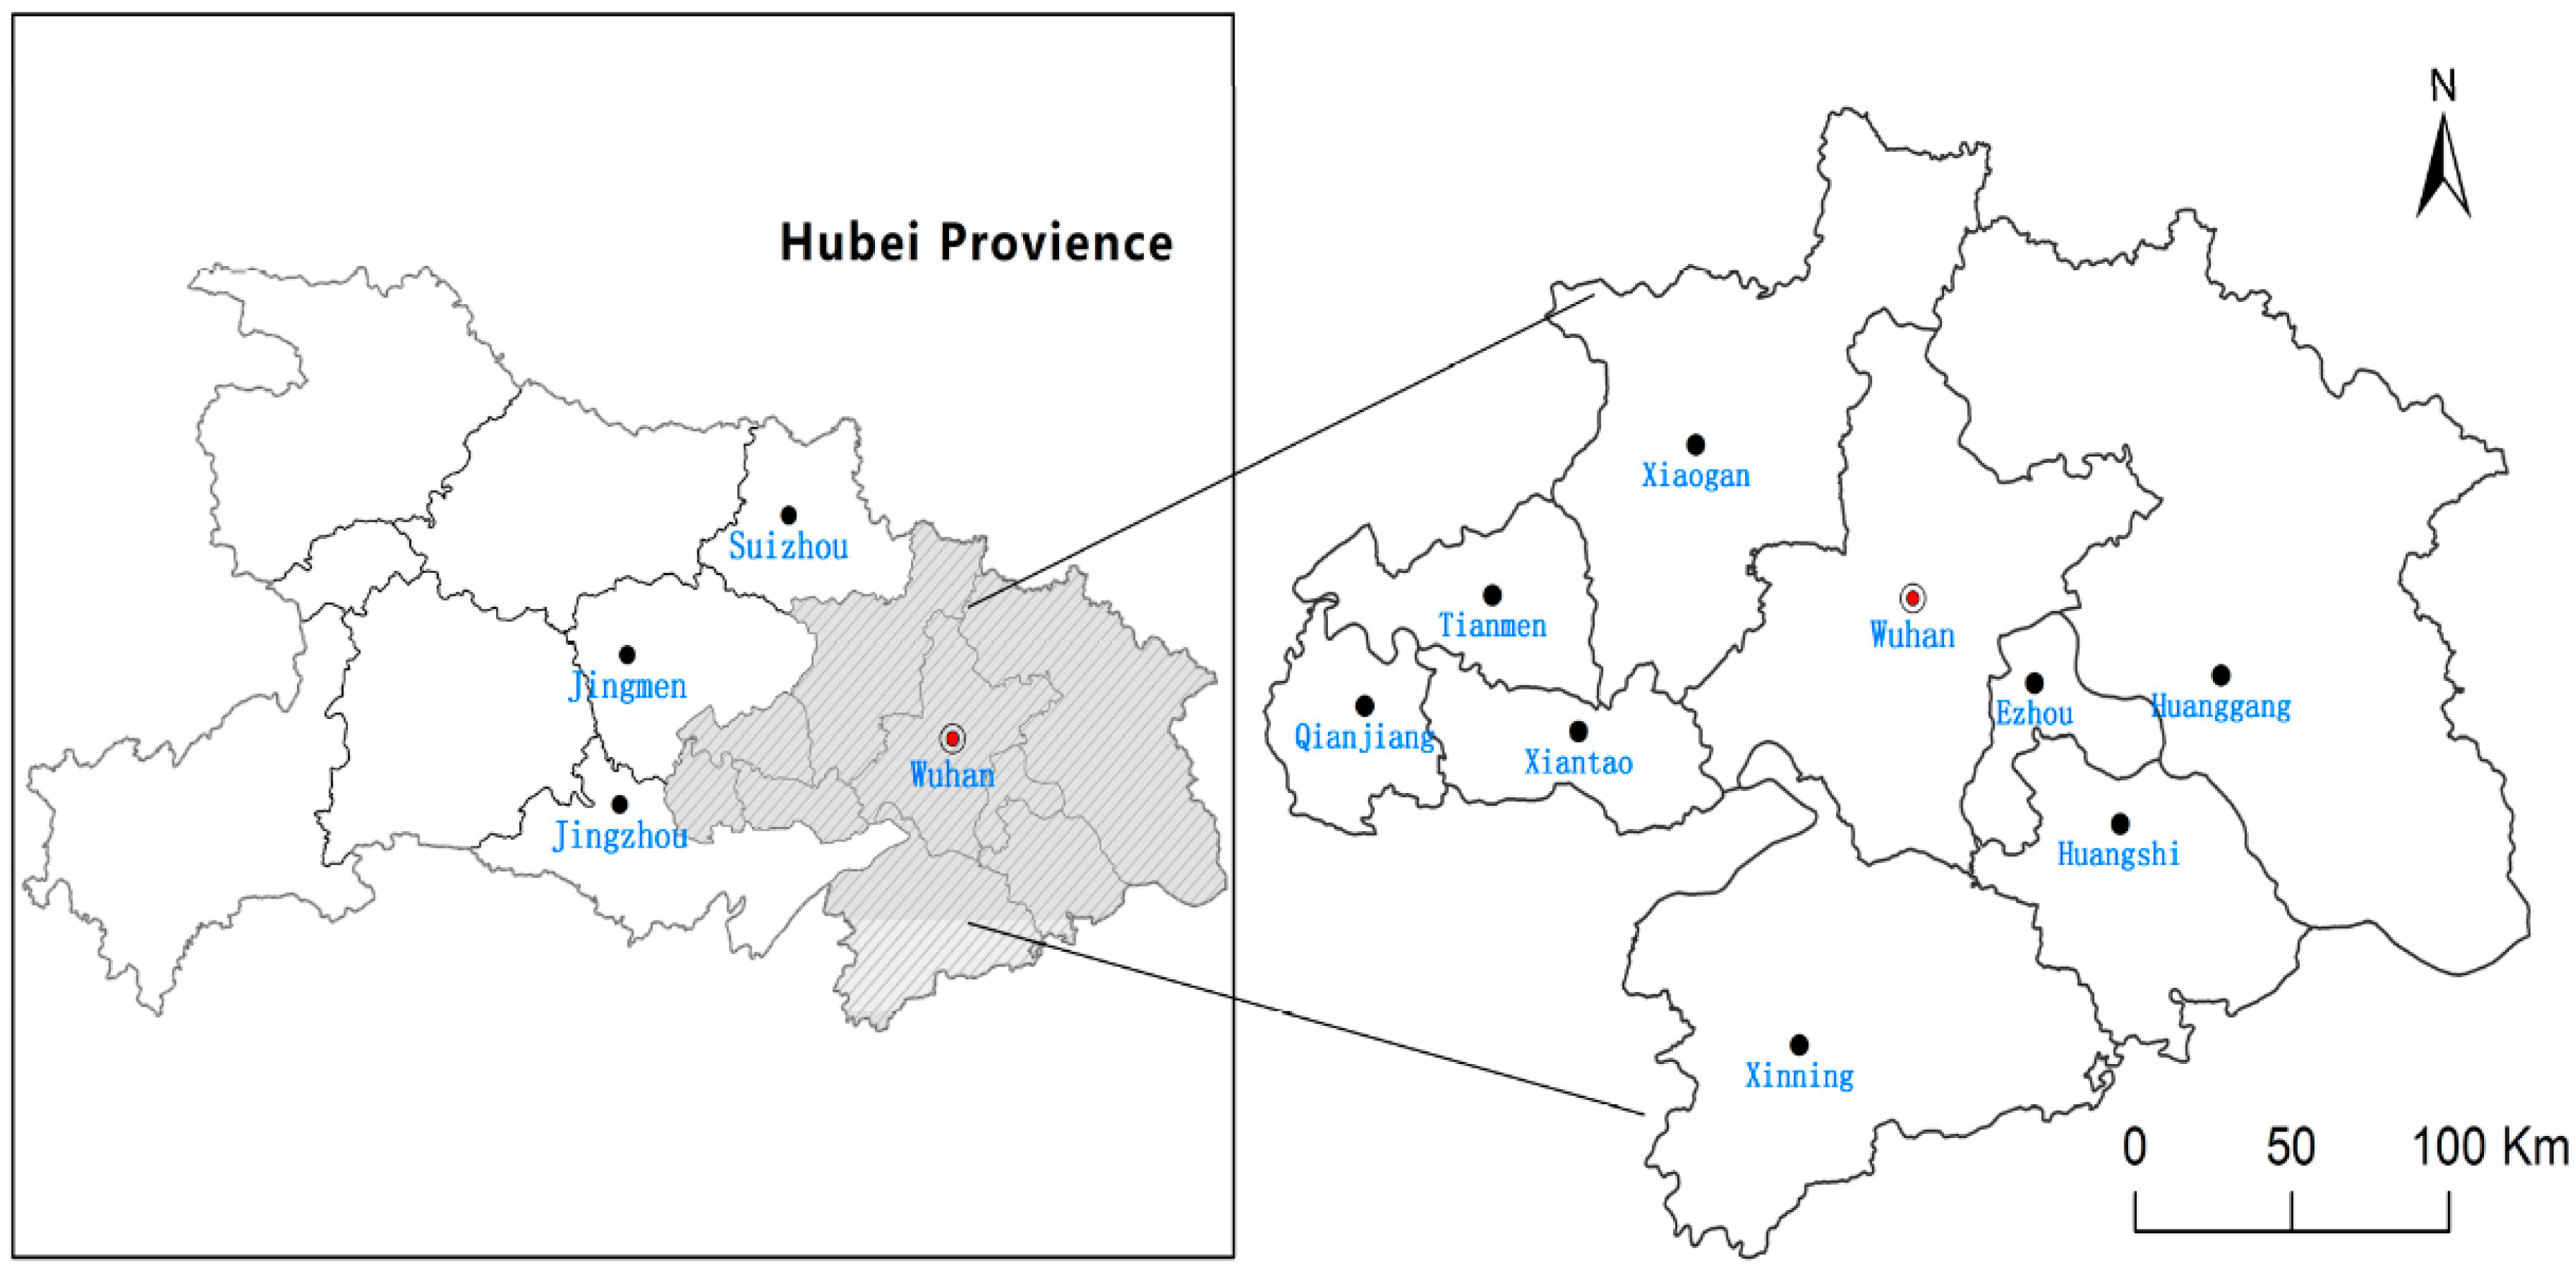
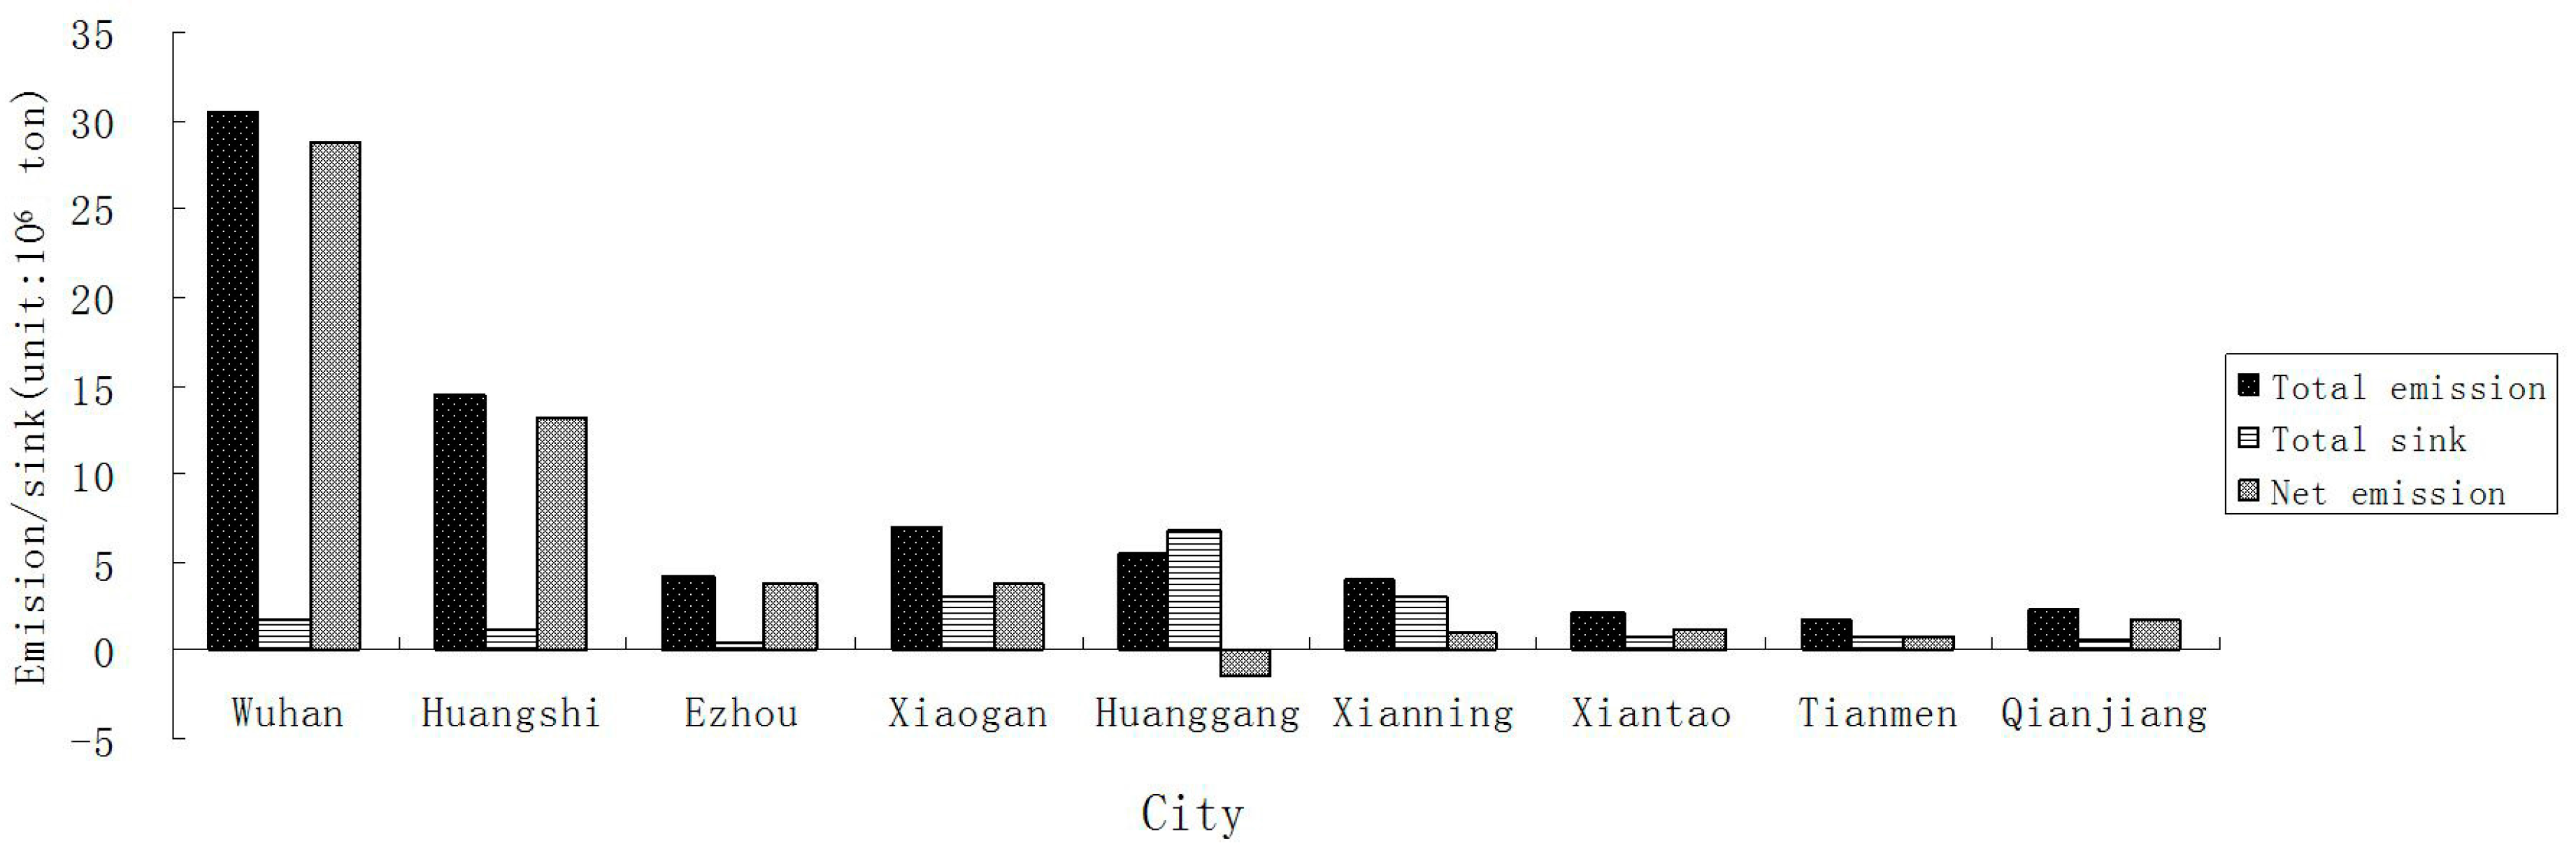
3.2. Spatial Distribution of Net CO2 Emission in the Wuhan Metropolitan Area in 2009

Period-wise analysis of the Wuhan Metropolitan Area could show the changing trend of CO2 emissions/sinks and net CO2 emissions from 2001 to 2009, however, cross-sectional results presented on a city-scale could help local governments understand the distance to their own CO2 emission reducing targets, which will also make the comparison among cities more convenient and intuitive, then promote the CO2 emission trading in each city. Results of cross-sectional data of CO2 emissions of the nine cities in the Wuhan Metropolitan Area in 2009 are calculated and listed in Table 2.
According to Table 2, for the total CO2 emission in the Wuhan Metropolitan Area, energy contributed the largest amount of CO2 emission in 2009 (43.43 × 10⁶ ton), followed by industrial processes and product use (25.54 × 10⁶ ton), followed by CO2 emissions from agriculture, forest, and other land use (2.01 × 10⁶ ton).The smallest amount of CO2 emission comes from waste (0.92 × 10⁶ ton). Among the nine cities of the Wuhan Metropolitan Area in 2009, each department followed the same rank order of CO2 emission as above, except Wuhan, Huangshi, and Tianmen. For Wuhan, CO2 emission from water deposing (0.53 × 10⁶ ton) was higher than that from the agricultural sector (0.40 × 10⁶ ton). As for the latter two cities, CO2 emissions from industrial processes and product use (9.75 × 10⁶ ton, 0.86 × 10⁶ ton) were higher than those from the energy sector (4.60 × 10⁶ ton, 0.72 × 10⁶ ton), respectively. Most of the heavy industries of the Wuhan Metropolitan Area were distributed in those two cities. Compared to CO2 emissions from light industries, heavy industries, such as the petrochemical industry, iron and steel industry, and power generation, are all industries with high CO2 emissions.
Table 2 also indicates that, in the Wuhan Metropolitan Area, cropland contributed the largest amount of CO2 sinks (13.14 × 10⁶ ton) during this period, followed by CO2 sinks from forests (7.56 × 10⁶ ton). CO2 sinks from grassland (1400 ton) were the smallest and showed a decreasing trend. Surprisingly, CO2 sinks coming from land use change sector (−0.28 × 10⁶ ton) is negative; in other words, it is CO2 emitter. This is also true for the total CO2 sinks of the eight cities, except Huanggang, whose forests contribute the largest amount of CO2 sinks (3.49 × 10⁶ ton). This can be explained by the forest covering rate achieving 56% in Huanggang, much higher than the average forest covering rate of the Wuhan Metropolitan Area. Forest has the highest ability to absorb CO2.
Particularly, the net CO2 emission in the Wuhan Metropolitan Area in 2009 achieved as much as 53.03 × 10⁶ tons, only Huanggang’ total CO2 emission was lower than its total CO2 sink, the other eight cities behaved in the opposite way.
The spatial distribution of CO2 emission of the Wuhan Metropolitan Area in 2009 was unbalanced, which can be shown in Figure 3. Wuhan contributed the highest amount of CO2 emission in the Wuhan Metropolitan Area, followed by Huangshi and Xiaogan. The CO2 emission of the above three cities accounted for 72.24% of the total CO2 emission in Wuhan Metropolitan Area. While the three cities with the least CO2 emission were Xitantao, Qianjing, and Tianmen, the CO2 emission of these three cities only accounted for 8.51% of the total CO2 emission of the Wuhan Metropolitan Area. More surprisingly, the CO2 emission of Wuhan was nearly 20 times higher that of Tianmen.
For CO2 sinks of the Wuhan Metropolitan Area in 2009, Huanggang contributed the highest amount of CO2 sinks, followed by Xiaogan and Xianning. The CO2 sinks of the above three cities account for 69.24% of the total CO2 sinks of the Wuhan Metropolitan Area. While the three cities with the least CO2 sinks were Tianmen, Qianjiang, and Ezhou, the CO2 sinks of these three cities only account for 10.41% of the total CO2 sinks of the Wuhan Metropolitan Area. More surprisingly, the CO2 emission of Huanggang was nearly 20 times higher that of Ezhou. This is to say, the spatial distribution of CO2 sinks of the Wuhan Metropolitan Area was unbalanced, but less than for CO2 emission. Different cities should adopt different policies to increase their CO2 sinks by taking their own CO2 emission reduction pressure into consideration.
Compared to CO2 emissions and CO2 sinks, the spatial intensity distribution of net CO2 emission of a city (net CO2 emission divided by its land area) can be used for different cities to make comparisons of their CO2 emission [31]. Figure 3 indicates that among the nine cities of the Wuhan Metropolitan Area, Wuhan contributed the highest amount of net CO2 emission, followed by Huangshi and Xiaogan. The net CO2 emission of the above three cities accounted for 86.61% of the total CO2 sinks of the Wuhan Metropolitan Area in 2009. While the three cities with the least CO2 sink were Qianjiang, Xiantao, and Tianmen, the net CO2 emission of these three cities only accounted for 5.64% of the net CO2 emission of the Wuhan Metropolitan Area. Particularly, the CO2 emission of Wuhan was nearly 25 times higher than that of Tianmen. Moreover, there was a special city (Huangang), whose net CO2 emission was negative (−1.36 × 10⁶ ton), it indicated that its total CO2 emission was lower than its total CO2 sink.

4. Decomposition and Analysis of Net CO2 Emission in the Wuhan Metropolitan Area

Estimation of CO2 emission, CO2 sink, and net CO2 emission can only provide the public with a general and quantity description of the CO2 emission in the Wuhan Metropolitan Area. More specific analysis is needed if the authors want to explore the driving factors behind the increasing CO2 emission trend. Generally, decomposition analysis is helpful for the public to understand those driving factors and the nature of CO2 emissions changes over a specific time which can provide the basis for the authorities to design more pertinent policies on CO2 emission deducing and trading.

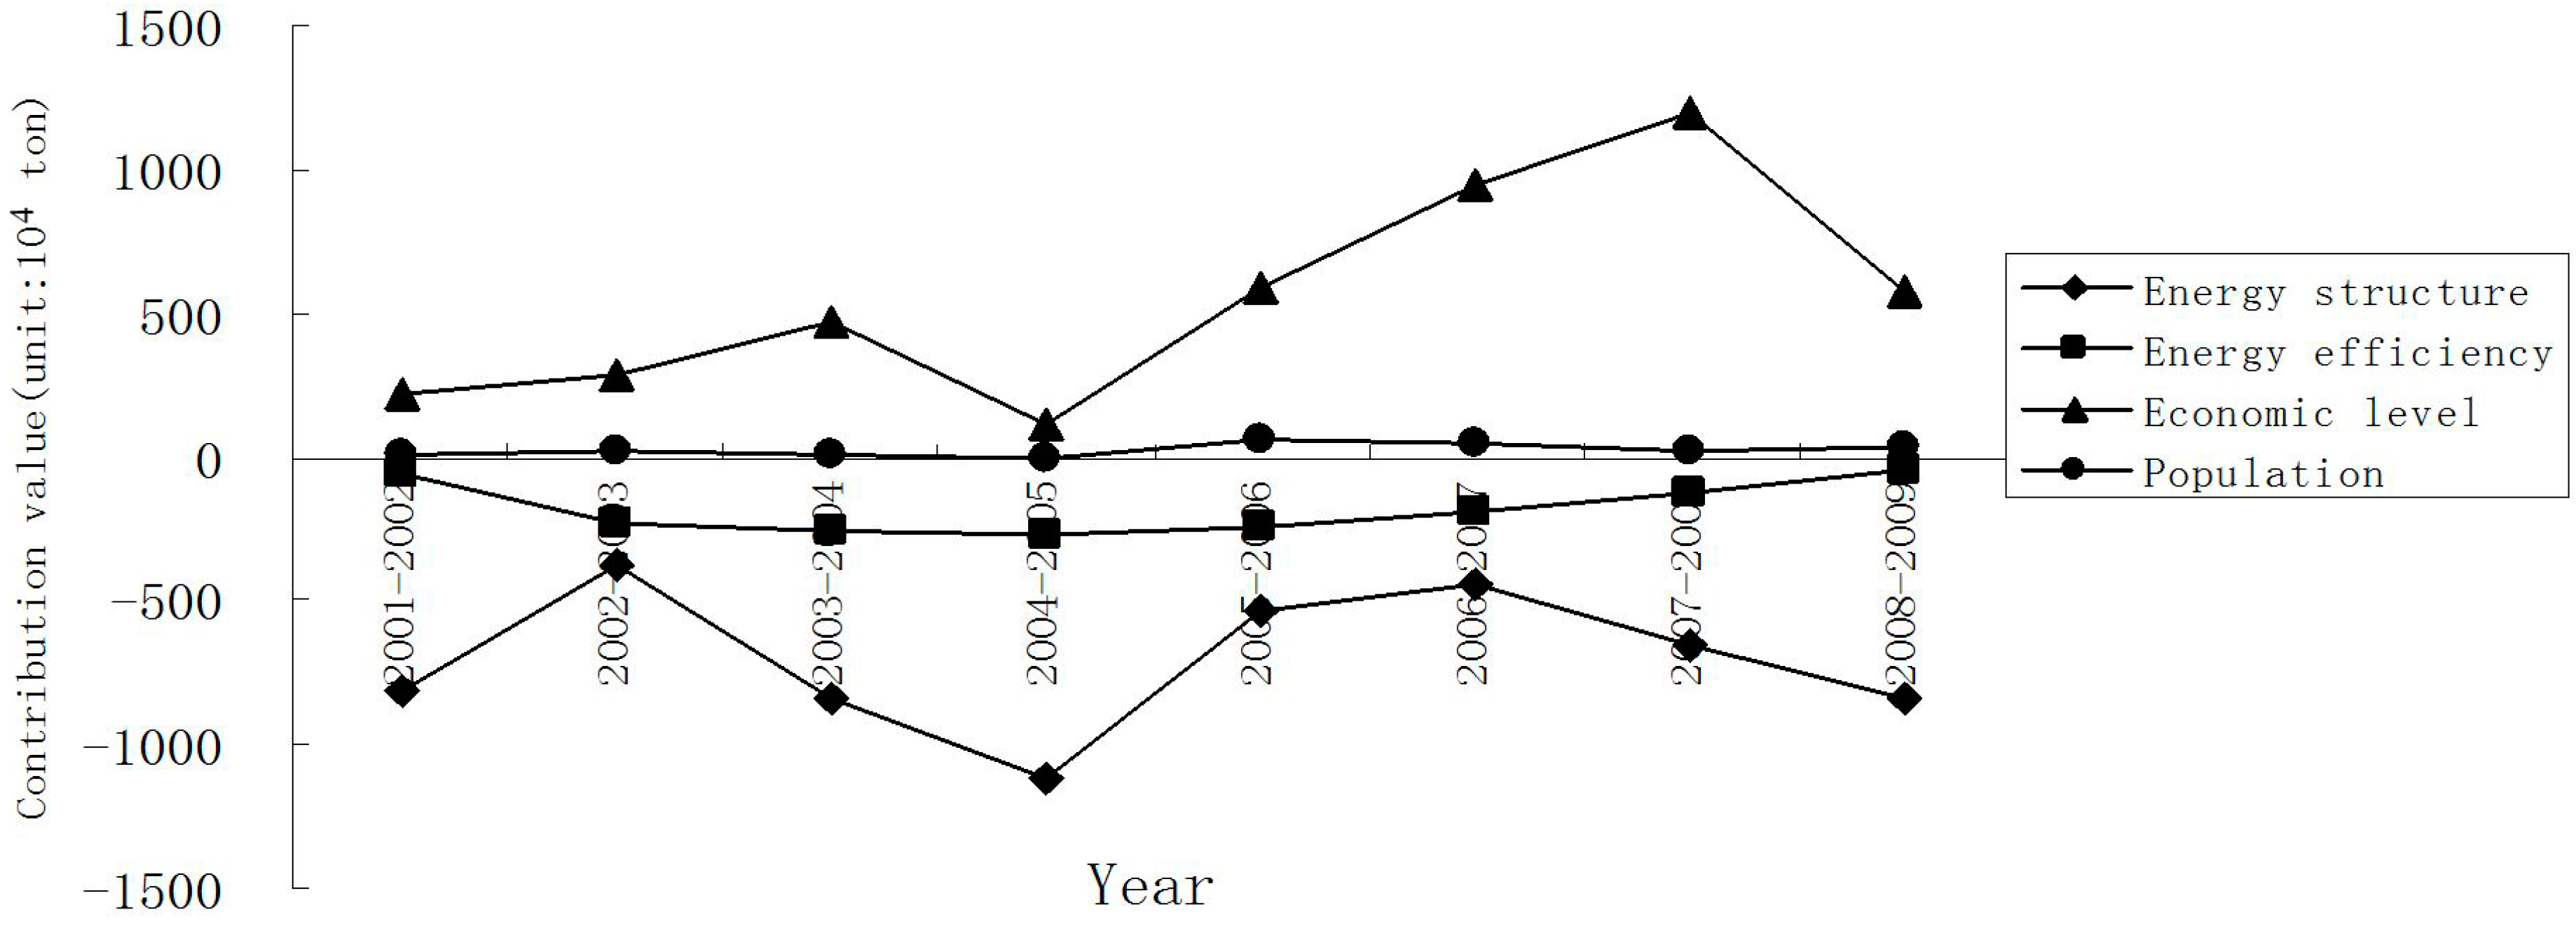
4.1. Decomposition for Net CO2 Emission in the Wuhan Metropolitan Area

Period-wise decomposition analysis of net CO2 emission in the Wuhan Metropolitan Area from 2001 to 2009 was presented in Table 3. The driving factors were decomposed into the energy structure effect, the energy efficiency effect, the economic development effect, and the population effect through the LMDI model. The annual and accumulative explanatory effects were calculated and listed below. It should be noted that only the net CO2 emission was analyzed through the LMDI model in this study.
According to the decomposition result of the net CO2 emission in the Wuhan Metropolitan Area from 2001 to 2009, the total effect was always negative, except that of 2006–2007 and 2007–2008. Factors of energy structure and energy efficiency are restricting factors of net CO2 emission, while the economic level and population, the main drivers of net CO2 emission, increase. Especially, the economic level and energy structure had significant effects on the net CO2 emission, while the effects of energy efficiency and population were not as significant.
To be more specific, for the two restricting factors of net CO2 emission, the energy structure effect showed a fluctuating trend from 2001 to 2009 while the energy efficiency effect showed a clear increasing trend from 2001 to 2003, and began to decrease from 2004 to 2009. For the two promoting effects, the economic level effect was also unstable, while the population presented a relatively stable trend during this period.
As shown in Figure 4, period-wise analysis of the total effect of CO2 emissions from 2001 to 2009 can be divided into two stages. From 2001 to 2005, the gap between the restriction effect and the prompting effect became smaller, which led to the net CO2 emission reduction during this period. After 2005, this gap became larger as time went by, so the net CO2 emission kept increasing since then. All of these can be reflected in the total effect during 2001 to 2009.

4.2. Decomposition Analysis

Table 3 and Figure 4 show that factors that contribute to the rapid increase of net CO2 emission from 2000 to 2009 in the Wuhan Metropolitan Area were economic level and population. The economic level was the most important prompting factor with an accumulative contribution of 4380.39 × 104 ton, much higher than that of population (173.26 × 10⁴ ton).
This indicated that, without restricting the function of other factors, the increment of the total CO2 footprint of the Wuhan Metropolitan Area will be much higher by the influence of economic development. Especially during the period of 2004–2005, the drastic increase of economic level led to its increasing contribution to net CO2 emission in the Wuhan Metropolitan Area. The population factor was also a promoting factor, but its contribution value was much less than that of the economic development factor, whose contribution value was only about 1/25 times as much as that of the economic level. The effect of population experienced a peak in 2004–2005, then returned to the normal status. Generally, the effect of population was so insignificant that it can be neglected.
The main restricting factors were the energy structure effect and the energy efficiency effect, in which the restricting effect of the energy structure was the highest, on the whole. Generally, the restricting effect of the energy structure presented a fluctuating trend from 2001 to 2009. The total contribution value was huge. However, the restricting effect of energy efficiency was not only as significant as the energy structure, but also showed a clear decreasing trend effect. After all of the factors which could affect the CO2 emission were decomposed by reasonable conversion of the LMDI model, the results show that factors of the energy structure and energy efficiency can restrain net CO2 emission. Conversely, economic development and the population scale increase the net CO2 emission.

5. Conclusions and Implications

5.1. Conclusions

This study established a city-scale CO2 emission/sink accounting system that covers all sectors of economic activities in the Wuhan Metropolitan Area according to reference [34]. Results indicated that total CO2 emissions kept increasing from 2001 to 2009, energy (43.43 × 10⁶ ton) was the highest proportion, followed by the industry (25.54 × 10⁶ ton) and agriculture (2.01 × 10⁶ ton), and the smallest amount of CO2 emission comes from the waste (0.92 × 10⁶ ton). CO2 sinks showed a fluctuating trend during 2001 to 2009, cropland contributed the largest (13.14 × 10⁶ ton), followed by forest (7.56 × 10⁶ ton), and then grass (0.14 × 10⁴ ton). CO2 sinks from land use change is negative (−0.28 × 10⁶ ton, actually it was CO2 emission). Moreover, the net CO2 emission and its influencing factors during 2001 to 2009 were analyzed through the LMDI model. It could be concluded that energy intensity effect and economy development were identified as the dominant contributors to the decline and increase in net CO2 emissions respectively. Energy efficiency effect contributed less to reduce the net CO2 emission, and population effects are found to contribute little to the increase in the net CO2 emission in the Wuhan Metropolitan Area. A comparison with the previous work was also made as follows:
First, CO2 emission of the Wuhan Metropolitan Area shows an increasing trend from 2001 to 2009, with energy making the greatest contribution, followed by industry, agriculture, and waste. This is generally consistent with the broader literature (e.g., Chong et al. [21], Li et al. [35]) that energy and industry are often the largest contributors to CO2 emissions. Moreover, CO2 sinks fluctuate during this period, with cropland contributing the most, followed by forest and grass. Land use change actually increases CO2 emission rather than act as a sink over this period. The magnitudes of CO2 sinks from forest and grassland are also consistent with Zhao et al. [30]. There has been very limited literature incorporating CO2 sinks in decomposition analysis.
The boarder decomposition literature has generally found that energy efficiency effect (energy intensity effect or technological effect) is the dominant contributor to decreased gross CO2 emission, while scale effect (including income effect and scale effect) contributes the most to increased CO2 emissions, which is consistent with the conclusion of Karmellos et al. [5] and Zhang et al. [31]. These results turn out to be relatively robust even if one uses net rather than gross emissions. However, the role of emission intensity effect becomes significantly greater in the change of net emissions compared to gross emissions.
Third, this study has several limitations. As we are conducting decomposition analysis at a disaggregated city level, data becomes less available as we introduce more factors into the decomposition. This has constrained us from performing a finer analysis. Although LMDI has become popular in the decomposition literature, it cannot handle zero values [36]. Lastly, given that decomposition models are descriptive rather than inferential, potential inter-region endogenous effects are hard to identify.
Finally, improvements of this study can be made from the following aspects: (1) CO2 emission from waste should be more specific, since different ways of dealing with different kinds of waste will produce different amounts of CO2 emission, more specific CO2 emission coefficients, and relevant statistics should be taken into consideration for further research; (2) the research period was 2001–2009 in this paper due to the unavailability of the latest data; calculation and decomposition work of the following years should be added in the following study; (3) CO2 sinks from chemical or biological treatments should be included into the estimation of carbon sinks despite its scale being quite small in the Wuhan Metropolitan Area at the present.

5.2. Implications

Our results show that emission intensity played a key role in CO2 emission reduction. Given that coal is the dominant energy consumed in the Wuhan Metropolitan Area, developing clean energy technologies is of great potential. Another approach to emission mitigation is to reduce energy intensity or improve energy efficiency. As the economy in the Wuhan Metropolitan Area relies heavily upon the energy-consuming petrochemical industry, iron and steel industry, and power generation, the reduction in economy-wide energy intensity can be achieved by improving energy efficiency, as well as adjusting the industrial structure. As Wuhan is one of the seven pilot markets for carbon trading—a market-based instrument to mitigate carbon emission—it is interesting to see how such a policy experiment could help develop cleaner technologies and facilitate a transition towards a low-carbon economy.
On the other hand, CO2 sinks play a vital role in reducing net CO2 emission, which mainly relies on agriculture and forest. Despite various policy initiatives to protect agricultural and forest land, we still observe 0.9% of the remaining agricultural land converted into urban land due to the rapid urbanization in the Wuhan Metropolitan Area every year. Policies with compensation incentives for agricultural and forest land protection are urgently called for. Immediate questions include what the level and terms of compensation should be and how regional heterogeneity could be incorporated, etc.

Acknowledgments

We are grateful to two anonymous referees for their useful comments on this paper. This study was supported the Fundamental Research Funds for the Central Universities of China (2662015QD024), Ministry of Education of the China Key Grant (14JZD009), and the National Natural Science Fund Foundation of China (71573101, 71573099, 71373095, 71403050).

Author Contributions

Xin Yang and Anlu Zhang developed the concept and the design of the study. Xin Yang and Chunbo Ma collected and analysed the data, Xin Yang and Chunbo Ma drafted the manuscript. Chunbo Ma and Anlu Zhang critically revised it. All authors read and approved the final manuscript.

Conflicts of Interest

The authors declare no conflict of interest.

References

  1. Lee, K.; Oh, W. Analysis of CO2 emissions in APEC countries: A time-series and a cross-sectional decomposition using the log mean Divisia method. Energy Policy 2006, 34, 2779–2787. [Google Scholar] [CrossRef]
  2. Vinuya, F.; DiFurio, F.; Sandoval, E. A decomposition analysis of CO2 emissions in the United States. Appl. Econ. Lett. 2010, 17, 925–931. [Google Scholar] [CrossRef]
  3. Ang, B. Decomposition analysis for policymaking in energy: Which is the preferred method? Energy Policy 2004, 32, 1131–1139. [Google Scholar] [CrossRef]
  4. Ang, B.W.; Zhang, F. A survey of index decomposition analysis in energy and environmental studies. Energy 2000, 25, 1149–1176. [Google Scholar] [CrossRef]
  5. Karmellos, M.; Kopidou, D.; Diakoulaki, D. A decomposition analysis of the driving factors of CO2 (Carbon dioxide) emissions from the power sector in the European Union countries. Energy 2016, 94, 680–692. [Google Scholar] [CrossRef]
  6. Hammond, G.P.; Norman, J.B. Decomposition analysis of energy-related carbon emissions from UK manufacturing. Energy 2012, 41, 220–227. [Google Scholar] [CrossRef] [Green Version]
  7. Cansino, J.M.; Román, R.; Ordóñez, M. Main drivers of changes in CO2 emissions in the Spanish economy: A structural decomposition analysis. Energy Policy 2016, 89, 150–159. [Google Scholar] [CrossRef]
  8. De Freitas, L.C.; Kaneko, S. Decomposition of CO2 emissions change from energy consumption in Brazil: Challenges and policy implications. Energy Policy 2011, 39, 1495–1504. [Google Scholar] [CrossRef]
  9. Akbostancı, E.; Tunç, G.İ.; Türüt-Aşık, S. CO2 emissions of Turkish manufacturing industry: A decomposition analysis. Appl. Energy 2011, 88, 2273–2278. [Google Scholar] [CrossRef]
  10. Liu, L.-C.; Fan, Y.; Wu, G.; Wei, Y.-M. Using LMDI method to analyze the change of China’s industrial CO2 emissions from final fuel use: An empirical analysis. Energy Policy 2007, 35, 5892–5900. [Google Scholar] [CrossRef]
  11. Meng, L.; Guo, J.E.; Chai, J.; Zhang, Z. China’s regional CO2 emissions: Characteristics, inter-regional transfer and emission reduction policies. Energy Policy 2011, 39, 6136–6144. [Google Scholar] [CrossRef]
  12. Yu, S.; Wei, Y.-M.; Fan, J.; Zhang, X.; Wang, K. Exploring the regional characteristics of inter-provincial CO2 emissions in China: An improved fuzzy clustering analysis based on particle swarm optimization. Appl. Energy 2012, 92, 552–562. [Google Scholar] [CrossRef]
  13. Nag, B.; Parikh, J. Indicators of carbon emission intensity from commercial energy use in India. Energy Econ. 2000, 22, 441–461. [Google Scholar] [CrossRef]
  14. Li, W.; Feng, T.; Hao, J. The evolving concepts of land administration in China: Cultivated land protection perspective. Land Use Pol. 2009, 26, 262–272. [Google Scholar] [CrossRef]
  15. Oh, I.; Wehrmeyer, W.; Mulugetta, Y. Decomposition analysis and mitigation strategies of CO2 emissions from energy consumption in South Korea. Energy Policy 2010, 38, 364–377. [Google Scholar] [CrossRef]
  16. Papagiannaki, K.; Diakoulaki, D. Decomposition analysis of CO2 emissions from passenger cars: The cases of Greece and Denmark. Energy Policy 2009, 37, 3259–3267. [Google Scholar] [CrossRef]
  17. Salta, M.; Polatidis, H.; Haralambopoulos, D. Energy use in the Greek manufacturing sector: A methodological framework based on physical indicators with aggregation and decomposition analysis. Energy 2009, 34, 90–111. [Google Scholar] [CrossRef]
  18. Xu, X.Y.; Ang, B.W. Index decomposition analysis applied to CO2 emission studies. Ecol. Econ. 2013, 93, 313–329. [Google Scholar] [CrossRef]
  19. Kaivo-oja, J.; Luukkanen, J.; Panula-Ontto, J.; Vehmas, J.; Chen, Y.; Mikkonen, S.; Auffermann, B. Are structural change and modernisation leading to convergence in the CO2 economy? Decomposition analysis of China, EU and USA. Energy 2014, 72, 115–125. [Google Scholar] [CrossRef]
  20. Ortega, D.L.; Wang, H.H.; Wu, L.; Olynk, N.J. Modeling heterogeneity in consumer preferences for select food safety attributes in China. Food Policy 2011, 36, 318–324. [Google Scholar] [CrossRef]
  21. Chong, H.B.W.; Guan, D.; Guthrie, P. Comparative analysis of carbonization drivers in China’s megacities. J. Ind. Ecol. 2012, 16, 564–575. [Google Scholar] [CrossRef]
  22. Ren, S.; Yin, H.; Chen, X. Using LMDI to analyze the decoupling of carbon dioxide emissions by China’s manufacturing industry. Environ. Dev. 2014, 9, 61–75. [Google Scholar] [CrossRef]
  23. Wang, Y.; Zhu, Q.; Geng, Y. Trajectory and driving factors for GHG emissions in the Chinese cement industry. J. Clean. Prod. 2013, 53, 252–260. [Google Scholar] [CrossRef]
  24. Yang, J.; Chen, B. Using LMDI method to analyze the change of industrial CO2 emission from energy use in Chongqing. Front. Earth Sci. 2011, 5, 103–109. [Google Scholar] [CrossRef]
  25. Zhao, M.; Tan, L.; Zhang, W.; Ji, M.; Liu, Y.; Yu, L. Decomposing the influencing factors of industrial carbon emissions in Shanghai using the LMDI method. Energy 2010, 35, 2505–2510. [Google Scholar] [CrossRef]
  26. Liu, Z.; Liang, S.; Geng, Y.; Xue, B.; Xi, F.; Pan, Y.; Zhang, T.; Fujita, T. Features, trajectories and driving forces for energy-related GHG emissions from Chinese mega cites: The case of Beijing, Tianjin, Shanghai and Chongqing. Energy 2012, 37, 245–254. [Google Scholar] [CrossRef]
  27. Chen, G.; Chen, B. Extended-exergy analysis of the Chinese society. Energy 2009, 34, 1127–1144. [Google Scholar] [CrossRef]
  28. Zhang, M.; Mu, H.; Ning, Y. Accounting for energy-related CO2 emission in China, 1991–2006. Energy Policy 2009, 37, 767–773. [Google Scholar] [CrossRef]
  29. Hörtenhuber, S.; Piringer, G.; Zollitsch, W.; Lindenthal, T.; Winiwarter, W. Land use and land use change in agricultural life cycle assessments and carbon footprints-the case for regionally specific land use change versus other methods. J. Clean. Prod. 2014, 73, 31–39. [Google Scholar] [CrossRef]
  30. Zhao, R.; Huang, X.; Liu, Y.; Zhong, T.; Ding, M.; Chuai, X. Urban carbon footprint and carbon cycle pressure: The case study of Nanjing. J. Geogr. Sci. 2014, 24, 159–176. [Google Scholar] [CrossRef]
  31. Zhang, W.; Li, K.; Zhou, D.; Zhang, W.; Gao, H. Decomposition of intensity of energy-related CO2 emission in Chinese provinces using the LMDI method. Energy Policy 2016, 92, 369–381. [Google Scholar] [CrossRef]
  32. Zhang, Y.; Zhang, J.; Yang, Z.; Li, S. Regional differences in the factors that influence China’s energy-related carbon emissions, and potential mitigation strategies. Energy Policy 2011, 39, 7712–7718. [Google Scholar] [CrossRef]
  33. National Response to Climate Change Program (2014–2020). Avaible online: http://www.sdpc.gov.cn/zcfb/zcfbtz/201411/t20141104_642612.html (acessed on 19 September 2014). (In Chinese)
  34. 2006 IPCC Guidelines for National Greenhouse Gas Inventories. Avaible online: http://www.ipcc-nggip.iges.or.jp /public/2006gl/chinese/ (acessed on 5 August 2016). (In Chinese)
  35. Li, L.; Chen, C.; Xie, S.; Huang, C.; Cheng, Z.; Wang, H.; Wang, Y.; Huang, H.; Lu, J.; Dhakal, S. Energy demand and carbon emissions under different development scenarios for Shanghai, China. Energy Policy 2010, 38, 4797–4807. [Google Scholar] [CrossRef]
  36. Ang, B.W.; Zhang, F.Q.; Choi, K.H. Factorizing changes in energy and environmental indicators through decomposition. Energy 1998, 23, 489–495. [Google Scholar] [CrossRef]
Figure 1. Administrative division of Wuhan Metropolitan Area.
Sustainability 08 00784 g001
Figure 2. Total CO2 emission/sink and net CO2 emission of the Wuhan Metropolitan Area from 2001 to 2009.
Sustainability 08 00784 g002
Figure 3. CO2 emission/sink and net CO2 emission of the nine cities in the Wuhan Metropolitan Area in 2009 (unti: 106 ton).
Sustainability 08 00784 g003
Figure 4. The decomposition of net CO2 emissions in the Wuhan Metropolitan Area from 2001 to 2009 (unit: 104 ton).
Sustainability 08 00784 g004
Table 1. CO2 emission/sink and net CO2 emission from 2001 to 2009 in the Wuhan Metropolitan Area (unti: 106 ton).
YearEnergyIndustryAgricultureWasteTotal EmissionCroplandForestGrassland (104 ton)Land Use ChangeTotal SinksNet Emission
200135.187.711.351.0245.269.097.180.350.2916.5628.70
200228.2211.131.341.0641.758.937.250.350.5116.6925.06
200333.9512.321.471.0648.818.627.470.350.6816.7832.03
200439.8814.361.501.0356.7710.047.510.280.3517.9038.87
200543.0217.251.480.8162.5710.317.570.140.4718.3644.21
200645.9818.561.760.8167.1210.657.570.140.2218.4548.67
200748.8219.741.620.8170.989.997.570.140.1817.7453.24
200844.7624.571.920.9572.2010.917.570.14−0.10 18.3853.82
200943.4425.542.010.9271.9111.477.560.14−0.20 18.8353.08
sum363.25151.1714.458.49537.3790.0167.262.032.40159.69377.68
Table 2. CO2 emissions/sinks and net CO2 emissions in the nine cities in the Wuhan Metropolitan Area in 2009 (unti: 106 ton).
CityEnergyIndustryAgricultureWasteTotal EmissionCroplandForestGrassland (104 ton)Land Use ChangeTotal SinksNet Emission
Wuhan21.518.050.400.5383.381.730.430.01−0.171.7628.73
Huangshi4.609.750.090.0721.630.690.640.00−0.021.2213.29
Ezhou2.781.270.130.048.270.410.090.000.000.453.77
Xiaogan4.492.070.320.0814.472.640.720.00−0.043.043.91
Huanggang4.040.860.570.0813.143.873.490.13−0.016.91−1.36
Xianning2.581.270.170.058.681.182.110.00−0.013.120.94
Xiantao1.120.820.110.034.880.960.030.00−0.010.871.20
Tianmen0.720.860.110.034.250.950.020.000.000.860.85
Qianjiang1.580.610.130.024.750.720.030.00−0.020.651.69
Sum43.4325.542.010.92163.4513.147.560.14−0.2818.8853.03
Table 3. Explanatory effects of CO2 emissions in the Wuhan Metropolitan Area from 2001 to 2009 (unit: 104 ton).
YearEnergy StructureEnergy EfficiencyEconomic LevelPopulationTotal Effect
2001–2002−811.08−60.80216.6412.53−642.71
2002–2003−372.29−237.33285.5316.79−307.31
2003–2004−835.97−263.14473.026.17−619.92
2004–2005−1110.22−265.84110.43−10.20−1275.83
2005–2006−536.01−242.57585.1854.70−138.70
2006–2007−445.64−198.22941.8941.57339.60
2007–2008−656.53−128.521192.4322.04429.42
2008–2009−838.40−40.68575.2629.67−274.15
2001–2009−5606.14−1437.104380.39173.26-----

