Article

Analytical Business Model for Sustainable Distributed Retail Enterprises in a Competitive Market

by
Courage Matobobo
and
Isaac O. Osunmakinde
*
School of Computing, College of Science, Engineering and Technology, University of South Africa, P.O. Box 392, UNISA, Pretoria 0003, South Africa
*
Author to whom correspondence should be addressed.
Sustainability 2016, 8(2), 140; https://doi.org/10.3390/su8020140
Submission received: 12 November 2015 / Revised: 11 January 2016 / Accepted: 21 January 2016 / Published: 4 February 2016
(This article belongs to the Special Issue Sustainable Business Models)

Abstract

:
Retail enterprises are organizations that sell goods in small quantities to consumers for personal consumption. In distributed retail enterprises, data is administered per branch. It is important for retail enterprises to make use of data generated within the organization to determine consumer patterns and behaviors. Large organizations find it difficult to ascertain customer preferences by merely observing transactions. This has led to quantifiable losses, such as loss of market share to competitors and targeting the wrong market. Although some enterprises have implemented classical business models to address these challenging issues, they still lack analytics-based marketing programs to gain a competitive advantage to deal with likely catastrophic events. This research develops an analytical business (ARANN) model for distributed retail enterprises in a competitive market environment to address the current laxity through the best arrangement of shelf products per branch. The ARANN model is built on association rules, complemented by artificial neural networks to strengthen the results of both mutually. According to experimental analytics, the ARANN model outperforms the state of the art model, implying improved confidence in business information management within the dynamically changing world economy.

1. Introduction

Business information (BI) analytics are groups of methodologies, organizational techniques and tools used collectively to gain information, analyze it and predict the outcomes of solutions to problems [1]. The field of BI analytics through the use of operational data generated from transactional systems has given business users better insight into the problems they face [2]. These insights can assist business users or managers to make better and informed decisions. BI analytics are commonly applied in sustainable retail enterprises. Retail enterprises purchase goods from manufacturers or wholesalers in large quantities. They break up the bulk and resell those goods in smaller quantities directly to consumers. Consumers can go around the shop, pick the items of their choice from the shop shelves, place them into their baskets and then the contents of each basket are captured into transactional systems. These transactional systems generate data that can be used for analysis purposes. There are two major types of retail enterprises: centralized and distributed retail enterprises. This paper concentrates on distributed retail enterprises as a way of alleviating analytics issues of enterprises in a competitive market environment.
A distributed retail enterprise issues decision rights to the branches or groups nearest to the data collection [3]. Each branch can make its own decisions, depending on the data generated. A distributed retail enterprise often maintains clustered databases for each branch for the storage of data. Data generated in a distributed retail enterprise branch usually reflects the true customer purchasing habits at that particular branch. Data analysis per branch might reveal better results than a centralized data management system. It is, therefore, important to analyze data generated in each branch to realize meaningful patterns. Analysts can apply BI analytics to branch data in order to generate meaningful patterns for each particular branch.
Retail enterprises strive for survival in view of the current challenging sales optimization models. These models affect product arrangements in retail enterprises, leading to a decline in sales levels [4], high research and marketing costs, a decline in market share, wrong product target markets and poor management decisions [5]. Figure 1 presents the quantitative impact of these challenging sales optimization models in retail enterprises. Figure 1a shows the sales decline in Hungarian retail enterprises in June 2013. The sales level of computer equipment and books declined drastically by 4.8%, while sales of non-food items had the lowest level of decline of 0.4%. Figure 1b shows the causes of the reduction in sales level. The highest scoring reason for the reduction in sales was expensiveness (48%), followed by 41% of products with features unavailable. The least common reason for a reduction in sales was lack of functionality (20%).
Figure 1. Impact of current sales optimization models on retail enterprises. (a) reduction in retail sales. Adapted from [6]; (b) reasons for reduction in sales. Adapted from [7].
Sustainability 08 00140 g001
Data quality problems also affect the quality of decisions made by managers on different levels of a retail enterprise [5]. Poor data has caused problems in both traditional and e-business companies, as shown in Figure 2. In both types of companies, extra cost to prepare reconciliations was seen as the main problem caused by inadequate data. This was seen to have an impact of 58% and 57% respectively. Inability to deliver orders or loss of sales was also a poor data quality challenge that had a higher impact in e-business (33%) than in traditional (24%) companies. The lowest-scoring problem caused by poor data was failure to meet a significant contractual requirement.
Figure 2. Problems caused by poor data quality. Adapted from [8].
Sustainability 08 00140 g002
An organization implemented an easy-to-use desktop and server analytics software program for the development of several business units and to improve the basis for decision-making [9]. The challenge was to test the most effective BI analytics for solving theoretical business problems. A data consolidation project was undertaken in South Africa by Altron to organize and deliver high-quality data successfully to its executives on their Apple iPads [10]. The smart phones’ interfaces were too small for the style and amount of information they wanted to deliver. This approach posed the following challenges: lack of an analytics-based marketing program, failure to make BI a “matchmaker”, lack of business-driven analytic strategies and failure to test the most effective BI analytics for solving theoretical business problems.
This paper develops an analytical business (ARANN) model that can be used in distributed retail enterprises within the dynamically changing world economy to implement the best arrangement of shelf products at each branch in order to improve the weaknesses highlighted in Figure 1 and Figure 2. The ARANN model is built on a machine learning technique, association rules (AR) technique, complemented by an artificial neural network (ANN) technique to strengthen the results of the individual models. Since sustainability in this context generally requires the ability of a business to sustain itself in times of crisis, similar to competitive markets, ARANN has been specifically designed for sustainable distributed and centralized retail enterprises. The major contributions in this paper are the following:
Development of a newly proposed analytical ARANN model that could intelligently assist distributed retail enterprise management within competitive markets to arrange products optimally on store shelves so that customers will purchase more products than planned in order to achieve an optimal profit level.
Detailed experimental evaluations conducted on the sustainable ARANN model as measures of its performance using publicly available data and a volume of real-life retail data sets captured in ever-changing markets.
Application of a robust business model in terms of (i) deployment scenarios, (ii) distributed and centralized analytics, (iii) time and memory scalability, and (iv) benchmark with classical methods for ease of implementation for managerial practices in IT.
To our knowledge, not enough research has presented user-friendly models and work examples to make technical information and BI available to professional managers. This paper is structured as follows: Section 2 previews work done in the area of AR and ANN, Section 3 proposes an intelligent model for distributed retail enterprises, Section 4 focuses on experimental evaluations and finally, Section 5 concludes the paper.

2. Background Studies

2.1. Related Work

Besides the analytics software programs and projects mentioned above, classical applications of AR and ANN are highlighted here. From the research conducted in [11], the authors applied AR to medical data containing combinations of categorical and numerical attributes to discover useful rules and from this experiment, useful and concise AR were discovered for prediction purposes. In [12], the authors implemented a system for the discovery of AR in web log usage data as an object-oriented application and discovered excellent associations within the data. They put forward “interestingness measures” as future work. In [13], the researchers applied an AR algorithm to a large database of customer transactions from a large retailing company to test the effectiveness of the algorithm and it exhibited excellent performance. In the study conducted in [14], it was observed that AR is effective in revealing associations though it does not take into account special interests. A comprehensive survey was conducted in [15] regarding AR on quantitative data in data mining. The authors examined it using different parameters and they concluded that the direct application of AR might produce a large number of redundant rules. This is also supported in the article in [16].
AR was applied in [4] to a sport company struggling with the arrangement of sports items in accordance with customer purchasing patterns. The retail company had no computerized mechanism for providing the best item arrangement. The study was performed to identify purchasing patterns that could be adopted by the retail enterprise. The authors analyzed historical data to identify the associated patterns from transactional data. From the study, they found relationships between sports items purchased and the best ways of arranging items, either side by side or in the same retail area, so that the items were frequently purchased together to yield high sales. In this study, AR was used for mining relationships between items purchased.
AR was applied in [11] to medical data containing combinations of categorical and numerical attributes to discover useful rules and from this experiment, useful and concise associations were discovered for prediction purposes. Ordonez [17] used AR to predict the level of contraction in four arteries and risk factors. The experiment predicted accurate profiles of patients with localized heart problems, specific risk factors and the level of disease in one artery.
ANN have been used in the past to search for patterns and predict future sales [18]. In research conducted in [19], the authors evaluated the predictive accuracy of ANNs and logistic regression (LR) in marketing campaigns of a Portuguese banking institution and their results showed that ANNs are more efficient and faster than LR. In [20], the researchers applied ANNs to a Pima Indians diabetes database and it generated rules with strong associations, thereby enhancing the decision-making process by doctors. In research conducted in [21], ANNs were applied for retail segmentation. The authors compared an ANN technique based on Hopfield networks against k-means and mixture model clustering algorithms. The results showed the usefulness of ANNs in retailing for segmenting markets. Many articles mentioned in [22] consider ANNs to be a promising machine learning technique.
In research conducted in [23], it was observed that the combination of data mining methods and a neural network model can greatly improve the efficiency of data mining methods. Craven and Shavlik [24] also supported ANN in data mining because of the ability to learn the target concept better than when using data mining methods. However, they presented two limitations that make ANNs poor data mining tools: excessive training times and incomprehensible learning. The proposed analytical model seeks to use AR complemented by ANNs to implement the best arrangement of shelf products, branch by branch, in order to use the cooperative result to make managerial decisions.
This research is undertaken to improve the following challenges of current sales optimization models: lack of analytics-based marketing programs, lack of business-driven analytic strategies and failure to leverage BI to become “matchmakers”. To our knowledge, not enough research has presented working examples and considered non-expert users in proposing models that are user-friendly to professional managers. Section 2.2 and Section 2.3 explain the building blocks of the analytic model where the processed data from different branches is entered.

2.2. Association Rules

AR mining is an unsupervised data mining method to find interesting associations in large sets of data items [25]. It was originally derived from point-of-sale data that describes which products are purchased simultaneously. AR discovers interesting associations that are often used by businesses such as retail enterprises for decision-making purposes; an example could be to find out which products are frequently purchased simultaneously by different customers [26]. It is one of the most common and widely used techniques in data mining, aimed at finding interesting relations [27,28] or correlations between large data items [29]. AR provides decision-makers at retail enterprises with marketing insights for cross-selling by providing information about product associations [30]. The most common AR algorithm used in market basket analysis is Apriori. However, the Apriori algorithm has an important drawback of generating numerous candidate item sets that must be repeatedly contrasted with the whole database [31]. We are going to use two measures to quantify the interestingness of a rule: support and confidence.

2.2.1. Support Value

Support determines how frequently a rule is contained in a given dataset. It is defined as the fraction of transactions that contains A B to the total number of transactions in the database [32] and this can be expressed as shown in Equation (1):
S u p p o r t ( A B ) = P ( A B ) = n ( A B ) N
If support (A B) is greater than or equal to the minimum support threshold (min_sup) then it is a frequent item set. An item set is frequent if support (A⇒B) ≥ min_sup().

2.2.2. Confidence Value

Confidence is the ratio of the number of transactions containing A and B to the number of transactions containing A, and can be further expressed as shown in Equation (2):
C o n f i d e n c e ( A B ) = P ( B / A ) = n ( A B ) n ( A )
If confidence (A B) is greater than or equal to the minimum confidence (min_con) then we are confident about the rule generated.
Furthermore, rules that satisfy both the minimum support threshold (min_sup) and the minimum confidence threshold (min_con) are called strong AR. A rule is strong if support (A⇒B) ≥ min_sup ˄ confidence (A⇒B) ≥ min_con. These two measures are used as inputs in the ANN technique.

2.3. Artificial Neural Networks

ANNs simulate the behavior of biological systems and are used to discover patterns and relationships. They are useful for studying complex relationships between input and output variables in a system [33]. The main advantage of an ANN is the ability to extract patterns and detect trends that are too complex to be noticed by other computer techniques or humans [34]. In [35], the research done shows that ANNs are now commonly used to solve data mining problems because of the following advantages: robustness, self-organizing adaptiveness, parallel processing, distributed storage and a high degree of fault tolerance. The ANN sums the inputs xi against corresponding weights wi and compares the ANN output to the threshold value, Ө. The threshold is determined by the inputs used. Let X be the net weighted input of the neuron, as shown in Equation (3). The decision of X is for discrete cases since it takes only certain values:
X = i = 1 n x i w i
where xi is the input signal, wi is the weight of input and n is the number of neurons.
If the net input is less than the threshold, the neuron output is −1; if the net input is greater than or equal to the threshold then the neuron is activated and the output attains a +1.
Let Y be the ANN output. The decision of Y is for continuous cases, since it can take any values in the range. The actual output of the neuron with the sigmoid activation function is expressed as shown in Equation (4):
Y = 1 1 + e x

3. Proposed Methodology for Sustainable Business Enterprises

3.1. Proposed System Model for Distributed Retail Enterprises

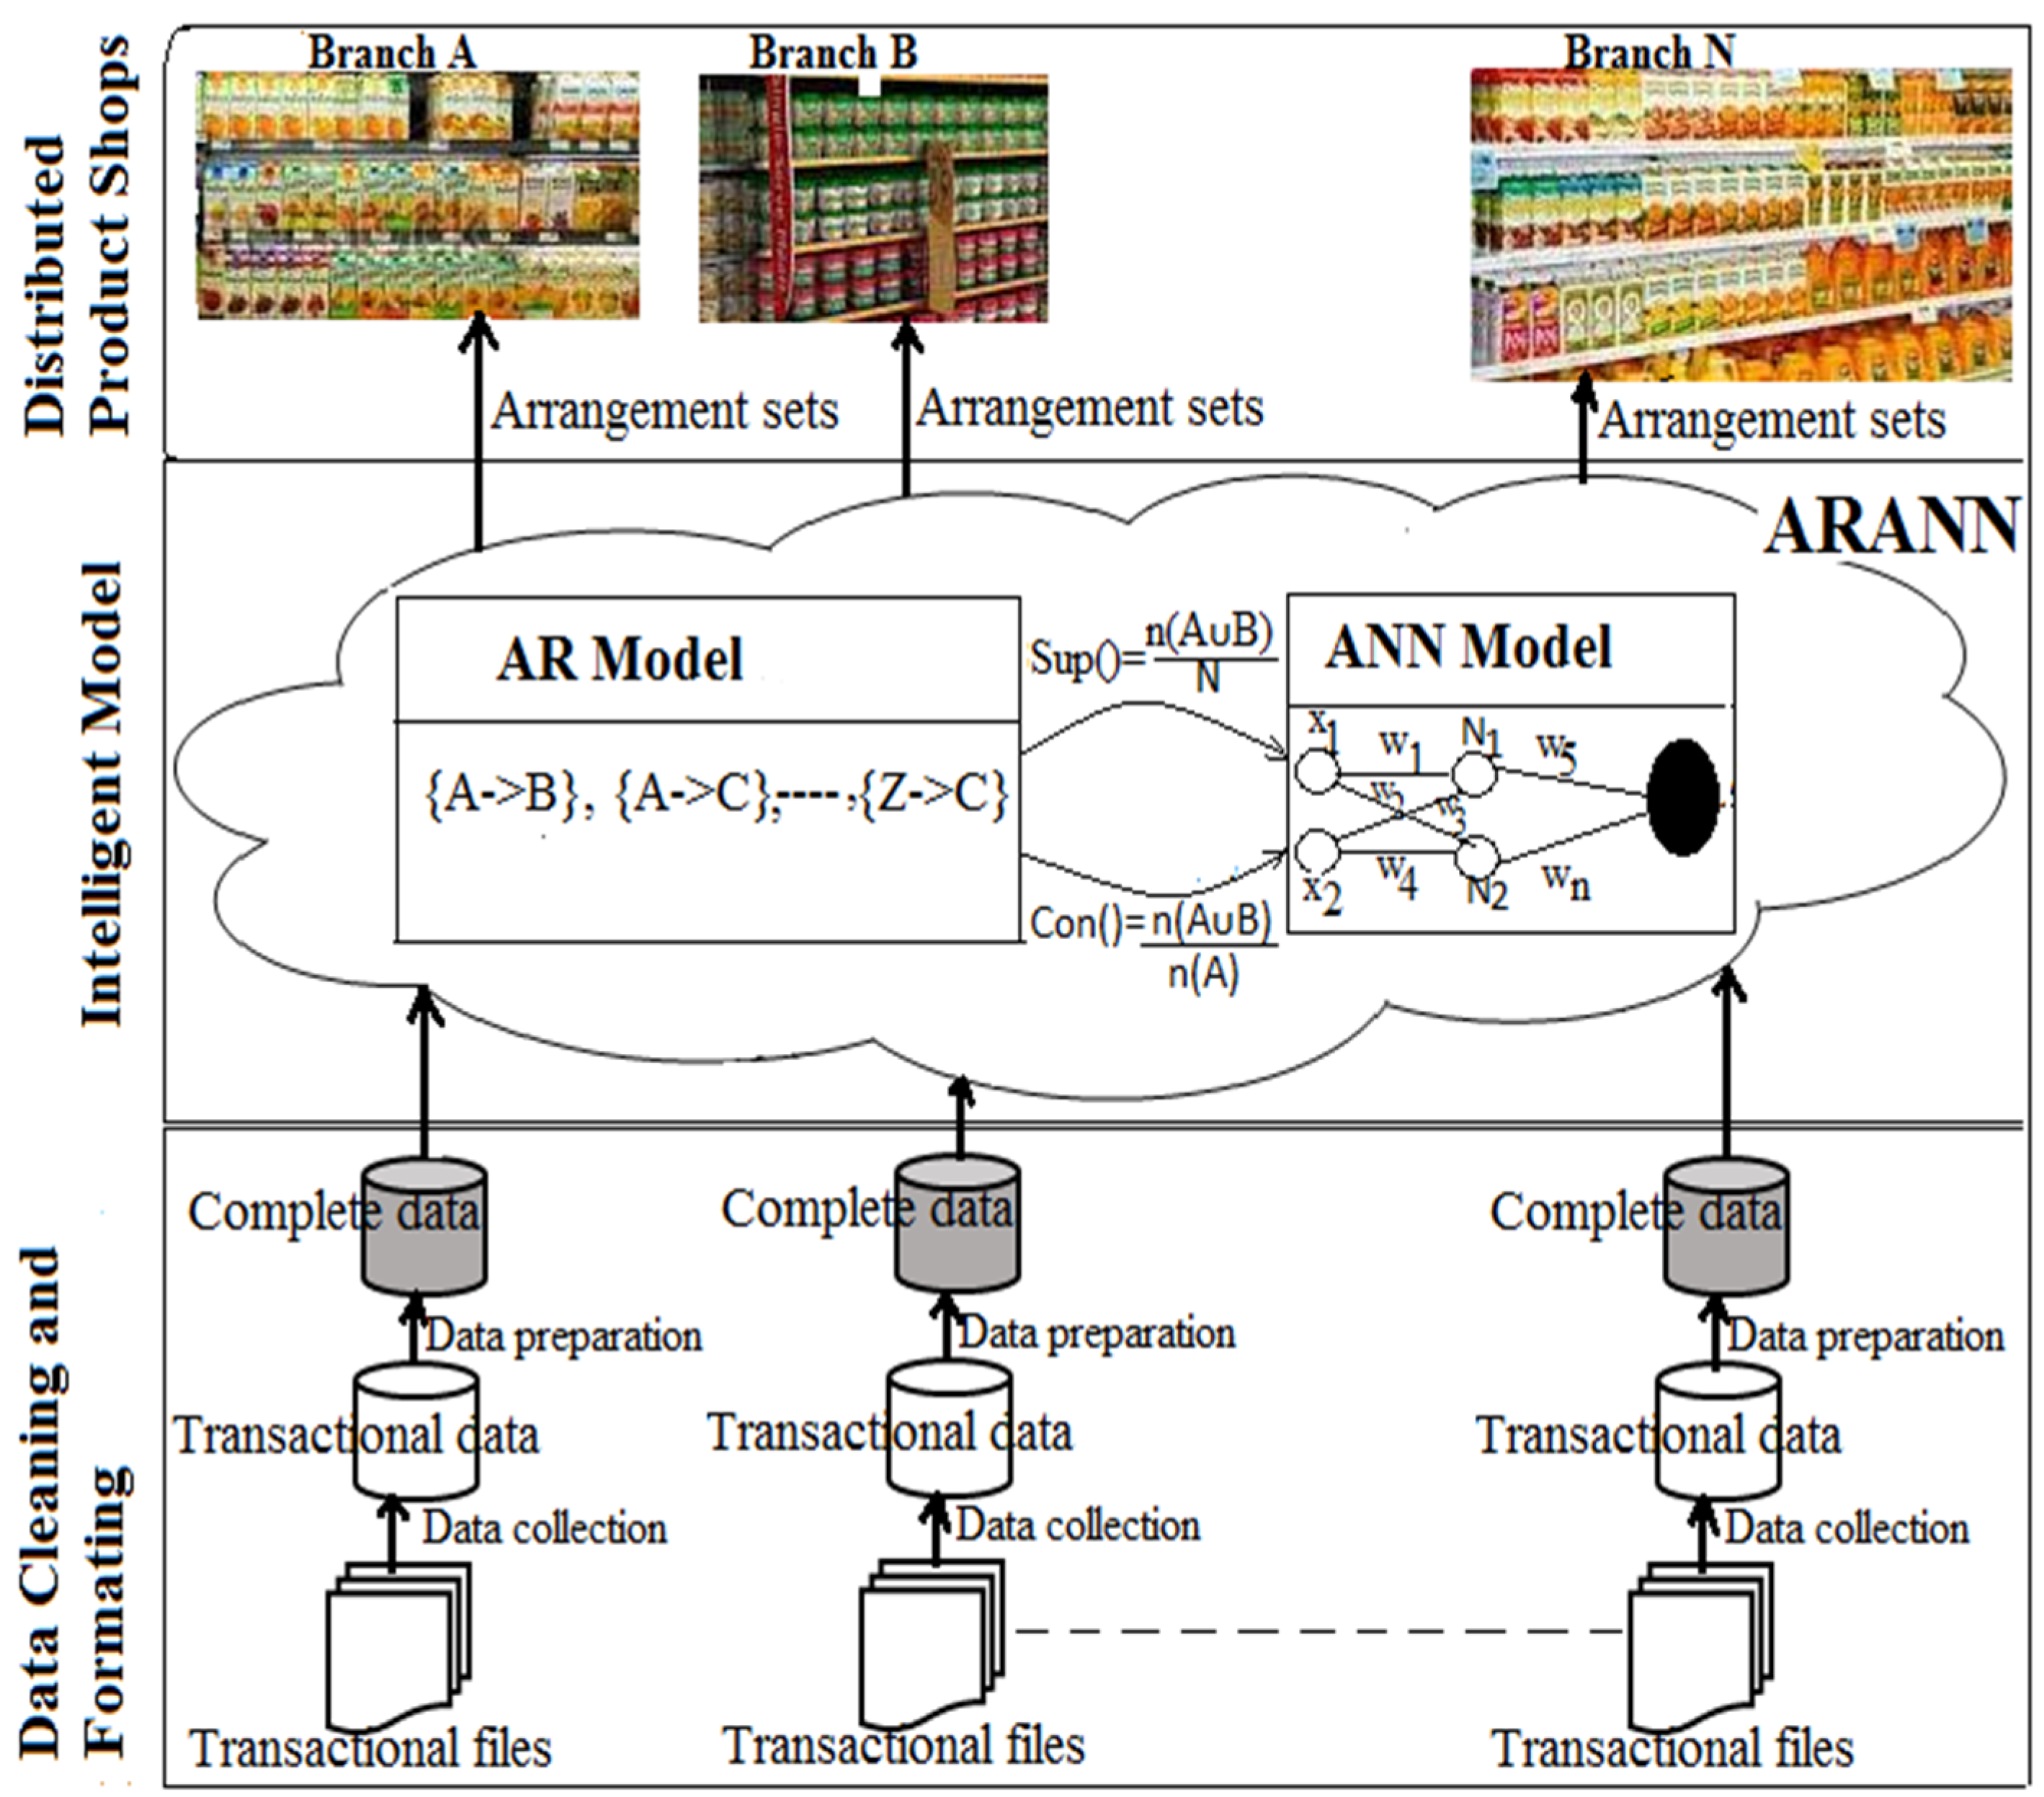
This section explores the proposed system model for BI analytics in distributed retail enterprises. The proposed model has three layers, namely data cleaning and formatting, intelligent model and distributed product shops, as shown in Figure 3. The data cleaning and formatting layer is found at the bottom of the proposed model. In this proposed model, data is collected from transactional systems branch per branch. The data is cleaned and formatted to the appropriate file type accepted by the proposed model. Processed data is input into the ARANN model branch per branch at the middle layer of the analytical model. The ARANN model cooperatively works between AR and ANN. Processed data from the bottom layer is passed into the AR model and it outputs confidence and support values. These values are passed into the ANN model as inputs in order to get the degree of belief (DoB). The DoB of sets generated is compared to the ARANN activations set. The accepted sets generated are applied on the top layer of the proposed model. This proposed model is deployed to each branch and patterns are generated independently. The choice is left for every retail enterprise branch to adopt the best results, depending on the market competitiveness and profit levels.
Figure 3. Proposed intelligent analytics-based framework.
Sustainability 08 00140 g003
The proposed intelligent analytics-based framework has the following benefits: reduction in risk of passing misleading results to all branches, no one point of failure, consumption of fewer resources, faster construction of distributed systems and no need for data integration.
This proposed analytics-based model can be implemented using the pseudo-code presented in Table 1. Table 1 shows how ARANN generates product arrangement sets that can be used by retail enterprise managers to arrange products on shop shelves so as to attract customers to purchase more products than planned. The pseudo-code is further presented mathematically, as shown in Equations (5)–(14).
Table 1. Pseudo-code for ARANN model.
Pseudo-code
StepsInput:  Transactional data in database (D) = {t1, t2, t3, .., tn}
     Support ()
     Confidence ()
     Weights (W) = {w1, w2, w3, .., wn}
Output:  Products pattern
Step 1: D = {t1, t2, t3, .., tn} //Transactions in the database
Step 2: Ck = Candidate item set of size k
Step 3: Fk = frequent item set of size k
{
   for (k =1; Fk != Ø; k++) // Fk is not equal to empty set.
  {
    Scan the entire D to generate candidate sets Ck
    {
    Compare candidate support count from Ck with the minimum support count to generate Fk
    }
  }
Step 4: Generate Support () & Confidence ()
  {
  Step 5: Input Support () & Confidence () into Neuron 1 (N1) and Neuron 2 (N2) as inputs
  Step 6: Generate N1 by summing of the inputs with the corresponding weights and apply the output into sigmoid function
  Step 7: Generate N2 by summing of the inputs with the corresponding weights and apply the output into sigmoid function
  Step 8: Generate the summation of N1 & N2 after the sigmoid function and apply the output into sigmoid function to obtain Degree of Belief (DoB)
  Step 9: Display products pattern where DoB ≥ ARANN activation
  }
}
Mathematical description for the ARANN Model
S u p p o r t   ( S u p ) = n ( A u B ) N
C o n f i d e n c e   ( C o n ) = n ( A u B ) n ( A )
The sup and con values feed the N1 as the inputs and are multiplied with the corresponding weights.
N 1 = S u p W 1 + C o n W 3
The output of N1 after the sigmoid function
O 2 =   1 1 + e N 2
The sup and con values feed the N2 as the inputs and are multiplied with the corresponding weights:
N 2 = C o n W 4 +   S u p W 2
The output of N2 after the sigmoid function
O 2 =   1 1 + e N 2
F = W 5 O 1 + W 6 O 2
= W 5 1 + e N 2 + W 6 1 +   e N 2
D e g r e e   o f   B e l i e f   ( D o B ) =   1 1 + e F
Product Patterns = { A c c e p t e d   , i f D o B A R A N N a c t i v a t i o n Re  j e c t e d   , i f o t h e r w i s e
where N1 and N2 are Neuron 1 and 2 respectively; W1, W2, W3, W4, W5 and W6 are the corresponding weights; O1 is Neuron 1 output after sigmoid function; O2 is Neuron 2 output after sigmoid function, F is input to final Neuron and ARANN activation is the threshold value set.

3.2. Evaluation Mechanism

The purpose of model evaluation is to assess the performance of the models so as to identify the best-performing model. To test the performance of the models, three sets were used. The confusion matrix shown in Table 2 was used to represent actual values and predictions.
Table 2. Confusion matrix. Adapted from [36].
Predicted
Actual TrueFalse
Trueab
Falsecd
Error Rate = b + c a + b + c + d
where a is the number of sets predicted true when they are true, b is the number of sets predicted false when they are true, c is the number of sets predicted true when they are false and d is the number of sets predicted false when they are false. Error rate is then defined as shown in Equation (15).

3.3. Scenario—Arrangement of Products on Shelves for Distributed Retail Branches

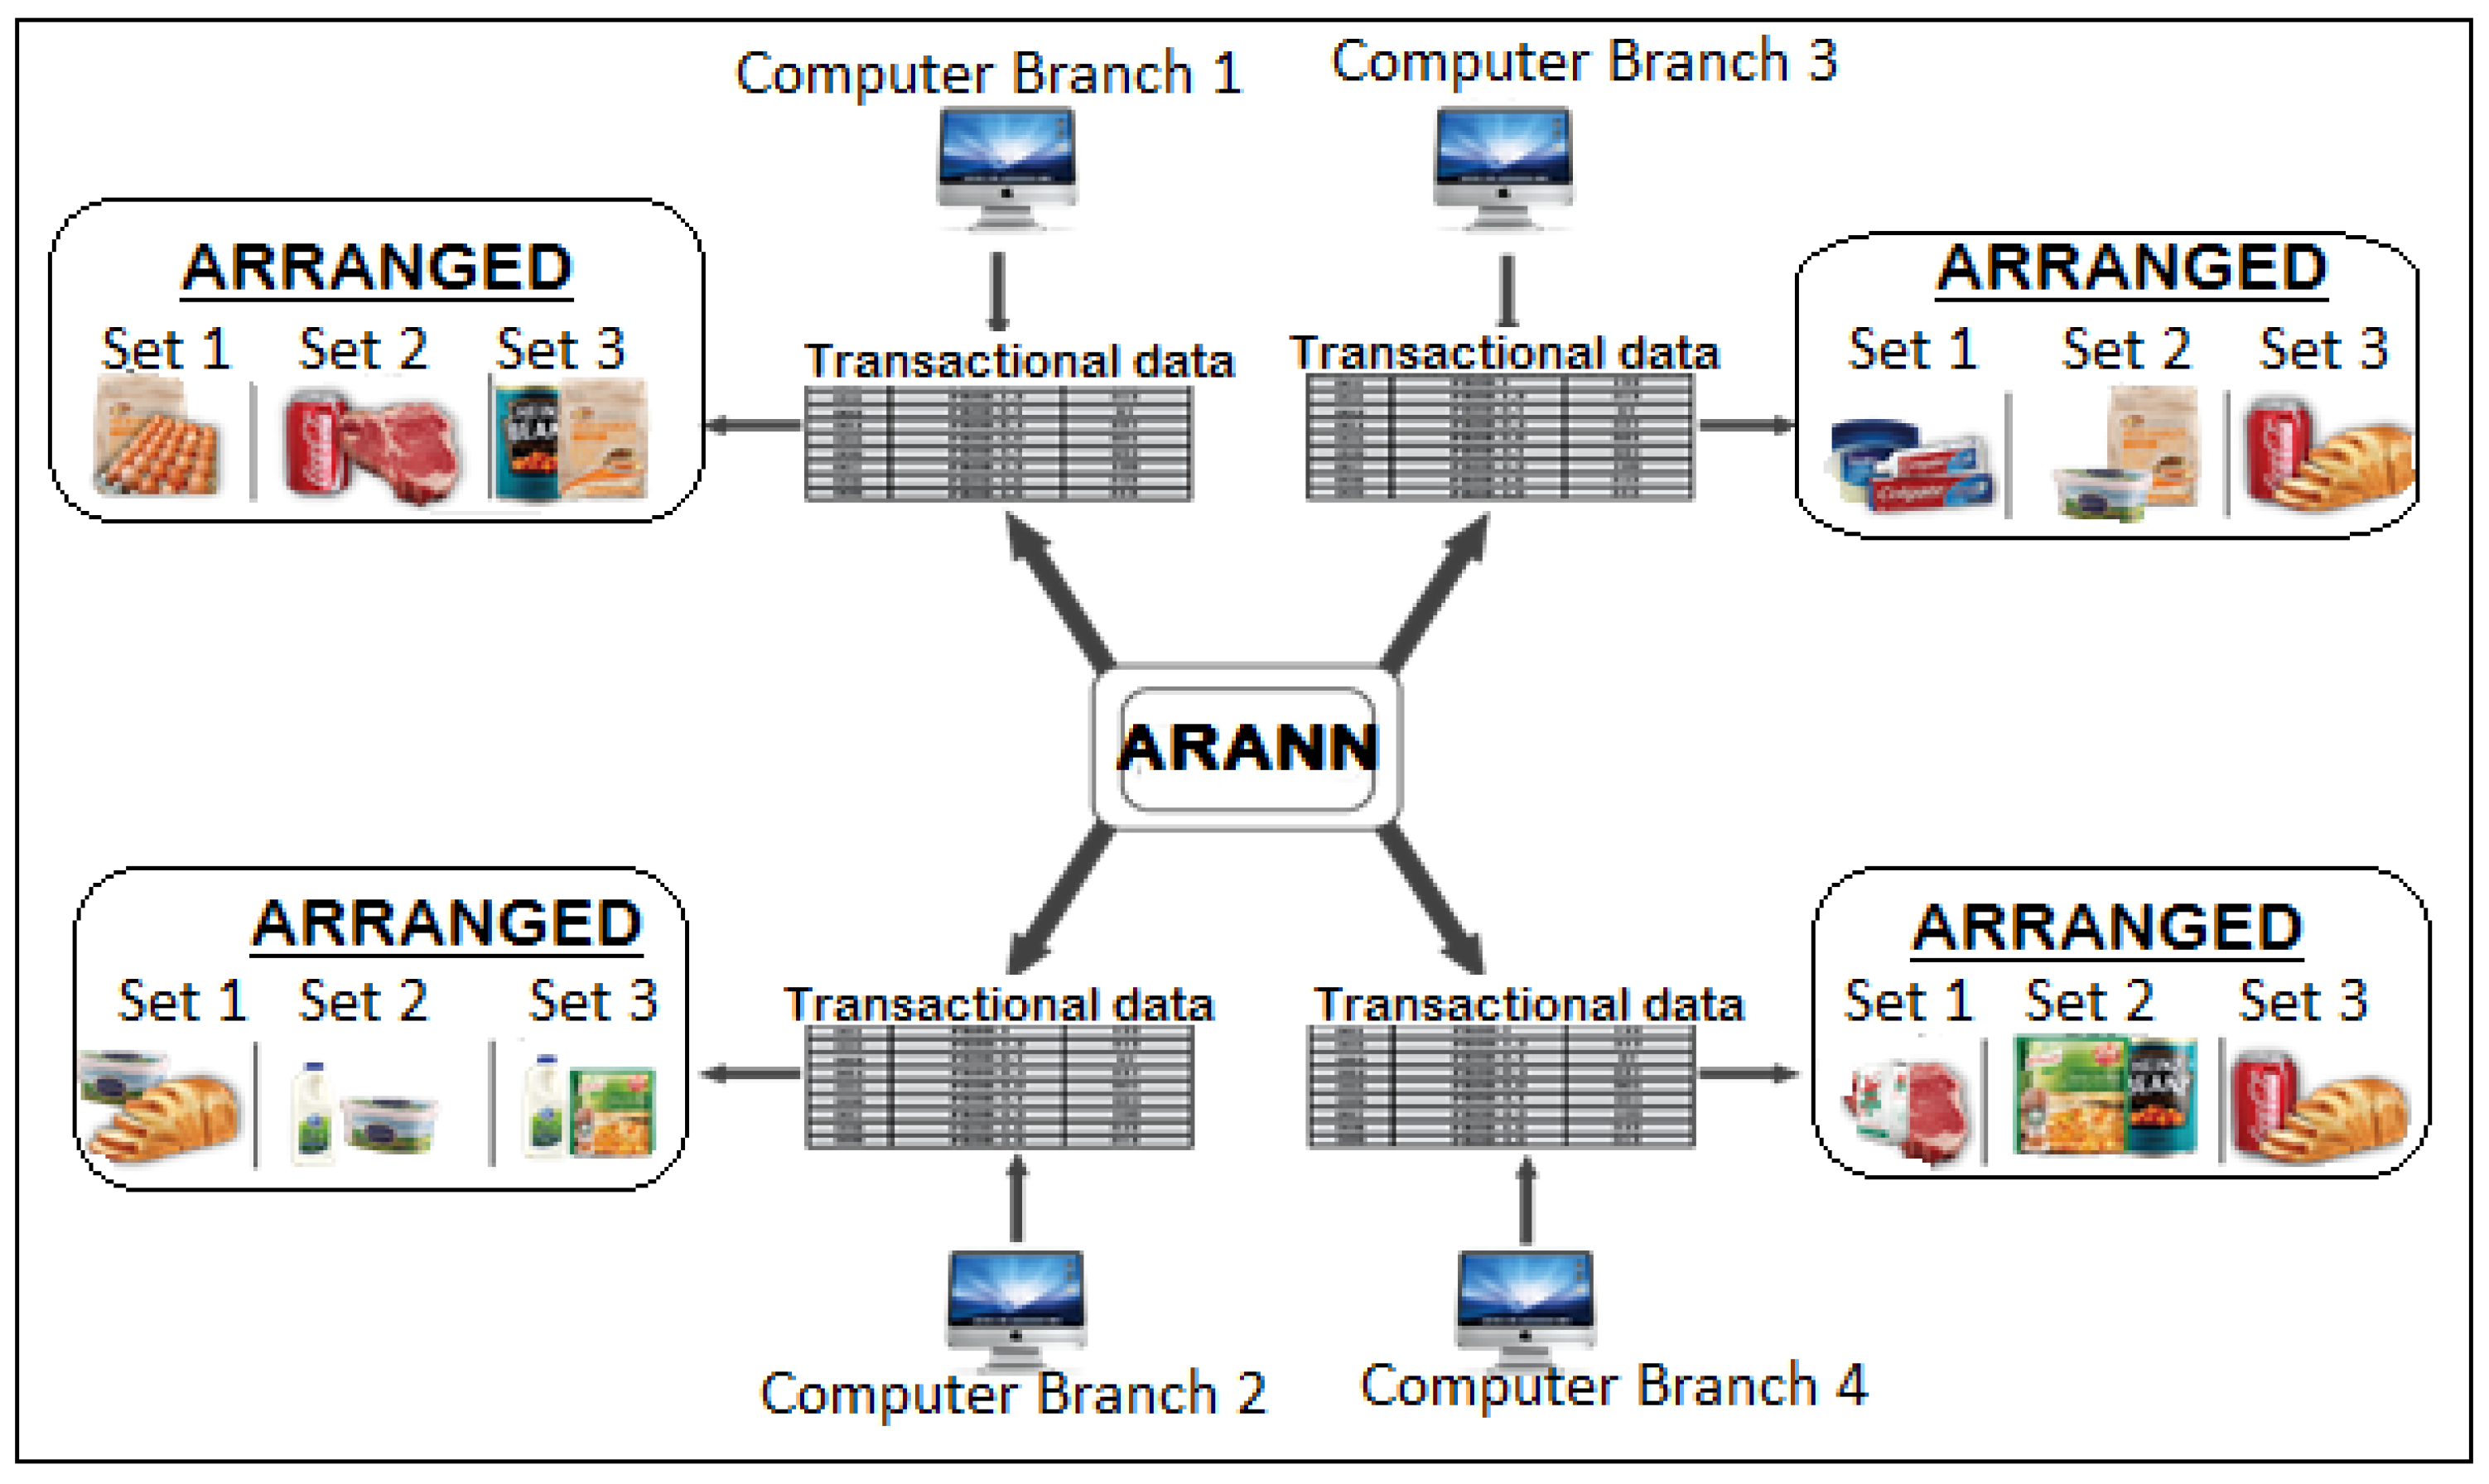
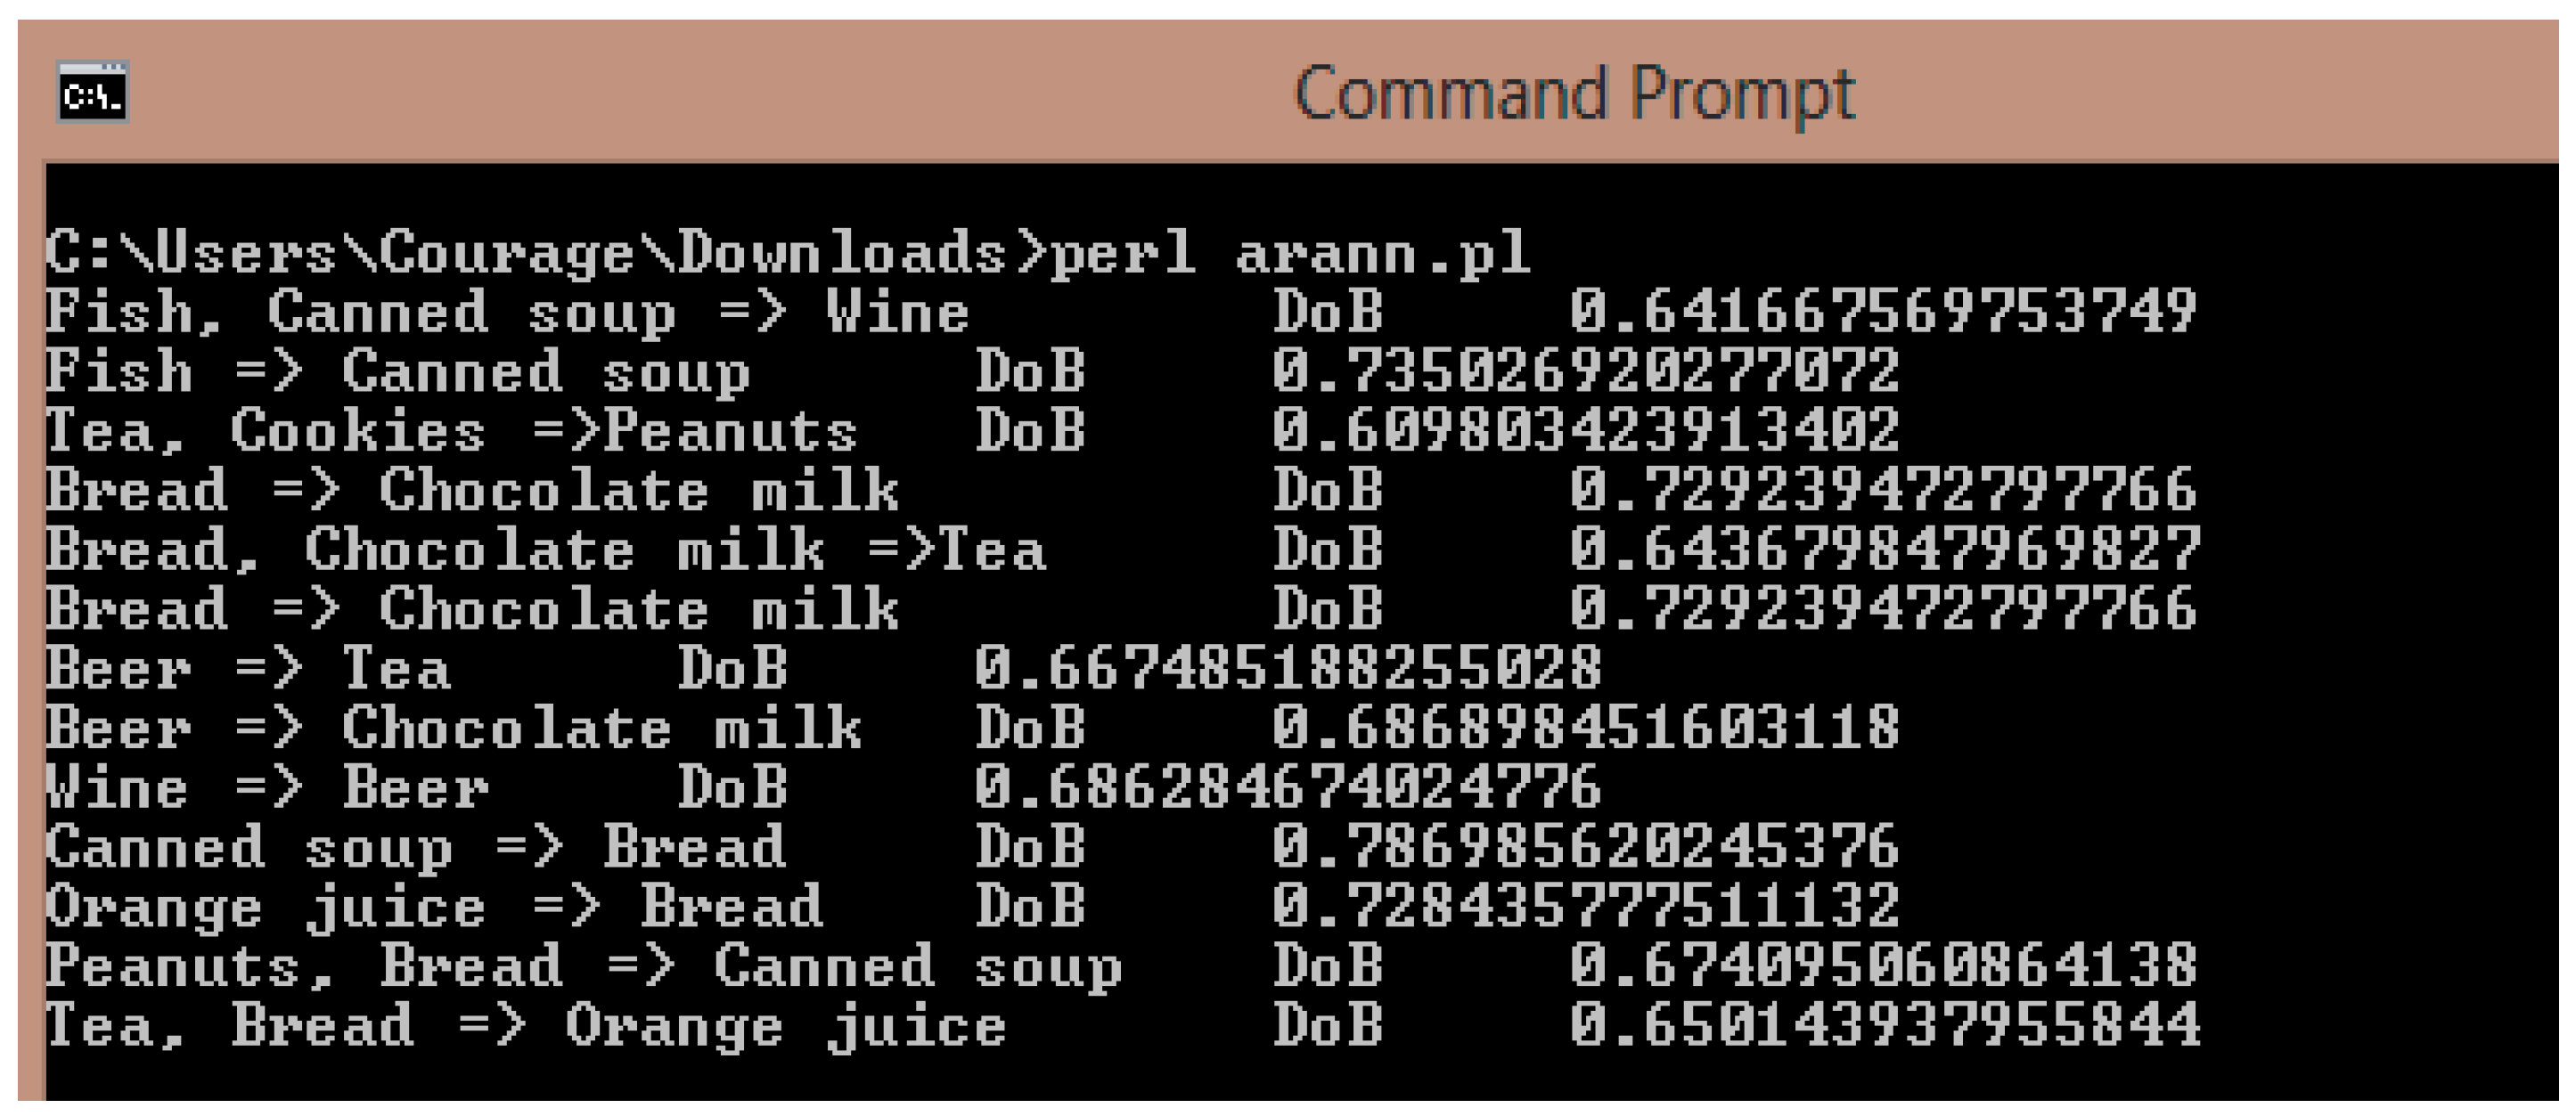
Figure 4 shows a scenario of how the analytical model displays placement results in distributed branches. Transactional data from each retail branch is loaded into the ARANN model to determine the arrangement sets.
Figure 4. Intelligent Analytics-based Model for Four Branches.
Sustainability 08 00140 g004
Table 3. Market basket transactional data for branch 3 of a retail enterprise.
Market-basket Transaction Data—Branch 3
TIDITEMS
T300Colgate, Vaseline, Geisha, Margarine, Bread
T301Margarine, Bread, Coke, Colgate, Vaseline
T302Coke, Colgate, Chocolate, Bread, Sweets, Margarine
T303Geisha, Colgate, Chocolate, Towel, Vaseline, Sweets
T304Colgate, Vaseline, Sweets, Chocolate, Bread, Margarine, Coke
Even weights were applied to each corresponding input to avoid bias on products. This was obtained by dividing the count of a_union_b over a number of records within the data set, where a, and b are different products. The following ARANN activation was used:
  • >= 0.75 strongly connected products (strongly accepted)
  • >= 0.65 moderately connected products (accepted)
  • < 0.65 weakly connected products (rejected)
Analysis of ARANN on Table 3
{Colgate, Vaseline} => {Bread}
Support = n ( A B ) N = 3 5 = 0.6     Confidence = n ( A B ) n ( A ) = 3 4 = 0.75
N1   = Supw1 + Conw3       N2       = Conw4 + Supw2
  = (0.6 × 0.6) + (0.75 × 0.6)           = (0.75 × 0.6) + (0.6×0.6)
  = 0.81                    = 0.81
O1   = 1 1 + e N 1 = 1 1 + e 0.81 = 0.69   O2      = 1 1 + e N 2 = 1 1 + e 0.81 = 0.69
F  = w5O1 + w6O2
    = (0.6 × 0.69) + (0.6 × 0.69) = 0.83
DoB = 1 1 + e F = 1 1 + e 0.83 = 0.70
Product pattern => 0.70 >= 0.65
Therefore it is moderately connected and is accepted.
{Coke} => {Bread}
Support = 3 5 = 0.6           Confidence = 3 3 = 1.0
N1   = (0.6 × 0.6) + (1.0 × 0.6)    N2       = (1.0 × 0.6) + (0.6 × 0.6)
  = 0.96                  = 0.96
01 = 1 1 + e 0.96 = 0.72        O2       = 1 1 + e 0.4 = 0.72
F  = w5O1 + w6O2
    = (0.6 × 0.72) + (0.6 × 0.72) = 0.86
DoB = 1 1 + e 86 = 0.70
Product pattern => 0.70 >= 0.65
Therefore it is moderately connected and is accepted.
Table 4. Market basket transactional data for branch 4 of a retail enterprise.
Market-basket Transaction Data—Branch 4
TIDITEMS
T400Maize meal, Beef, Fish, Cooking oil, Soups, Bread, Coke
T401Cooking oil, Beans, Beef, Soups, Maize meal
T402Rice, Fish, Soups, Cooking oil, Bread
T403Fruits, Coke, Bread, Milk, Chocolate, Soups
T404Bread, Beef, Fruit, Coke, Sweets, Maize meal
Analysis of ARANN on Table 4
{Maize meal} => {Beef}
Support = 3 5 = 0.6         Confidence = 3 3 = 1.0
N1   = (0.6 × 0.6) + (1.0 × 0.6)     N2       = (1.0 × 0.6) + (0.6 × 0.6)
  = 0.96                   = 0.96
01 = 1 1 + e 0.96 = 0.72         O2       = 1 1 + e 0.4 = 0.72
F  = w5O1 + w6O2
    = (0.6 × 0.72) + (0.6 × 0.72) = 0.86
DoB = 1 1 + e 86 = 0.70
Product pattern => 0.70 >= 0.65
Therefore it is moderately connected and is accepted.
{Chocolate} => {Towel}
Support = 1 5 = 0.20            Confidence = 1 3 = 0.33
N1    = (0.20 × 0.20) + (0.33 × 0.20)    N2     = (0.33 × 0.20) + (0.20 × 0.20)
      = 0.11                    = 0.11
O1   = 1 1 + e 0.11 = 0.53          O2     = 1 1 + e 0.11 = 0.53
F     = (0.2 × 0.53) + (0.2 × 0.53) = 0.212
DoB = 1 1 + e 0.212 = 0.55
Product pattern => 0.55 < 0.65
Therefore it is weakly connected and is rejected.

4. Experimental Evaluations: Results and Discussions

4.1. Experimental Setup

Real-life data was collected from a retail enterprise situated in South Africa with several branches nationwide. The data for the experiments was collected from only eight branches within different demographics of a developing country. The retail enterprise has database servers at each branch for the storage of data. Real-life datasets consisting of 66 records were taken from each branch, to be used for running experiments. In the experiment, the 11 most frequently purchased products were considered. This data was collected for research purposes. The data was then exported to notepad application for storage. Each row in Table 5, Table 6 and Table 7 represents a transaction performed by the customer. Table 5 and Table 6 show samples of real-life data from different branches.
In the public dataset 1000 transactions were used. This data set was randomly broken up into five chunks representing branches and the records for each branch contained 200 transactions. The data was saved in .txt format. The public data set in Table 7 is found in [37]. The data contains the following products: bread, beer, tea, wine, orange juice, chocolate milk and canned soup.
Table 5. Sample of real-life data for branch 1.
Body lotionColgateRiceMaize meal
MeatRiceRoll onCooking oilBody lotion
------
DrinkRoll onMinceCokeColgatePerfume
Table 6. Sample of real-life data for branch 2.
BreadSugarRiceMeatSaltCooking oilFlourSoup
--------
FruitsSugarMeatCooking oilSaltSoapBread
Table 7. Sample of public data [37].
FishOrange juiceTeaWinePeanutsCanned soupBreadBeer
--------
CookiesFishOrange juiceTeaWinePeanutsCanned soupChocolate milk
Perl programming language was used to implement the ARANN model. Notepad was used as the text editor and results were displayed through the command prompt. Figure 5 and Figure 6 show sample sets generated by the ARANN model using a real life dataset and public dataset respectively.
Figure 5. ARANN rules on real-life data.
Sustainability 08 00140 g005
Figure 6. ARANN rules on public dataset.
Sustainability 08 00140 g006

4.2. Experiment 1: Observations of ARANN with Varying Activation in Distributed Analytics

In this experiment, Equation (14) was used to determine the decisions to be applied to Table 8, Table 9, Table 10 and Table 11 of the analytical model. This analytical model accepts product patterns defined in Equation (14) and uses the following ARANN activations: DoB < 60%, 60% >= DoB < 70% and DoB >= 70%. The analytical model rejects arrangement sets where the DoB is less than 60% and accepts arrangement sets between 60% and 69%, while those with a DoB greater or equal to 70% are strongly accepted. To make the decision, ARANN compares the DoB value generated with the ARANN activations and a decision is made. Managers use the decision to determine how products are to be arranged in each branch.
Table 8. Real-life ARANN results for branch 1.
Dataset Branch 1Patterns GeneratedDoBARANN Cooperative Decision with
60 >= DoB < 70DoB >= 70
Roll on, perfume => Colgate0.71N/AStrongly accepted
Colgate, Body lotion => roll-on0.69AcceptedN/A
Colgate => Body lotion0.71N/AStrongly accepted
Bread, Milk => Eggs0.70N/AStrongly accepted
Rice, Maize meal => soup0.62AcceptedN/A
Bread => Drink0.79N/AStrongly accepted
Bread => Sugar0.76N/AStrongly accepted
Using ARANN activation of DoB >= 70, the following sets from Table 8 are strongly accepted: {Roll-on, Perfume => Colgate}, {Colgate => Body lotion}, {Bread => Drink} and {Bread => Sugar}; these are strongly connected products. Using ARANN activation of 60 >= DoB < 70, the following examples of sets from Table 8 are accepted: {Colgate, Body lotion => Roll on}, {Rice, Maize meal => Soup} and {Rice => Soup}; these are moderately connected products. The choice is left to every retail enterprise to adopt either moderately or strongly connected products, depending on the market competitiveness and profit levels. Note that the analytical model rejects the sets with DoB < 60 (i.e., weakly connected products), which are not included. One can see in Table 8 of branch 1 that the “strongly accepted” products at higher activation implies that some specific toiletry products are strongly connected, while bakery products and refreshments are strongly connected at this branch.
Table 9. Real-life ARANN results for branch 2.
Dataset Branch 1Patterns GeneratedDoBARANN Cooperative Decision with
60 >= DoB < 70DoB >= 70
Meat, Salt => Cooking_oil0.64AcceptedN/A
Meat => Salt0.71N/AStrongly Accepted
Bread, rice => Eggs0.66AcceptedN/A
Bread => Lotion0.65AcceptedN/A
Bread => Eggs0.65AcceptedN/A
Applying ARANN activation of DoB >= 70, the following “strongly accepted” set is generated; {Meat => Salt}; these are strongly connected products. When ARANN activation of 60 >= DoB < 70 is used, the following examples of sets are accepted in Table 9: {Meat, Salt => Cooking oil}, {Bread, Rice => Eggs} and {Bread => Eggs}; these are moderately connected products. It is up to the retail enterprise’s decision-makers to adopt either moderately or strongly connected products, depending on the market competitiveness and profit levels. On the other side, the analytical model rejects the sets with DoB < 60 (i.e., weakly connected products), which are not included. It can be seen in Table 9 of branch 2 that the “strongly accepted” products at higher activation implies that some specific meat products are strongly connected with salt products at this branch.
Table 10. Public DATA ARANN results for branch 3.
Dataset Branch 1Patterns GeneratedDoBARANN Cooperative Decision with
60 >= DoB < 70DoB >= 70
Fish, Canned soup => Wine0.64AcceptedN/A
Fish => Canned soup0.74N/AStrongly Accepted
Tea, Cookies => Peanuts0.61AcceptedN/A
Bread => Chocolate milk0.73N/AStrongly accepted
Bread, Chocolate milk => Tea0.64AcceptedN/A
Beer => Tea0.67AcceptedN/A
Beer => Chocolate milk0.69AcceptedN/A
Wine => Beer0.69AcceptedN/A
Canned soup => Bread0.79N/AStrongly Accepted
Orange juice => Bread0.73N/AStrongly Accepted
Peanuts, Bread => Canned soup 0.67AcceptedN/A
Tea, Bread => Orange juice0.65AcceptedN/A
When ARANN activation of DoB >= 70 is applied, the following “strongly accepted” sets from Table 10 are generated: {Fish => Canned soup}, {Bread => Chocolate milk} and {Canned soup => Bread}; these products are strongly connected. Using ARANN activation of 60 >= DoB < 70, the following are examples of “accepted” sets that are generated in Table 10: {Fish, Canned soup => Wine}, {Tea, Cookies => Peanuts} and {Wine => Beer}; these are moderately connected products. Every retail enterprise is left with the choice to adopt either moderately or strongly connected products, depending on the market competitiveness and profit levels. Note that the analytical model rejects the sets with DoB < 60 (i.e., weakly connected products), which are not included. In Table 10 of branch 3, one can see that the “accepted” product sets at moderate activation implies that some specific beverages are moderately connected at this branch.
Table 11. Public data ARANN results for branch 4.
Dataset Branch 1Patterns GeneratedDoBARANN Cooperative Decision with
60 >= DoB < 70DoB >= 70
Fish, Canned soup => Wine0.64AcceptedN/A
Fish => Canned soup0.74N/AStrongly Accepted
Tea, Cookies => Peanuts0.61AcceptedN/A
Bread => Chocolate milk0.72N/AStrongly Accepted
Bread, Chocolate milk => Tea0.66AcceptedN/A
Beer => Tea0.67AcceptedN/A
Beer => Chocolate milk0.67AcceptedN/A
Wine => Beer0.70N/AStrongly accepted
Canned soup => Bread0.80N/AStrongly accepted
Orange juice => Bread0.73N/AStrongly accepted
Peanuts, Bread => Canned soup0.68AcceptedN/A
Tea, Bread => Orange juice0.67AcceptedN/A
In Table 11 the following “strongly accepted” sets were generated using ARANN activation of DoB >= 70: {Bread => Chocolate milk} and {Fish => Canned soup}, which are strongly connected products. Using ARANN activation of 60 >= DoB < 70, the following example of sets from Table 11 were accepted: {Fish, Canned soup => Wine}, {Orange juice => Bread} and {Tea, Bread => Orange juice}, which are moderately connected products. The decision-makers of every retail enterprise are left with the choice to adopt either moderately or strongly connected products, depending on the market competitiveness and profit levels. Note that the analytical model rejects the sets with DoB < 60 (i.e., weakly connected products), which are not included. In Table 11 of branch 4 one can see that the “strongly accepted” product sets at higher activation implies that some specific bakery products are strongly connected with dairy products at this branch.

4.3 Experiment 2: Performance Evaluations of ARANN in Comparison with Classical Methods

Table 12 shows the error rate of the individual AR and ANN techniques against the analytical model. Equation (15) is used to determine the error rate of each technique. The column “No. of patterns” indicates the number of sets evaluated. The column “Correctly classified sets” is composed of sets the analytical model predicted as true when they were actually true (a) and sets predicted as false when they were actually false (d), as shown in Table 2. The column “Incorrectly classified sets” is composed of sets the analytical model predicted as false when they were actually true (b) and sets predicted as true when they were false (c). Randomly generated sets were used to evaluate the performance of the three models. For example, in Branch 1 (real life), 10 rules where used in AR: five rules were predicted as true when they were actually true (a); two were predicted as false when actually false (d); three were predicted as true when actually false (c) and 0 were predicted as false when actually true (b). From the results displayed in Table 12, it is clear that the analytical model (ARANN) has a lower error rate compared to the individual classical methods.
Table 12. Quantitative evaluations of the cooperative model in distributed branches.
DatasetAlgorithmsNo. of PatternsCorrectly Classifies sets (a, d)Incorrectly Classified sets (b, c)Error Rate
Real life Branch 1 (66 Records)AR107330%
ANN106440%
ARANN65117%
Branch 2 (66 Records)AR108220%
ANN108220%
ARANN76114%
Public Branch 3 (200 Records)AR108220%
ANN106440%
ARANN65117%
Branch 4 (200 Records)AR108220%
ANN107330%
ARANN86225%

4.4 Experiment 3: Comparing Performance of Distributed and Centralized Retail Analytics

This research compares the performance of the analytical model in a distributed retail enterprise with a centralized retail enterprise. In the distributed retail enterprise, a computer was used to represent a branch and the time taken by the analytical model to generate arrangement patterns was observed. Figure 7a shows raw integration time. Figure 7b shows the time of response (ToR) taken by the analytical model to integrate a number of records from various workstations. Figure 7c shows the ToR taken by the analytical model to generate patterns in distributed and centralized retail enterprises. Figure 7d shows the ToR taken by the analytical model to generate product arrangement patterns across different data sizes.
Figure 7. Comparison of the performance of ARANN in distributed and centralized retail enterprises.
Sustainability 08 00140 g007
From the experiment conducted, it was observed that the analytical model performs faster in distributed retail enterprises than in centralized retail enterprises, as shown in Figure 7c. The analytical model takes more time to generate patterns in a centralized retail enterprise than in a distributed retail enterprise. The ToR to integrate data depends on the number of records being integrated. The more records, the more time is needed to integrate those records. This was observed in Figure 7b. In addition, the performance time taken by the analytical model depends on the size of the data set being used. The analytical model’s performance is affected by the size of the data set, as shown in Figure 7d.

5. Conclusions

In this paper, a sustainable model was proposed that can be used in distributed retail enterprises in an ever-changing economic environment to address the current laxity through the best arrangement of shelf products branch by branch. It can intelligently assist distributed retail enterprise management to arrange products optimally on shelves of shops so that customers will purchase more products than planned, in order to achieve an optimal profit level. The analytical model takes branch data and processes the data to determine the best ways of arranging items on the shelves of a retail enterprise branch by branch. It is built on AR, complemented by ANN.
The proposed analytical model for sustainable business in distributed retail enterprises was developed. A logical demonstration of working scenarios and experiments of the proposed analytical model for management practices in distributed retail enterprises was presented. This was done by inputting support and confidence values from the AR technique into the ANN technique in order to get DoB values of the analytical model. The analytical model accepts product patterns with a DoB greater than or equal to ARANN activation.
In the proposed analytical model performance evaluation experiment, ARANN proved to be better than the classical methods because of its lower error rate, implying improved confidence in the decision-making process in a competitive environment. To get the best results, the weights of the neurons need to be determined appropriately and the quality of data needs to be improved. The DoB values of the analytical model can sometimes be affected by the weights used.
It was observed that sets generated in a distributed retail enterprise portray the real purchasing habits of customers per branch better than in a centralized retail enterprise. In this research, real life datasets from eight branches of a retail enterprise and public datasets were used to conduct the experiments.
Observations of our distributed BI analytics model are: the proposed model retains complete control of product pattern generation, arrangement sets generated by the analytical model show a lower error rate (Table 12), they reveal the real buying habits of each branch, the model reduces the risk of passing misleading results to all branches (Table 8, Table 9, Table 10 and Table 11) and the software runs a single process; there is no need for data integration (Figure 3). In addition, the ARANN incorporates the strengths of the AR and ANN models, improves generation of product arrangement sets, has the ability to discover complex nonlinear associations discreetly among different products, effects a reduction in poor data quality problems and losses, as well as an improvement in the effectiveness of current product sales optimization models. Since sustainability in this context generally requires the ability of a business to sustain itself in times of crisis, similar to competitive markets, ARANN has been specifically designed for sustainable distributed and centralized retail enterprises.
In future, we wish to; (i) improve on ARANN performance by considering nature-inspired algorithms; (ii) investigate a standard method of selecting the threshold; and (iii) integrate a sophisticated learning algorithm into ARANN. The strategy and observations in this research are therefore good for addressing challenges in an ever-changing economic environment.

Acknowledgments

The authors gratefully acknowledge the financial support and resources made available by the University of South Africa, South Africa.

Author Contributions

All authors contributed equally to this article. They have read and approved the final manuscript.

Conflicts of Interest

The authors declare no conflict of interest.

References

  1. Trkman, P.; McCormack, K.; de Oliveira, M.P.V.; Ladeira, M.B. The Impact of Business Analytics on Supply Chain Performance. Decis. Support Syst. 2010, 49, 318–327. [Google Scholar] [CrossRef]
  2. Kohavi, R.; Rothleder, N.; Simoudis, E. Emerging Trends in Business Analytics. Commun. ACM 2002, 45, 45–48. [Google Scholar] [CrossRef]
  3. Velu, C.; Madnick, S.; van Alstyne, M. Centralizing Data Management with Considerations of Uncertainty and Information-Based Flexibility. J. Manag. Inf. Syst. 2013, 30, 179–212. [Google Scholar] [CrossRef]
  4. Abbas, W.; Ahmad, N.; Zaini, N. Discovering Purchasing Pattern of Sport Items Using Market Basket Analysis. In Proceedings of the 2013 International Conference on Advanced Computer Science Applications and Technologies (ACSAT), Kuching, Malaysia, 23–24 December 2013; pp. 120–125.
  5. Haug, A.; Zachariassen, F.; van Liempd, D. The Costs of Poor Data Quality. J. Ind. Eng. Manag. 2011, 4, 168–193. [Google Scholar] [CrossRef]
  6. Halford, Q.; Staff, S. Gap Cost Key Categories Billions. Furniture/Today, 3 September 2001; 14. [Google Scholar]
  7. Hungary retail sales down in June. Regional Today, 26 August 2013; 1.
  8. Data Quality. Controller’s Report; EBSCOhost: Ipswich, MA, United States, 2001; Volume 7, p. 7. [Google Scholar]
  9. Stoodley, N. Democratic Analytics: A Campaign to Bring Business Intelligence to the People. Bus. Intell. J. 2012, 17, 7–12. [Google Scholar]
  10. Briggs, L. Case Study. Bus. Intell. J. 2011, 16, 39–41. [Google Scholar]
  11. Aldosari, B.; Almodaifer, G.; Hafez, A.; Mathkour, H. Constrained Association Rules for Medical Data. J. Appl. Sci. 2012, 12, 1792–1800. [Google Scholar]
  12. Dimitrijević, M.; Bošnjak, Z.; Cohen, E. Web Usage Association Rule Mining System. Interdiscip. J. Inf. Knowl. Manag. 2011, 6, 137–150. [Google Scholar]
  13. Agrawal, R.; Imieliński, T.; Swami, A. Mining Association Rules between Sets of Items in Large Databases. In Proceedings of the 1993 ACM SIGMOD International Conference on Management of Data, Washington, DC, USA, 25–28 May 1993; pp. 207–216.
  14. Klemettinen, M.; Mannila, H.; Ronkainen, P.; Toivonen, H.; Verkamo, A.I. Finding Interesting Rules from Large Sets of Discovered Association Rules. In Proceedings of the Third International Conference on Information and Knowledge Management, Gaithersburg, MD, USA, 29 November–2 December 1994; pp. 401–407.
  15. Gosain, A.; Bhugra, M. A Comprehensive Survey of Association Rules on Quantitative Data in Data Mining. In Proceedings of the 2013 IEEE Conference on Information & Communication Technologies (ICT), JeJu Island, Korea, 11–12 April 2013; pp. 1003–1008.
  16. Xu, Y.; Li, Y. Generating Concise Association Rules. In Proceedings the Sixteenth ACM Conference on Information and Knowledge Management, Lisbon, Portugal, 6–10 November 2007; pp. 781–790.
  17. Ordonez, C. Association Rule Discovery with the Train and Test Approach for Heart Disease Prediction. Inf. Technol. Biomed. 2006, 10, 334–343. [Google Scholar] [CrossRef]
  18. Vornberger, O.; Thiesing, F.; Middleberg, U. Short Term Prediction of Sales in Supermarkets. In Neural Networks, Proceedings of the IEEE International Conference, Perth, WA, USA, 27 November–1 December 1995; pp. 1028–1031.
  19. Koç, A.; Yeniay, Ö. A Comparative Study of Artificial Neural Networks and Logistic Regression for Classification of Marketing Campaign Results. Math. Comput. Appl. 2013, 18, 392–398. [Google Scholar]
  20. Anbananthen, S.; Sainarayanan, G.; Chekima, A.; Teo, J. Data Mining using Artificial Neural Network Tree. In proceedings of the 1st International Conference on Computers, Communications and Signal Processing with Special Track on Biomedical Engineering (CCSP), Kuala Lumpur, Malaysia, 14–16 November 2005; pp. 160–164.
  21. Boone, D.; Roehm, M. Retail Segmentation using Artificial Neural Networks. Int. J. Res. Mark. 2002, 19, 287–301. [Google Scholar] [CrossRef]
  22. Cerny, P. Data Mining and Neural Networks from a Commercial Perspective. In Proceedings of the ORSNZ Conference Twenty Naught One, University of Canterbury, Christchurch, New Zealand, 30 November–1 December 2001.
  23. Arockiaraj, C. Applications of Neural Networks in Data Mining. Int. J. Eng. Sci. 2013, 3, 8–11. [Google Scholar]
  24. Craven, M.W.; Shavlik, J.W. Using Neural Networks for Data Mining. Future Gener. Comput. Syst. 1997, 13, 211–229. [Google Scholar] [CrossRef]
  25. Cios, K.; Pedrycz, W.; Swiniarski, R.; Kurgan, L. Data Mining a Knowledge Discovery; Springer: New York, NY, USA, 2007. [Google Scholar]
  26. Berry, M.; Linoff, G. Data Mining Techniques for Marketing, Sales, and Customer Relationship Management; Wiley: Indianapolis, IN, USA, 2004. [Google Scholar]
  27. Liu, H.; Su, B.; Zhang, B. The Application of Association Rules in Retail Marketing Mix. In Proceedings of the 2007 IEEE International Conference on Automation and Logistics, Jinan, China, 18–21 August 2007; pp. 2514–2517.
  28. Chen, M.; Chiu, A.; Chang, H. Mining Changes in Customer Behavior in Retail Marketing. Expert Syst. Appl. 2005, 28, 773–781. [Google Scholar] [CrossRef]
  29. Zhao, Y. R and Data Mining: Examples and Case Studies; Academic Press: New York, NY, USA, 2012. [Google Scholar]
  30. Ahn, K. Effective Product Assignment Based on Association Rule Mining in Retail. Expert Syst. Appl. 2012, 39, 12551–12556. [Google Scholar] [CrossRef]
  31. Dhanabhakyam, M.; Punithavalli, M. An Efficient Market Basket Analysis based on Adaptive Association Rule Mining with Faster Rule Generation Algorithm. SIJ Trans. Comput. Sci. Eng. Its Appl. 2013, 1, 105–110. [Google Scholar]
  32. Kotsiantis, S.; Kanellopoulos, D. Association Rules Mining: A Recent Overview. GESTS Int. Trans. Comput. Sci. Eng. 2006, 32, 71–82. [Google Scholar]
  33. Poh, H.; Jasic, T. Forecasting and Analysis of Marketing Data Using Neural Networks: A Case of Advertising and Promotion Impact. In Proceedings of the the 11th Conference on Artificial Intelligence for Applications, Los Angeles, CA, USA, 20–23 February 1995; pp. 224–230.
  34. Mistry, J.; Nelwamondo, F.; Marwala, T. Estimating Missing Data and Determining the Confidence of the Estimate Data. In Proceedings of the Seventh International Conference on Machine Learning and Applications ICMLA ’08, San Diego, CA, USA, 11–13 December 2008; pp. 752–755.
  35. Nirkhi, S. Potential Use of Artificial Neural Network in Data Mining. In Proceedings of the the 2nd International Conference on Computer and Automation Engineering (ICCAE), Singapore, 26–28 February 2010; pp. 339–343.
  36. Witten, I.; Frank, E.; Hall, M. Data Mining: Practical Machine Learning Tools and Techniques, 3rd ed.; Morgan Kaufmann: Amsterdam, The Netherlands, 2011; pp. 403–440. [Google Scholar]
  37. Informatics. Available online: http://www.informatics.buu.ac.th/~ureerat/321641/Weka/Data%20Sets/supermarket/supermarket_basket_transactions_2005.arff (accessed on 21 January 2014).

