Article

Experimental Investigation of Evaporation and Drainage in Wettable and Water-Repellent Sands

1
Department of Civil and Environmental Engineering, Yonsei University, Yonsei-ro 50, Seodaemun-gu, Seoul 120-749, Korea
2
Korea Institute of Civil Engineering and Building Technology, 283 Goyangdae-ro, Ilsanseo-gu, Goyang 411-712, Korea
*
Author to whom correspondence should be addressed.
Sustainability 2015, 7(5), 5648-5663; https://doi.org/10.3390/su7055648
Submission received: 25 February 2015 / Revised: 13 April 2015 / Accepted: 28 April 2015 / Published: 8 May 2015

Abstract

:
This study presents experimental results on evaporation and drainage in both wettable and water-repellent sands whose surface wettability was artificially modified by silanization. The 2D optical and 3D X-ray computed tomographic imaging was performed during evaporation and the water retention during cyclic drainage and infiltration was measured to assess effects of wettability and initial wetting conditions. The evaporation gradually induces its front at the early stage advance regardless of the wettability and sand types, while its rate becomes higher in water-repellent Ottawa sand than the wettable one. Jumunjin sand which has a smaller particle size and irregular particle shape than Ottawa sand exhibits a similar evaporation rate independent of wettability. Water-repellent sand can facilitate the evaporation when both wettable and water-repellent sands are naturally in contact with each other. The 3D X-ray imaging reveals that the hydraulically connected water films in wettable sands facilitate the propagation of the evaporation front into the soil such that the drying front deeply advances into the soil. For cyclic drainage-infiltration testing, the evolution of water retention is similar in both wettable and water-repellent sands when both are initially wet. However, when conditions are initially dry, water-repellent sands exhibit low residual saturation values. The experimental observations made from this study propose that the surface wettability may not be a sole factor while the degree of water-repellency, type of sands, and initial wetting condition are predominant when assessing evaporation and drainage behaviors.

1. Introduction

Non-wetting phenomena observed in soils originate from the effects of wildfire [1], precipitation of volatile and non-hydrocarbon components on soil particles [2,3], and organic substances produced from vegetation [4]. The hydrophobic nature of soils prevents water from permeating into the subsurface, resulting in substantial increases in hill slope runoff [5], soil erosion, and overflow unpredictability [6,7]. Petroleum operations on lands frequently cause non-wetting of soils on account of oil pollution by drilling, leakage from wellheads and pipelines, and overflow at gathering stations [8]. Water repellency in these cases causes retardation and uneven distribution of surface water infiltration, and preferential flow [9,10], which results in high spatial variability of saturation and an acceleration of water and solute transport [11], forming an unstable water front that is affected by the history of wetting and drying [12,13]. In addition, mineralization rates inside soil organic matter (SOM) are reduced under hydrophobic conditions inside SOM by diminishing liquid adsorption rates and increasing the resistance of SOM to microbial decomposition [14]. Water repellency also has undesirable impacts on agricultural activities and vegetation [15], resulting from reduced infiltration capacities and its influence on the fate of bacterial activities [16,17].
In addition to drainage and flow phenomena in soils, evaporative phenomena have also been extensively investigated. The dominant factors controlling evaporative phenomena include not only boundary conditions, such as temperature and external atmospheric and environmental conditions, but also moisture content, diffusivity, vapor pressure, geometrical features of pore structures, and other soil properties [18,19,20,21]. In particular, evaporation is facilitated by the interaction of a hydraulically connected liquid film with the atmosphere, as mediated by atmospheric conditions such as temperature, humidity, and air velocity at the evaporation surface. In soils, air invades mainly the large pores, while small pores tend to remain saturated, thus providing evaporation pathways [22]. Therefore, the physico-mechanical properties of soils with different surface wettabilities vary at macroscopic scales [23,24]. For instance, thermal and electrical conductivities in soils vary greatly, depending on the degree of saturation (=volume of water/volume of total pore space), the hydrophilic or hydrophobic nature of the soil, and the long range inter-connectivity of the water film [25]. In sands, the lowering of friction coefficients on the surfaces of hydrophobic particles results in low strength and stiffness of these sands [26]. In hydrophilic sands, capillarity among inter-particle contacts exerts maximum shear stiffness at 5%–10% saturation, whereas in hydrophobic sands, no such unique peak values of shear stiffness are observed [27]. With consideration of the distinct hydrologic and mechanical properties of water-repellent sands, we aim to experimentally explore detailed configuration of liquid phase and the drying rate resulted from evaporation as well as water retention during cyclic imbibition depending on the initial wetting condition in order to obtain a comprehensive understanding of surface wettability effects.

2. Materials and Methods
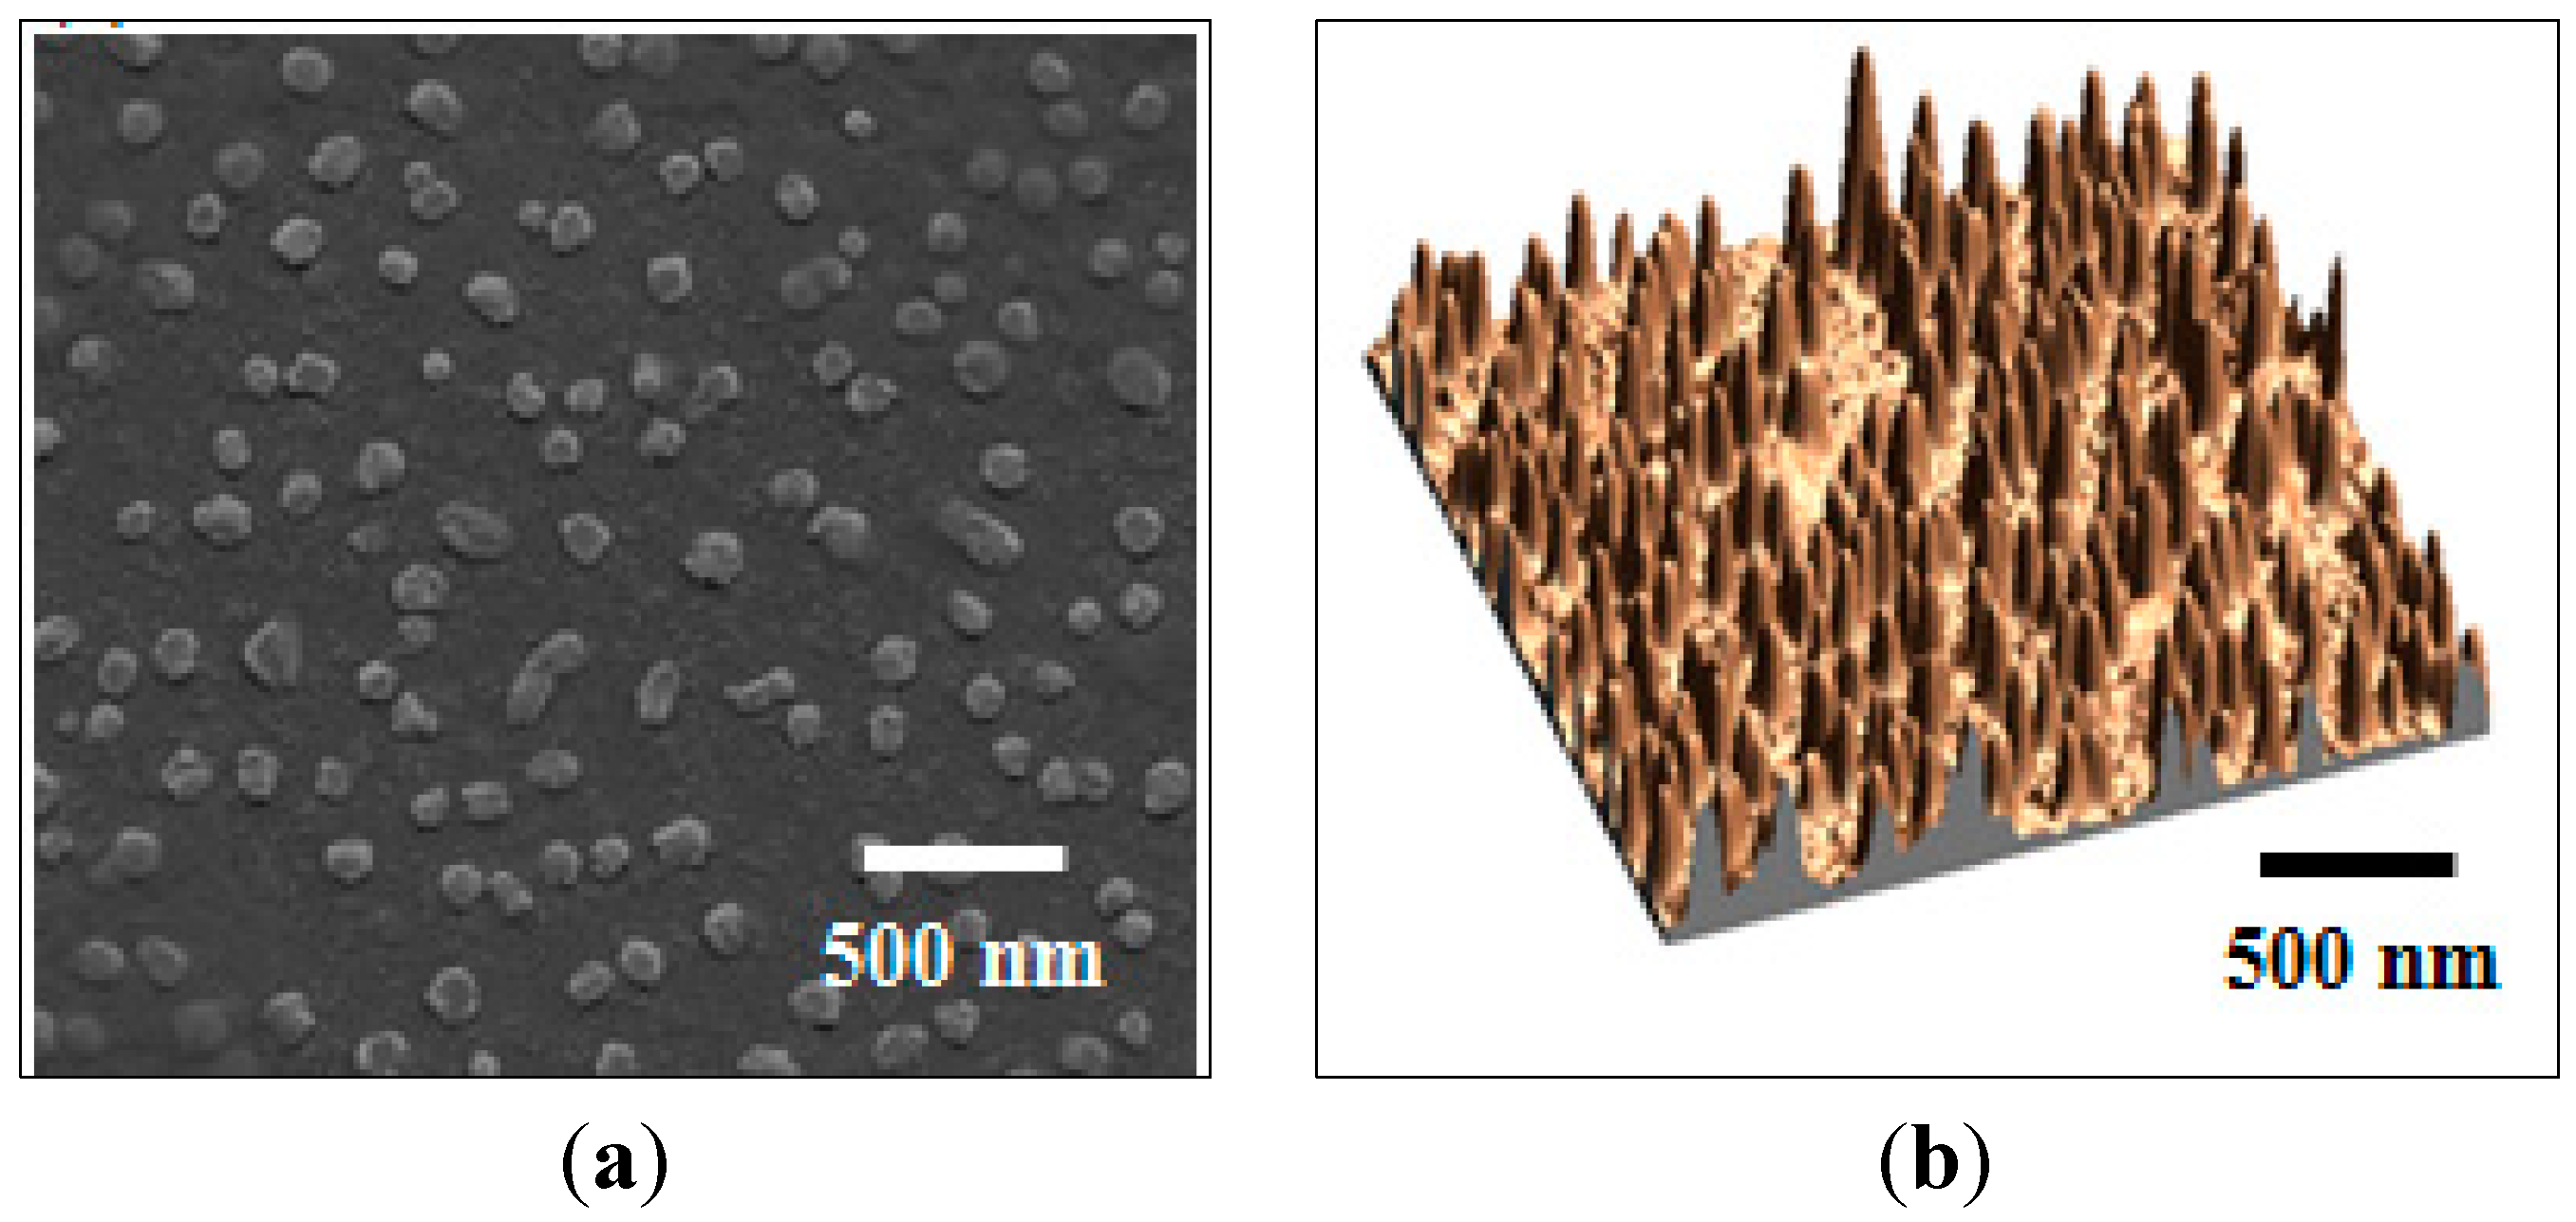
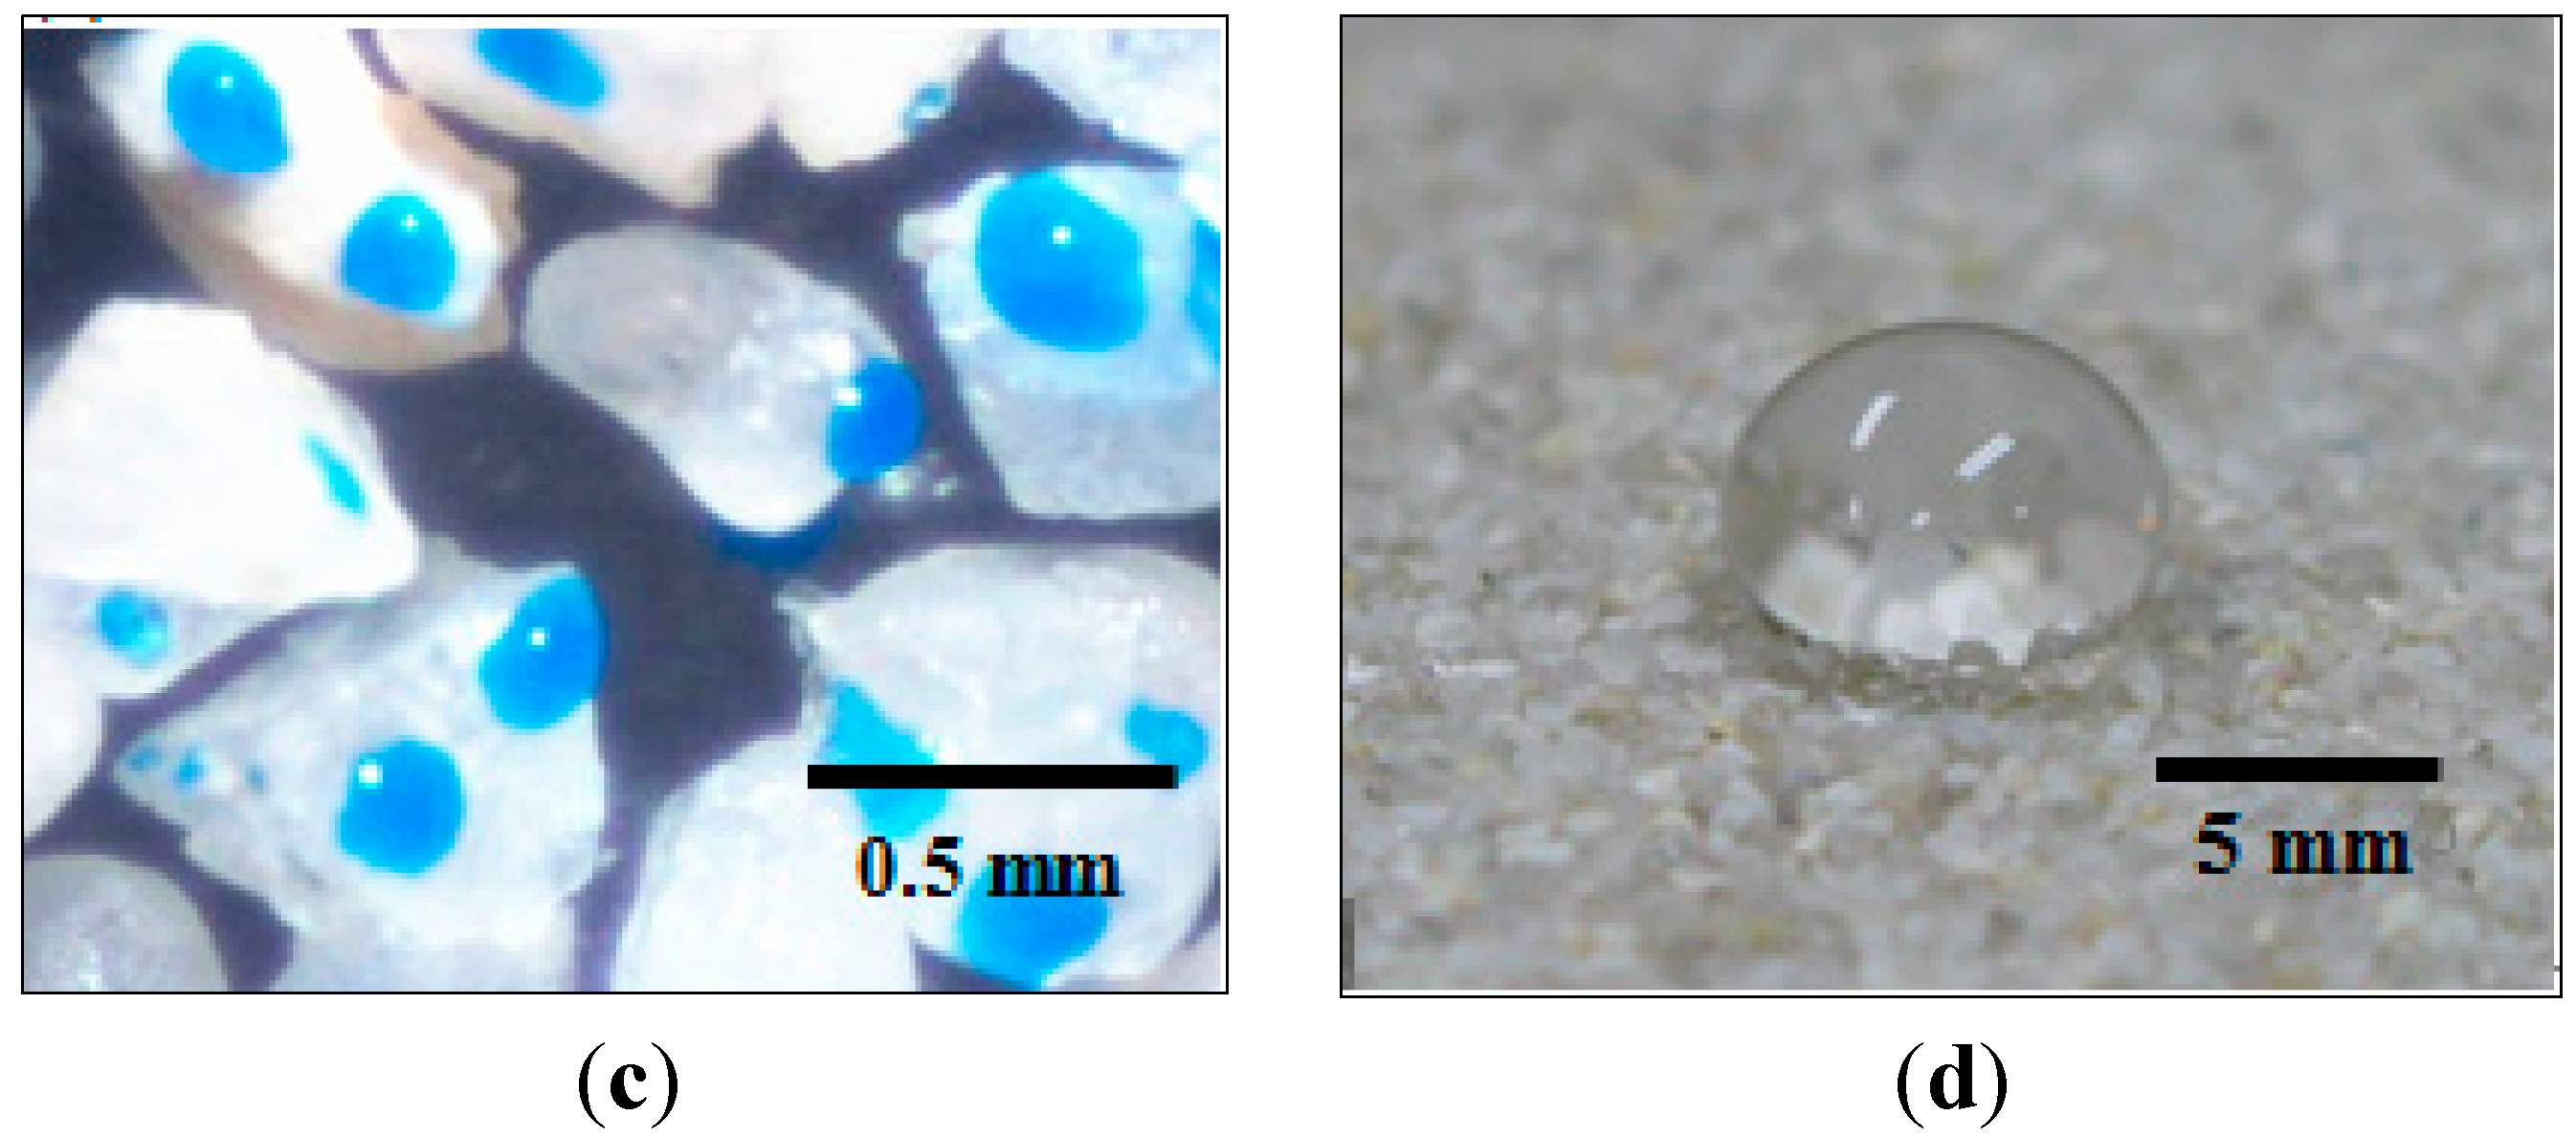
2.1. Materials

The sandy soils tested in this study were the Ottawa sand and the Jumunjin sand, both of which are coarse grained. Figure 1 shows the grain size distribution curves, relevant index properties and scanning electron microscopic images of tested sands. The Ottawa sand has a slightly higher mean grain size and rounded particle shape than Jumunjin sand. Both sands were subjected to silylation, using Zycosoil solution (Zydex Industries) to synthetically produce water-repellent specimens. The cleaned sands were fully submerged in 1% (by weight) reactive solution (e.g., Zycosoil) for 72 h at room temperature following the procedure by Kim et al. [25]; this allowed a uniform grafting of an alkylsiloxane monolayer onto the particle surface. The microscopic images obtained by scanning electron microscope and the atomic force microscope in Figure 2a,b exhibit the uniformly grafted Alkylsiloxane at nano-scale. The contact angle measured on the glass slide which was simultaneously treated with sands exhibited 85°, while the water droplet on the Jumunjin sand layer [28] showed 91°~96° such that specimens became fairly hydrophobic. As a consequence of the treatment, water drops reside on the surfaces of water-repellent sand particles rather than at inter-particle contacts (Figure 2c) and the water forms a globule without permeating into inter-particle pore spaces (Figure 2d).
Figure 1. Particle size distribution curves and relevant properties of Jumunjin and Ottawa sands tested in this study.
Sustainability 07 05648 g001
Figure 2. (a) Grafted Alkylsiloxane on glass slide taken by scanning electron microscope; (b) Surface profile by atomic force microscope; (c) Water drops on dry and water-repellent Jumunjin sand; (d) Water drop on the dry packed Jumumjin sand.
Sustainability 07 05648 g002aSustainability 07 05648 g002b

2.2. Methods

Two experimental studies were conducted to investigate the water-repellency effect in sandy soils; evaporation and cyclic drainage. For evaporation studies, 2D optical images and 3D X-ray computed tomographic images taken with time were analyzed with a series of image processing techniques. For drainage, the cyclic drainage and infiltration tests were conducted with different initial wetting conditions and time-varying water-retention capacity was assessed. All the tested sands were pre-saturated within the vacuum chamber and water-pluviated into the water to possibly achieve fully saturated conditions with nominal uncertainty.

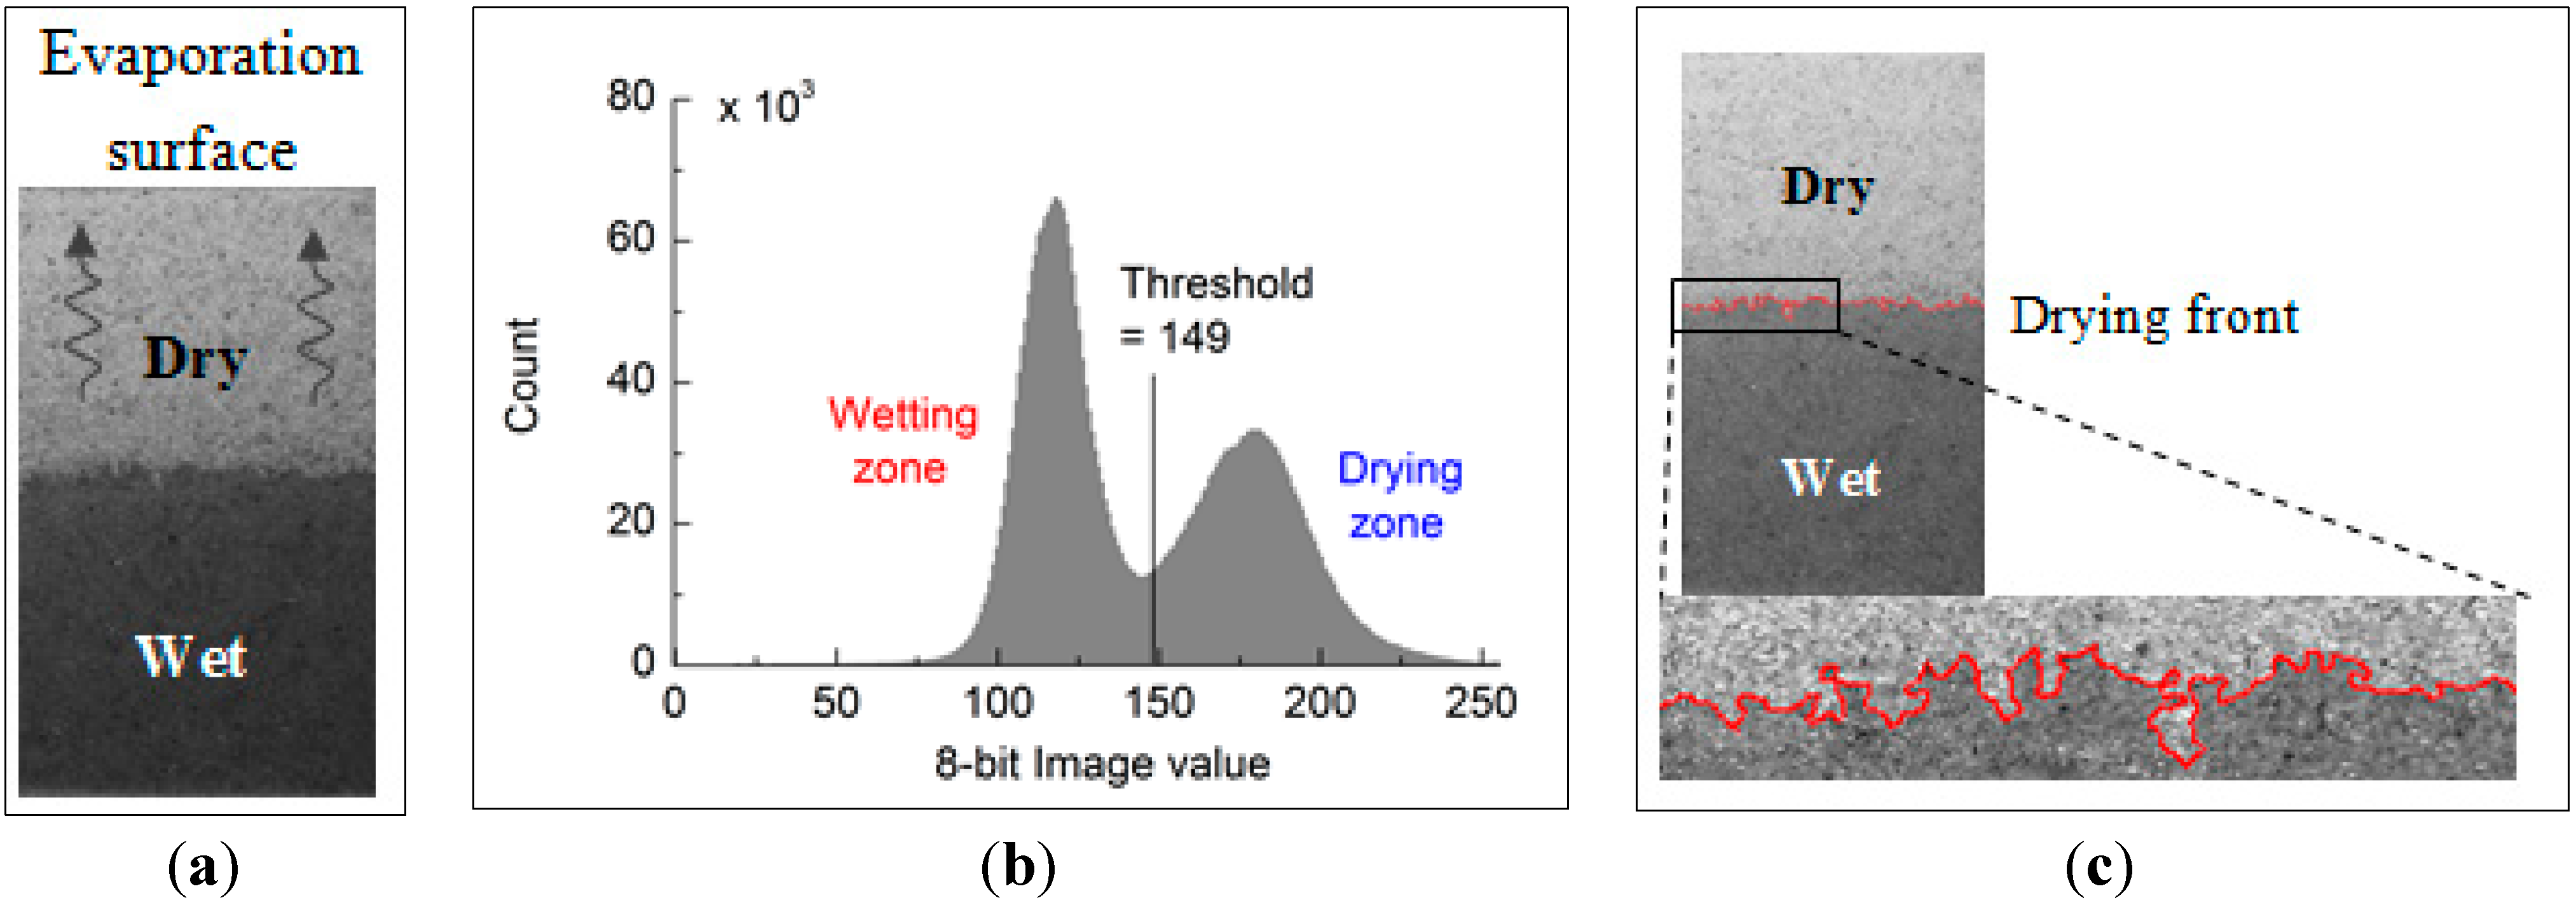
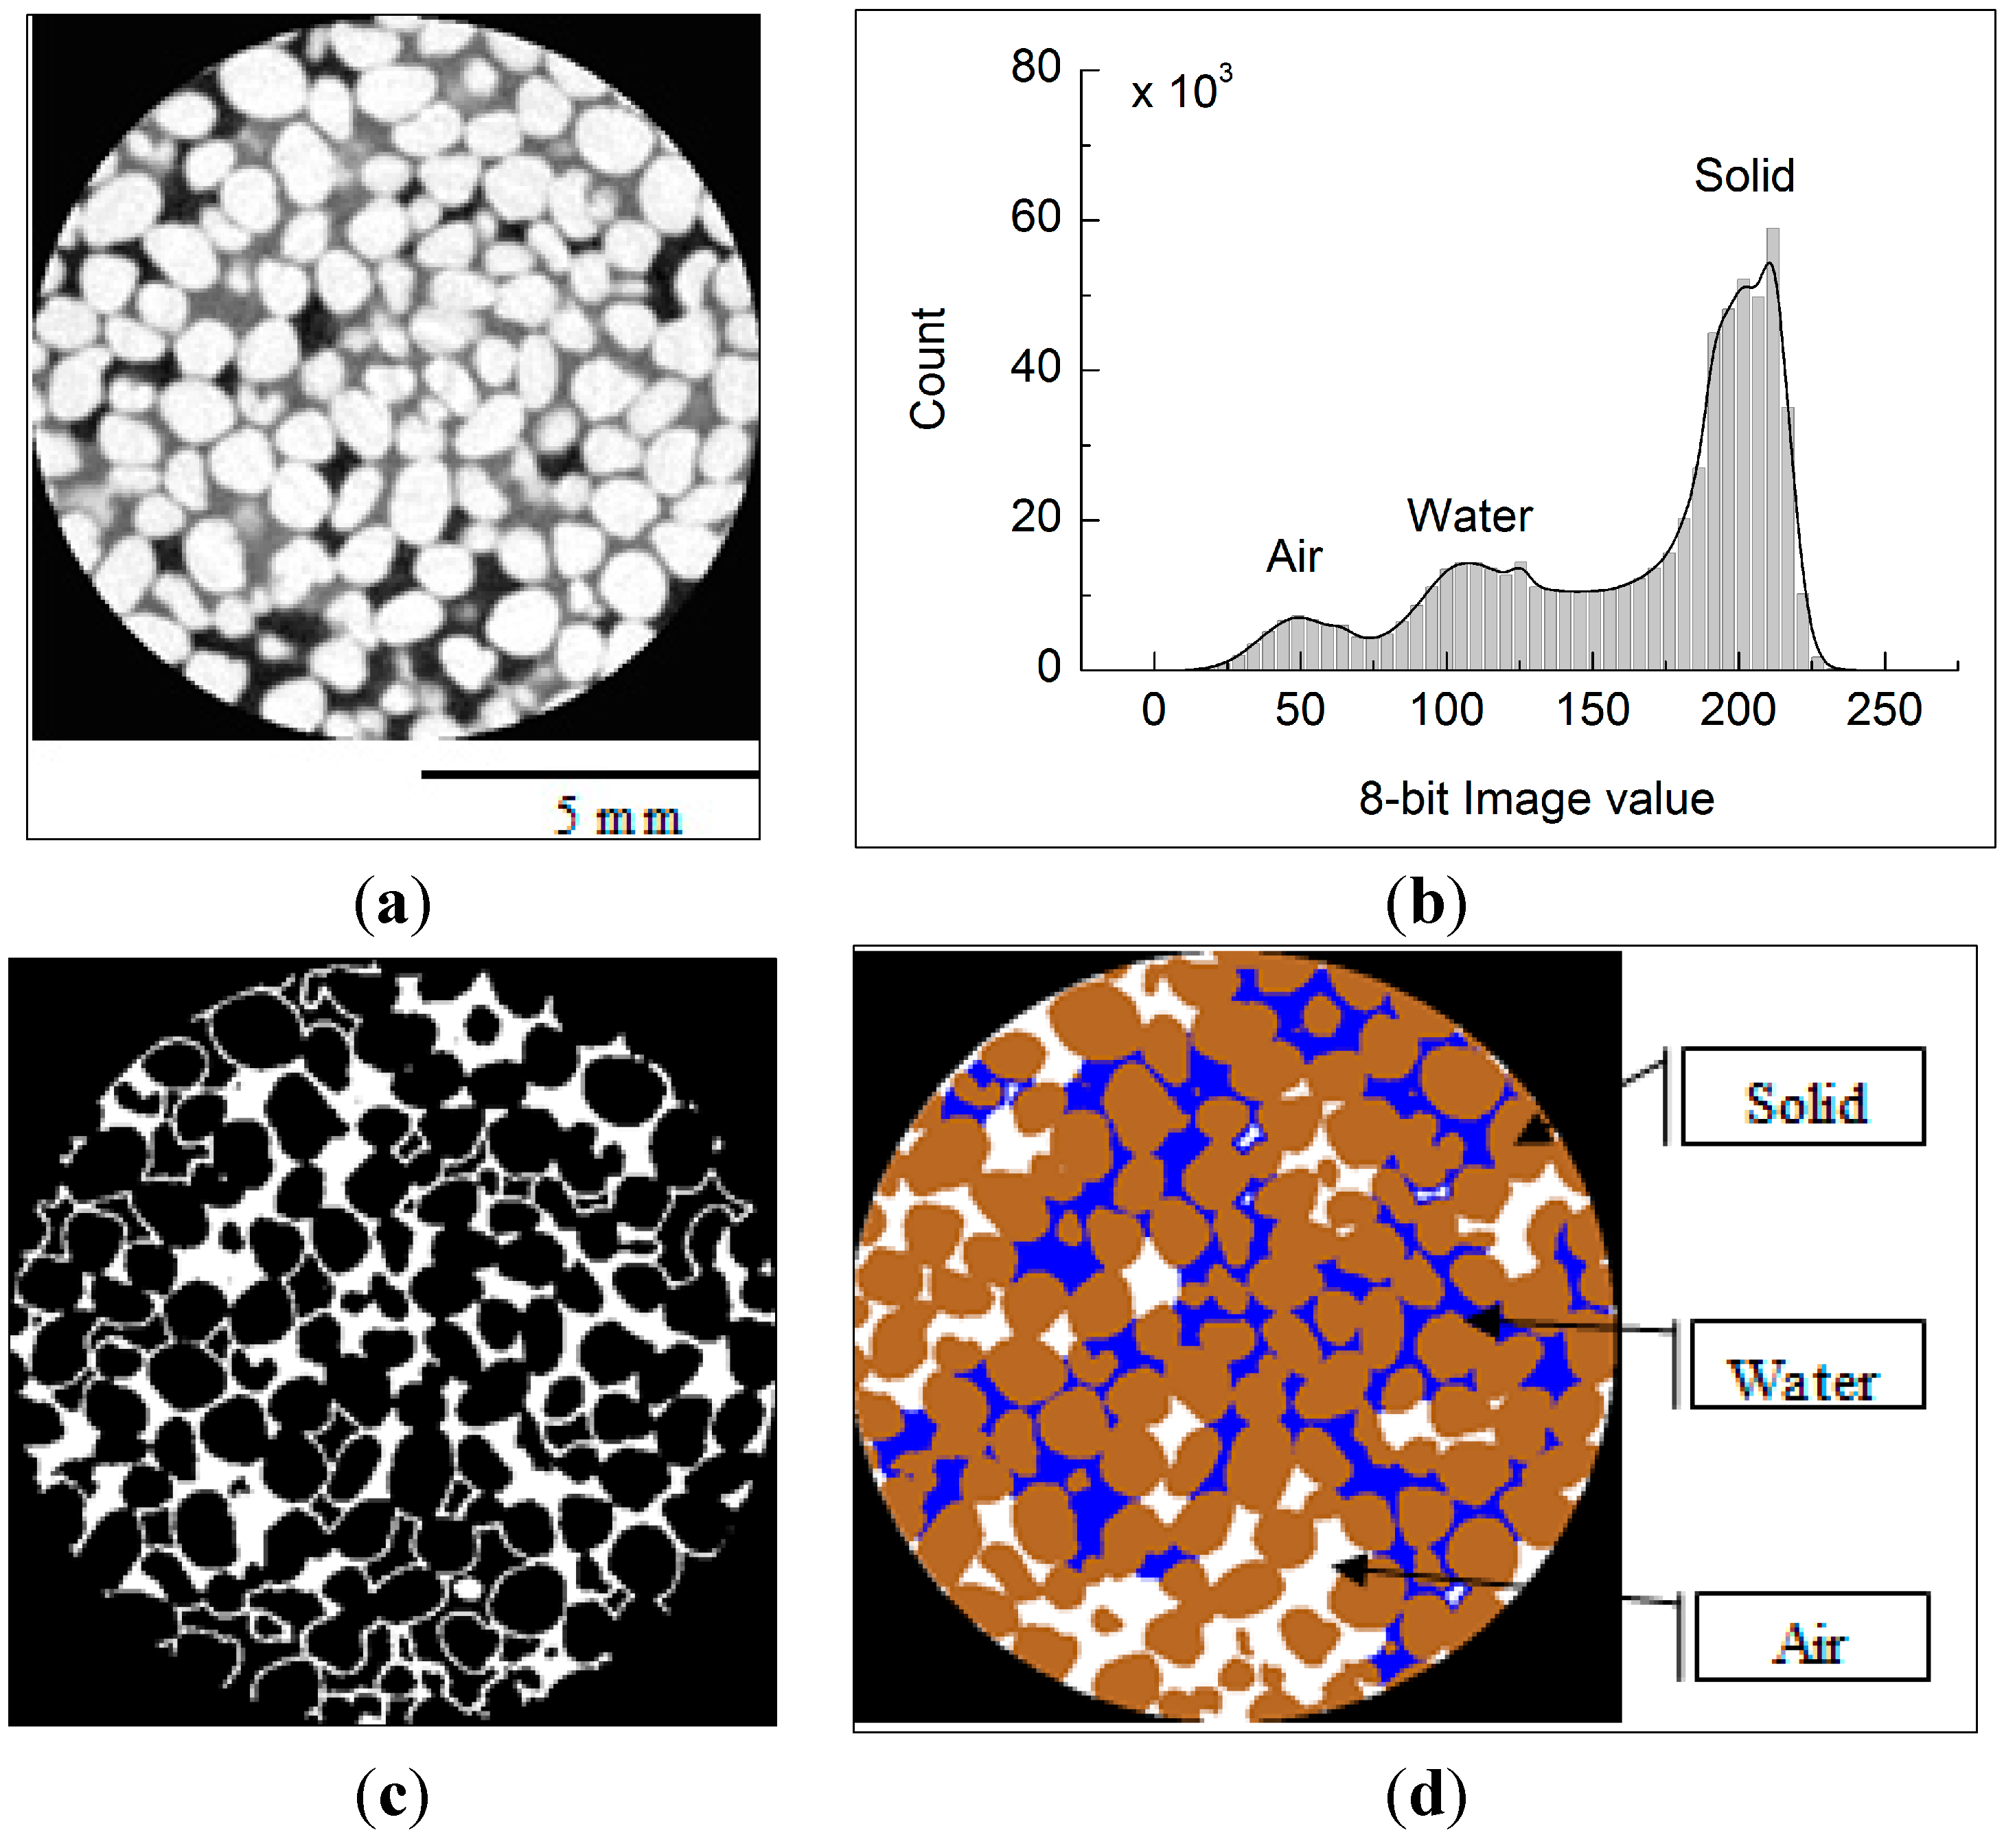
2.2.1. Image-Based Observation of Evaporation

2.2.1.1. 2D Evaporation

Four Hele-Shaw cells (width 150 mm; thickness 20 mm; height 220 mm) were initially filled with fully saturated water and wettable and water-repellent Ottawa and Jumunjin sands and their initial void ratio values of Ottawa sand and Jumunjin sand were 0.65 and 0.85, respectively. Hele Shaw cells (e.g., two for Ottawa and two for Jumunjin sand specimens) were independently placed on the balance with the accuracy of 0.01 gram and the weight was logged every 10-second, along with the measurement of temperature (~20 °C) and humidity (~40%), with the evaporation to the top surface. A camera was set in front of cells and snapshot images were taken at 10-minute intervals (Figure 3a). The boundary effect was minimized as specimens were under the same temperature and humidity conditions and the wettability was solely dominant to the evaporation.
An additional evaporation test was additionally performed with the vertically aligned wettable and water-repellent Ottawa sand to assess the roles of surface wettability and evaporation on possible migration of water across the soils with different wettability.
Figure 3. Experimental configuration for evaporation testing. (a) 2D frame (220 mm in height, 150 mm in width, and 20 mm in thickness) at centimeter scale; (b) 3D X-ray computed tomographic imaging millimeter scaled specimen (15 mm in height and 11 mm in diameter).
Sustainability 07 05648 g003

2.2.1.2. 3D X-Ray Computed Tomography

As 2D evaporation experiment does not provide the wettability-dependent spatial configuration of water phase in pore space, the 3D X-ray computed tomographic imaging was conducted. Ottawa sand was only selected for 3D study because of rounded particle shape that makes the post-image processing uncomplicated. Two cylindrical cells with the diameter of 11 mm and height of 15 mm were filled with fully saturated wettable and water-repellent Ottawa sand with consideration the image resolution (Figure 3b).
The high-resolution X-ray CT images were obtained at the CT facility of the Korea Institute of Construction Technology, using a 225-kV directional open beam X-ray tube with a focal spot size of less than 6 μm and a flat panel detector with 200 μm of pixel pitch. The X-ray beam energy of 140 kV, current of 140 μA, and exposure time of 1 s were set based on preliminary tests to optimize the image contrast. The number of scan views was set to 800 over a rotating observation angle of 360° to reconstruct the specimen from the slice images. For each scan, 1024 vertical slices were obtained at a resolution of 1024 × 1024 pixels per slice, corresponding to pixel dimensions of 0.010837 mm in the x and y dimensions, with spacing of 0.008818 mm in the z direction. The evaporation of both sands was allowed next to the X-ray equipment with the measurement of weights at 1-minute intervals using a balance, and images were taken every 12 h until evaporation was completed (e.g., cells moved back and forth between the balance and imaging).

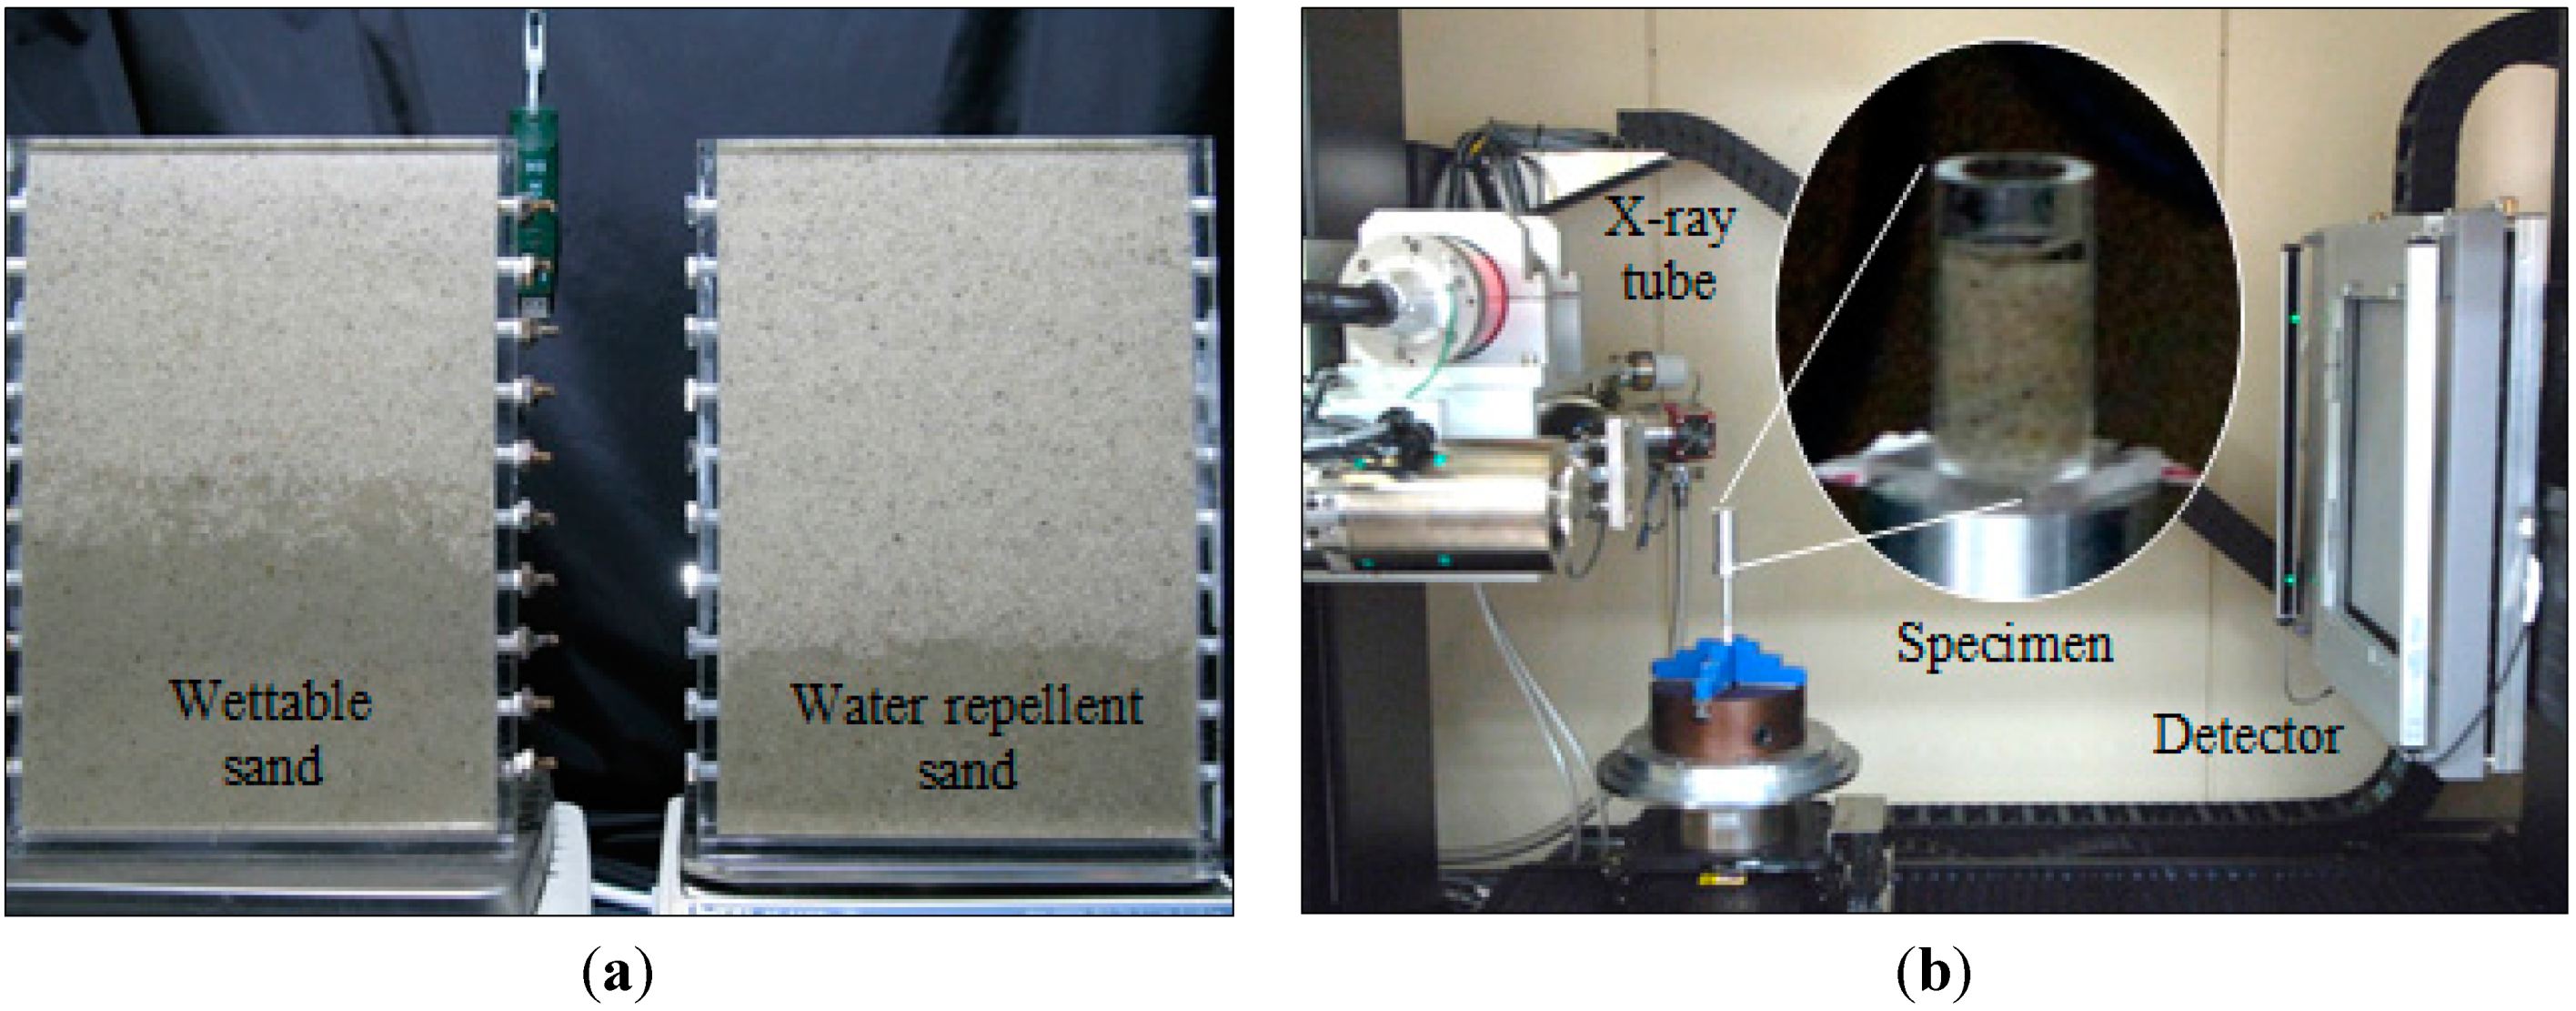
2.2.2. Cyclic Drainage and Infiltration

Both wettable and water-repellent Jumunjin sands were prepared at either initially dry or fully saturated condition in a cylindrical cell (diameter, 150 mm; height, 500 mm). A constant hydraulic head of 147 cm was applied from the bottom, and effluent was collected from the top (Figure 4). The entire testing system was on a balance, and the weight (used to compute the degree of saturation (= volume of water/volume of total pore space) and water content (= mass of water/mass of solid) of specimens) was monitored at 1-min intervals. For the initially saturated condition, drainage was performed first, followed by permeation; for the initially dry condition, the procedure was reversed, with infiltration performed first, followed by drainage such that total four experiments were conducted. Six cycles of drainage-permeation for each test were allowed to observe hysteresis effects, with each cycle lasting 30 min until no change in weight (e.g., steady-state) was observed.
Figure 4. Cyclic drainage and infiltration test. A constant hydrostatic pressure was applied from the bottom and the effluent was collected from the top.
Sustainability 07 05648 g004

3. Results and Discussion

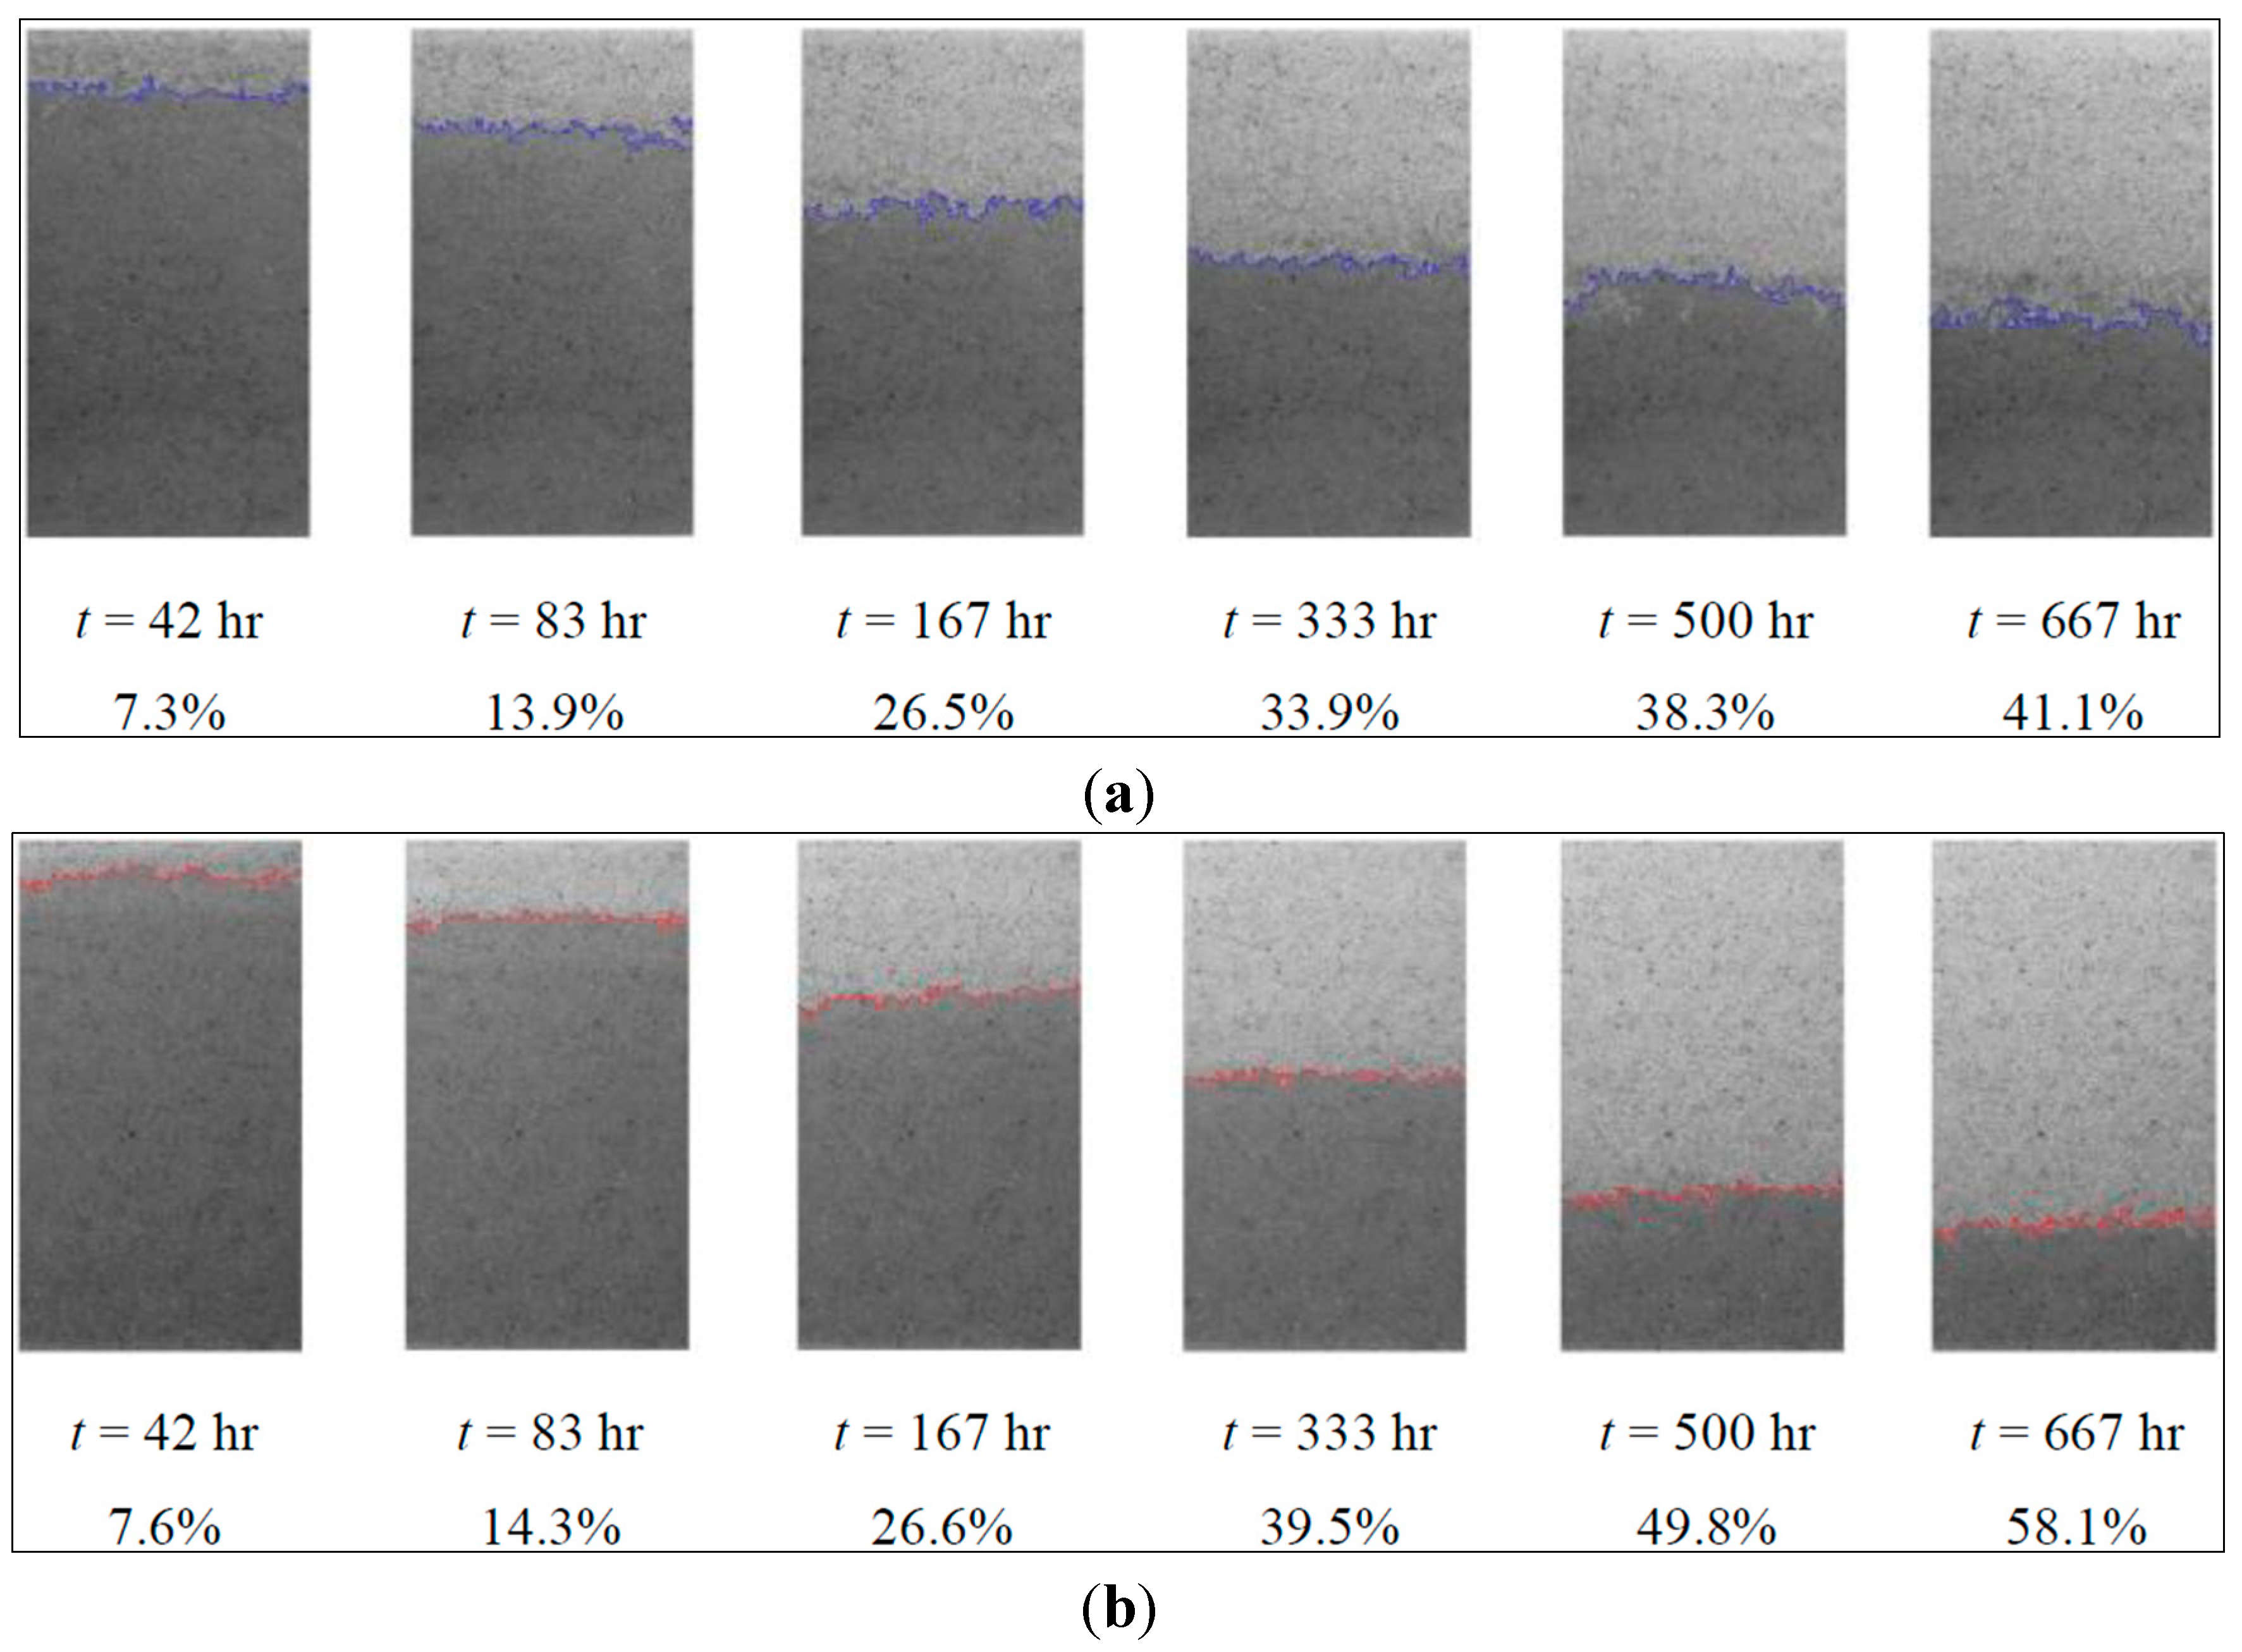
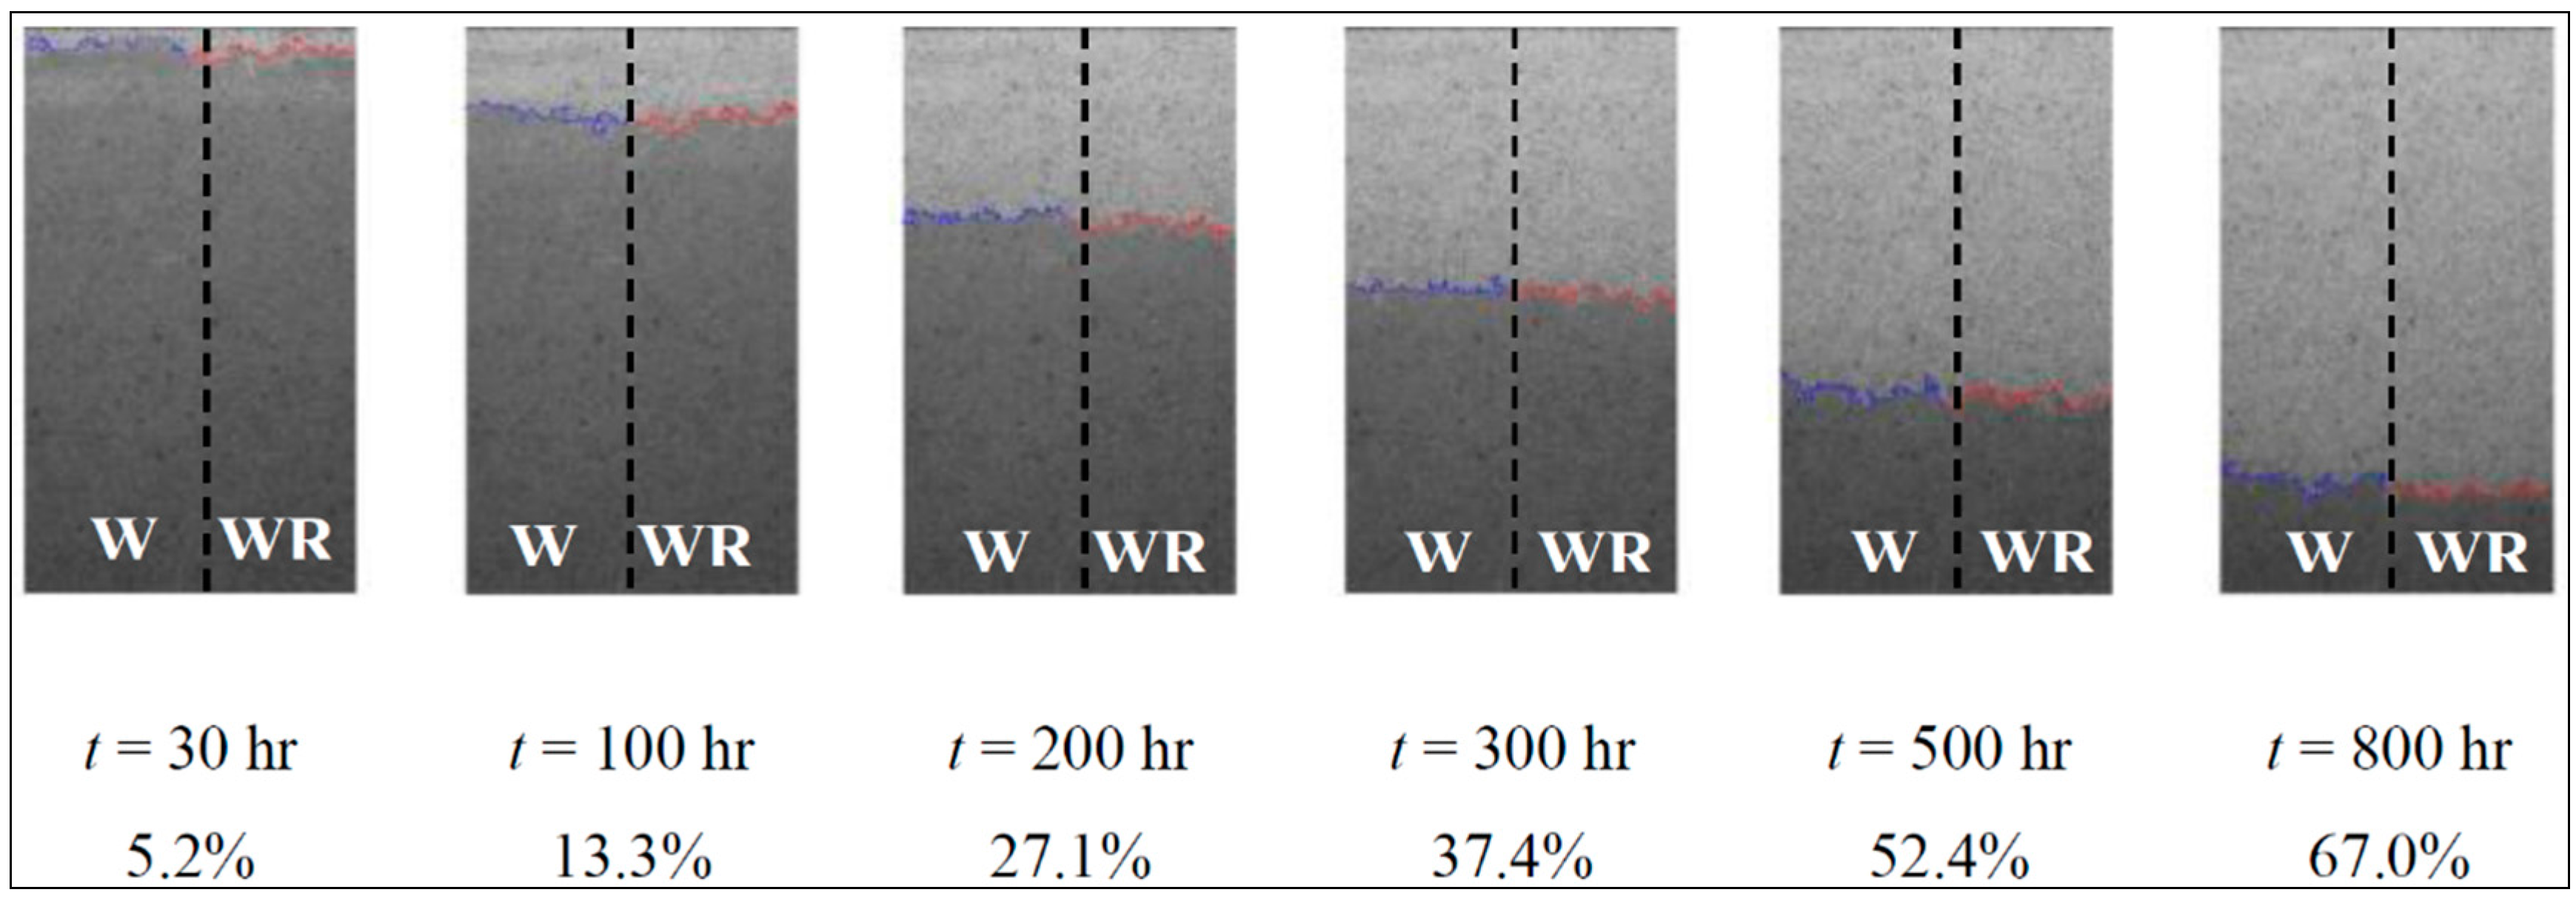
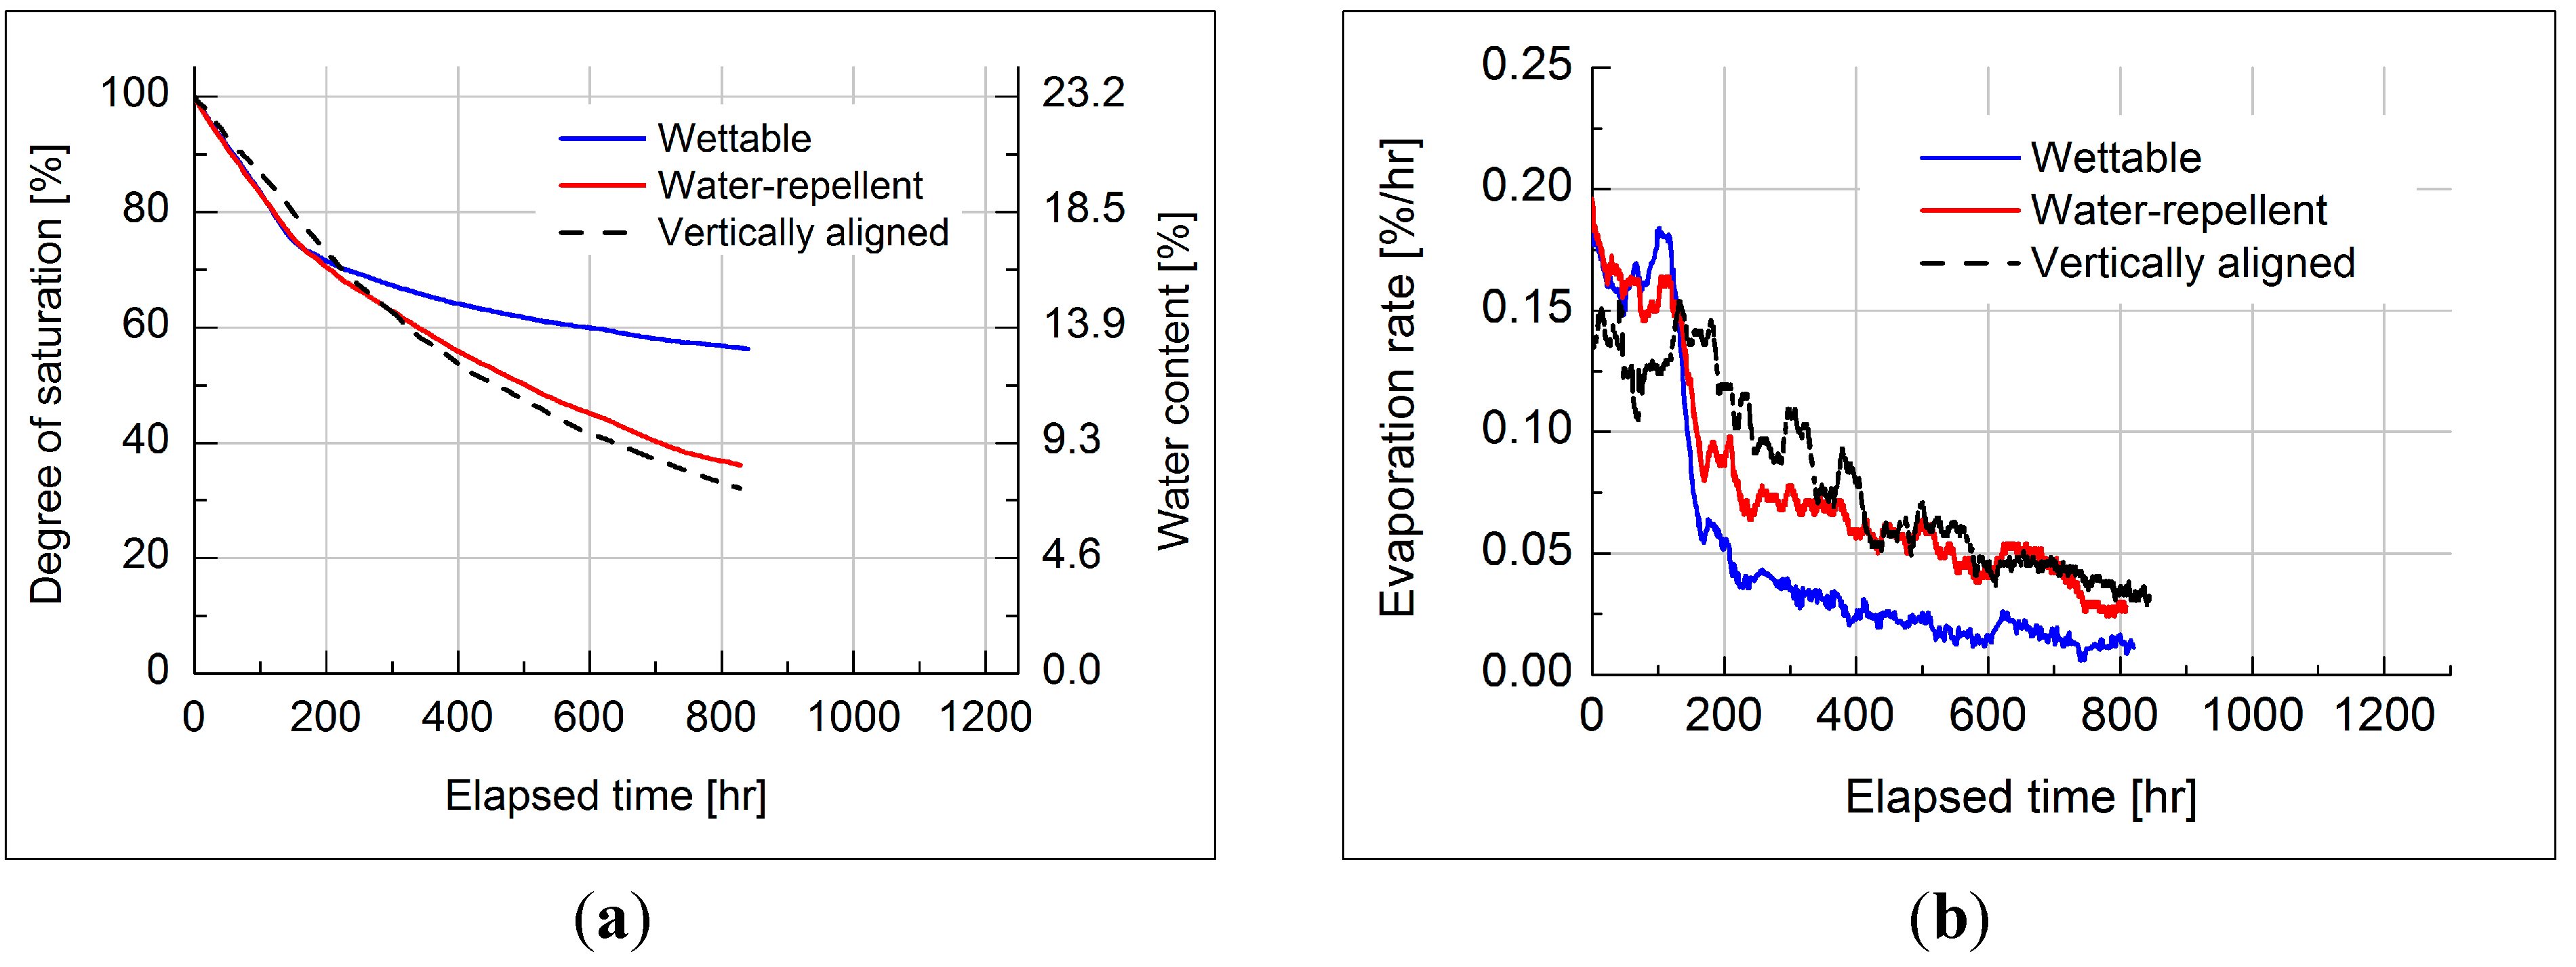
3.1. Evaporation in 2D Images

3.1.1. Drying Front

A typical 2D image for Ottawa sand is shown in Figure 5a. Bright colors in Figure 5a indicate dry (or partially saturated) regions while dark colors denote wet zones. It should be noted that the colors and their corresponding pixel values do not necessarily represent the degree of saturation or water content, as the color represents projections of wetting zones distributed in the sample. Nevertheless, each image provides unique variations in pixel values depending on whether the section is dry or wet, as for example in Figure 5b, in which two clear mounds exist. Dry and wet regions are segmented by applying Otsu’s method for binarization [29] that performs the class-based segmentation. The identified drying front is shown in Figure 5c, for example, which shows the undulating boundary between dry and wet zones. Figure 6 shows the gradual propagation of drying fronts in the wettable and water-repellent Ottawa sands. The wettable sand exhibits more undulated and less propagated drying front in which partially unsaturated region is observed. Figure 7 presents the evolution of the drying front in vertically layered wettable and water-repellent Ottawa sands which are naturally in contact with each other and hydraulically connected. The amount of water loss (e.g., weight of water loss/initial water weight) is shown as well. Drying fronts continue to advance in both sands regardless of surface wettability without noticeable difference. As in the previous experiment, the wettable sand delays evaporation, implying the migration of hydraulically connected water toward the water-repellent sand which provides evaporation pathways.
Figure 5. Image segmentation to differentiate dry and wet zones determines the drying front based on the histogram of X-ray attenuation values. (a) Dry and wet regions; (b) Distribution of pixel values; (c) Boundary between dry and wet regions.
Sustainability 07 05648 g005
Figure 6. Snapshots of drying fronts for wettable and water-repellent Ottawa sand (void ratio = 0.65). Elapsed time and percent of water loss are denoted below each image. (a) Wettable Ottawa sand; (b) Water-repellent Ottawa sand.
Sustainability 07 05648 g006
Figure 7. Drying front of vertically layered wettable (W) and water-repellent (WR) Ottawa sand. Elapsed time and percent of water loss are denoted below each image.
Sustainability 07 05648 g007

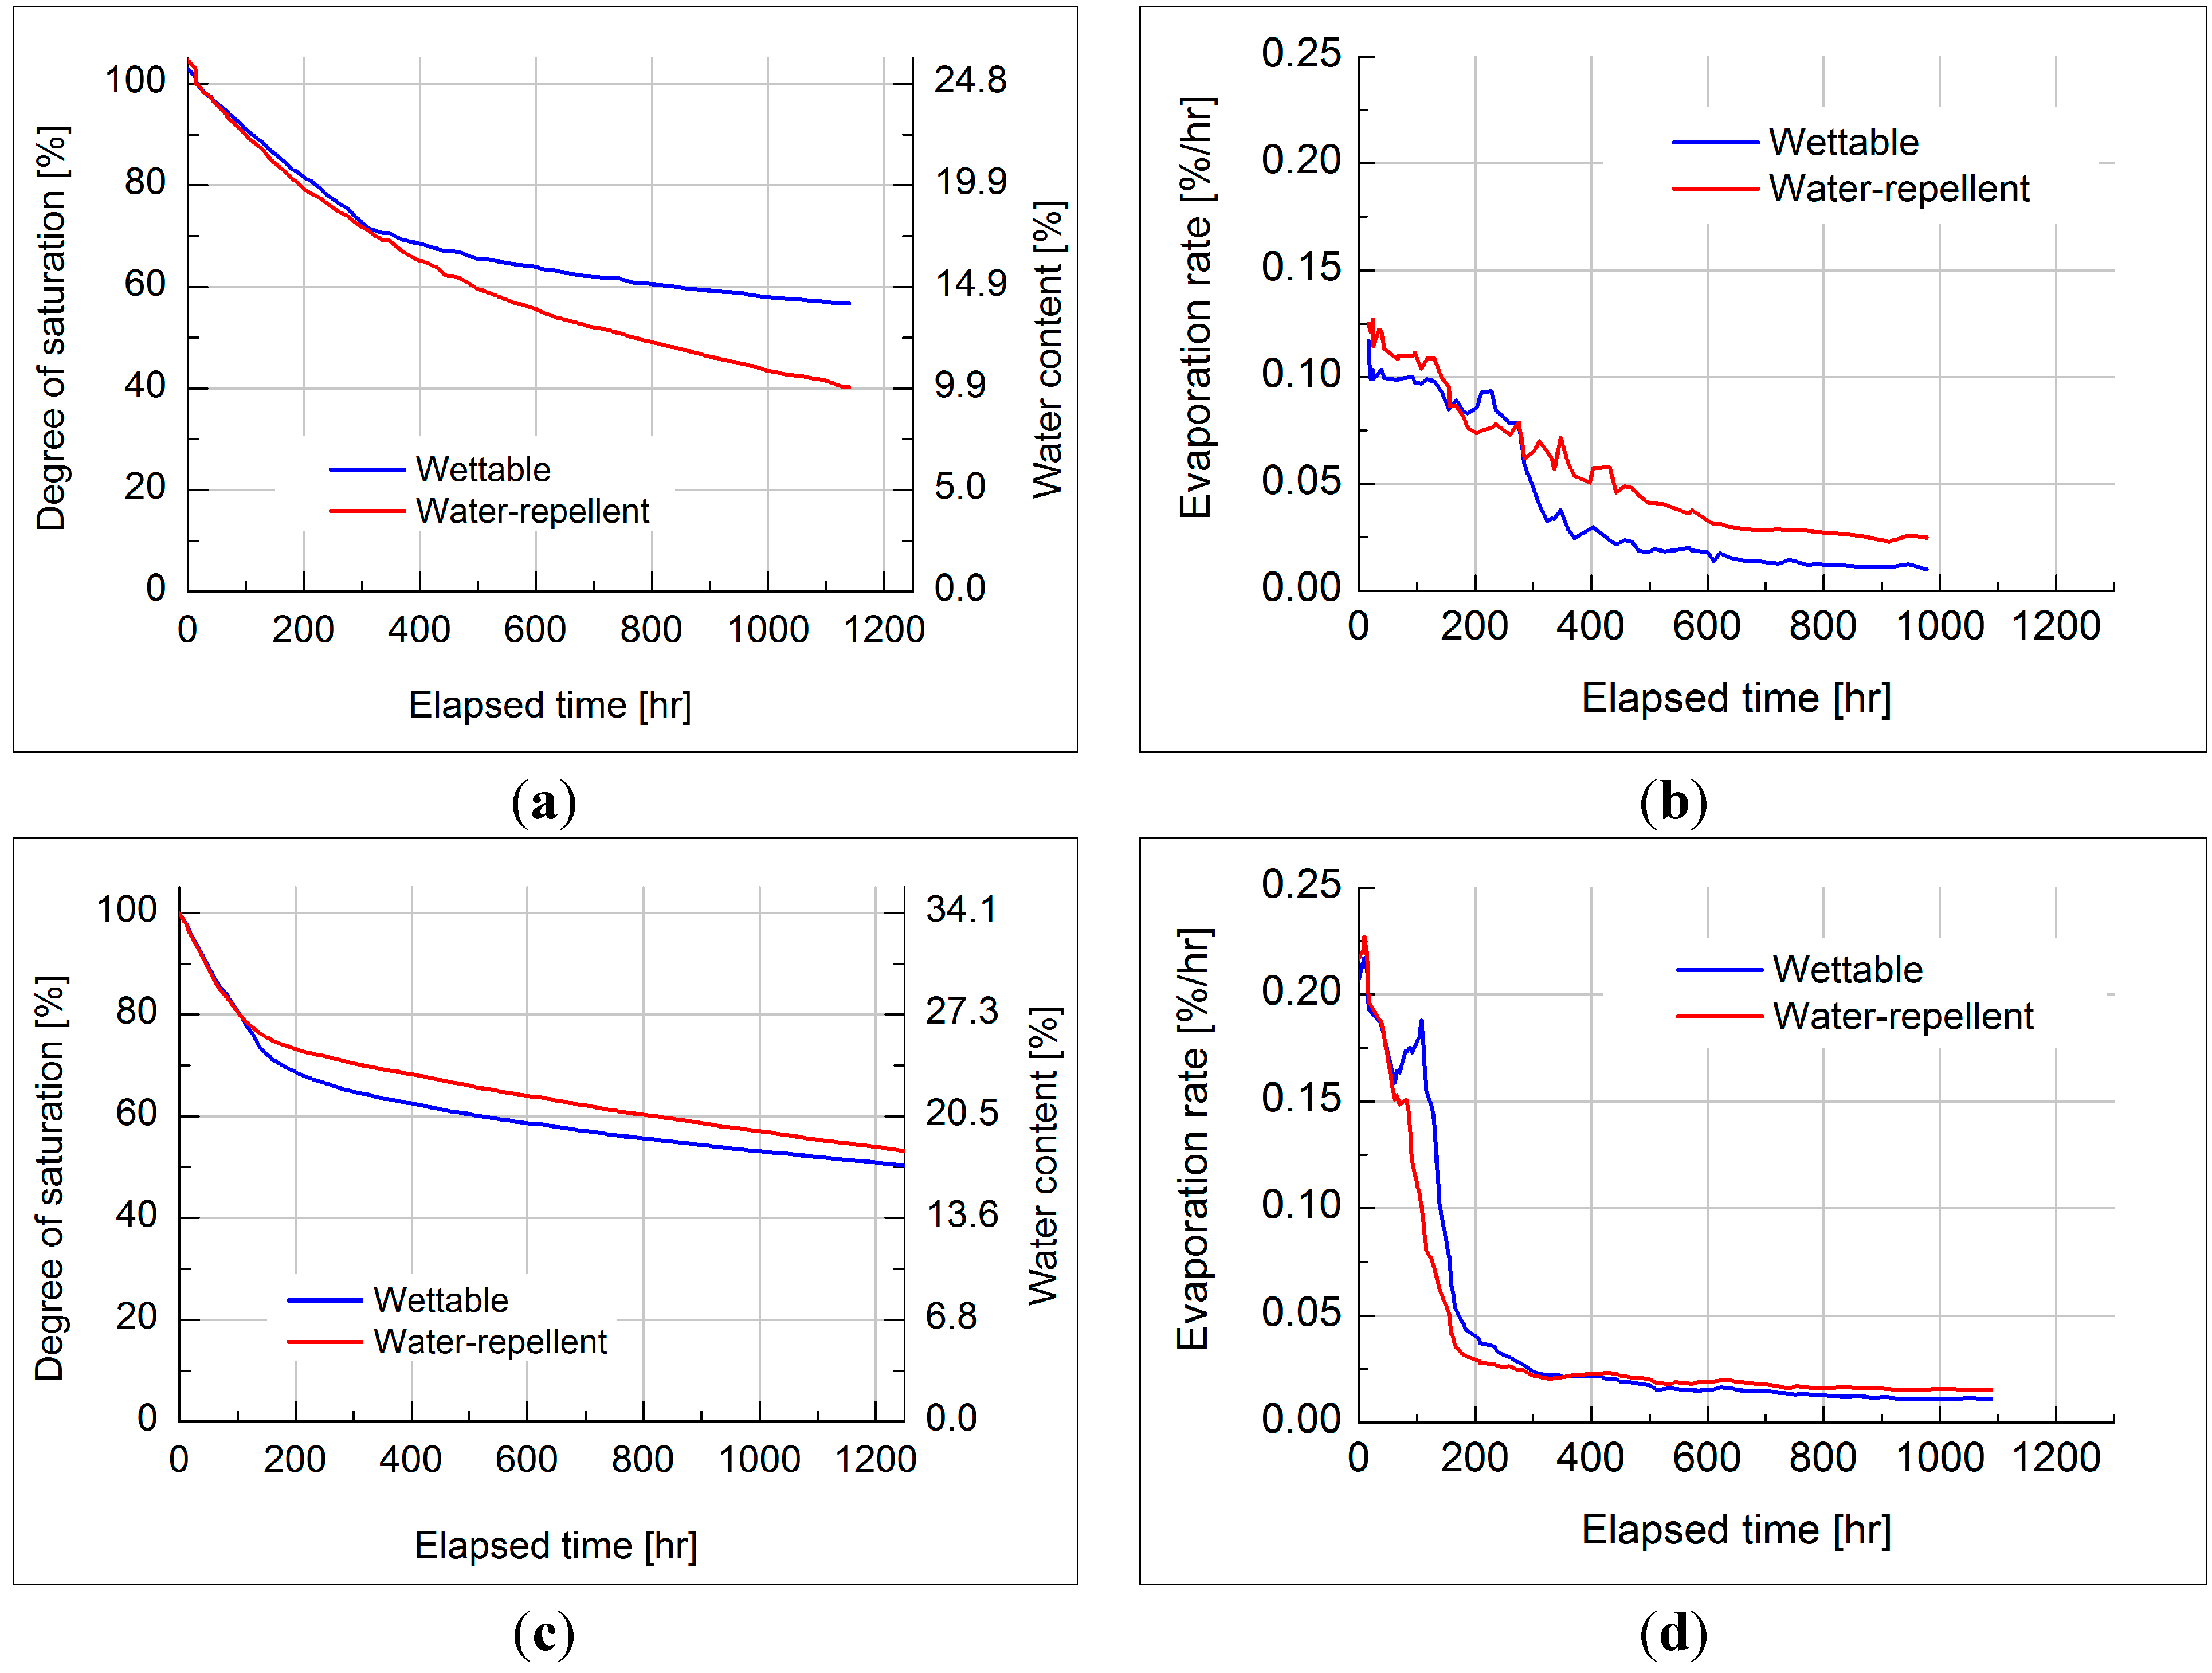
3.1.2. Evaporation Rate

The weight of the evaporation cell, continuously measured during the course of the experiment, is directly related to the degree of saturation and water content and evaporation rate (e.g., change in degree of saturation with time). Figure 8 shows the changes in degree of saturation, the corresponding water content, and the computed values of evaporation rate for both Ottawa and Jumunjin sand specimens. The saturation values of both sands linearly decrease 70%–75% regardless of wettability. At this stage, as the hydraulically connected water becomes evaporated towards the soil surface such that the wettability effect seems nominal. The Jumunjin sands with smaller particle size show the higher evaporation rate than Ottawa sand. Subsequently, the evaporation rates of both sands get diverged with different following bilinear pathways. The wettable Ottawa sands exhibit twice slower evaporation rate than water-repellent specimen (Figure 8a) while Jumunjin sands show the relative low and quasi-analogous evaporation rate regardless of wettability (Figure 8b). Previous studies with uniform sands [18,19,30] also reported two distinct and bilinear stages which are originated from the water evaporation from hydraulic connected pathway at early stage followed by slow evaporation rate dominated by vapor diffusion mechanism. This observation seems analogous to our experimental results. However, previously reported results showed the higher evaporation rate of wettable sand than water-repellent sand opposite to our repeated test results. Once the evaporation front reaches to a certain critical depth by which the boundary conditions are predominant, the effects of the pore size distribution and surface tension can be intermingled. In other words, the high affinity of water to sand particles and capillarity to bring water towards evaporation surface exhibit the counter-effect to determine the evaporation rate. Therefore, it cannot be conclusive that water-repellency solely retards the evaporation rate. From our phenomenological observations, the wettability alone may not be a decisive attribution reason and the retention capacity of water seems higher in wettable sands and the particle size distribution and degree of water-repellency should be under consideration. Figure 9 presents the repeated test results of evaporation for Ottawa sand (e.g., specimens that exhibited opposite results compared with literatures) and the vertically aligned wettable and water-repellent Ottawa sand (dashed line). When both wettable and water-repellent sands are in natural contact with each other sharing the same evaporation surface, the evolution of evaporation closely follows that of water-repellent sand. This observation hints that water in wettable sand migrates towards the water-repellent sand which facilitates evaporation overcoming the wettability effect. The 3D X-ray tomographic imaging presented in the next section addresses some of these shortcomings of the 2D experiment.
Figure 8. Evolution of evaporation with time. (a) Degree of saturation of Ottawa sand; (b) Evaporation rate of Ottawa sand; (c) Degree of saturation of Jumunjin sand; (d) Evaporation rate of Jumunjin sand.
Sustainability 07 05648 g008
Figure 9. Degree of saturation and evaporation rate for vertically aligned Ottawa sand. (a) Degree of saturation; (b) Evaporation rate.
Sustainability 07 05648 g009

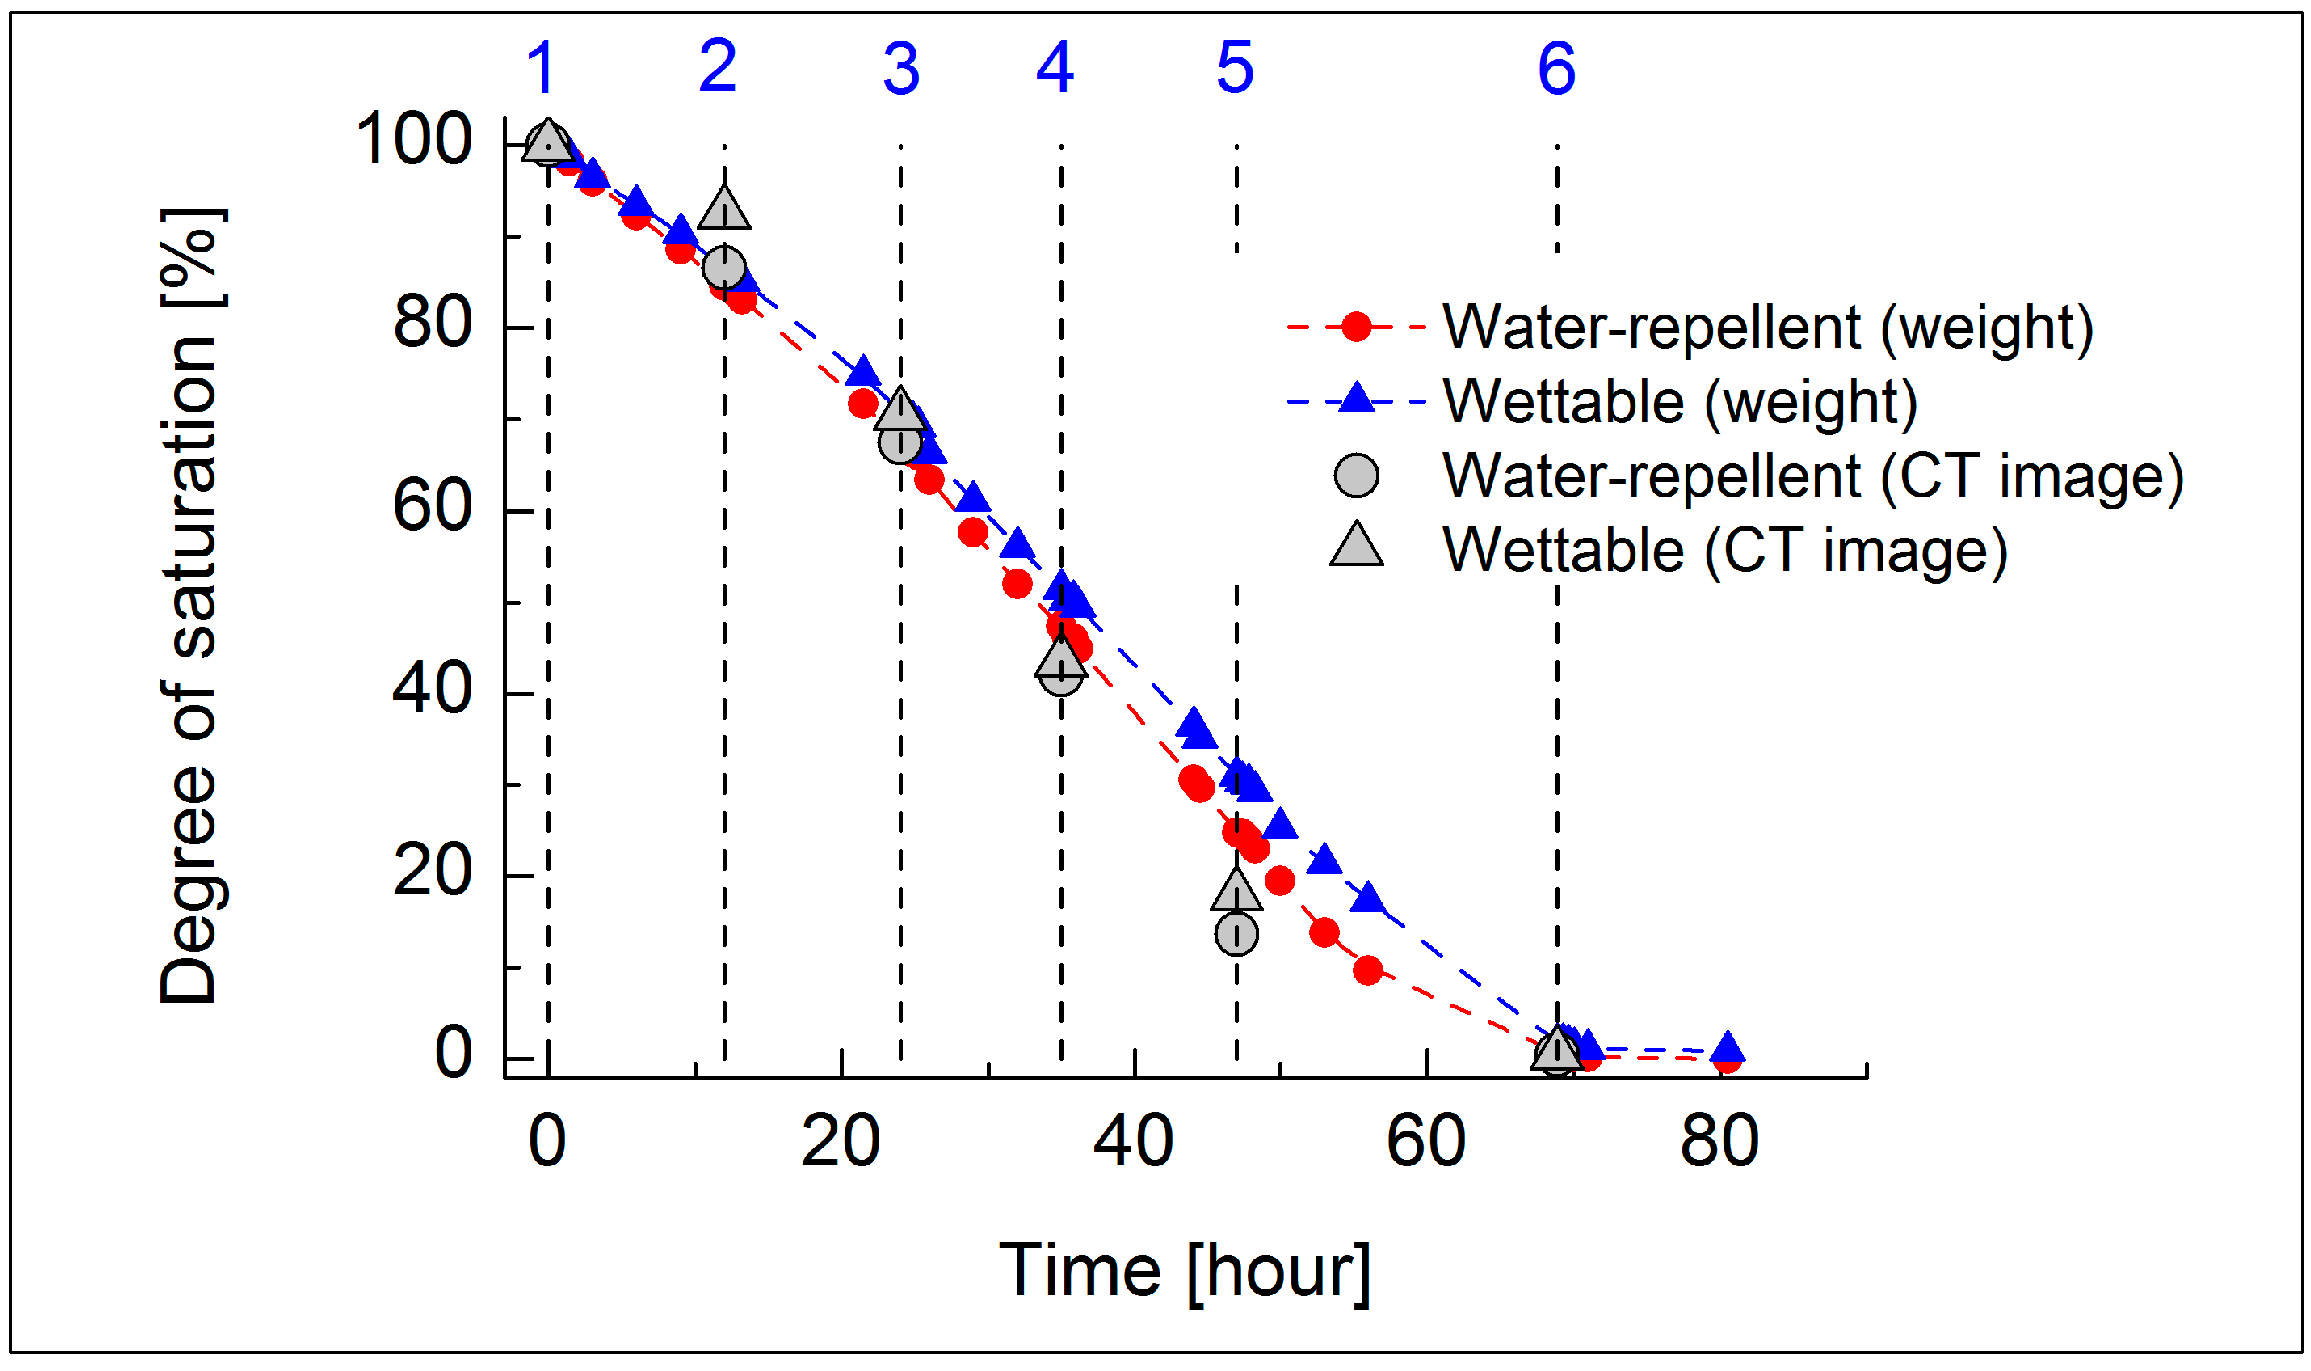
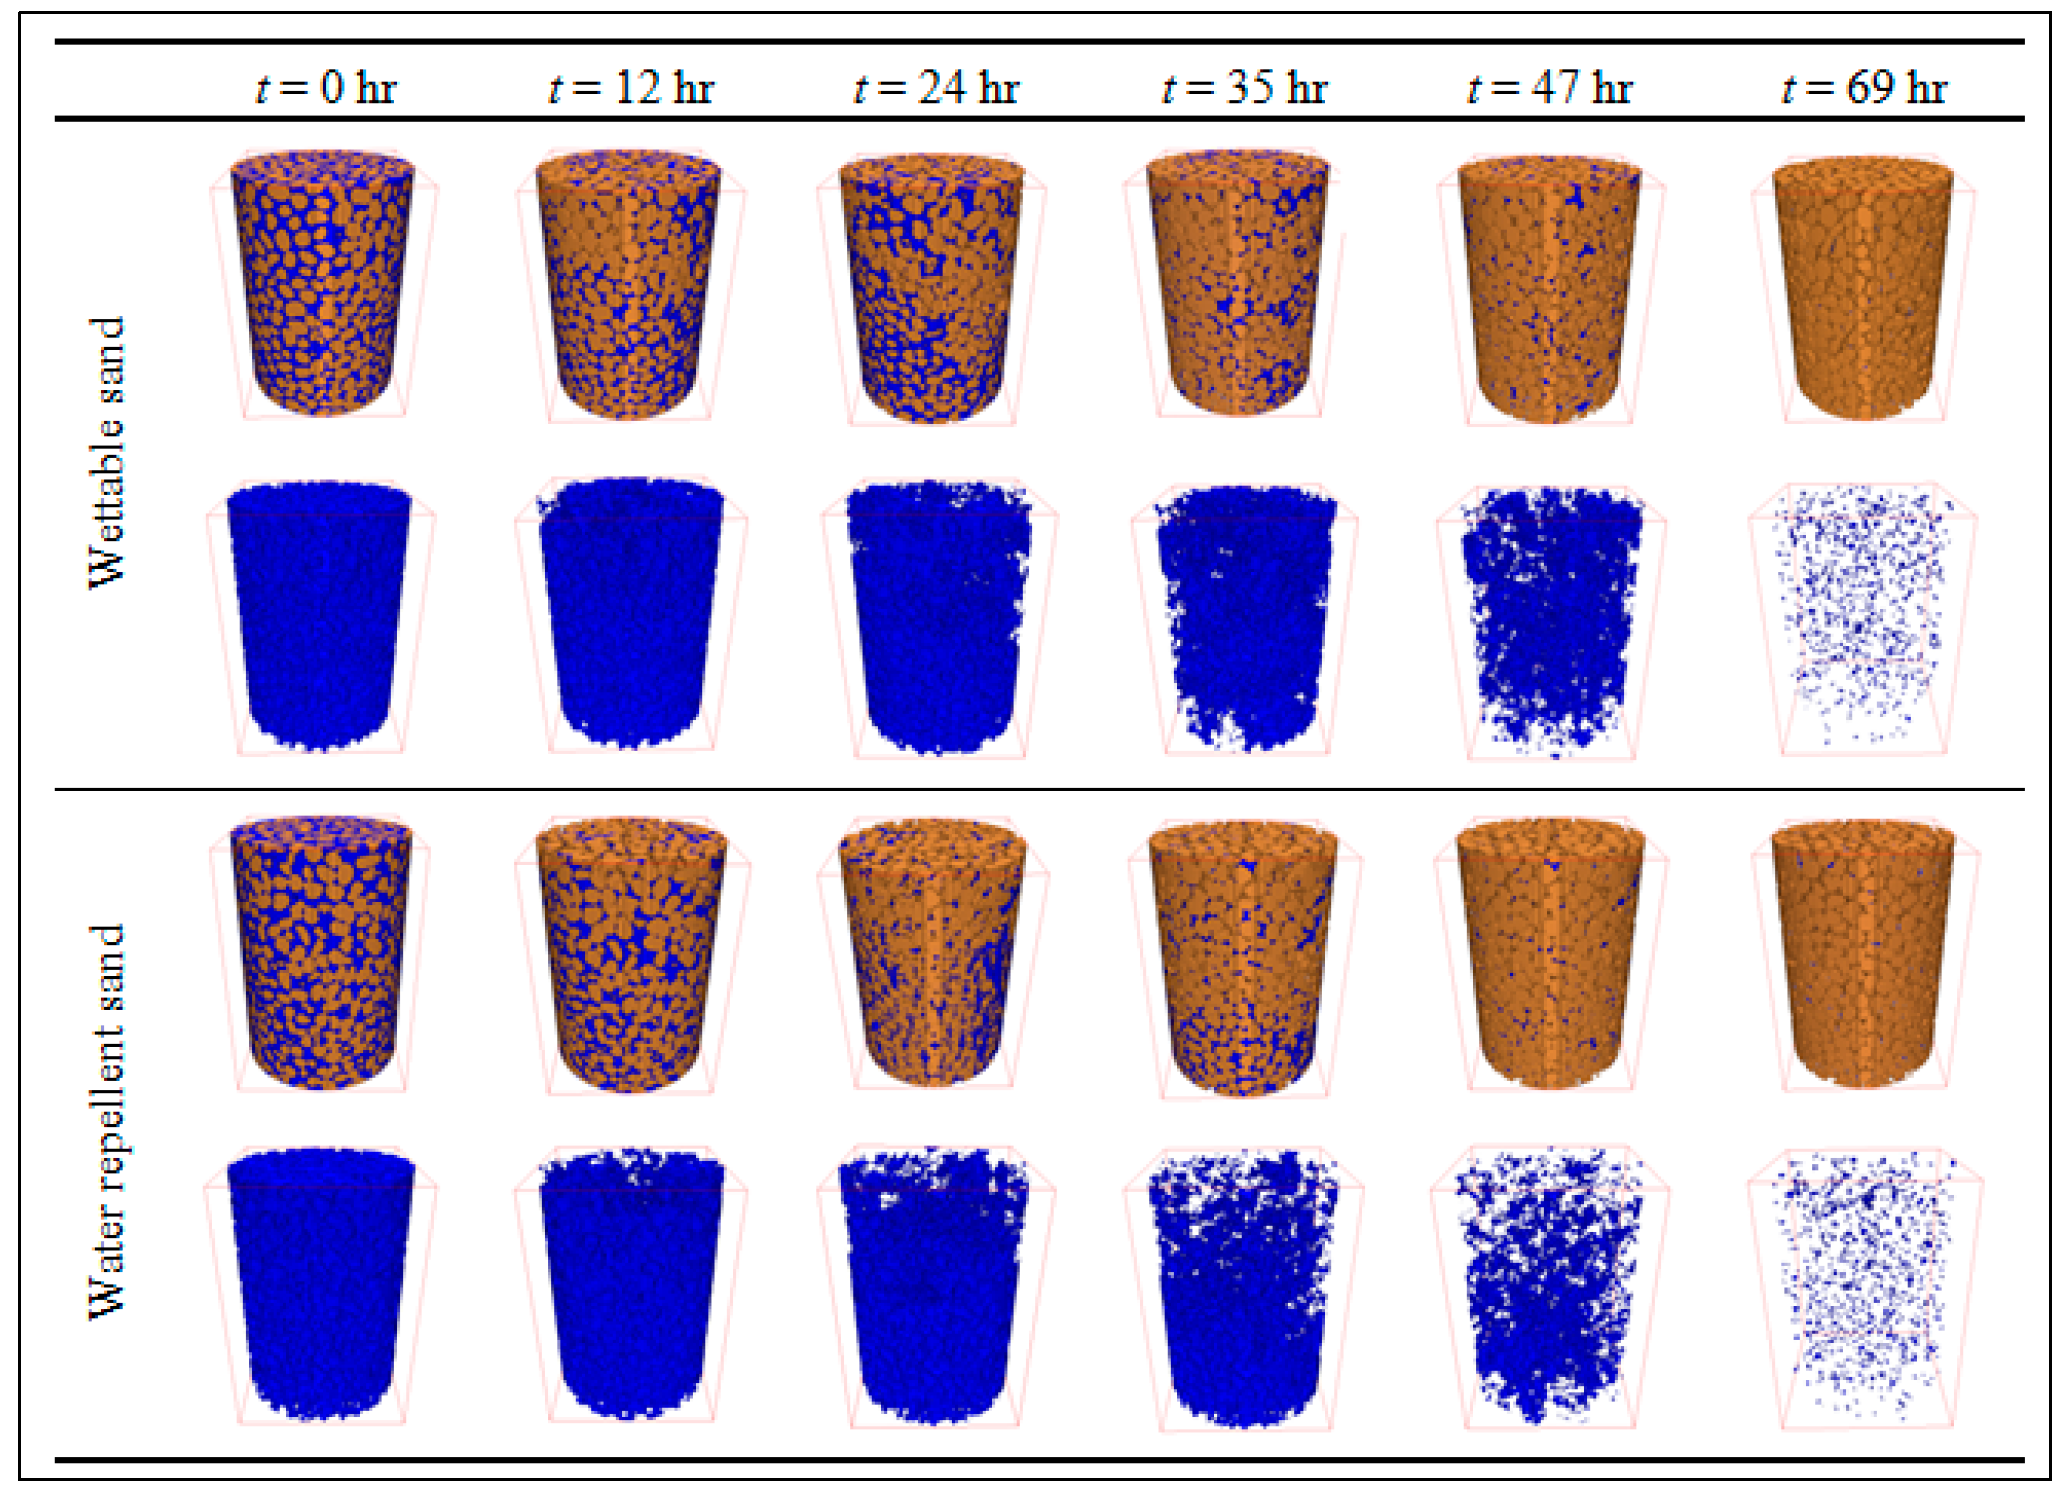
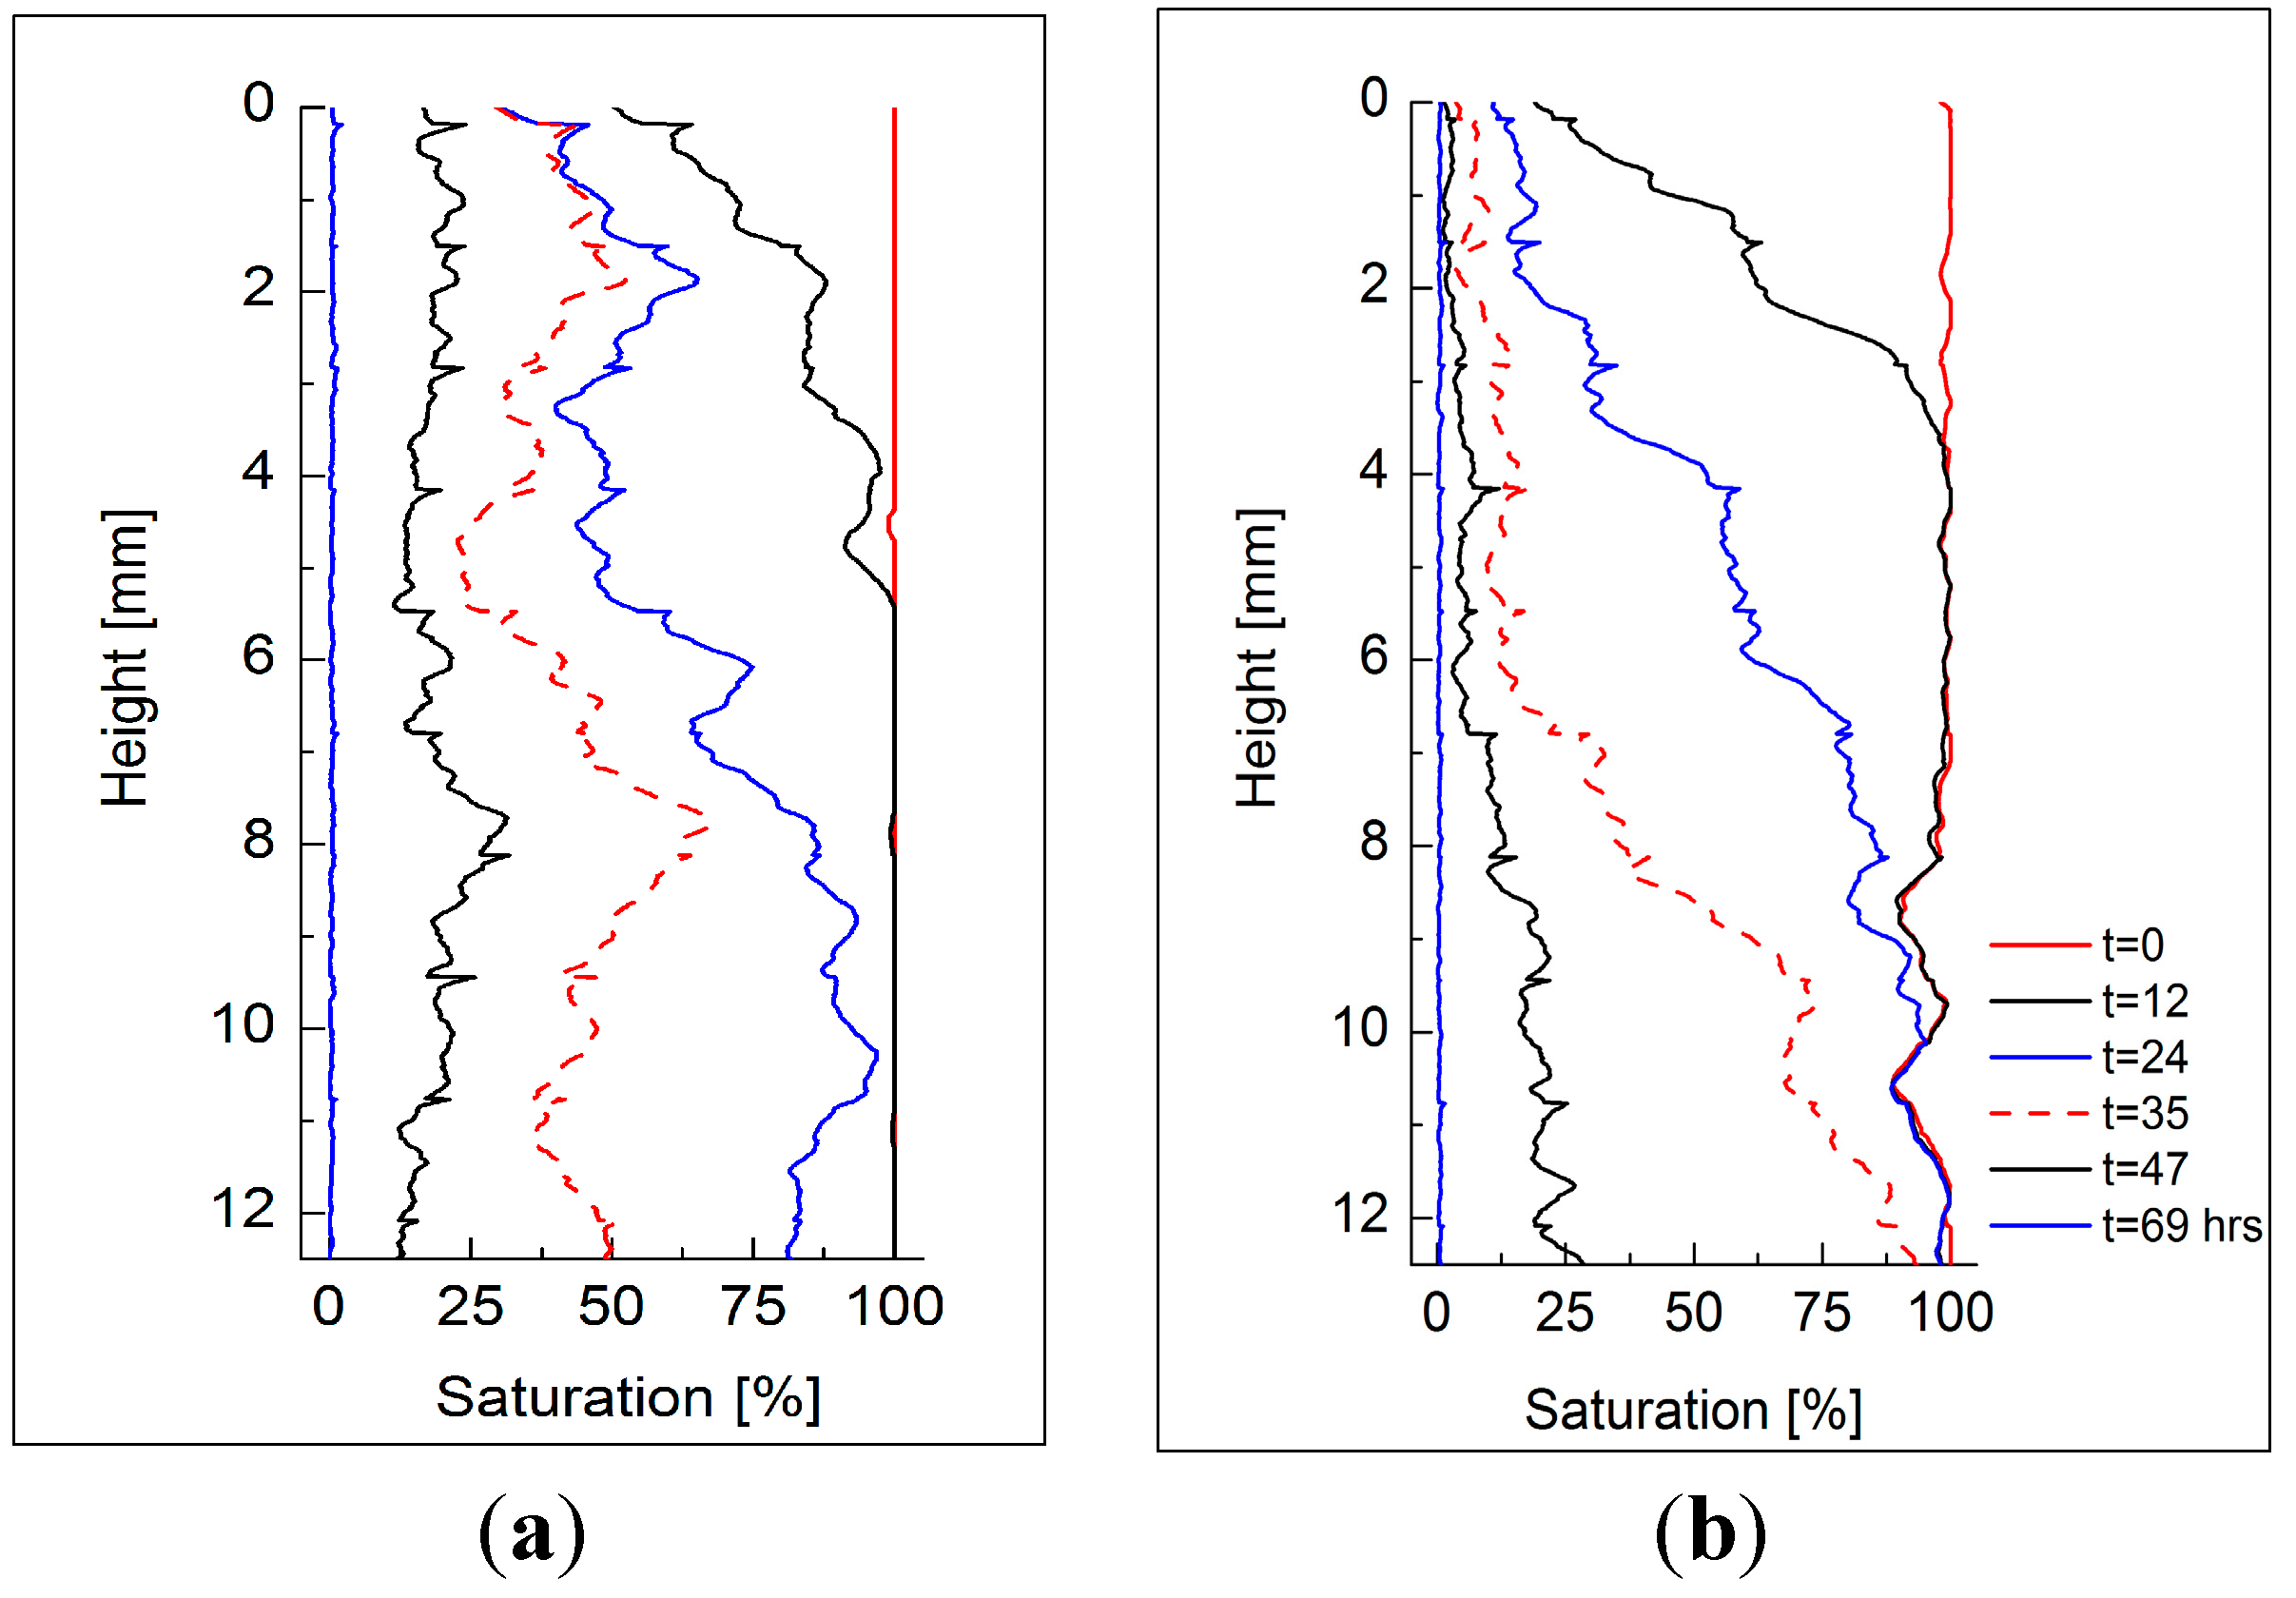
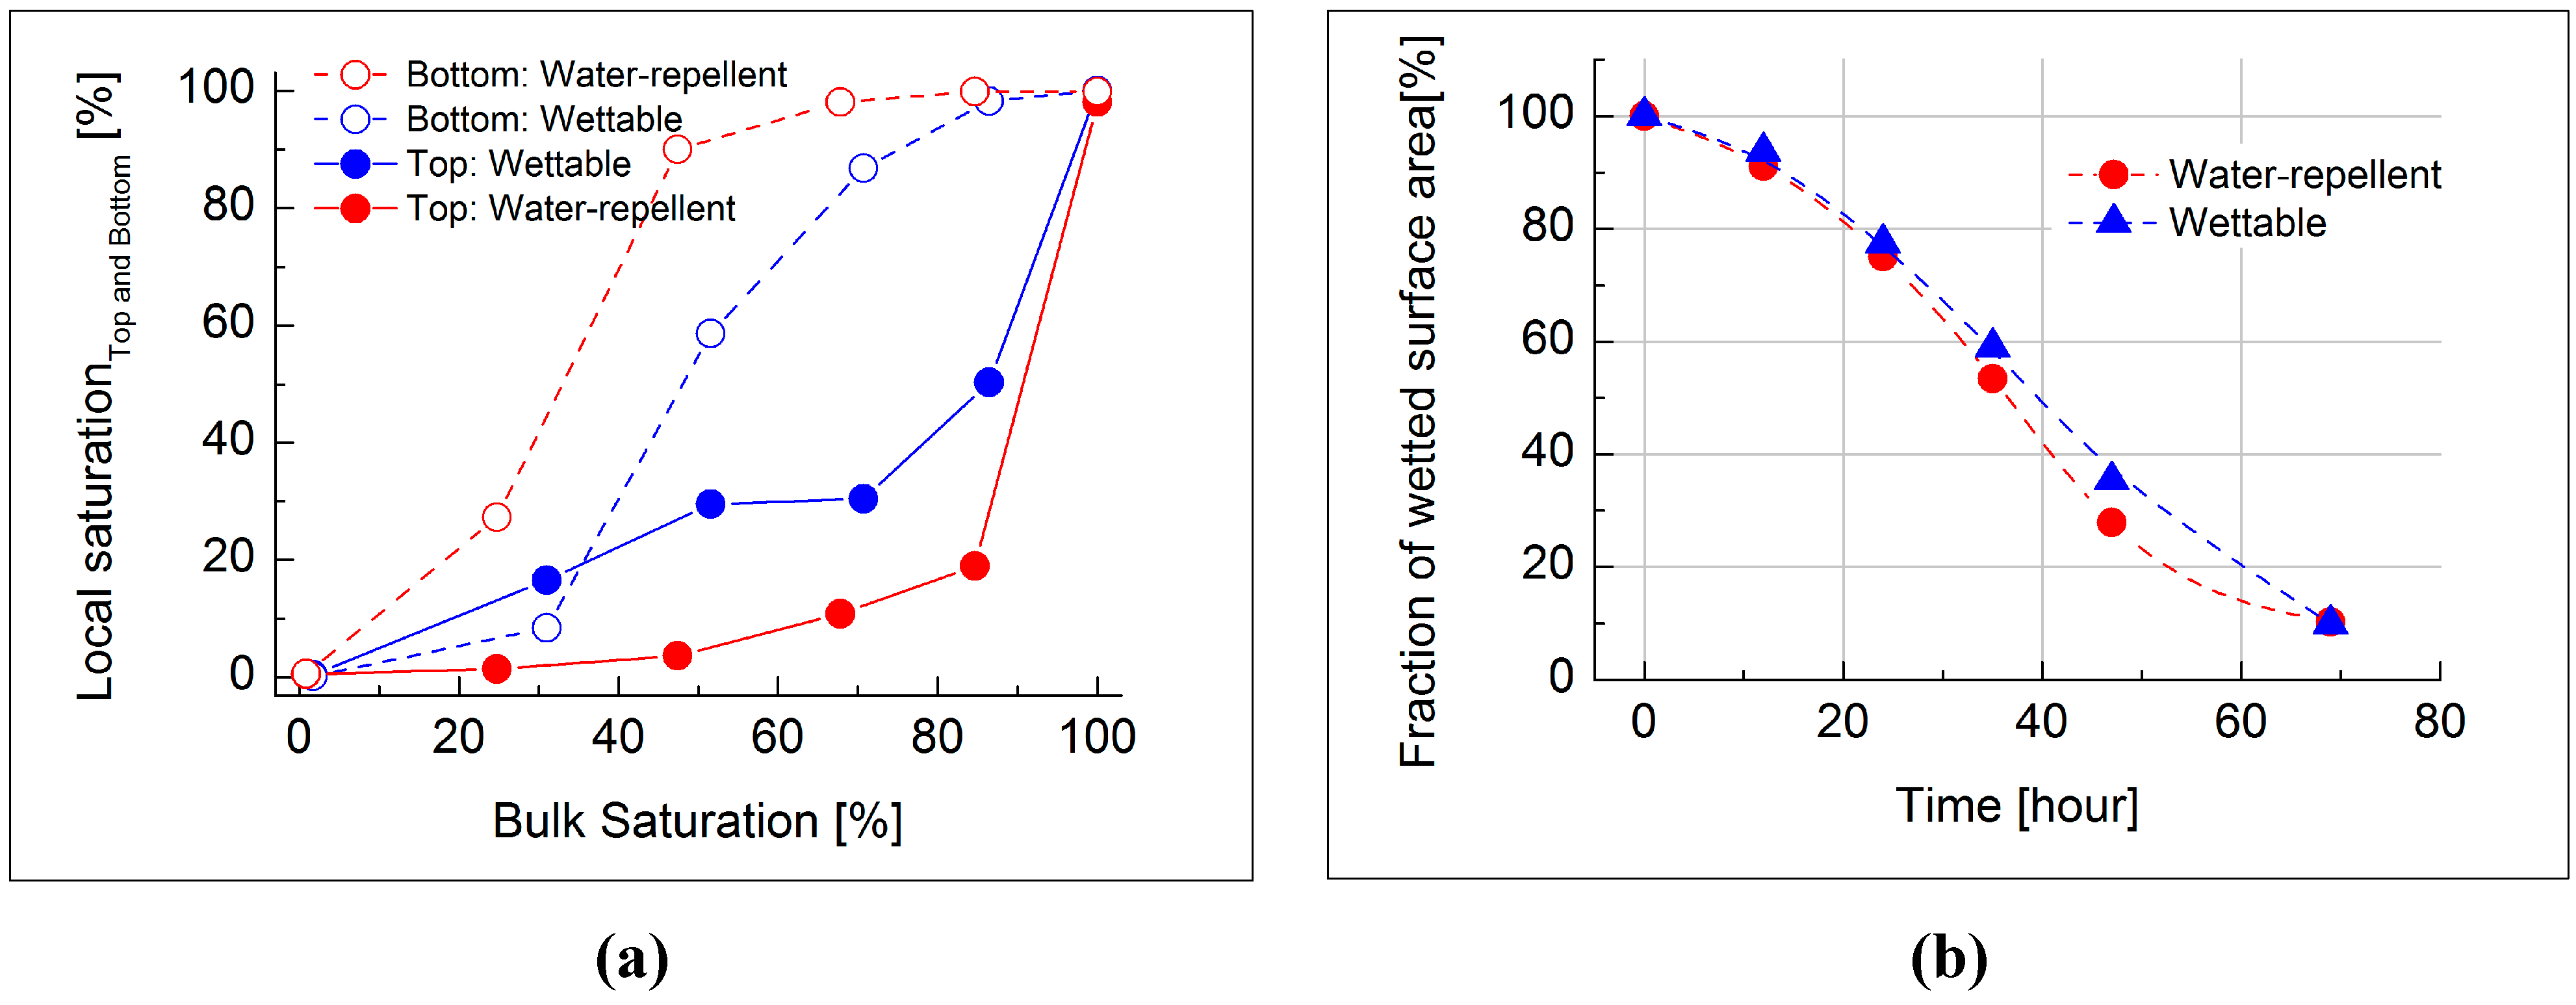
3.2. Evaporation Evaluated by 3D X-Ray Computed Tomography

The 2D sliced image in Figure 10a illustrates the spatial distribution of solid, liquid, and air phases, indicated by white, gray, and black colors, respectively. The water phase surrounding several sand particles is patchy. The histogram of pixel values in Figure 10b shows unique peaks for each of the three phases. Pixel values near the phase boundary inherently encounter gradual changes such that an unexpected water phase should be captured near solid-air phases, as shown in Figure 10c. Therefore, we implemented an iterative dilation-erosion method to eliminate the boundary; the solid phase is first dilated to remove the overlapping water phase, and the water phase is then dilated, so as to define the boundary pixels belonging to either the solid or water phase. The three phases are then clearly separated, as shown in Figure 10d. This procedure enables quasi-quantitative estimation of not only the overall degree of saturation, but also the saturation profile with depth. The changes in the degree of saturation determined by the weight measurements and the degree of saturation estimated by the 3D X-ray imaging are plotted in Figure 11. The values obtained by these two methods are in good agreement. In addition, the saturation of the water-repellent soil is slightly higher than that of the wettable soil. As the specimen depth is relatively small (~15 mm), the results obtained above are suggestive of stage 1 processes, in which capillarity prevails.
Figure 10. Phase distribution and segmentation of sliced image taken by X-ray computed tomographic imaging. (a) 2D sliced image of unsaturated Ottawa sand; (b) The corresponding histogram; (c) Unexpected water phase captured along the solid boundaries; (d) Segmented three phases of solid, water and air.
Sustainability 07 05648 g010
Figure 11. Degree of saturation computed by weight measurement and image processing for tested specimens with time.
Sustainability 07 05648 g011
The reconstructed 3D images in Figure 12 illustrate the characteristic spatial distribution of the water phase during evaporation. In the wettable sand, the evaporation takes place not only near the evaporation surface but also into the sand such that the specimen becomes similarly dry along the height. In contrast, in the water-repellent sand, the drying front gradually advances from the top to the bottom of the section. The saturation profiles plotted as a function of time in Figure 13 show that the evaporation depth of wettable sand propagates extensively into the soil, resulting in a relatively quasi-constant degree of saturation profile with depth. In water-repellent sand, the degree of saturation at the bottom of the section remains close to 100% after 35 h and saturation begins decreasing once the upper section is mostly evaporated. Local variations in the degree of saturation in the 5-mm thick zone at the top and bottom of the section are averaged and compared with the bulk saturation in Figure 14a. As the bulk saturation decreases, the local saturation equilibrates to ~40% for wettable sand, implying that evaporation prevails through the entire section. In contrast, for water-repellent sand, the top and bottom of the section are clearly differentiated, highlighting the fact that evaporation proceeds gradually from the top to the bottom of the section. Thus, in wettable sand, the hydraulically connected water phase facilitates evaporation by inter-connecting zones of partial wetting towards the evaporative surface. However, in water-repellent sands, wet and dry zones are distinct. It leads to conclude that the spatial distribution of the water phase is fully dominated by surface wettability, despite the similar levels of bulk saturation observed in both specimens and observations made in Figure 13 and Figure 14 are analogous to the previous study [22]. Figure 14b presents that the fraction of wetted particle surface with water (e.g., interfacial area between water and solid particles). As the evaporation proceeds, its value gradually decreases similarly to Figure 11, and the water-repellent sand exhibits slightly lower interfacial area due to the high contact angle, as anticipated. The scale of the specimen may correspond to that of stage 1 processes, in which the evaporation rate is constant. Therefore, the effective and macroscopic behavior is governed by wettability-dependent fluid configuration at the microscopic pore scale which is relevant to the physico-mechanical properties of the soil [26,27], despite the fact that the level of saturation observed at bulk scales is similar in different soils. Also, the unique evaporation is pronounced even at low levels of water repellency (e.g., contact angles of close to 90°).
Figure 12. Reconstructed configuration of 3D X-ray CT images with time.
Sustainability 07 05648 g012
Figure 13. Profiles of saturation with time for (a) wettable sand and (b) water-repellent sand specimens.
Sustainability 07 05648 g013
Figure 14. (a) Degree of saturation near the top and bottom section for tested specimens; (b) Fraction of water-sand particle interfacial area.
Sustainability 07 05648 g014

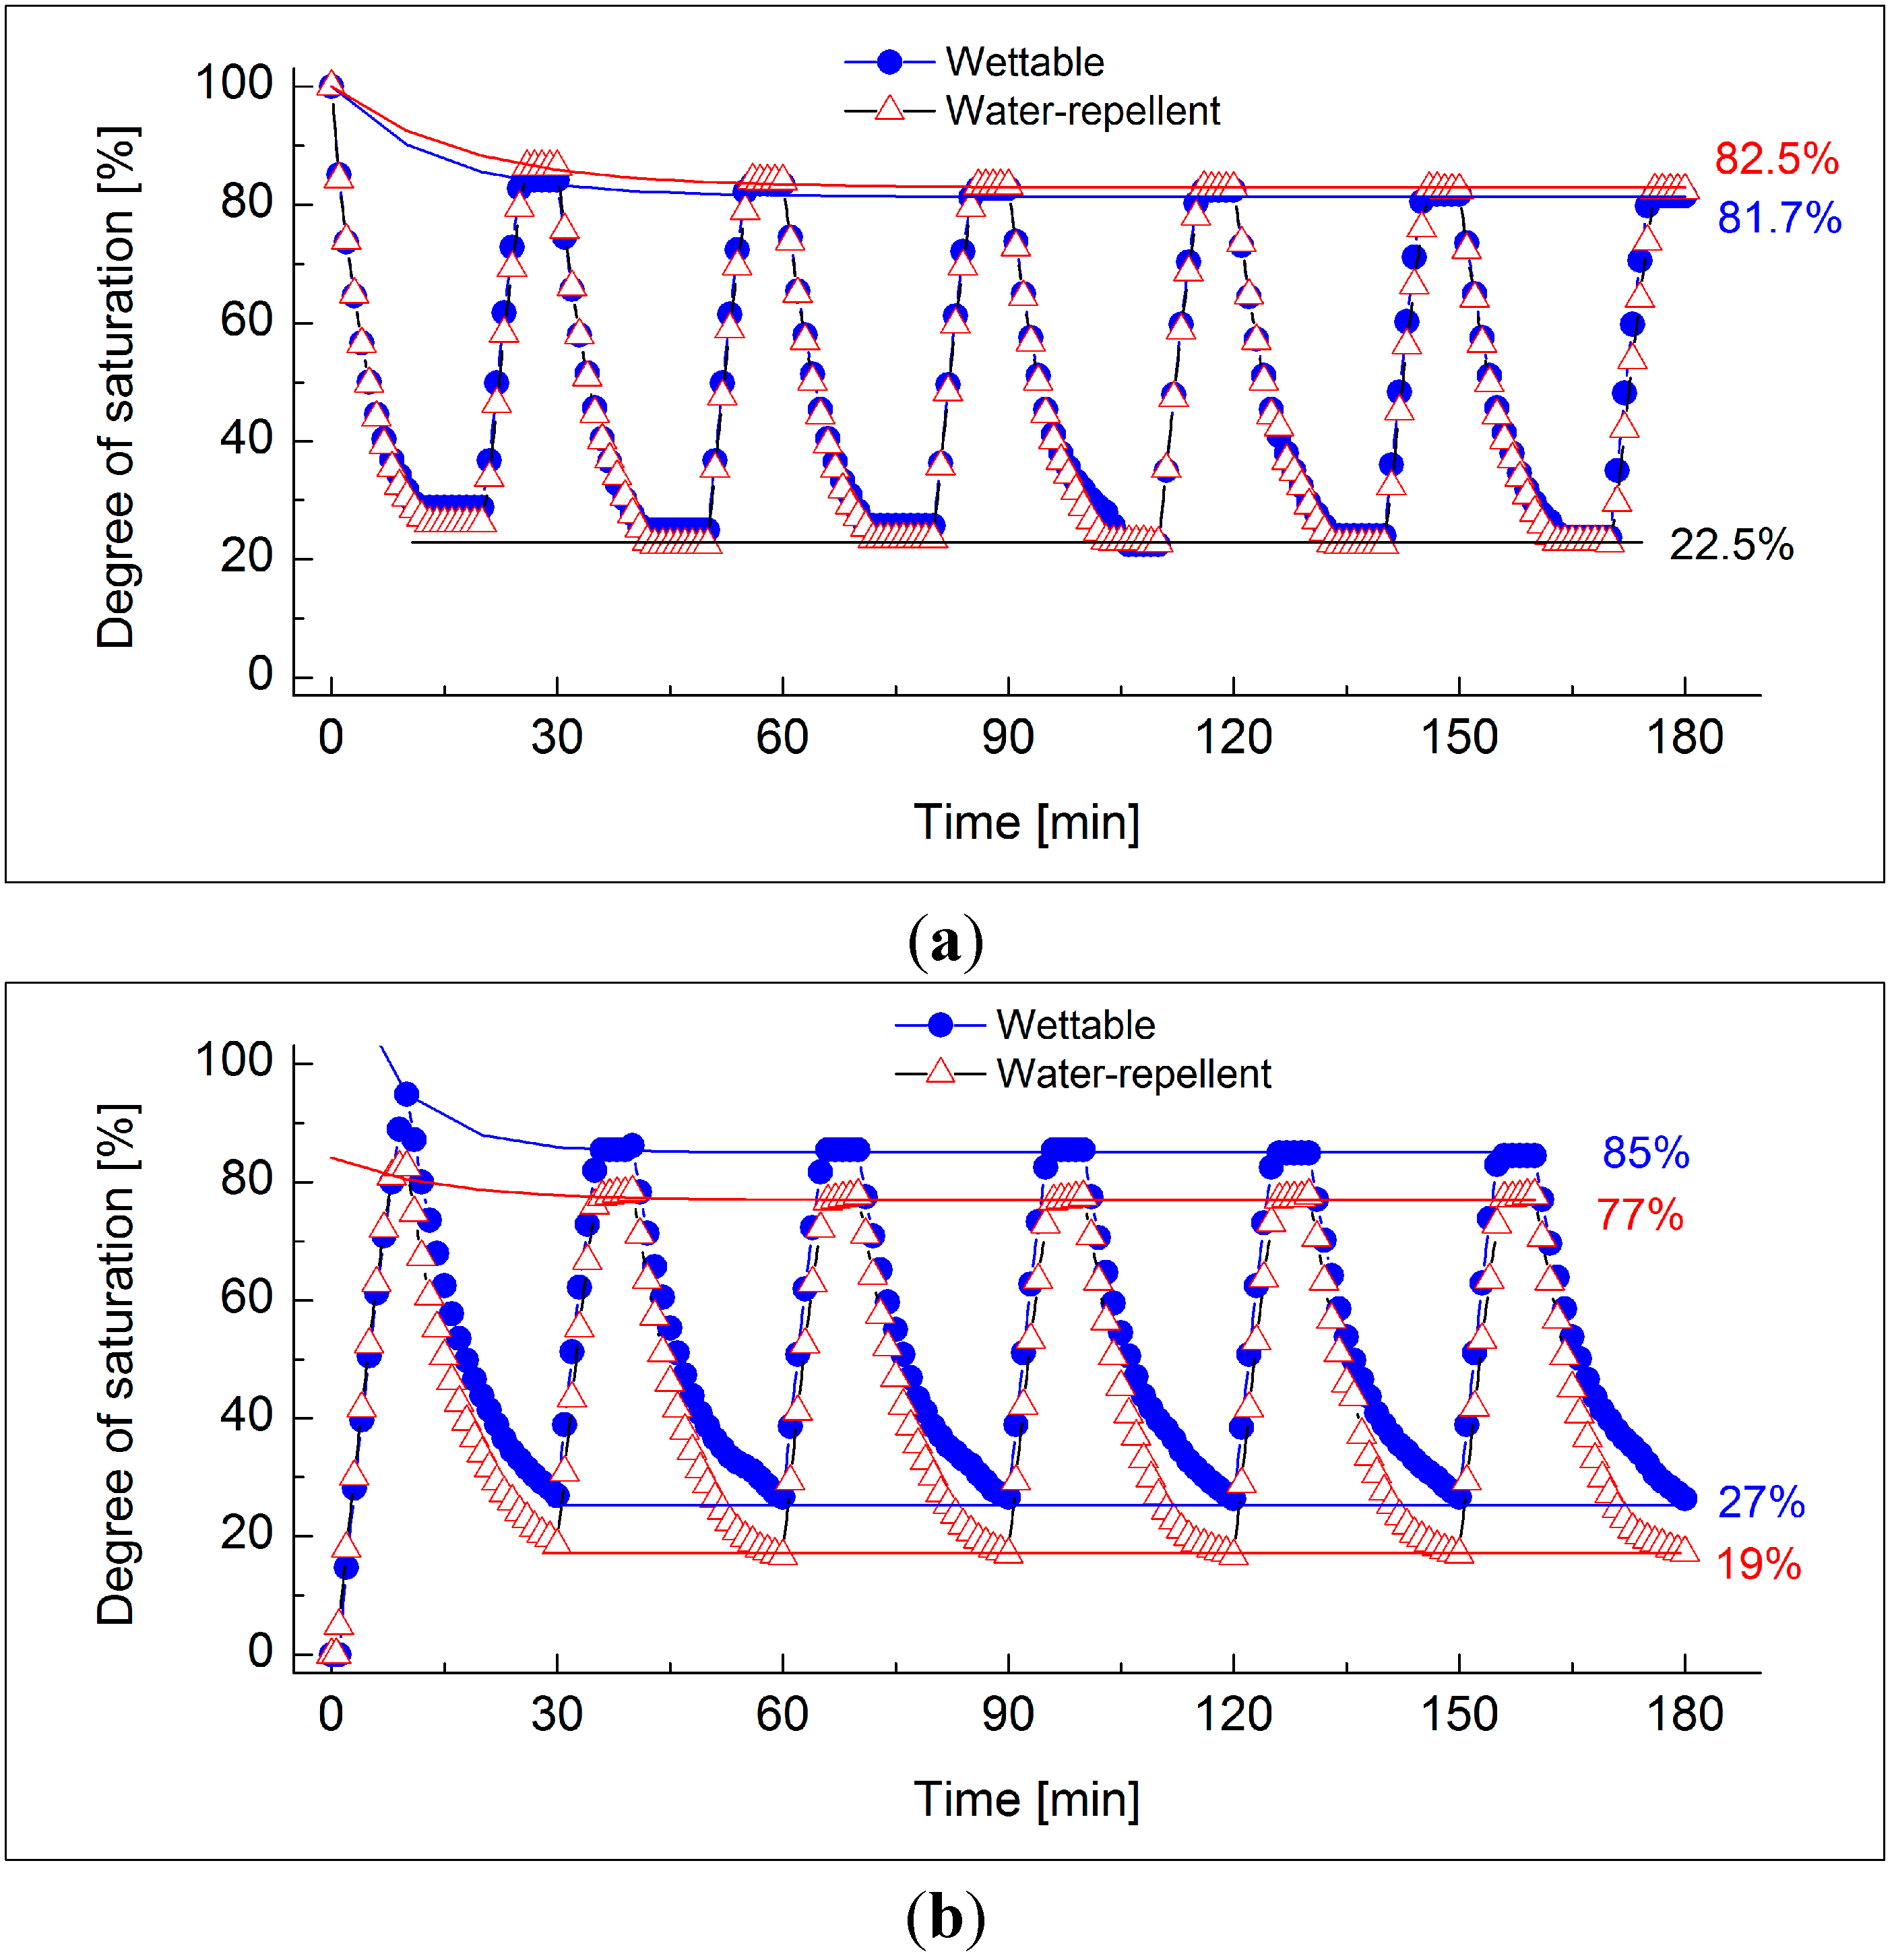
3.3. Cyclic Drainage and Infiltration

The changes in saturation during cyclic drainage and infiltration for initially wet and dry conditions are plotted in Figure 15.
Figure 15. Evolution of saturation for (a) initially wet and (b) initially dry conditions.
Sustainability 07 05648 g015
Initially saturated state (Figure 15a): From an initially saturated state, water was discharged, and upon drainage, the saturation in both specimens attained a value of ~22.5% and remained constant. Subsequent permeation resulted in a saturation of ~82% in both specimens. The similarity between the two specimens may be the result of minimized effects of surface wettability. As the sands are saturated and then drained, the particles in the discharged region remain wet, so that subsequent permeation readily wets the soils. The asymptotic value of saturation is obtained after the second cycle, and then remains identical in subsequent cycles.
Initially dry state (Figure 15b): In the initially dry state, for the wettable and water-repellent sands, the first permeation resulted in saturations of 95% and 82%, respectively, and subsequent drainage resulted in saturations of 27% and 19%, respectively. The second permeation induced lower values of saturation in both the wettable and water-repellent sands (85% and 77%, respectively), implying that the formation of capillary water may partially impede water permeation, as compared with the conditions of the initially wet specimens. Initially, dry wettable sand readily allows water permeation during low flow rate (i.e., the effects of fingering are reduced), such that a higher level of saturation occurs upon permeation. Unlike the analogous drainage pattern in Figure 15a, the more rapid drainage observed in the water-repellent sand for the initially dry condition indirectly confirms the formation of water migration pathways, although preferential flow is not directly measured in this test. Note that the difference between the saturation level for permeation and drainage is the same in both specimens (58%). The results of cyclic fluid flow emphasize that the initial state of wetting (saturated or dry) subsequently determines the water retention capacity.

4. Conclusions

The water-repellent sands were artificially synthesized using organo-silane to observe the water-repellency effect on evaporation and drainage compared with natural wettable sands. At the early stage of evaporation, both wettable and water-repellent sands exhibit the same evaporation rate dominated by boundary conditions and capillary effect. Then, the water-repellent Ottawa sand shows higher evaporation rate than wettable sand, while Jumunjin sand presents similar evaporation rates. The water-repellent sand tends to provide evaporation pathways when both wettable and water-repellent Ottawa sands are vertically in natural contact with each other. This experimental observation may be contradictory to previously reported evaporation results. The spatial distribution of the water phase during evaporation, as identified by 3D X-ray computed tomographic images, reveals that the drying front gradually advances from the evaporative boundary into pore spaces in the water-repellent sand while it deeply penetrates into the sand to form uniformly distributed partially saturated zones in wettable sand, corroborated by other studies. The initial wetting condition determines drainage behaviors, while surface wettability effects are less prominent than the effects of evaporation. Yet, the time-dependent drainage behaviors suggest the uniqueness of water retention capacities. It leads to the conclusion that the surface wettability may not be a sole attribution while the degree of wettability, particle shape and size, the corresponding pore size distribution and initial wetting condition are predominant and their effects should be considered when assessing the evolution of evaporation and drainage behaviors.

Acknowledgments

This research was supported by the National Research Foundation of Korea (NRF) and the Korea CCS R&D Center (KCRC) grants funded by the Korea government (MSIP) (2013035972, 2011-0030040, 2011-0022883).

Author Contributions

The authors Dae Hyun Kim and Heui Jean Yang designed and performed the experiments; Kwang Yeom Kim contributed the analysis tool and analyzed the X-ray CT data; Tae Sup Yun leaded the study and wrote the manuscript.

Conflicts of Interest

The authors declare no conflict of interest.References

References

  1. Pierson, F.B.; Robichaud, P.R.; Moffet, C.A.; Spaeth, K.E.; Williams, C.J.; Hardegree, S.P.; Clark, P.E. Soil water repellency and infiltration in coarse-textured soils of burned and unburned sagebrush ecosystems. Catena 2008, 74, 98–108. [Google Scholar] [CrossRef]
  2. DeBano, L.F.; Savage, S.M.; Hamilton, D.A. The transfer of heat and hydrophobic substances during burning. Soil Sci. Am. J. 1976, 40, 779–782. [Google Scholar] [CrossRef]
  3. Franco, C.M.M.; Clarke, P.J.; Tate, M.E.; Oades, J.M. Hydrophobic properties and chemical characterisation of natural water repellent materials in Australian sands. J. Hydrol. 2000, 231, 47–58. [Google Scholar] [CrossRef]
  4. Mataix-Solera, J.; Garcia-Irles, L.; Morugan, A.; Doerr, S.H.; Garcia-Orenes, F.; Arcenegui, V.; Atanassova, I. Longevity of soil water repellency in a former wastewater disposal tree stand and potential amelioration. Geoderma 2011, 165, 78–83. [Google Scholar] [CrossRef]
  5. Burch, G.J.; Moore, I.D.; Burns, J. Soil hydrophobic effects on infiltration and catchment runoff. Hydrol. Process. 1989, 3, 211–222. [Google Scholar] [CrossRef]
  6. Doerr, S.H.; Shakesby, R.A.; Blake, W.H.; Chafer, C.J.; Humphreys, G.S.; Wallbrink, P.J. Effects of differing wildfire severities on soil wettability and implications for hydrological response. J. Hydrol. 2006, 319, 295–311. [Google Scholar] [CrossRef]
  7. Scott, D.F. Soil wettability in forested catchments in South Africa; as measured by different methods and as affected by vegetation cover and soil characteristics. J. Hydrol. 2000, 231, 87–104. [Google Scholar] [CrossRef]
  8. Etkin, D.S. Historical overview of oil spills from all sources (1960–1998). In Proceedings of the International Oil Spill Conference (IOSC 1999), Seattle, WA, USA, 8–11 March 1999; pp. 1097–1102.
  9. Jarvis, N.; Etana, A.; Stagnitti, F. Water repellency, near-saturated infiltration and preferential solute transport in a macroporous clay soil. Geoderma 2008, 143, 223–230. [Google Scholar] [CrossRef]
  10. Bauters, T.W.J.; DiCarlo, D.A.; Steenhuis, T.S.; Parlange, J.-Y. Preferential flow in water-repellent sands. Soil Sci. Soc. Am. J. 1998, 62, 1185–1190. [Google Scholar] [CrossRef]
  11. Bauters, T.W.J.; Steenhuis, T.S.; DiCarlo, D.A.; Nieber, J.L.; Dekker, L.W.; Ritsema, C.J.; Parlange, J.-Y.; Haverkamp, R. Physics of water repellent soils. J. Hydrol. 2000, 231–232, 233–243. [Google Scholar] [CrossRef]
  12. Carrillo, M.L.K.; Letey, J.; Yates, S.R. Unstable water flow in a layered soil: II. Effects of an unstable water-repellent layer. Soil Sci. Soc. Am. J. 2000, 64, 456–459. [Google Scholar] [CrossRef]
  13. Dekker, L.W.; Ritsema, C.J. Uneven moisture patterns in water repellent soils. Geoderma 1996, 70, 87–99. [Google Scholar] [CrossRef]
  14. Goebel, M.-O.; Bachmann, J.; Woche, S.K.; Fischer, W.R. Soil wettability, aggregate stability, and the decomposition of soil organic matter. Geoderma 2005, 128, 80–93. [Google Scholar] [CrossRef]
  15. Bodi, M.B.; Doerr, S.H.; Cerda, A.; Mataix-Solera, J. Hydrological effects of a layers of vegegation ash on underlying wettable and water repellent soil. Geoderma 2012, 191, 14–23. [Google Scholar] [CrossRef]
  16. Blackwell, P.S. Management of water repellency in Australia, and risks associated with preferential flow, pesticide concentration and leaching. J. Hydrol. 2000, 231–232, 384–395. [Google Scholar] [CrossRef]
  17. Braun, B.; Bockelmann, U.; Grohmann, E.; Szewzyk, U. Bacterial soil communities affected by water-repellency. Geoderma 2010, 158, 343–351. [Google Scholar] [CrossRef]
  18. Baruah, T.C.; Hasegawa, S. In-situ measurement of soil evaporation from a volcanic ash soil by TDR technique using soil water diffusivity. Geoderma 2001, 102, 317–328. [Google Scholar] [CrossRef]
  19. Lehmann, P.; Assouline, S.; Or, D. Characteristic lengths affecting evaporative drying of porous media. Phys. Rev. E 2008, 77. [Google Scholar] [CrossRef]
  20. Lehmann, P.; Or, D. Hydromechanical triggering of landslides: From progressive local failures to mass release. Water Resour. Res. 2012, 48. [Google Scholar] [CrossRef]
  21. Yiotis, A.G.; Boudouvis, A.G.; Stubos, A.K.; Tsimpanogiannis, I.N.; Yortsos, Y.C. Effect of liquid films on the drying of porous media. AIChE J. 2004, 50, 2721–2737. [Google Scholar] [CrossRef]
  22. Shokri, N.; Lehmann, P.; Or, D. Liquid-phase continuity and solute concentration dynamics during evaporation from porous media: Pore-Scale processes near vaporization surface. Phys. Rev. E 2010, 81. [Google Scholar] [CrossRef]
  23. Frattolillo, A.; Giovinco, G.; Mascolo, M.C.; Vitale, A. Effects of hydrophobic treatment on thermophysical properties of lightweight mortars. Exp. Therm. Fluid Sci. 2005, 29, 733–741. [Google Scholar] [CrossRef]
  24. Nguyen, B.-L.; Bruining, J.; Slob, E.C. Effects of wettability on dielectric properties of porous media. In Proceedings of the 1999 SPE Annual Technical Conferences and Exhibition, Houston, TX, USA, 3–8 October 1999; pp. 153–160.
  25. Kim, D.H.; Kim, Y.J.; Lee, J.-S.; Yun, T.S. Thermal and electrical response of unsaturated hydrophilic and hydrophobic granular materials. Geotechn. Test. J. 2011, 34, 1–9. [Google Scholar]
  26. Byun, Y.-H.; Tran, M.K.; Yun, T.S.; Lee, J.-S. Strength and stiffness characteristics of unsaturated hydrophobic granular media. Geotechn. Test. J. 2012, 35, 1–8. [Google Scholar]
  27. Truong, Q.H.; Lee, J.-S.; Dong, Y.; Yun, T.S. Capillary induced small-strain stiffness for hydrophilic and hydrophobic granular materials: Experimental and numerical studies. Soils Found. 2011, 51, 713–721. [Google Scholar] [CrossRef]
  28. Bachmann, J.; Horton, R.; van der Ploeg, R.R.; Woche, S. Modified sessile drop method for assessing initial soil-water contact angle of sandy soil. Soil Sci. Soc. Am. J. 2000, 64, 564–567. [Google Scholar] [CrossRef]
  29. Otsu, N. A threshold selection method from gray-level histogram. IEEE Trans. Syst. Man Cybernet. 1979, 9, 62–66. [Google Scholar] [CrossRef]
  30. Shokri, N.; Lehmann, P.; Or, D. Characteristics of evaporation from partially wettable porous media. Water Resour. Res. 2009, 45. [Google Scholar] [CrossRef]

