The Unsustainable Trend of Natural Hazard Losses in the United States

Abstract
: In the United States, direct losses from natural hazards are on the rise with hurricanes, flooding, and severe storms contributing about three quarters of the total damages. While losses from severe storms have been stable over the past fifty years, hurricane and flood losses have tripled. Per capita losses are also increasing showing that impacts outpace population growth with high per capita losses occurring largely in the Southeast and Midwest. If the loss escalation of the past two decades continues into the future, then direct losses of $300 to $400 billion within a single decade are possible. In order to reverse this trend, sustainable development, vulnerability reduction, and hazard mitigation must become priorities and current loss reduction efforts need to be evaluated and re-assessed in terms of their effectiveness. These conclusions are drawn from the analysis of spatial and temporal trends in direct losses from natural hazards using SHELDUS™ data from 1960 through 2009. Loss data are adjusted for inflation, population, and wealth to capture both trends in total losses and per capita losses. The loss data are then compared to disaster-related federal government and private insurance expenditures.1. Introduction
It should not come as a surprise that we are in a new era of catastrophes [1].The concentration of more people and assets in hazardous areas are eradicating marginal improvements in resilience and hazard mitigation while at the same time new vulnerabilities and new hazards are emerging [2-5]. The devastating Haitian earthquake in 2010 exemplified traditional drivers of disaster—social, economic and political vulnerabilities combined with a highly inadequate built environment. On the other hand the 2010 eruption of the Eyjafjallaj(x00151)kull volcano in Iceland or the apocalyptic destruction of the 2011 Japan earthquake and tsunami revealed the creation of new hazards and vulnerabilities rooted in the complexities of today's world and for which society seems ill-prepared.
To make matters worse, climate change will certainly alter—or perhaps already has—the magnitude and frequency of hydrological and meteorological disasters. This could cause disasters to become more severe and frequent and may introduce new hazards in areas unfamiliar with them [6-8].
Insurance and re-insurance companies are already factoring issues of climate change and rising hazard losses into their long-term strategies and premium calculations—even serving as lead authors to climate change publications [9-11]. These companies have moved past the point of political and scientific disputes surrounding the new era of catastrophes and climate change in order to protect their bottom-line. The insurance industry manages its portfolio exposure by not only raising premiums—particularly on 2011 renewal policies [12] but also they have changed internal risk assessment procedures by drawing on scientific evidence, proprietary loss records, geospatial technologies, and detailed loss accounting [13].
And what is society doing to reduce exposure, curb losses and minimize the impact of future hazards? The answer: not enough to even stabilize losses. Although we are well aware that disasters can cripple entire countries, society and political leadership are ignoring the unsustainable trend of natural hazard impacts and losses. The United States, like many other countries, are stuck in a quagmire of ideological discussion surrounding climate change and its effects on natural hazards, stove piped efforts in loss accounting and underwhelming efforts in hazard mitigation [14-20].
This paper reveals rising trends in direct losses from natural hazards (1960–2009) in the United States based on total as well as per capita losses. It identifies parallels to insured losses and federal disaster funding and discusses future implications of “business as usual” approaches to disasters. We argue that the inability to fully quantify the economically devastating impacts of disasters is a serious shortcoming of existing hazard reduction policies at local, state, and federal levels. The result is our collective inability to adequately gauge the potential effectiveness of any loss reduction action or policy, as we have no baseline data upon which to measure progress.
2. Background
In order to enhance the sustainability and resilience of communities, meaning their long-term social, economic, and environmental viability and quality for future generations, it is essential to quantify and understand the impacts of natural hazards and to act upon this knowledge. The ability to assess losses and costs associated with natural hazards is essential for better decision-making on the type and degree of public assistance, hazard mitigation alternatives, disaster recovery, and community reconstruction [21]. In fact, Gilbert F. White [22] attributed the failed effort of cutting hazard losses in half by the year 2000 to an incomplete understanding of the complexity of the problem and a lacking recognition of the importance of issues such as public assistance, building codes, insurance, and so forth. With much foresight, White called for an “earnest examination of the information and policy affecting development decisions and the ways in which they will shape a sustainable society in an unimpaired environment. Better hazard maps, more refined forecasts, and more efficient emergency operations will be important but they will not necessarily reduce damages, and they neglect the measures that might assure sound use of hazardous areas” ([23] page 1240).
Comprehensively evaluating disaster loss reduction policies requires sound baseline data to measure and monitor policy effectiveness. Only a few publicly accessible, national and global databases (e.g., SHELDUS™, EM-DAT, and DesInventar) allow for multi-hazard studies, although not necessarily multi-loss type studies. Private databases, such as those used by the insurance industry include multiple perils, but are largely inaccessible to non-insurance-related groups. This disparate and stove piped approach to record-keeping across public and private entities, the lack of comprehensive accounting of indirect and uninsured losses, the varying data quality and the absence of data standards significantly hampers the soundness and reliability of any loss estimations from natural hazards [24-26]. Empirical and conceptual issues also impede a realistic estimation of losses resulting in incomplete loss quantification. Direct measurements such as property damage continue to dominate other measurements such as indirect loss estimations or the use of stock and flow measurements [20,27]. Equally dominant are the use of insured losses over uninsured losses, the focus on immediate losses over long-term effects, as well as the quantification of economic losses over other relevant areas such as the environment (e.g., species decline, environmental degradation, etc.) and society. Societal impacts tend to be quantified only in terms of injuries and fatalities without considering effects such as loss in quality of life, changes in social capital, and so forth [28-30]. To further complicate loss estimations, many of these measurements overlap making it difficult to avoid double-counting [18,31,32]. For example, some direct losses are insurable (e.g., property damages) as are some indirect losses (e.g., business interruptions).
Consequently, the vast majority of studies examining losses from natural hazards are incomplete because they exclusively focus on direct economic, human, or insured losses. Despite these shortcomings, most of these studies agree on the existence of two diverging loss trends in the United States: a decline in human losses and a rise in economic losses [2,10,33,34]. In terms of human losses, Borden and Cutter [28], for example, show that heat waves and high frequency events such as severe storms cause the most fatalities over time. Many of these fatalities are accidental (e.g., vehicle crash, hypothermia) and/or affect highly vulnerable populations such as the elderly who are particularly at risk during heat waves [35]. Acting upon and incorporating this empirical knowledge on social vulnerabilities and triggers of hazard mortality into the design of early warning system, public outreach and education initiatives has made society more resilient and reduced loss of life from natural hazards [36,37].
On the other hand, direct and insured economic losses increased over the same time period [33,38-40]. Unfortunately, many loss studies center on a single (or few) hazard type(s) making it impossible to capture the cumulative impact of natural hazards due to the sporadic nature of events [41-43]. While such studies are crucially important to advance our understanding of specific hazards and their spatial and temporal effects, they are inadequate in capturing how much natural hazards cost society as a whole.
Another empirically contested area is the possible impact of climate change on natural hazards and associated losses [41]. While a legitimate research subject, it is extremely difficult to predict losses and to distinguish between social and climatic drivers of future losses when current losses are barely understood. Despite their intellectual merit in terms of communicating potential future loss, modeled loss predictions are highly unreliable given the shortcomings of existing loss data and methods in addition to challenges associated with predicting changes in social vulnerability and down-scaling climate change effects [19,25,26,44].
To understand future hazards and to identify effective adaptation strategies, it is imperative to devise a broader and more comprehensive approach to loss estimations that captures and informs current state of hazards and hazard policies. Examples exist, such as work on normalized losses or modeled losses of past events under today's social, economic, and/or environmental conditions [45-48]. Additionally needed are: (a) comparative research across space and time to reveal differential impacts; (b) new and more comprehensive approaches for loss estimation; (c) augmentation of public data repositories with loss measures beyond direct impacts; and (d) policy evaluations connecting natural hazard losses to spending on hazard mitigation, public and individual disaster assistance, and post-disaster recovery costs. This paper speaks partially to (a) and (d) by investigating direct loss trends in total as well as relative terms across space and time and by comparing direct losses to federal disaster assistance payments and insured losses.
3. Natural Hazard Loss Datasets
This paper utilizes SHELDUS™ [49], the best freely available data source for direct property and crop losses from natural hazards in the United States, to highlight spatial and temporal trends in natural hazard losses between 1960 and 2009 (Table 1). SHELDUS™ consolidates loss databases from the National Climatic Data Center, the US Geological Survey, and others across a wide range of natural hazards and provides a conservative estimate of direct losses. Agencies such as the National Climatic Data Center follow an elaborate loss estimation protocol [50], and to maintain the accuracy of these estimates, SHELDUS™ manipulates original estimates as minimally as possible. SHELDUS™ does not provide original loss estimates, instead it collates and geocodes existing loss estimates from governmental sources. For the purpose of providing county-level data, SHELDUS™ equally distributes losses across counties and wherever loss ranges are provided, SHELDUS™ reports only the lowest estimate. For example, if NCDC reported a severe thunderstorm event for Richland and Lexington Counties in South Carolina that caused between $50,000 and $500,000 in losses then SHELDUS™ integrates the events as a loss of $25,000 for Richland County and $25,000 for Lexington County, thus providing a conservative estimate of total losses. SHELDUS™ maintains the hazard classification and only assigns one or more broad hazard categories for database querying purposes. Thus, SHELDUS™ does not reclassify original loss estimates, but it does distribute losses for georeferencing purposes only. For more information on the specifics of SHELDUS™, please visit the data provider's website [49]. Gall et al. [25] provide an in-depth discussion of SHELDUS™ and other loss databases including NCDC's Storm Data and Munich Re's NATHAN.
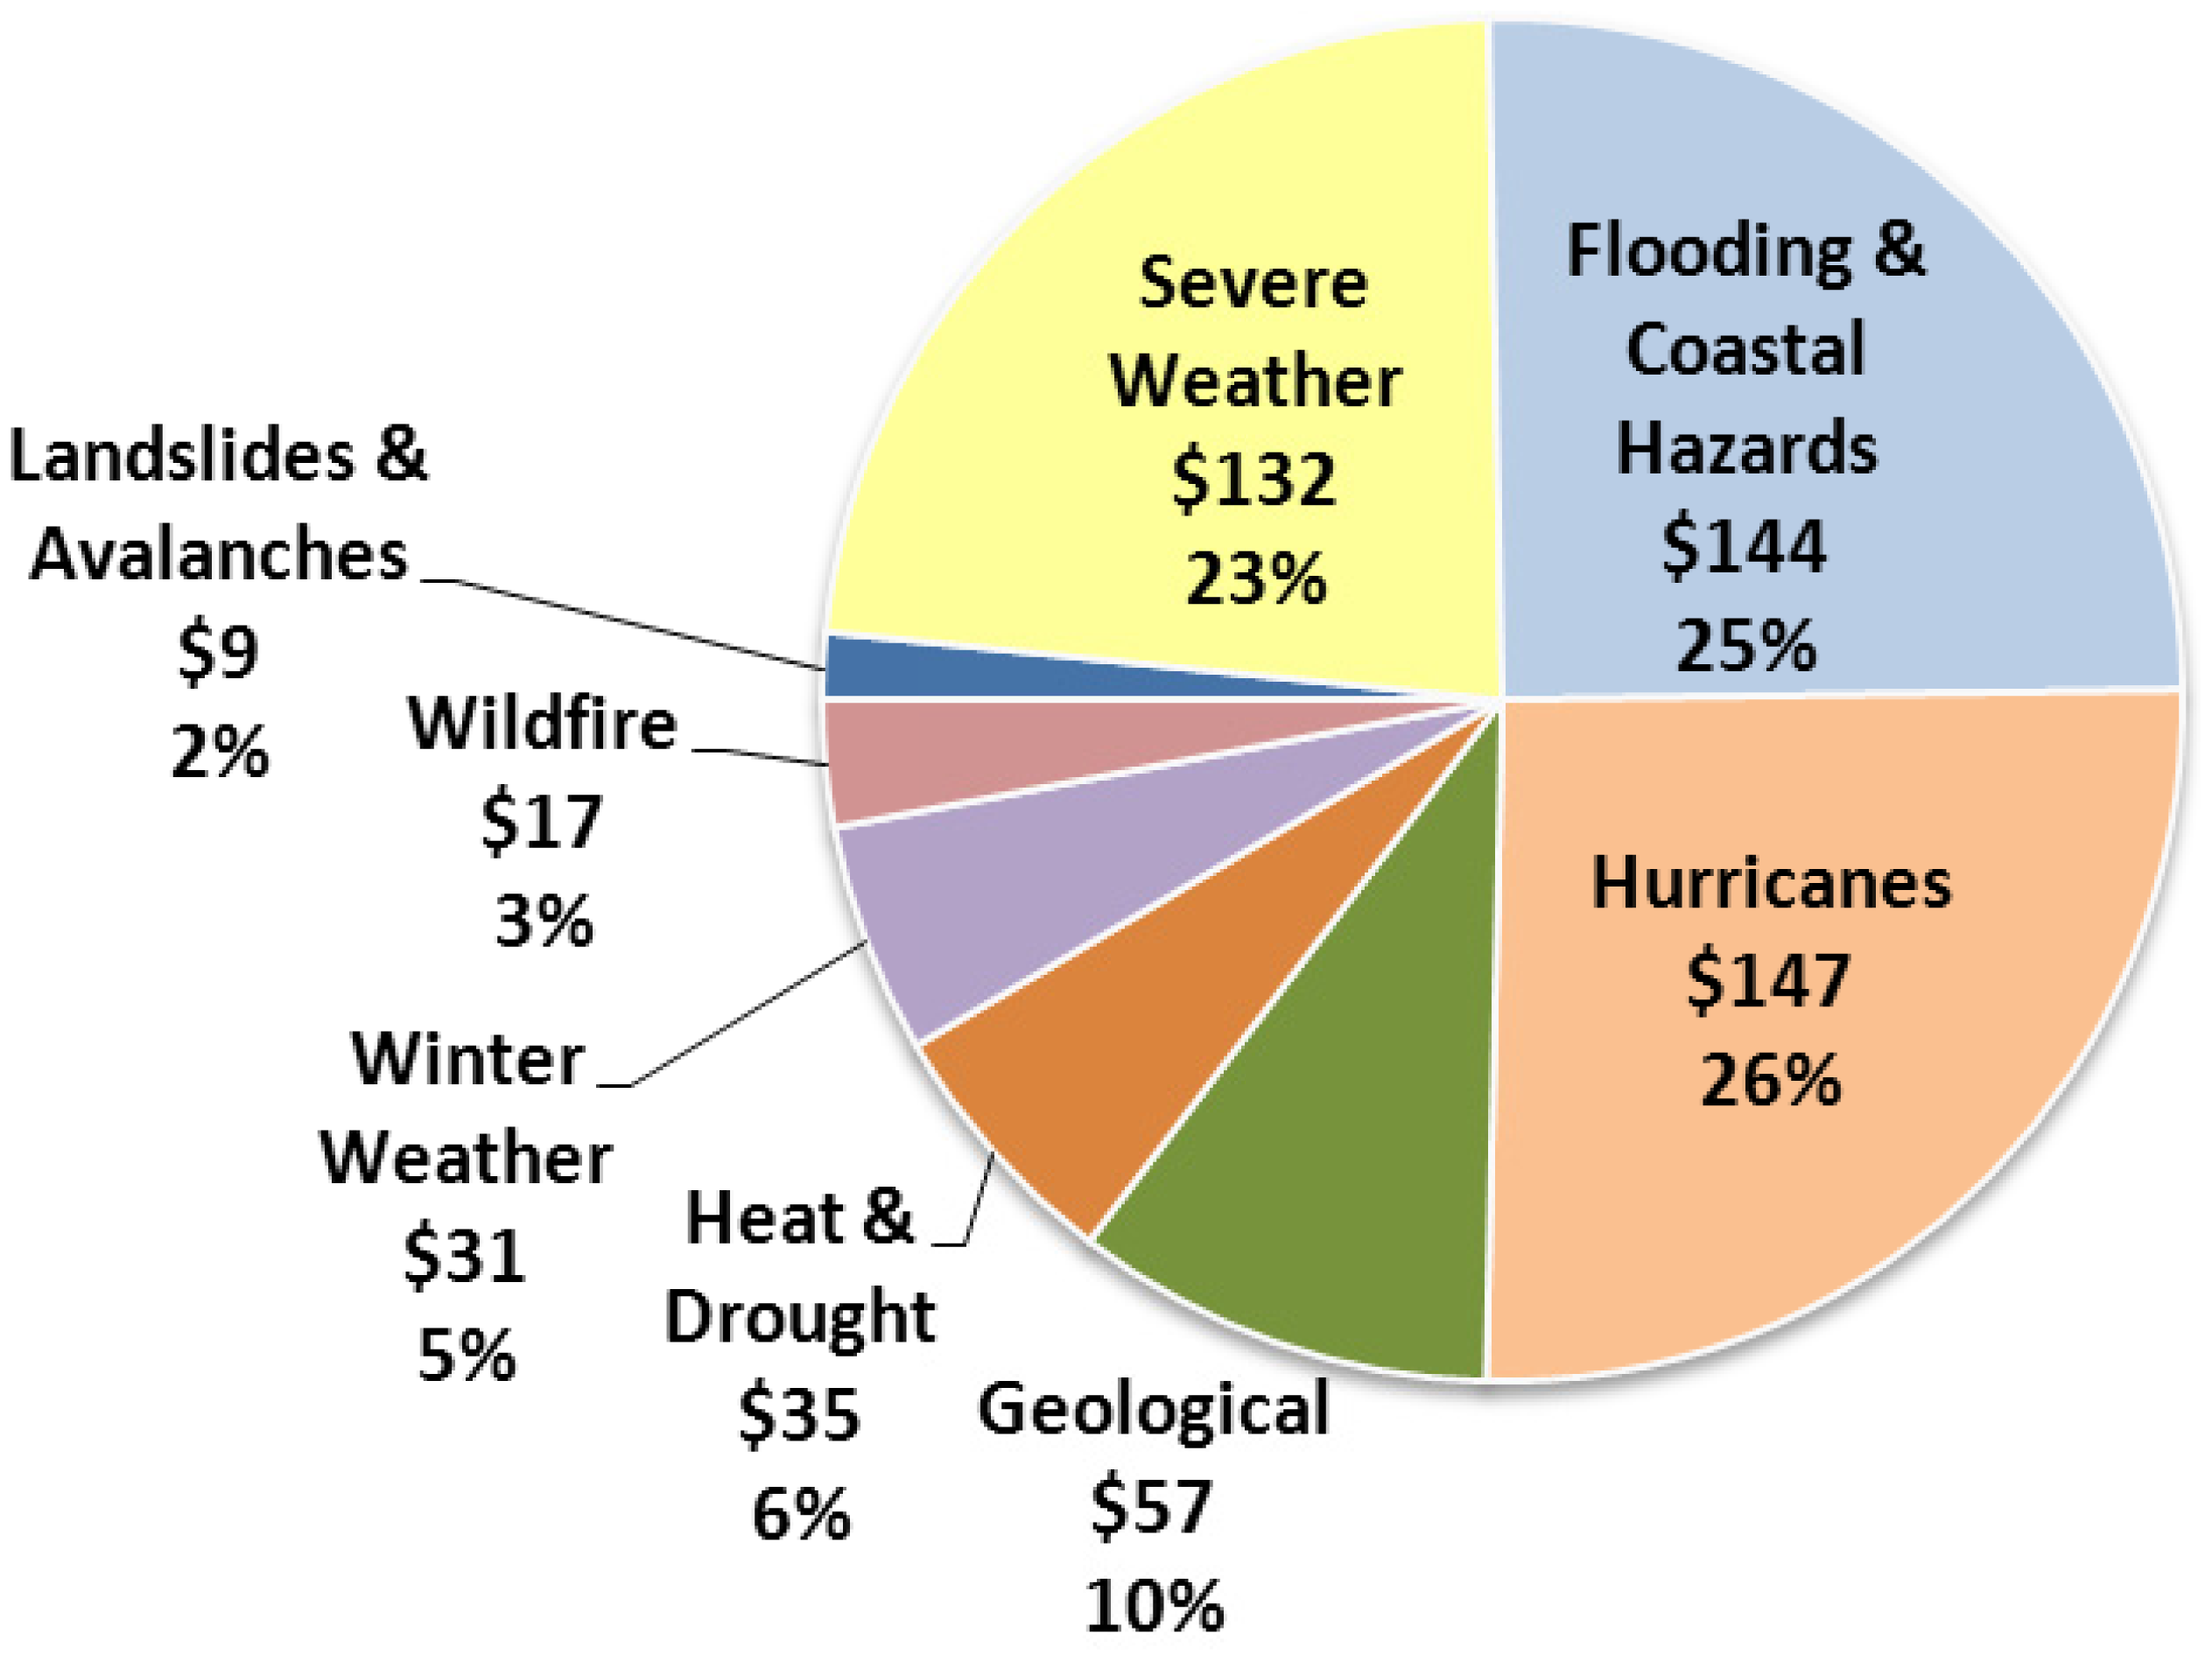
For the purpose of data representation and ease of visualization, the eighteen hazard (database query) categories inherent to SHELDUS™ are condensed into eight broad categories (Figures 1,2,4): (1) Severe Weather (including hail, tornadoes, lightning, severe thunderstorms, high wind, heavy rain, etc.), (2) Flooding & Coastal Hazards (including storm surge, high surf, rip currents, flash floods, riverine flooding, urban flooding, etc.), (3) Hurricanes (including tropical storms), (4) Geological Hazards (including earthquakes, tsunami, and volcanic eruptions), (5) Heat & Drought (including high temperature, heat wave, etc.), (6) Winter Weather (including ice storm, blizzard, heavy snowfall, etc.), (7) Wildfire (including urban fires, brush fire, etc.), and (8) Landslides & Avalanches (including mud slides, debris flows, etc.). We acknowledge that grouping hazards into these broader categories exhibits certain shortcomings since the classification is often largely driven by the inherent structure of the database and its input data [25]. Again, the hazard categories shown here are only for analytical and visualization purposes and do not reflect the multitude of hazard types reported in SHELDUS™.
The SHELDUS™ dataset although comprehensive with respect to direct losses (both property and crop losses) and hazard types is still incomplete. It lacks indirect, insured, and uninsured losses from natural hazards. Losses from non-natural hazards are absent as well. Nevertheless, SHELDUS™ data are excellent for exploring the differential contribution of multiple hazard agents to the American disaster balance sheet, identifying where and when these losses occurred, and uncovering trends in hazard losses. This paper investigates if losses are truly on the rise and if so whether this trend is consistent across space and time.
All monetary losses are adjusted for inflation using 2009 as the base year. Whenever average decadal losses are referenced, it refers to the annual loss incurred during a decade. For example, a fictitious average decadal flood loss of $20 billion in State X during the 1960s means that in State X floods caused on average $20 billion every year between 1960 and 1969.
Total direct losses tend to be high in states with large populations and/or wealth such as California. In order to quantify the relative impact on a state independent of the size of its population and/or wealth, we adjusted direct losses by population and/or wealth. The conversion of direct losses into per capita losses allows capturing the population effect. For the national temporal analysis (Figure 1), total direct losses per year were divided by the US population of the same year. The same was repeated for the state analysis by dividing the state's accumulated direct losses in a given year by the state's population. All per capita losses are inflation-adjusted with 2009 as the base year. All population data originate from the US Census Bureau.
To capture the combined effects of population and wealth, we calculated both a measure of annualized impact as well as a measure of normalized losses. The annualized impact measure reflects the share of per capita direct losses (as calculated in the previous step) in relationship to wealth (expressed as annual per capita income). In the following, this annualized impact measure is calculated as percent per capita losses of per capita annual income for each given year, quantified both at national and state level. The state-level analysis utilizes state per capita loss data as well as state per capita annual income figures. The latter was culled from the US's Department of Commerce, Bureau of Economic Analysis (SA 1–3, Personal summary income by State, September 2011).
The second measure considering population and wealth replicates the normalization approach proposed by Pielke and Landsea [54], which “re-calculates” absolute loss figures by multiplying (inflation-adjusted) losses with a population factor and wealth factor for a given year. Thus, these factors relate population and wealth of a given year to a base year population and a base year wealth. For example, using 2009 as base year, the population of 2009 (307,006,550 people) is divided by the population of 1965 (193,460,000 people) resulting in a population factor of 1.59. The same approach is repeated for calculating wealth, meaning dividing the base year wealth by the wealth of a given year. Subsequently the inflation-adjusted losses of a given year are multiplied by the wealth factor and the population factor. For the purpose of this study, wealth represents the current-cost net stock of fixed assets and consumer durable goods produced per year as published by the Bureau of Economic Analysis. Because more people produce more goods, wealth is calculated as a per capita figure.
Limiting the analysis to conservative direct loss estimates such as SHELDUS™ undervalues the economic impact of natural hazards. To illustrate the need for a more comprehensive approach, we provide a descriptive, exploratory comparison of direct losses with privately insured losses and federal government payouts related to natural disasters (Table 1).
We utilize the following datasets to quantify federal disaster-related costs: (a) flood insurance claim payments through the National Flood Insurance Program (NFIP), (b) individual assistance paid through presidential disaster declarations (PDD), (c) public assistance paid through presidential disaster declarations (PDD), and (d) mitigation spending calculated as fifteen percent of the federal payments for a declaration (PDD). The information on individual and public assistance as well as funding through the hazard mitigation grand program (HMGP) are all derived from the Public Entity Risk Institute (PERI) [51]. By law, the total Hazard Mitigation Grant Program cannot exceed fifteen percent of the first two billion, ten percent of the subsequent portion up to $10 billion, and 7.75 percent thereafter (capped at $35.33 billion) of the estimated eligible disaster assistant programs under the Stafford Act [55]. The only exemption is applicants with enhanced hazard mitigation plans who are eligible for up to twenty percent of the total federal assistance under the Stafford Act.
We use federal flood insurance payouts and federal dollars spent on individual and/or public assistance (including mitigation) following declared disasters as a conservative indicator for the costs of disasters to taxpayers. Aside from public infrastructure rehabilitation, public assistance payments by the Federal Emergency Management Agency (FEMA) include a wide array of hazard mitigation projects such as public awareness campaigns, development of local and state hazard mitigation plans, acquisition of property, retrofitting and relocation of structures, elevation of public and private structures, dry and wet floodproofing of private structures, purchase of generators, construction of safe rooms, vegetation management, shoreline stabilization, wetland restoration, utility and water systems protective measures, infrastructure protective measures, stormwater management, structural flood control measures, and implementation of warning systems [56].
It is important to note that public assistance does not include all mitigation funding (e.g., pre-disaster mitigation funding) and that FEMA's spending on disasters does not include all federal spending (e.g., Community Development Block Grants, federal crop and livestock insurance, etc.). Furthermore, the public assistance data utilized here excludes the funds that state and local governments are required to match. Due to the nature of presidential disaster declarations, the data show current levels of payouts but are incomplete for some years. For example, the presidentially declared disasters for Hurricanes Katrina and Rita are not yet closed out meaning the data for 2005 do not represent final tallies [51]. Also, the National Flood Insurance Program (NFIP) covers only residential buildings with one to four family occupancy, small businesses, and churches. Others insure with the private insurance market, which then in turn re-insures.
To include the hazard burden on the private insurance industry, we utilize reinsurance data since insurance claim data are of proprietary nature. Although now closed for non-clients, Munich Re's NATHAN database was accessible to the public until recently. It is this former publicly available dataset from which we draw payouts associated with hazards-related insurance claims.
We only provide a descriptive comparison between direct loss estimates with hazard expenditures since there is a partial overlap between the datasets. For example, some direct losses estimates from flooding (SHELDUS™) are covered by the National Flood Insurance Program (NFIP) as well as the private insurance market (NATHAN). While there is an unknown degree of overlap between direct losses (SHELDUS™) and disaster expenditures (NATHAN, NFIP, and PDD), there is no overlap between the three expenditure datasets: the NFIP includes only federally paid flood claims, NATHAN considers only private insurance claims and the PDD solely represents federal disaster aid funds, which does not include flood insurance claims. This allows us to combine the expenditure datasets while keeping SHELDUS™ data separate.
Again, the comparison of direct losses to hazard-related spending is purely for illustrative purposes and is by no means complete. The intention is to highlight the gaps in loss accounting and the difficulties associated with determining the full costs of a disaster. Varying temporal and hazard type coverage between the data sources listed in Table 1 restricts comparative analyses to the time between 1978 and 2007. Although a 30-year climatological period is sufficient for weather-related events, thirty years is too short to reliably capture trends in hazard losses and expenditures particularly when it comes to capturing low-frequency but high impact events such as, earthquakes and volcanic eruptions. The time period studied here captures the 1989 Northridge earthquake, the 1994 Loma Prieta earthquake, and the 1980 Mount St. Helen's eruption, and could therefore overestimate the impact of geological hazards on the national loss balance sheet.
Losses associated with dam and levee failures are considered under flooding in all databases with the exception of NATHAN. For geographical consistency, only the fifty US States and the District of Columbia are included in the comparison.
4. Loss Trends: Upward and no End in Sight?
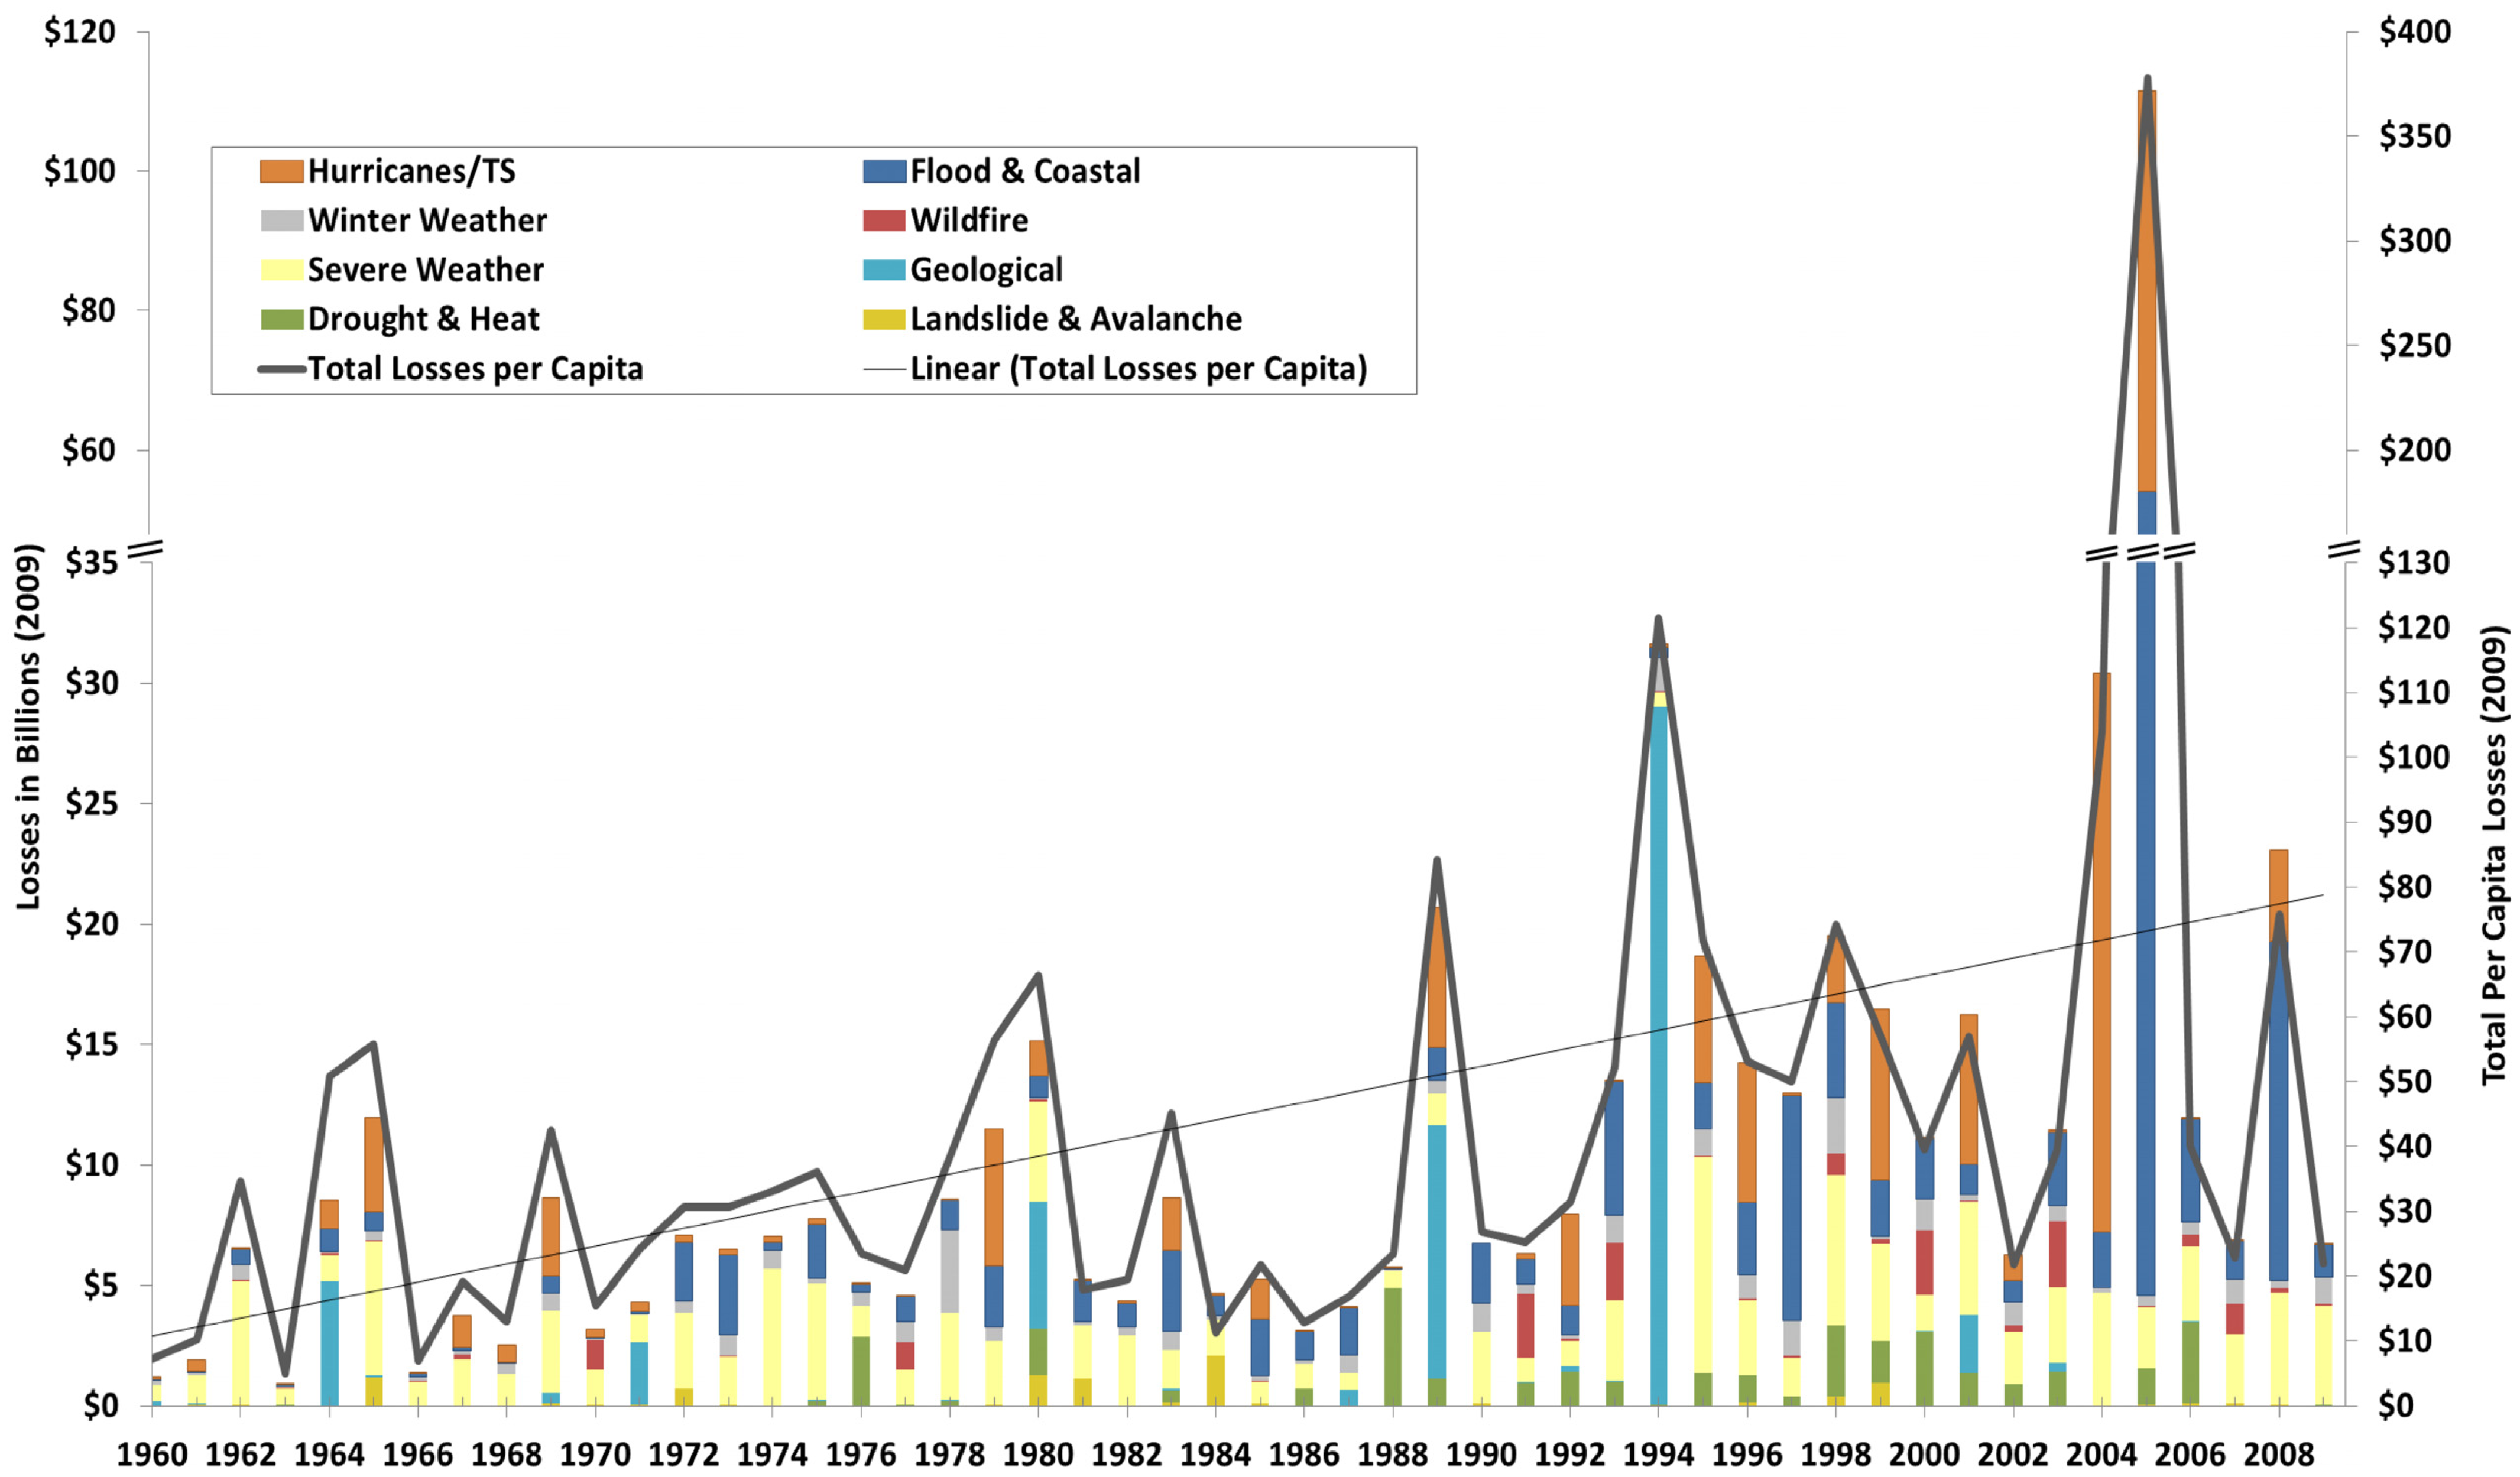
According to SHELDUS™, natural hazards caused more than a half trillion dollars ($573.6 billion in 2009 USD) in direct economic losses over the past fifty years—on average of almost $11.5 billion per year. Since the 1960s, nearly 85 percent of direct economic losses can be attributed to severe atmospheric and hydrological events (Figure 1). Severe storm events, including hail, lightning, thunderstorms, winter weather, and tornadoes, have been a steady occurrence over the past fifty years whereas singular disasters dominate the loss tallies for tropical storms/hurricanes and floods (Figure 2). The 2004 and 2005 hurricane seasons as well as the numerous floods along the Mississippi River and its tributaries (1993, 1997, and 2008) present distinct peaks in the temporal pattern of natural hazard losses.
Geologic hazards which include earthquakes, tsunamis, and volcanoes account for approximately ten percent and almost $60 billion of total losses. This is not to say that geologic hazards are not costly events. These results should be interpreted with caution because geologic hazards operate on a much different time scale than most meteorological or hydrologic hazards. With a period of record for only the past 50 years, it is not surprising that more frequent hazards have the largest proportion of losses. When geologic hazards do occur, their impacts can be quite catastrophic and economically overwhelming as evidenced by major earthquakes in 1964 (Prince William Sound, AK), 1989 (Loma Prieta, CA), and 1994 (Northridge, CA).
Total losses due to natural hazards rarely grossed more than $15 billion per year between 1960 and 1989. Since the 1990s, though, $15 billion has become the annual average. In fact, the annual per capita loss average has more than tripled from nearly $25 in the 1960s to about $80 in the 2000s. As a result, natural hazards cost annually almost $50 per person when averaging across the entire time period from 1960 through 2009. This upward trend in losses suggests a marked increase in economic impacts per person from natural events, or does it?
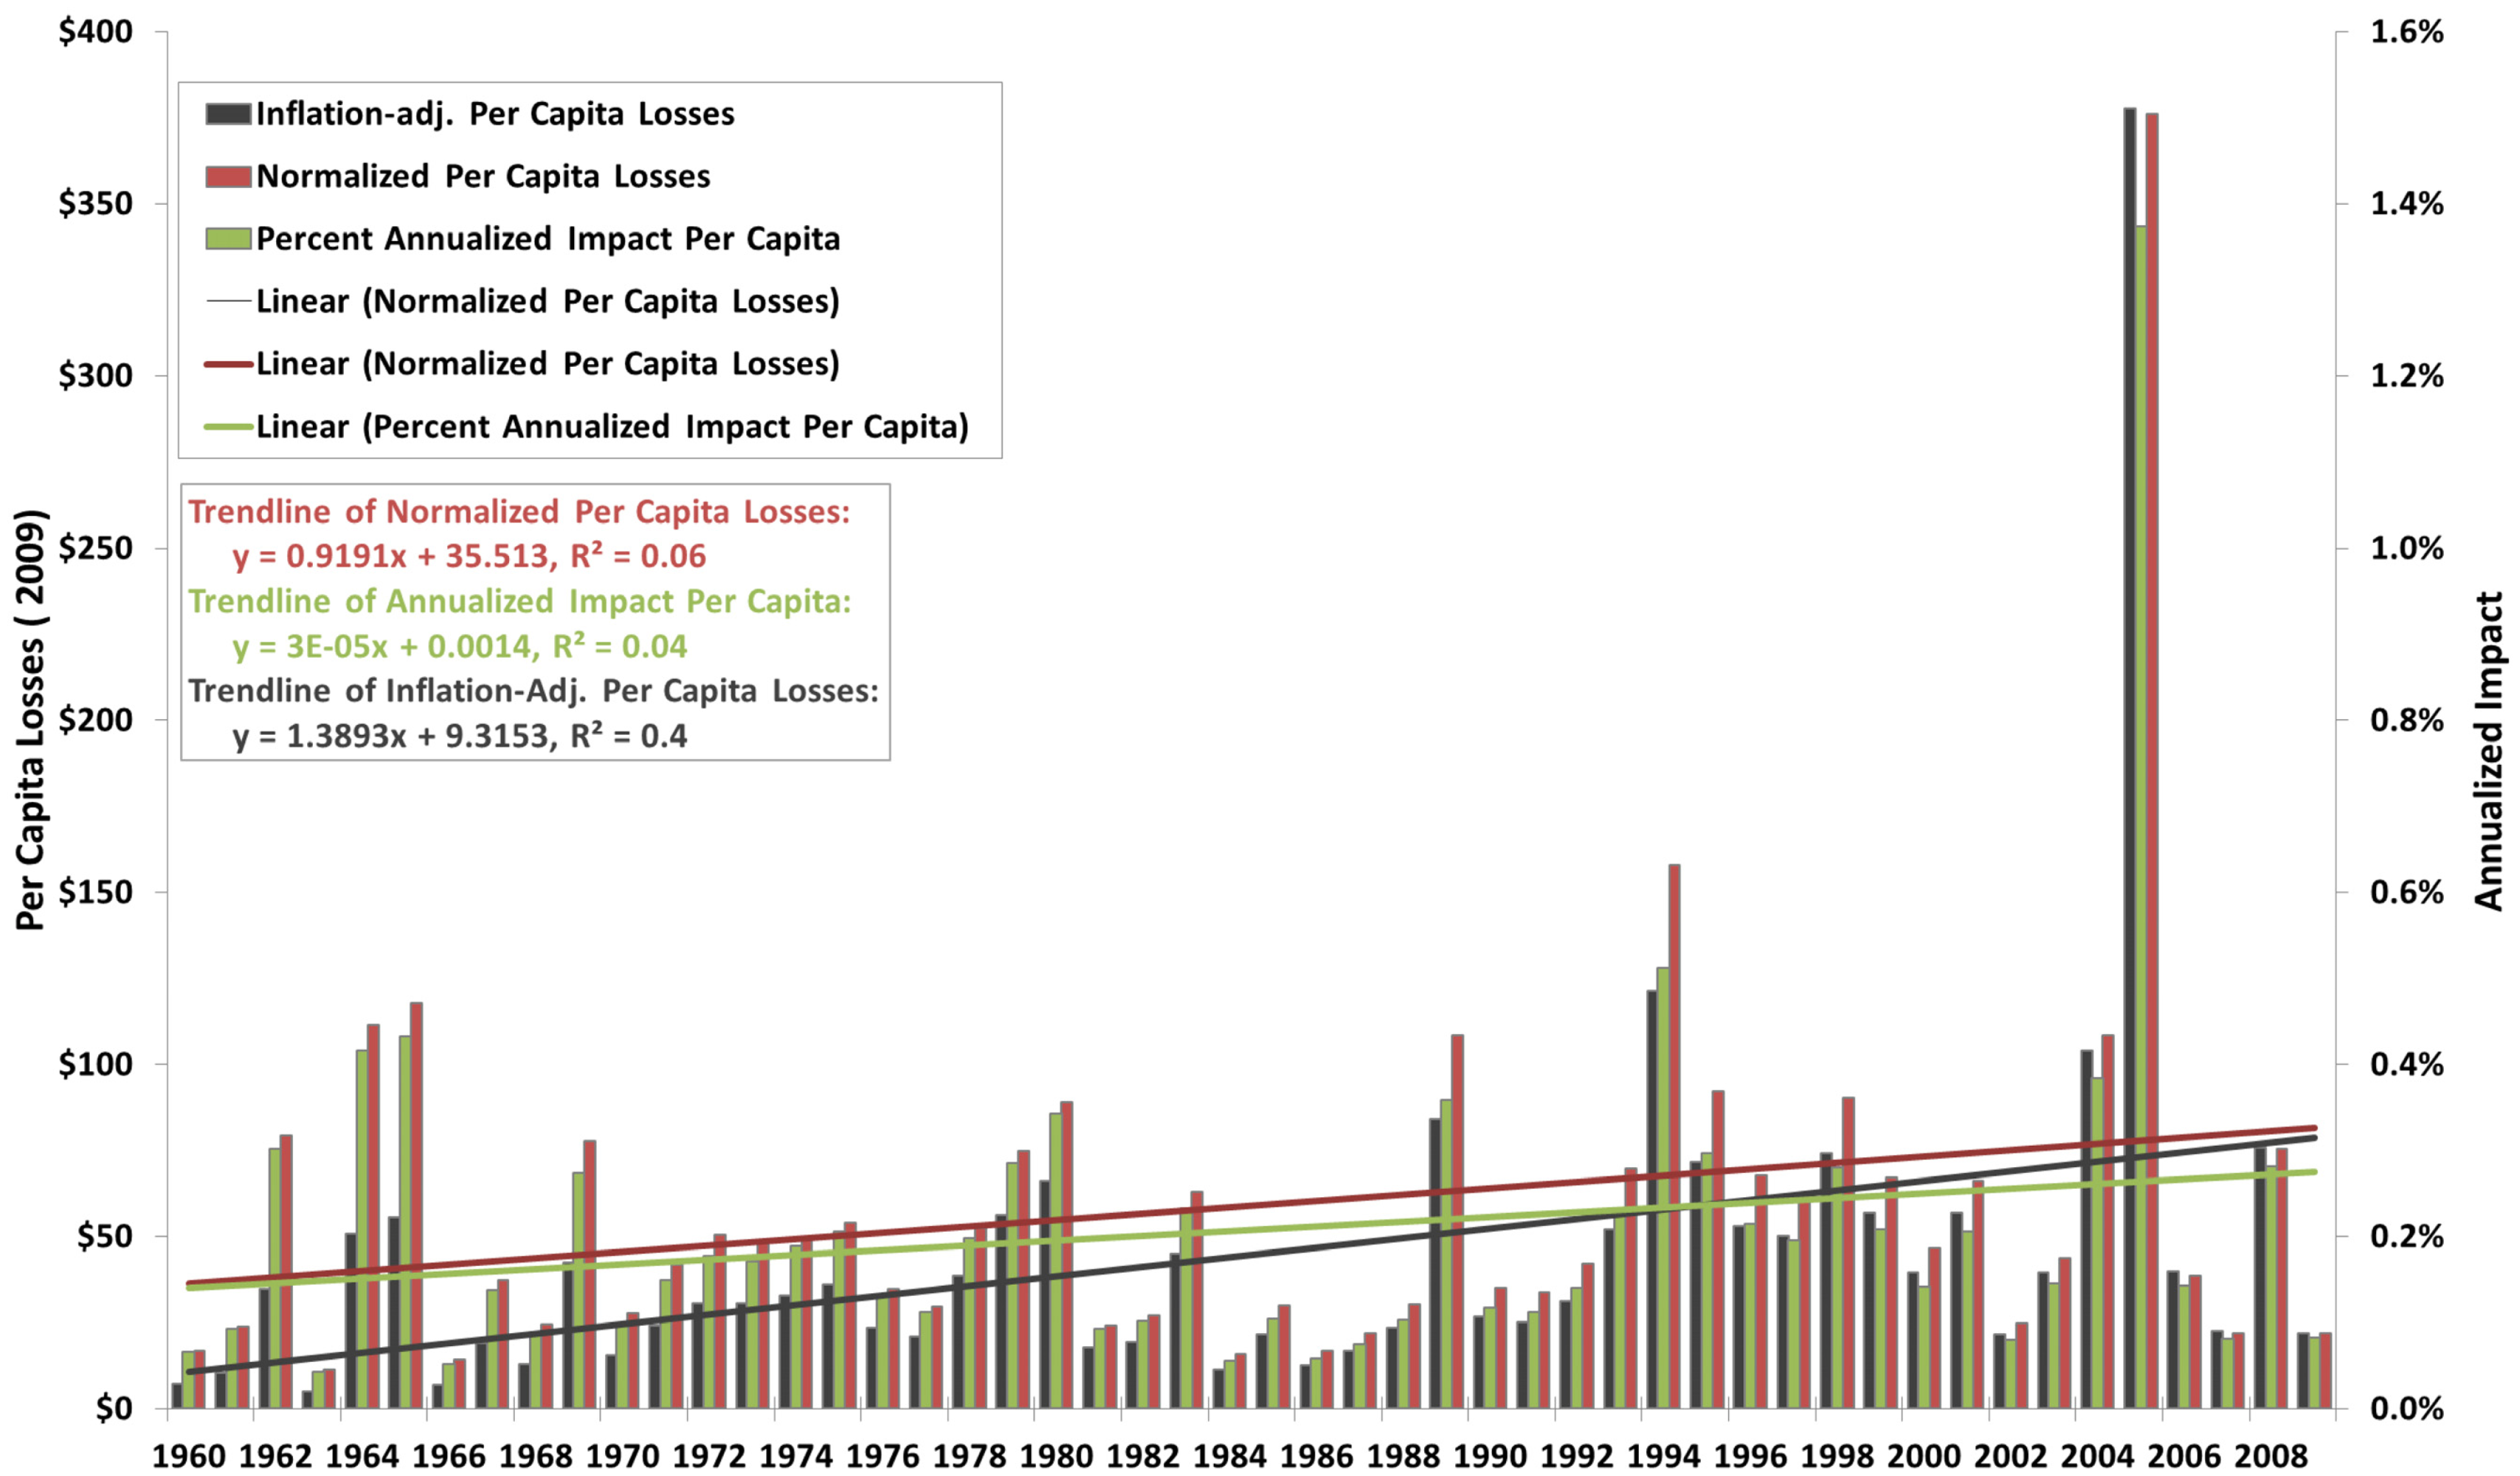
In fact, direct losses from natural hazards are on the rise even when controlling for the increase of people and wealth although at a seemingly slower pace (Figure 3). Normalized losses per capita declined from an annual average of $51.41 in the 1960s to $46.25 (1970s) and $42.70 (1980s) followed by a severe increase to $71.96 (1990s) and $82.44 (2000s). The decline in the 1970s and 1980s, however, is not as drastic when looking at the annualized impact, which relates annual per capita losses to annual per capita income. Per capita losses equated to 0.1707 percent of the average annual income in the 1960s and even slightly rose to 0.1719 percent in the1970s but fell to 0.1526 percent in the 1980s. Just like all other loss trend measures, annualized impact experienced an increase in the 1990s (0.2307 percent) and the 2000s (0.2919 percent). Interestingly, normalized losses and annualized impact behave similarly although the annualized impact measure is less complex in calculation and avoids manipulating absolute loss values.
All loss measures show that hazard losses are outpacing population growth and increases in wealth. Thus, it is not just total direct losses that are increasing but also the relative economic impact of disasters. This raises the issue of whether the United States will be able to curb hazard losses in the future and what will it take to do so. It also challenges the widely cited notion that simply growth in population and wealth drive losses.
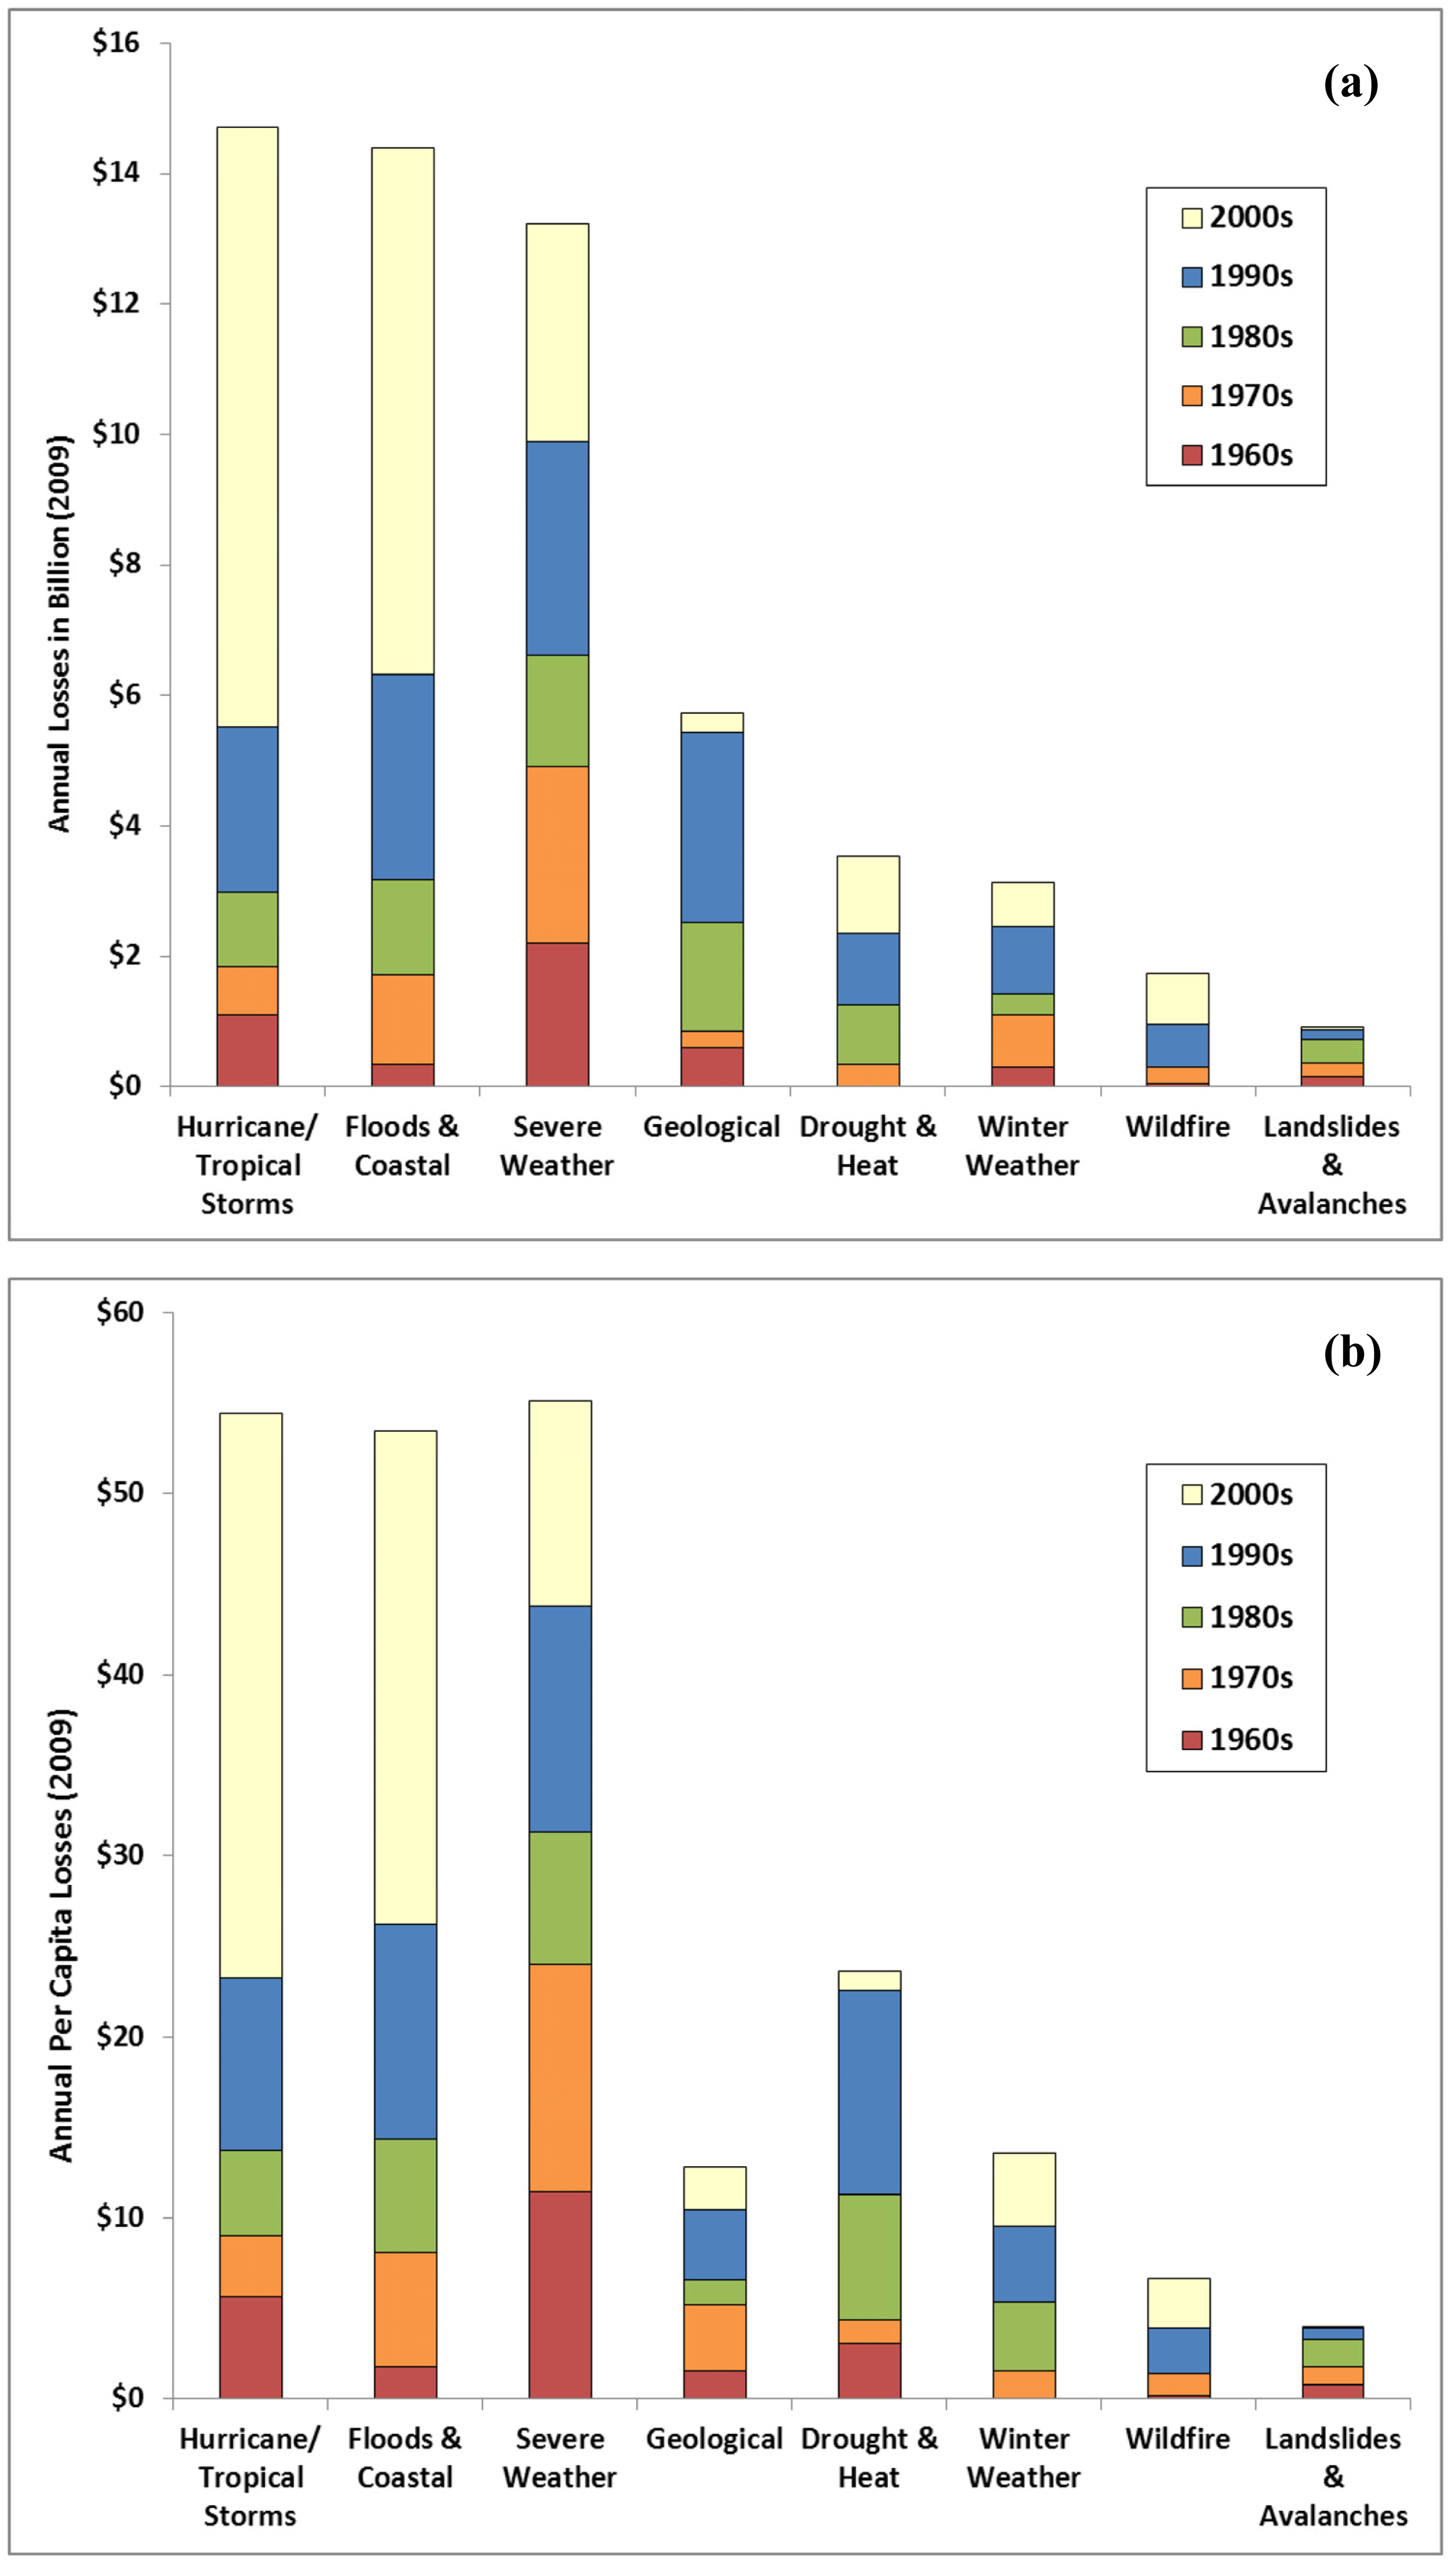
When prioritizing hazard mitigation and preparedness actions, understanding which hazards contribute a greater proportion of economic impacts over time is essential. Our analysis shows that tropical cyclones and flood events are largely responsible for this upward trend in direct losses over the past two decades (Figure 4). However, hurricane and flood losses are not the only ones on the rise. Disaggregating annual losses by hazard type shows that starting in the1980s through the 2000s, heat, drought, and wildfire hazards play a bigger role in the overall loss picture. Drought and heat losses rose from $0.03 per capita annually in the 1960s to over $4 annually in the 2000s. This is a 134-fold increase and represents the steepest relative incline over the past fifty years across all natural hazards. Although direct losses from these generally heat-related hazards appear small in comparison to the big three—severe storms, hurricane, and floods—it is important to realize that crop losses and indirect effects from heat, drought, and wildfire events are notoriously underreported. It is therefore highly likely that drought and heat losses should make up an even larger portion of the “hazard pie” than shown in Figure 1.
5. Place Matters
There is an important distinction between the total dollar amount of losses due to natural hazards and the relative impact of those losses on states and individuals. It may be that for some states, the relative patterns of impacts are a function of cumulative losses over an extended period, not just a singular large event.
The big three hazards—severe storms, hurricane, and floods—largely explain why states such as Louisiana, Florida, Texas, and Mississippi rank among the top five states in terms of total losses (Table 2). Since 1900, only ten out of the country's thirty costliest tropical cyclones did not affect any of these states [57]. In Florida, Louisiana and Mississippi, hurricanes and flood losses account for around 80 percent of the states' losses. Only the State of California upsets this pattern and ranks second with approximately $76 billion in losses since 1960. Although the losses associated with the Loma Prieta and Northridge earthquakes contribute around 57 percent to the State's overall losses (followed by wildfires 14 percent, landslides 7 percent, flooding 6 percent), its high ranking is largely due to its high vulnerability levels. California is the most populous states with high population density and high property values. Generally speaking, disasters in California are more costly than in, for example, Montana where less people and property are at risk.
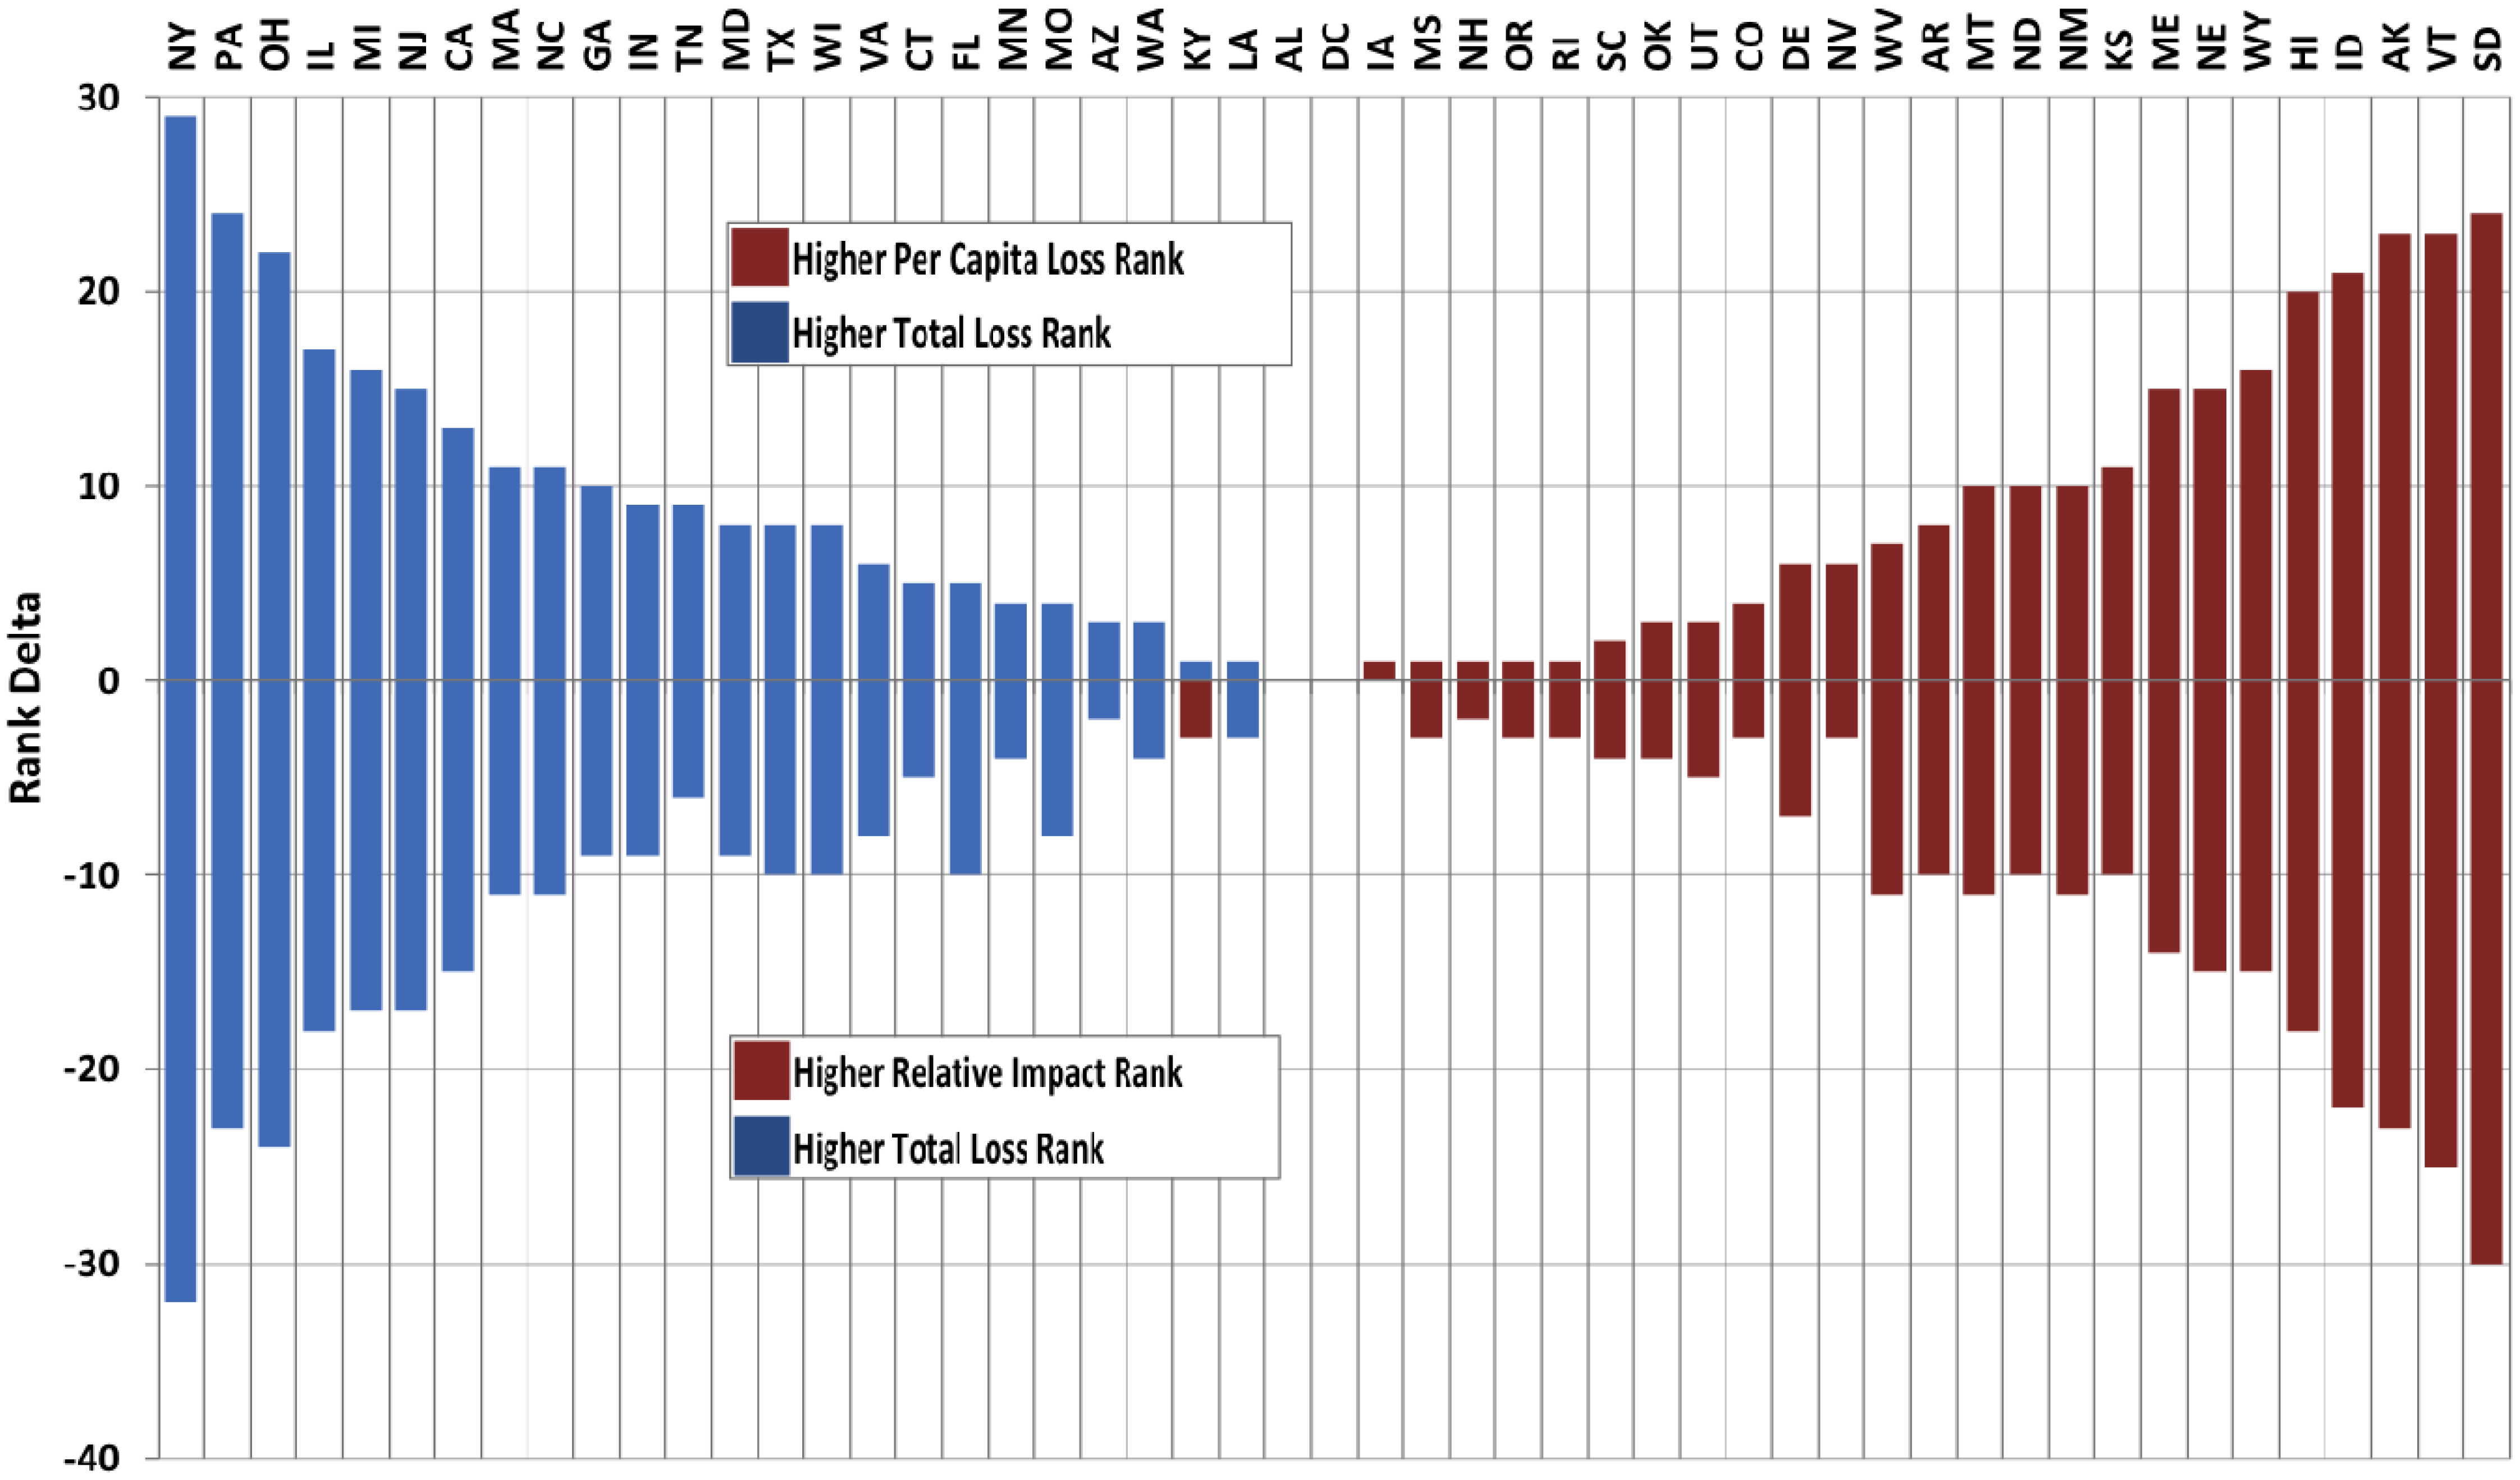
Hence, judging a place's hazardousness solely by total loss figures is misleading because total loss rankings tend to favor states with large populations and/or high property exposure. By contrast, when employing a measure of relative impact such as losses per capita, the state of Louisiana is no longer the most hazardous place in terms of the relative impact of losses. In fact, the relative impact ranking generates a surprising number one: Alaska (Table 2)—a result of the 1964 earthquake and tsunami. The five states with the highest per capita losses between 1960 and 2009 are Alaska, Louisiana, North Dakota, Mississippi, and Iowa. Figure 5 further illustrates this effect. For example, states like New York, Pennsylvania, and Ohio rank fairly high in terms of total losses (respective ranks of #10, 12, and 14) but score much lower in relative terms (per capita ranks of #39, 34, and 38). On the other hand, states like South Dakota, Vermont, Alaska, and others incur high per capita losses but small overall total losses.
Place matters when it comes to hazards: not only does the location influence the amount of losses incurred based on the number of people and the value of property at risk, it also determines the type of hazards driving the losses. Thus, each state has a unique hazard history and loss profile. Rather than reporting historic losses in absolute numbers, the following section discusses per capita losses to highlight the relative impact of disasters.
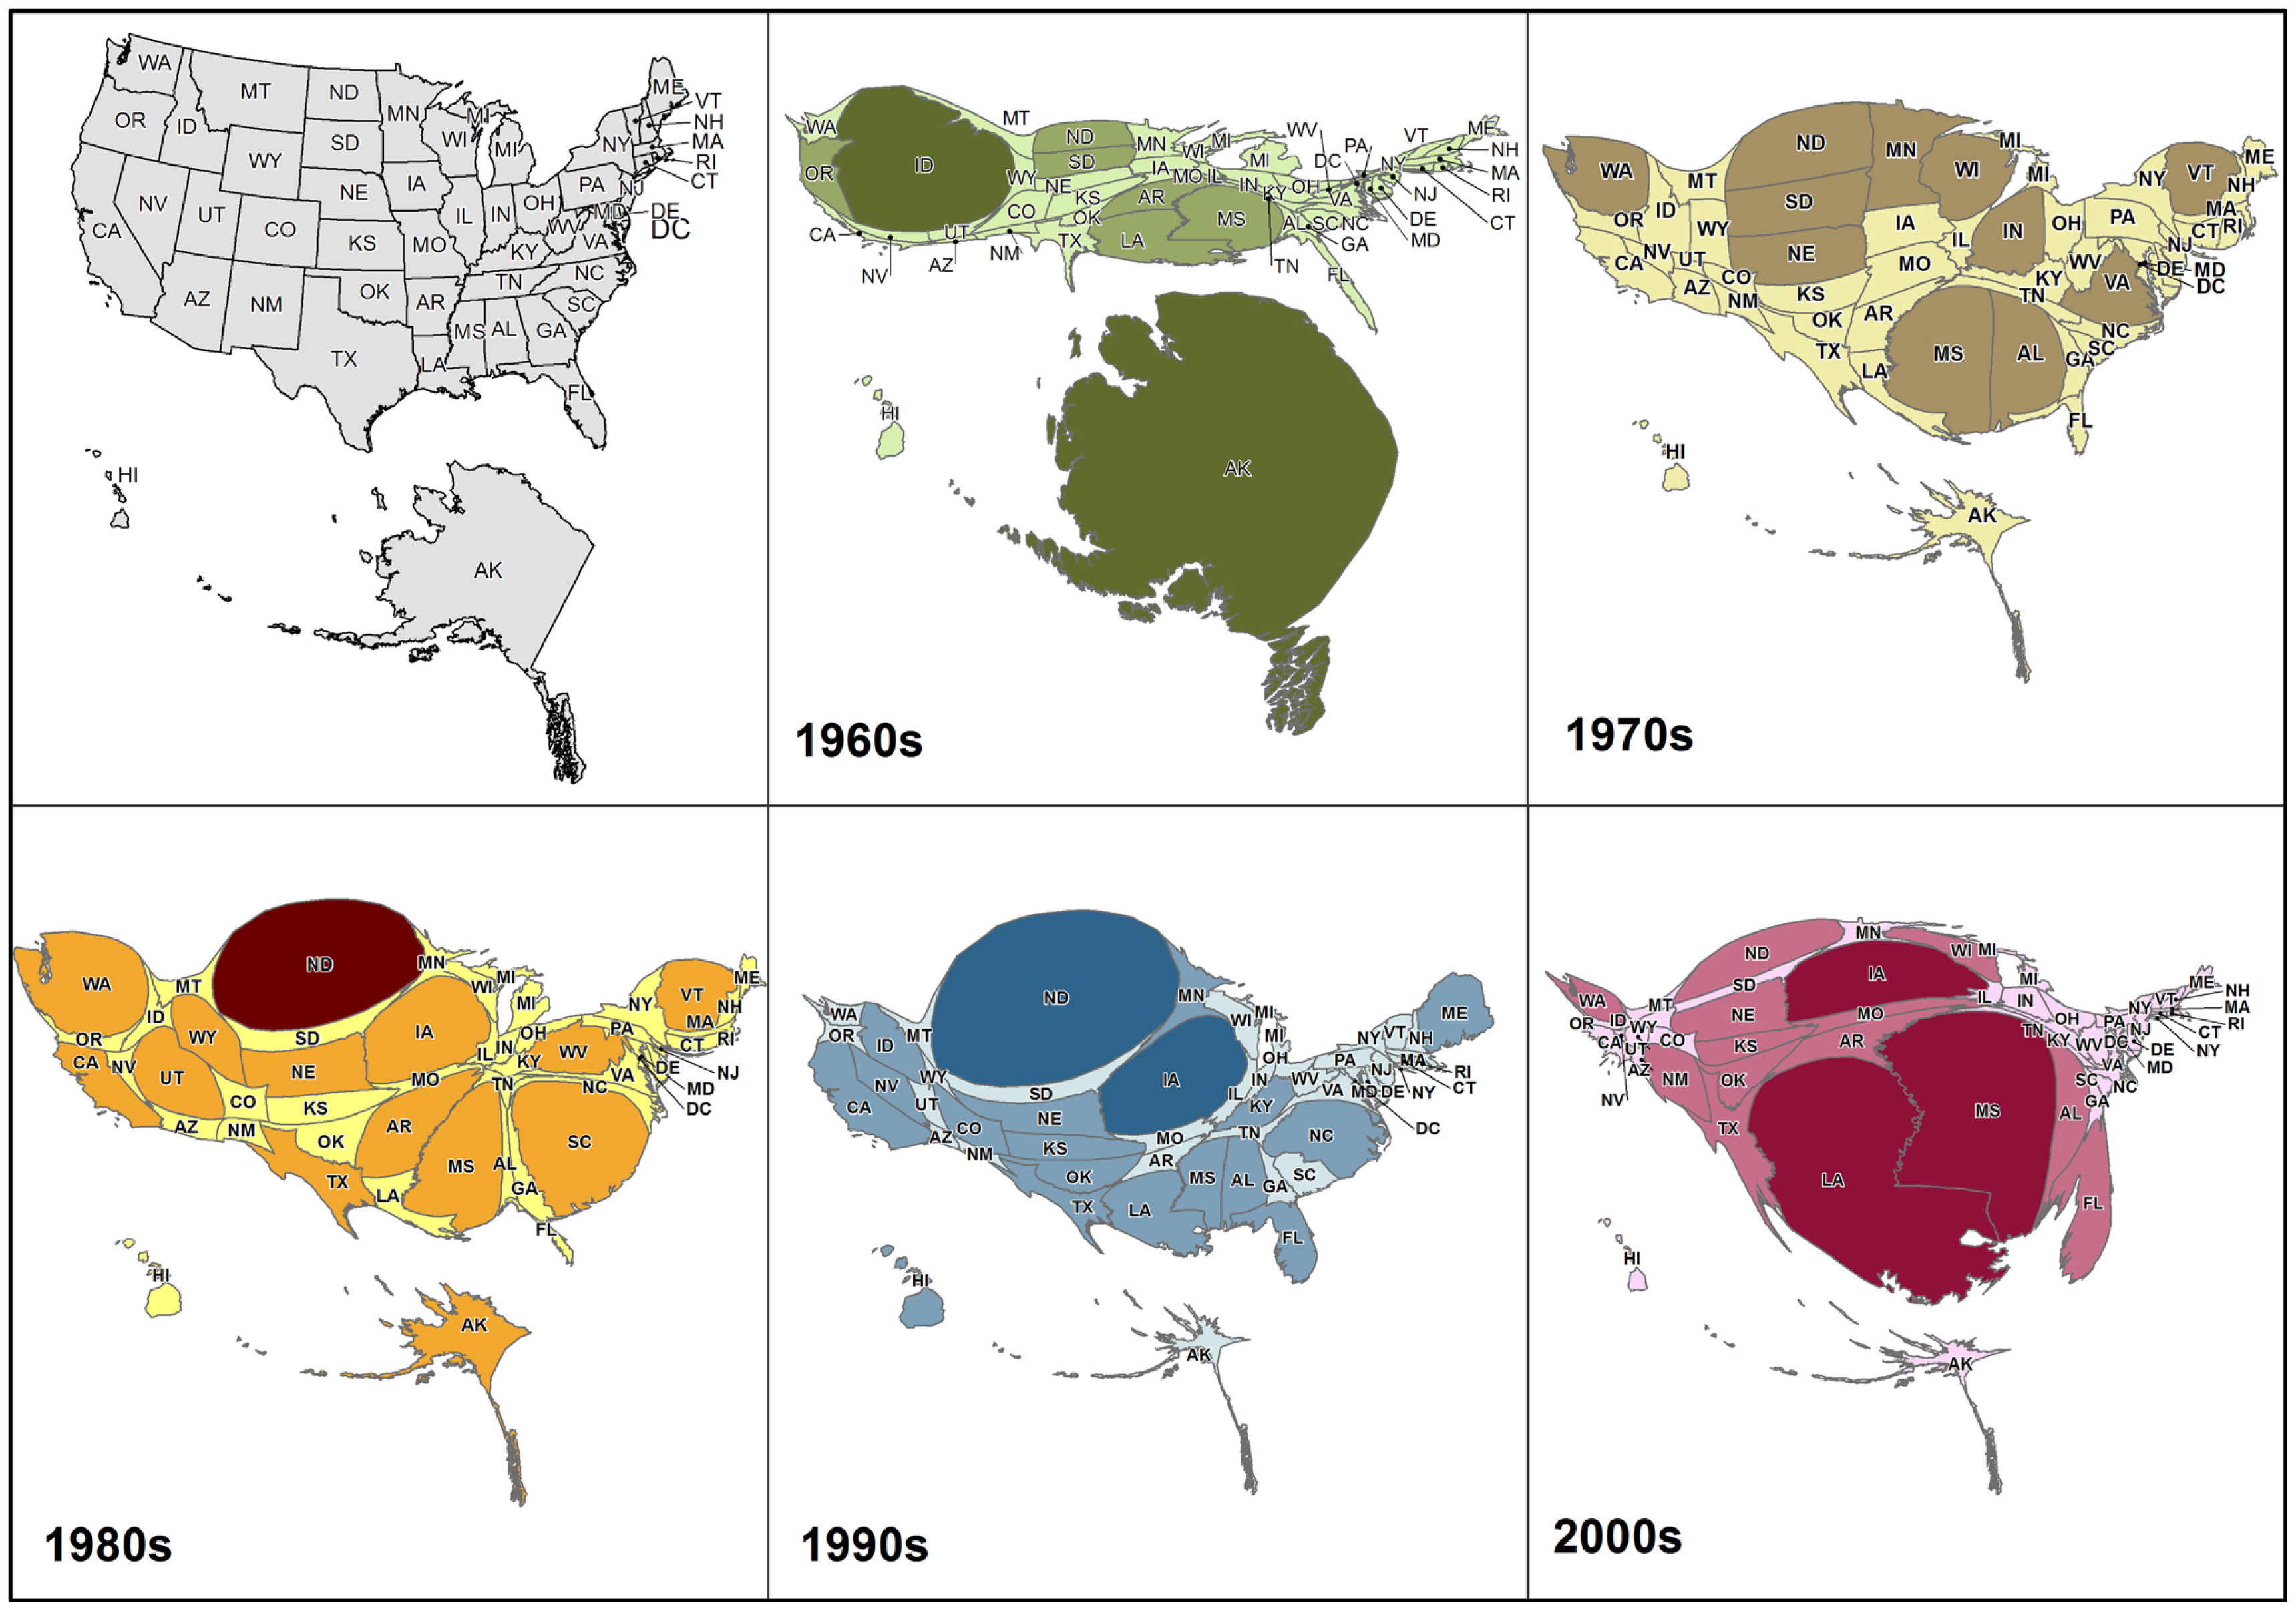
Starting with the 1960s, the 9.2 magnitude Alaskan earthquake and tsunami dominate the loss pattern of this time period accumulating $23,888 in per capita losses for every Alaskan resident in 1964 alone (Figure 6). Hail and damaging winds caused more than $5,000 in per capita losses in Idaho in 1962 while Hurricane Hilda (1965) drove the per capita loss for 1965 to $1,002 in Louisiana and Hurricane Camille (1969) brought the per capita loss for 1969 to $1,316 in Mississippi.
A mixture of meteorological and hydrological hazards characterizes the loss pattern of the 1970s. Losses from hurricanes and flooding raised the per capita losses in 1979 to $1,266 for every Mississippian and reached $778 per capita in Alabama for the same year. Additionally, extreme drought in Wisconsin, and multiple years of floods and severe (winter) weather in Vermont, Wisconsin, Washington, Minnesota, South Dakota, North Dakota, Nebraska, and Indiana brought the cumulative per capita losses from 1970 to 1979 in these states to range between $635 and $1,145 (Figure 6).
Higher than average losses during the 1980s were felt by populations in North Dakota ($2,832 per capita for 1988 mostly from severe drought) and South Carolina ($1,902 per capita for 1989 mostly from Hurricane Hugo). In addition to these weather-related disaster events, the 1980s experienced a number of large mass movement and geological hazards. The nation's largest landslide occurred in Thistle, Utah in 1983 ($754 per capita loss for Utah in 1983) along with the Loma Prieta earthquake in ($352 per capita loss in California in 1989); the Alaskan Redoubt volcanic eruption ($559 per capita loss in Alaska in 1989); and the eruption of Mount St. Helens ($1,537 per capita loss in Washington in 1980).
The 1990s showed a distinct shift in hazard losses: losses nearly doubled both in total and relative measures when compared to the 1980s (Table 2). Nineteen states had per capita losses exceeding the national average and four states (North Dakota, Iowa, North Carolina, and Louisiana) experienced losses three times the national average. Repeated flood losses in North Dakota accumulated per capita losses of $332 in 1993 and $7,825 per capita in 1997 as well as in Iowa (per capita losses of $338 in 1992, $1,729 in 1993, and $473 in 199). North Carolina's losses of $826 per person in 1996 and $798 in 1998 were largely due to Hurricanes Fran and Floyd. High accumulated per capita losses of $1,571 in Louisiana (1990 through 1999) were a product of hurricanes and intense storm systems associated with strong El Niño events in the early to mid-1990s [58]. Hurricane Andrew, although among the costliest natural disasters, elevated Florida's per losses to “only” $115 in 1992.
The 2000s can be described as the hurricane (and storm surge) decade with losses nearly tripling compared to the 1980s (Table 2). In Florida, the 2004/2005 hurricane season brought per capita losses to $1,350 in 2004 and to $781 in 2005. Hurricanes significantly affected Alabama with per capita losses of $667 in 2004 largely caused by Hurricane Ivan. Hurricane Katrina was the driving force behind astronomical per capita loss levels in Mississippi ($10,063 per capita in 2005) and Louisiana ($12,996 per capita in 2005). The latter was also affected by Hurricane Rita in the same year. Hurricanes, though, did not set the only records during the 2000s: Midwestern states experienced extensive flooding in 2008 ($2,764 per capita in Iowa) and major tornado outbreaks occurred in the central US Wildfires in New Mexico brought the state's per capita balance to $1,036 in 2000. Wildfires also caused major total losses in California ($13.2 billion) although per capita losses never exceed $87 in any given year during the 2000s. This is also true for Hurricane Ike, which ranks among the costliest hurricanes but only raised Texan per capita losses to $150 in 2008.
6. Are We Doing Enough to Reduce Losses?
Nationwide, annual losses rose from $4.7 billion in the 1960s to $6.7 billion in the 1970s, $7.6 billion in the 1980s, $14.8 billion in the 1990s, and $23.6 billion in the 2000s. If this loss escalation is any indication, we could expect annual losses of around $30 billion in the 2010s. This would translate into a projected $300 billion within a single a decade—half of the amount accumulated over the past fifty years. As discussed earlier, growth in population and wealth account for some of this increase but cannot explain it in its entirety. In order to slow this escalation vulnerability reduction, hazard mitigation, and sustainable development have to become priorities. This also means that current loss reduction efforts should be evaluated and re-assessed in terms of their effectiveness given that losses could not be stabilized over the past decades.
Foremost among loss reducing efforts is the National Flood Insurance Program (NFIP), which was established by the US Congress in 1968 to curb the impact of floods and control development in floodplains. As Kunreuther and others [1,14] show, the NFIP had the opposite effect. The cumulative effect of actuarially under-rated insurance premiums, limited incentives for homeowners to flood-proof properties, and disconnect between local benefits and federal burden continued or perhaps even encouraged development in floodplains. Absent the final tally of the 2011 flood season, the NFIP is insolvent with a deficit of $17.8 billion forcing the Government Accountability Office to place the NFIP on its high-risk list of federal government programs [59-62]. The deficit-shaping hurricane seasons of 2004 and 2005 contributed extensively to this debt but according to the US Congressional Budget Office, the program operates with a built-in deficit of at least $1.3 billion annually [63]. The NFIP is clearly ineffective in loss reduction and despite its original design of self-financing and flood mitigation has turned into a liability for both taxpayers and people living in floodplains. The unintended subsidizing of floodplain development put more people into harm's way without adequate mitigation requirements and/or recovery mechanisms.
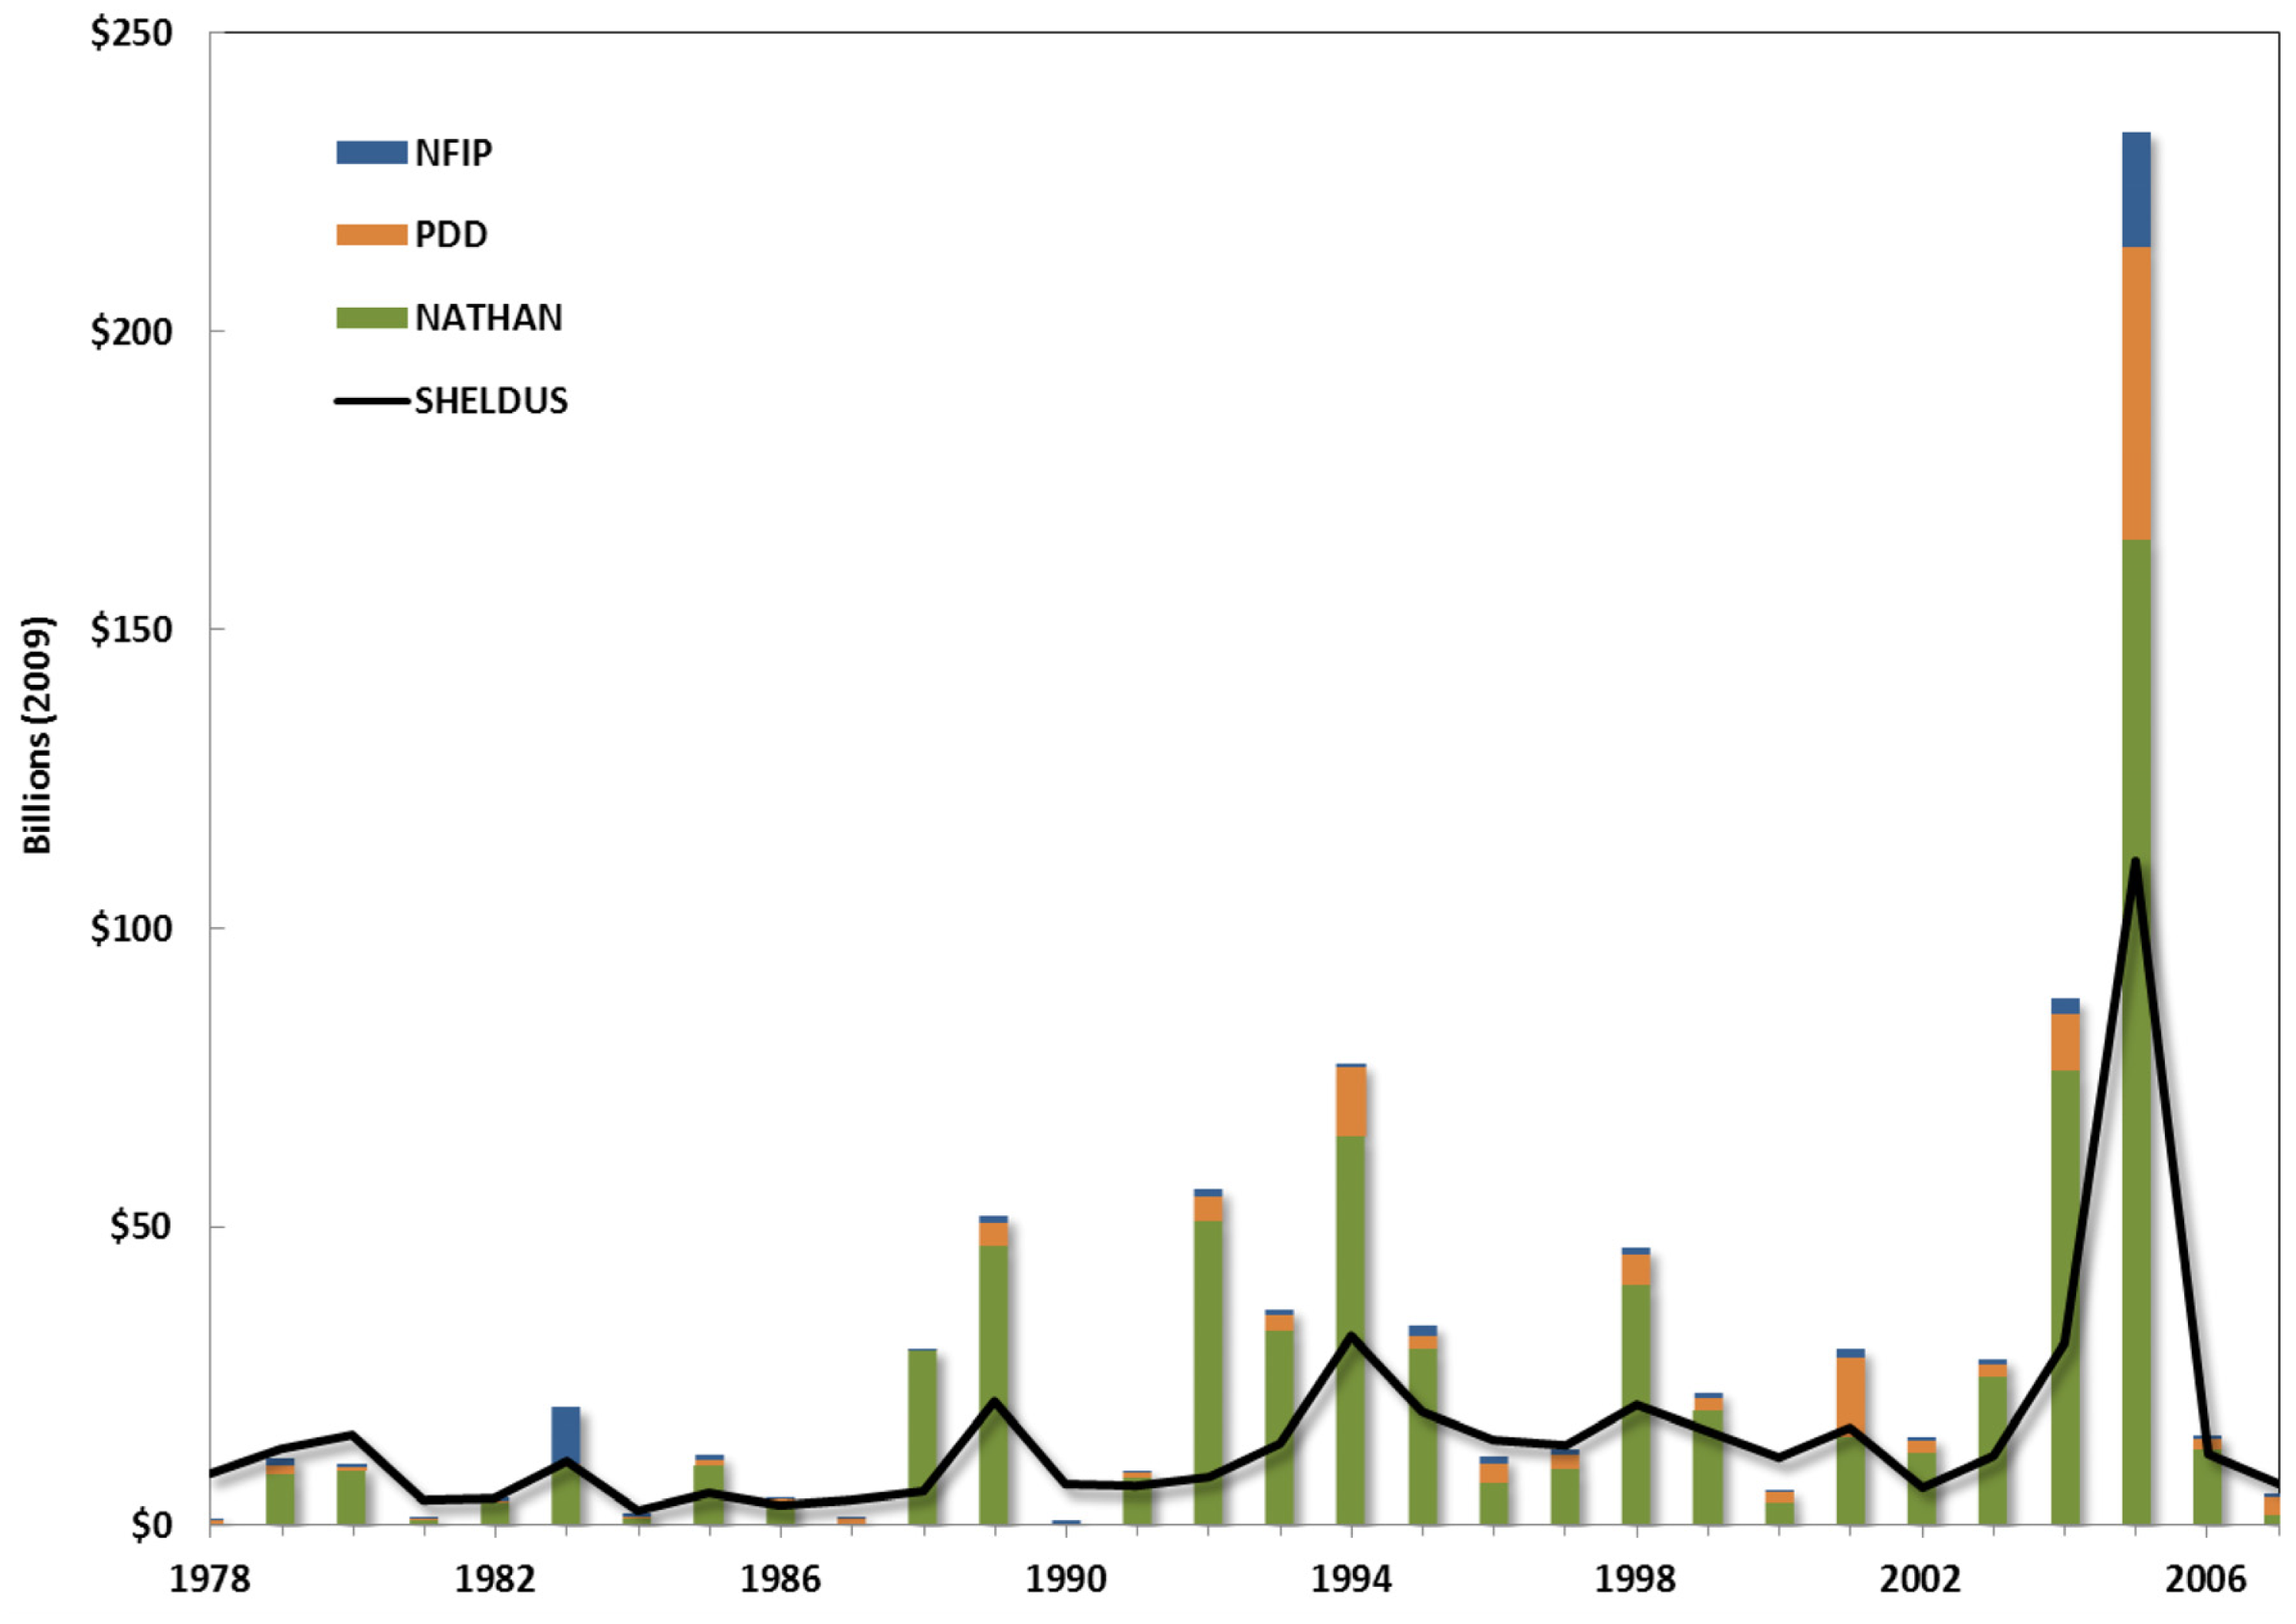
Flood insurance payouts are not the only federal monies related to hazards and disasters that are on the rise. Costs associated with presidential disaster declarations, which are issued after major disasters if the event exceeds the response and recovery capacities of local and state authorities, climbed as well. The federal tally for the 1960s came to $3.7 billion and then almost steadily increased to $9.5 billion in the 1970s, $7.3 in the 1980s, $34.8 billion in the 1990s and reached $92.2 billion in the 2000s (Figure 7). In sum, the federal government spent a total of $143 billion dollars in the aftermath of disasters between 1960 and 2009—about a fourth of direct losses incurred during the same time period as captured in SHELDUS™. Again, direct loss figures are estimates of the direct, tangible devastation caused by a hazard, and do not reflect reconstruction and recover spending. Payouts through the NFIP and PDD, however, capture some of society's costs to rebuild.
One of the most obvious results of plotting direct losses and post-disaster spending on the same chart is the enormous gap between the two (Figure 7). Between 1978 and 2007, the conservative measures of disaster payouts used in this study exceed estimated direct losses most of the time. In fact, the proportion of direct losses to post-disaster expenditures is on average 1:2 from the time period of 1978 to 2007 and as high as 1:7 in years of large disasters such as 1992. In other words, disaster expenditures are at least double the amount of estimated direct losses. As Figure 7 shows, direct losses (SHELDUS™) tallied to around $450 billion for the 30 year period while actual costs were $855 billion—again, actual costs utilized here are incomplete since, for example, federal crop and livestock insurance claims other federal disaster payouts, and uninsured costs, are not included.
However, this study shows that utilizing direct losses alone vastly underestimates the costs associated with disasters at least by a factor of two. Without fully accounting for disaster losses and costs, it is impossible to gauge the benefits and effectiveness of hazard mitigation efforts. It is also difficult to determine the appropriate level of mitigation funding. The Multihazard Mitigation Council [64] found that every dollar spent on hazard mitigation leads to a cost saving of $4 in losses. As stated at the beginning of this section, direct losses for the 2010s could increase annually by an estimated $7 billion if the trend for the 1990s and 2000s continues. To offset this increase in direct losses, an estimated spending of $1.75 billion for hazard mitigation would be required according to the Council's 1:4 ratio. Based on the relationship between direct losses and disaster payouts, the amount needed to stabilize further increases disaster costs would have to double to $3.5 billion. Neither figure seems achievable under current policies, which cap the allowed amount for the Hazard Mitigation Grant Program at 15 percent of total disaster grants awarded by FEMA. For example, 15 percent of the Presidential Disaster Declaration funds awarded between 1960 and 2009 sums to an annual figure of only $443 million according to the PERI data.
It appears that hazard mitigation efforts have neither stabilized nor curbed the trend of escalating losses from natural hazards in the United States. In contrast, not only did direct losses from hazards increase, so did disaster-related spending at the federal level as well as in the private insurance market. In order to stabilize this trend, hazard mitigation must become a priority.
7. Conclusions
The results of this study clearly show that per capita losses are increasing (Figure 2 and Figure 3). The question is what contributes to this increase? It cannot be growth in population and wealth alone otherwise normalized (or annualized impact) per capita losses should remain steady over time. The increase in per capita losses has therefore to be influenced by additional factors such as (a) more frequent disasters, (b) disasters of larger scale in terms of magnitude or spatial extent, or (c) changes in societal resilience—or a combination of these three factors. While this paper does not address these questions, it provides an outcome baseline against which these drivers could be measured and against which progress in resilience and sustainability could be tracked over time.
Thus, a crucial step toward hazard resilience and sustainable development is to understand the current situation of hazard costs and to determine acceptability based on financial, social, economic, and environmental goals and realities. The political discussion surrounding funding for FEMA and the appropriation of additional disaster relief funds in September 2011, along with the fact that properties insured by the deficit-accumulating NFIP represent the second largest liability of the Federal government after the Social Security Program [65], show that disaster losses are an economic concern. Adaptive actions are necessary to stabilize losses at acceptable levels particularly in the context of climate change and a predicted increase of associated losses [66].
At present though, the inability to fully quantify the economic impacts of disasters [20] makes it difficult to evaluate the effectiveness of hazard mitigation activities and the progress towards resilience. As long as the impacts of natural disasters and the benefits of hazard mitigation are obfuscated by the lack of a standardized data reporting and collection system and by the lack of advanced loss estimation techniques, we seem destined to continue down a path of increasing costs and limited loss reduction. Due to the lack of standardized accounting, the magnitude of losses is likely much higher than we realize and presented in this paper, and by extension, it is challenging to evaluate the effectiveness of loss reduction efforts. Constructing a systematic, national accounting of historical losses is imperative to understanding how we should act to reduce future losses and how to budget for recovery and hazard mitigation in both the short and longer term.
However, improved loss and spending accounting is only the first step toward effective and sustainable mitigation solutions. Mitigation funding should not only focus on past hazard and impacts but also on future disasters. Identifying emerging hazard threats through temporal trends is a valuable component to effective planning and preparedness programs. Additional research is required to investigate the effectiveness of hazard mitigation strategies and to identify alternative strategies for loss reduction and more sustainable mitigation. Long-term thinking has to prevail to reverse the trends of the past fifty years through a sustainable, measured, and targeted approach.


| Spatial Hazard Events and Losses Database for the United States (SHELDUS) | Presidential Disaster Declarations (PDD) | National Flood Insurance Program (NFIP) | Natural Hazards Assessment Network (NATHAN) | |
|---|---|---|---|---|
| Type | Direct Loss Estimates | Federal Individual and Public Assistance Including Some Hazard Mitigation Grant Program Spending | Federally Insured Flood Claims | Privately Insured Hazard Claims |
| Timeframe | 1960–2009 | 1953–2009 | 1978–2010 | 1960–2007 |
| Hazards | Biological | Storm Surge Floods | ||
| Chemical | ||||
| Avalanche | Civil Unrest | |||
| Coastal Hazards | Coastal Hazards | |||
| Drought | Crop Losses | |||
| Earthquake | Dam/Levee Failure | Drought | ||
| Fog | Drought | Earthquake | ||
| Floods | Earthquake | Floods | ||
| Hail | Fire | Hail | ||
| Heat Hurricane | Fishing Losses Floods | Heat Hurricane | ||
| Lightning | Tornado | Severe Storm | ||
| Severe Storms | Freezing | Tornado | ||
| Tornados | Human Caused | Wildfire | ||
| Tsunami | Hurricane | Wind | ||
| Volcano | Mud/Landslide | Winter Weather | ||
| Wildfire | Nuclear | |||
| Wind | Severe Storm | |||
| Winter Weather | Terrorism | |||
| Volcano | ||||
| Tsunami | ||||
| Status | Version 8.0, Open Access | Individual and Public Assistance, Open Access | Open Access | Formerly Open Access Now Only Proprietary Access |
| Source | Hazards and Vulnerability Research Institute [49] | Public Entity Risk Institute [51] | FEMA [52] | Munich Re, Formerly NATHAN (now NATHAN Risk Suite) [53] |
| Total Losses in Billion | Rank Total Losses | Total Losses per Capita | Rank per Capita | Average Annualized Impact (in %) | Rank Annualized Impact | Annual Average per Decade (in $2009 per Capita) | |||||
|---|---|---|---|---|---|---|---|---|---|---|---|
| 1960s | 1970s | 1980s | 1990s | 2000s | |||||||
| U.S. | 573.64 | 2,237 | 0.05 | 24.8 | 31.2 | 32.0 | 56.7 | 80.1 | |||
| Alaska | 7.21 | 24 | 25,676 | 1 | 2.14 | 1 | 2,391.8 | 44.4 | 90.4 | 23.5 | 35.7 |
| Alabama | 13.90 | 9 | 3,297 | 9 | 0.26 | 9 | 6.5 | 100.5 | 10.4 | 82.2 | 134.4 |
| Arkansas | 7.93 | 18 | 3,293 | 10 | 0.30 | 8 | 59.2 | 34.1 | 93.8 | 31.5 | 114.0 |
| Arizona | 1.88 | 39 | 561 | 42 | 0.04 | 41 | 3.8 | 19.7 | 14.1 | 9.2 | 9.3 |
| California | 76.28 | 2 | 2,621 | 15 | 0.16 | 17 | 12.4 | 35.9 | 54.7 | 136.4 | 25.2 |
| Colorado | 5.04 | 28 | 1,562 | 24 | 0.11 | 25 | 43.3 | 10.7 | 20.6 | 56.7 | 25.2 |
| Connecticut | 0.90 | 45 | 284 | 50 | 0.02 | 50 | 1.5 | 10.1 | 12.0 | 3.8 | 1.1 |
| District of Columbia | 0.08 | 51 | 122 | 51 | 0.01 | 51 | 0.1 | 3.7 | 1.9 | 3.0 | 4.1 |
| Delaware | 0.34 | 50 | 515 | 44 | 0.03 | 43 | 10.4 | 9.2 | 6.5 | 11.3 | 14.1 |
| Florida | 54.94 | 3 | 3,558 | 8 | 0.21 | 13 | 29.2 | 11.9 | 4.3 | 84.4 | 229.3 |
| Georgia | 4.42 | 30 | 659 | 40 | 0.05 | 39 | 5.4 | 15.2 | 9.3 | 18.2 | 17.6 |
| Hawaii | 1.69 | 42 | 1,673 | 22 | 0.12 | 24 | 34.1 | 12.3 | 26.1 | 69.3 | 21.3 |
| Iowa | 27.09 | 6 | 9,373 | 5 | 0.61 | 6 | 24.6 | 39.3 | 141.6 | 318.9 | 413.7 |
| Idaho | 5.13 | 27 | 6,798 | 6 | 0.84 | 5 | 546.6 | 37.6 | 16.2 | 75.3 | 3.2 |
| Illinois | 6.31 | 26 | 537 | 43 | 0.03 | 44 | 4.7 | 9.9 | 7.1 | 20.0 | 11.9 |
| Indiana | 7.92 | 19 | 1,404 | 28 | 0.11 | 28 | 17.7 | 63.7 | 7.2 | 11.8 | 41.1 |
| Kansas | 6.77 | 25 | 2,708 | 14 | 0.19 | 15 | 42.2 | 35.5 | 41.7 | 75.2 | 75.9 |
| Kentucky | 4.96 | 29 | 1,319 | 30 | 0.11 | 26 | 19.1 | 25.2 | 6.8 | 56.2 | 26.2 |
| Louisiana | 77.05 | 1 | 17,572 | 2 | 1.22 | 4 | 139.0 | 22.7 | 22.6 | 156.9 | 1,433.8 |
| Massachusetts | 1.94 | 38 | 334 | 49 | 0.02 | 49 | 15.5 | 5.1 | 3.0 | 7.4 | 2.7 |
| Maryland | 1.96 | 37 | 429 | 45 | 0.03 | 46 | 2.6 | 16.8 | 6.4 | 10.3 | 6.8 |
| Maine | 1.77 | 41 | 1,458 | 26 | 0.11 | 27 | 8.6 | 11.7 | 6.6 | 120.9 | 10.1 |
| Michigan | 8.73 | 17 | 974 | 33 | 0.08 | 34 | 45.2 | 7.2 | 23.8 | 9.1 | 12.6 |
| Minnesota | 8.73 | 16 | 2,046 | 20 | 0.15 | 20 | 33.1 | 76.4 | 10.1 | 53.4 | 33.0 |
| Missouri | 7.79 | 21 | 1,484 | 25 | 0.11 | 29 | 13.3 | 44.6 | 7.3 | 22.4 | 60.5 |
| Mississippi | 43.41 | 5 | 15,767 | 4 | 1.31 | 2 | 143.7 | 165.1 | 146.6 | 81.8 | 1,048.8 |
| Montana | 0.68 | 46 | 857 | 36 | 0.08 | 35 | 21.8 | 21.3 | 14.6 | 15.3 | 12.9 |
| North Carolina | 16.18 | 7 | 2,244 | 18 | 0.15 | 18 | 11.3 | 11.9 | 14.9 | 183.5 | 11.1 |
| North Dakota | 10.40 | 13 | 16,173 | 3 | 1.22 | 3 | 62.0 | 115.5 | 315.8 | 908.7 | 214.1 |
| Nebraska | 7.70 | 22 | 4,714 | 7 | 0.32 | 7 | 33.5 | 80.2 | 83.1 | 108.8 | 165.5 |
| New Hampshire | 0.37 | 49 | 366 | 48 | 0.03 | 47 | 10.0 | 6.9 | 3.7 | 8.4 | 9.4 |
| New Jersey | 3.30 | 31 | 422 | 46 | 0.02 | 48 | 5.9 | 8.4 | 0.8 | 16.5 | 10.6 |
| New Mexico | 2.67 | 33 | 1,600 | 23 | 0.12 | 22 | 10.9 | 13.6 | 14.2 | 9.2 | 107.9 |
| Nevada | 1.19 | 43 | 850 | 37 | 0.05 | 40 | 6.7 | 9.2 | 9.1 | 71.0 | 2.8 |
| New York | 12.54 | 10 | 690 | 39 | 0.04 | 42 | 2.6 | 22.5 | 22.6 | 9.6 | 11.9 |
| Ohio | 10.41 | 12 | 946 | 34 | 0.07 | 36 | 15.9 | 25.3 | 10.1 | 11.6 | 32.4 |
| Oklahoma | 7.81 | 20 | 2,377 | 17 | 0.17 | 16 | 14.0 | 19.8 | 38.6 | 76.2 | 90.6 |
| Oregon | 2.20 | 36 | 940 | 35 | 0.09 | 33 | 49.3 | 13.6 | 7.0 | 15.6 | 7.5 |
| Penn-sylvania | 10.11 | 14 | 843 | 38 | 0.06 | 37 | 2.3 | 34.0 | 9.5 | 23.9 | 14.7 |
| Rhode Island | 0.40 | 48 | 412 | 47 | 0.03 | 45 | 6.7 | 21.5 | 1.8 | 13.4 | 2.1 |
| South Carolina | 9.73 | 15 | 2,850 | 13 | 0.23 | 11 | 17.7 | 10.3 | 221.4 | 35.8 | 9.0 |
| South Dakota | 1.83 | 40 | 2,598 | 16 | 0.23 | 10 | 59.0 | 83.5 | 31.8 | 47.4 | 37.5 |
| Tennessee | 2.98 | 32 | 603 | 41 | 0.05 | 38 | 8.8 | 13.5 | 8.4 | 14.6 | 15.6 |
| Texas | 50.52 | 4 | 2,885 | 12 | 0.21 | 14 | 35.3 | 42.5 | 55.7 | 57.8 | 96.7 |
| Utah | 2.21 | 35 | 1,259 | 32 | 0.11 | 30 | 3.7 | 3.9 | 82.4 | 20.6 | 15.8 |
| Virginia | 7.35 | 23 | 1,326 | 29 | 0.10 | 31 | 18.1 | 58.6 | 18.3 | 30.9 | 7.5 |
| Vermont | 0.94 | 44 | 1,824 | 21 | 0.15 | 19 | 7.1 | 62.7 | 79.2 | 23.5 | 9.5 |
| Washington | 14.19 | 8 | 3,245 | 11 | 0.23 | 12 | 16.3 | 75.5 | 146.4 | 17.4 | 57.2 |
| Wisconsin | 10.56 | 11 | 2,104 | 19 | 0.14 | 21 | 6.6 | 75.4 | 14.4 | 38.8 | 75.8 |
| West Virginia | 2.65 | 34 | 1,425 | 27 | 0.12 | 23 | 5.1 | 18.5 | 60.6 | 20.7 | 38.1 |
| Wyoming | 0.58 | 47 | 1,284 | 31 | 0.09 | 32 | 20.0 | 31.4 | 55.2 | 8.0 | 17.3 |
References and Notes
- Kunreuther, H.C.; Michel-Kerjan, E.O. At War with the Weather: Managing Large-Scale Risks in a New Era of Catastrophes; The MIT Press: Cambridge, MA, USA, 2009; p. 416. [Google Scholar]
- Cutter, S.L.; Emrich, C.T. Are natural hazards and disaster losses in the U.S. increasing? EOS Trans. Am. Geophys. Union 2005, 86. [Google Scholar]
- Birkmann, J.; Garschagen, M.; Kraas, F.; Quang, N. Adaptive urban governance: New challenges for the second generation of urban adaptation strategies to climate change. Sustain. Sci. 2010, 5, 185–206. [Google Scholar]
- Few, R. Health and climatic hazards: Framing social research on vulnerability, response, and adaptation. Glob. Environ. Change 2007, 17, 281–295. [Google Scholar]
- Spiegel, P.B.; Le, P.; Ververs, M.-T.; Salama, P. Occurrence and overlap of natural disasters, complex emergencies and epidemics during the past decade (1995–2004). Confl. Health 2007, 1. [Google Scholar] [CrossRef]
- Anthes, R.A.; Corell, R.W.; Hollan, G.; Hurrell, J.W.; MacCracken, M.C.; Trenberth, K.E. Hurricanes and global warming—Potential linkages and consequences. Bull. Am. Meteorol. Soc. 2006, 87, 623–628. [Google Scholar]
- McBean, G. Climate change and extreme weather: A basis for action. Nat. Hazards 2004, 31, 177–190. [Google Scholar]
- IPCC. Climate Change 2007: Impact, Adaptation and Vulnerability. Contribution of Working Group II to the Fourth Assessment Report of the Intergovernmental Panel on Climate Change; Cambridge University Press: Cambridge, UK, 2007; p. 976. [Google Scholar]
- Munich Re. Climate Change, Climate Risk, Climate Chance; 302-05874; Münchener Rückversicherungs-Gesellschaft: Munich, Germany, 2009; p. 44. [Google Scholar]
- Smolka, A. Natural disasters and the challenge of extreme events: Risk management from an insurance perspective. Philos. Trans. R. Soc. A 2006, 364, 2147–2165. [Google Scholar]
- Heck, P.; Bresch, D.; Tröber, S. The Effects of Climate Change: Storm Damage in Europe on the Rise; Swiss Reinsurance Company: Zurich, Switzerland, 2006. [Google Scholar]
- Buhayar, N. Insurance rates climb on disaster costs. Bloomberg 2011. [Google Scholar]
- Munich Re. Changing Values: A Risk of Change; Münchener Rückversicherungs-Gesellschaft: Munich, Germany, 2010; p. 60. [Google Scholar]
- Burby, R.J. Hurricane Katrina and the paradoxes of government disaster policy: Bringing about wise governmental decisions for hazardous areas. In Shelter from the Storm: Repairing the National Emergency Management System after Hurricane Katrina; Waugh, W.L., Ed.; Annals of the American Academy of Political and Social Science: Philadelphia, PA, USA, 2006; Volume 604, pp. 171–191. [Google Scholar]
- Comfort, L.K.; Birkland, T.A.; Cigler, B.A.; Nance, E. Retrospectives and prospectives on Hurricane Katrina: Five years and counting. Public Adm. Rev. 2010, 70, 669–678. [Google Scholar]
- Garrett, T.A.; Sobel, R.S. The political economy of FEMA disaster payments. Econ. Inq. 2003, 41, 496–509. [Google Scholar]
- Godschalk, D.R.; Rose, A.; Mittler, E.; Porter, K.; West, C.T. Estimating the value of foresight: Aggregate analysis of natural hazard mitigation benefits and costs. J. Environ. Plan. Man. 2009, 52, 739–756. [Google Scholar]
- Cochrane, H. Economic loss: Myth and measurement. Disaster Prev. Manag. 2004, 13, 290–296. [Google Scholar]
- Pielke, R.A.J. Mistreatment of the economic impacts of extreme events in the Stern review report on the economics of climate change. Glob. Environ. Change 2007, 17, 302–310. [Google Scholar]
- National Research Council. The Impacts of Natural Disasters: A Framework for Loss Estimation; National Academies Press: Washington DC, USA, 1999; p. 80. [Google Scholar]
- Mileti, D.S. Disasters by Design: A Reassessment of Natural Hazards in the United States; Joseph Henry Press: Washington, DC, USA, 1999. [Google Scholar]
- National Research Council. Confronting Natural Disasters: An International Decade for Natural Hazard Reduction; National Academy Press: Washington DC, USA, 1987; p. 60. [Google Scholar]
- White, G.F. A perspective on reducing losses from natural hazards. Bull. Am. Meteorol. Soc. 1994, 75, 1237–1240. [Google Scholar]
- Guha-Sapir, D.; Below, R. The Quality and Accuracy of Disaster Data: A Comparative Analysis of Three Global Data Sets; ProVention Consortium, The World Bank Group: Geneva, Switzerland, 2002. [Google Scholar]
- Gall, M.; Borden, K.A.; Cutter, S.L. When do losses count? Six fallacies of natural hazards loss data. Bull. Am. Meteorol. Soc. 2009, 90, 799–809. [Google Scholar]
- Bouwer, L.M.; Crompton, R.P.; Faust, E.; Höppe, P. Confronting disaster losses. Science 2007, 318, 753–753. [Google Scholar]
- National Research Council. Facing Hazards and Disasters: Understanding Human Dimensions; The National Acadamies Press: Washington DC, USA, 2006; p. 388. [Google Scholar]
- Borden, K.A.; Cutter, S.L. Spatial patterns of natural hazards mortality in the United States. Int. J. Health Geogr. 2008, 7, 64:1–64:13. [Google Scholar]
- Thacker, M.T.F.; Lee, R.; Sabogal, R.I.; Henderson, A. Overview of deaths associated with natural events, United States, 1979–2004. Disasters 2008, 32, 303–315. [Google Scholar]
- Ashley, W.S. Spatial and temporal analysis of tornado fatalities in the United States: 1880–2005. Weather Forecast. 2007, 22, 1214–1228. [Google Scholar]
- Rose, A. Economic Principles, Issues, and Research Priorities in Hazard Loss Estimation. In Modeling Spatial and Economic Impacts of Disasters; Okuyama, Y., Chang, S.E., Eds.; Springer Verlag: New York, NY, USA, 2004; pp. 13–36. [Google Scholar]
- Heinz Center for Science, E., and the Environment. The Hidden Costs of Coastal Hazards: Implications for Risk Assessment and Mitigation; Island Press: Covello, CA, USA, 2000; p. 220. [Google Scholar]
- Degg, M. Natural Disasters—Recent Trends and Future-Prospects. Geography 1992, 77, 198–209. [Google Scholar]
- Riebsame, W.E.; Diaz, H.F.; Moses, T.; Price, M. The social burden of weather and climate hazards. Bull. Am. Meteorol. Soc. 1986, 67, 1378–1388. [Google Scholar]
- Gall, M. Social dynamics of Unnatural Disasters: Parallels between Hurricane Katrina and the 2003 European Heat Wave. In Dynamics of Disaster; Dowty, R.A., Allen, B.L., Eds.; Earthscan: Washington, DC, USA, 2011; pp. 159–172. [Google Scholar]
- White, G.F.; Kates, R.W.; Burton, I. Knowing better and losing even more: The use of knowledge in hazards management. Environ. Hazards 2001, 3, 81–92. [Google Scholar]
- Ashley, W.S.; Gilson, C.W. A reassessment of U.S. lightning mortality. Bull. Am. Meteorol. Soc. 2009, 90, 1501–1518. [Google Scholar]
- Cutter, S.L. American Hazardscapes: The Regionalization of Hazards and Disasters; Joseph Henry Press: Washington, DC, USA, 2001; p. 211. [Google Scholar]
- Kunkel, K.E.; Pielke, R.A.; Changnon, S.A. Temporal fluctuations in weather and climate extremes that cause economic and human health impacts: A review. Bull. Am. Meteorol. Soc. 1999, 80, 1077–1098. [Google Scholar]
- Changnon, S.D.; Changnon, J.M. Losses caused by weather and climate extremes: A national index for the United States. Phys. Geogr. 2001, 22, 1–27. [Google Scholar]
- Changnon, S.D. Shifting economic impacts from weather extremes in the United States: A result of societal changes, not global warming. Nat. Hazards 2003, 29, 273–290. [Google Scholar]
- Schmidt, S.; Kemfert, C.; Höppe, P. Tropical cyclone losses in the USA and the impact of climate change—A trend analysis based on data from a new approach to adjusting storm losses. Environ. Impact Assess. Rev. 2009, 29, 359–369. [Google Scholar]
- Downton, M.W.; Barnard Miller, J.Z.; Pielke, R.A.J. Reanalysis of U.S. National Weather Service flood loss database. Nat. Hazards Rev. 2005, 6, 13–22. [Google Scholar]
- Easterling, D.R.; Meehl, G.A.; Parmesan, C.; Changnon, S.A.; Karl, T.R.; Mearns, L.O. Climate extremes: Observations, modeling, and impacts. Science 2000, 289, 2068–2074. [Google Scholar]
- Barredo, J.I. Normalized flood losses in Europe: 1970–2006. Nat. Hazard Earth Syst. Sci. 2009, 9, 97–104. [Google Scholar]
- Pielke, R.A.J.; Gratz, J.; Landsea, C.W.; Collins, D.; Saunders, M.A.; Musulin, R. Normalized hurricane damage in the United States: 1900–2005. Nat. Hazards Rev. 2008, 9, 29–42. [Google Scholar]
- Crompton, R.P.; Pielke, R.A.J.; McAneney, K.J. Emergence timescales for detection of anthropogenic cimate change in US tropical cyclone loss data. Environ. Res. Lett. 2011, 6, 014003. [Google Scholar]
- Neumayer, E.; Barthel, F. Normalizing economic loss from natural disasters: A global analysis. Glob. Environ. Change 2011, 21, 13–24. [Google Scholar]
- The Spatial Hazard Events and Losses Database for the United States, Version 8.0 [Online Database]; Hazards & Vulnerability Research Institute (HVRI): Columbia, SC, USA. Available online: http://sheldus.org (accessed on 1 January 2011).
- NWS. Storm Data Preparation; National Weather Service Instruction 10-1605; Department of Commerce, National Oceanic & Atmospheric Administration, National Weather Service (NWS): Silver Spring, MD, USA; 17; August; 2007; p. 97. [Google Scholar]
- Presidential Disaster Declarations, Data Description and Analysis; Public Entity Risk Institute: Washington, DC, USA, 2011. Available online: http://www.peripresdecusa.org/mainframe.htm (accessed on 1 January 2011).
- National Flood Insurance Program, Flood Insurance Statistics; Federal Emergency Management Agency: Washington, DC, USA, 2011. Available online: http://www.fema.gov/business/nfip/statistics/statscall.shtm (accessed on 1 March 2011).
- Munich Re. NATHAN Online database; Munich Re: Munich, Germany, 2008. Available online: http://www.munichre.com/en/service/connect/nathan.aspx (accessed on 22 August 2008).
- Pielke, R.A.J.; Landsea, C.W. Normalized hurricane damages in the United States: 1925-95. Weather Forecast. 1998, 13, 621–631. [Google Scholar]
- FEMA. Robert T. Stafford Disaster Relief and Emergency Assistance Act, as amended, and Related Authorities; FEMA 592; Federal Emergency Management Agency: Washington, DC, USA; June; 2007. [Google Scholar]
- Hazard Mitigaton Grant Program (HMGP, CFDA Number: 97.039); Federal Emergency Management Agency: Washington, DC, USA, 2011. Available online: http://data.gov (accessed on 20 February 2011).
- Blake, E.S.; Rappaport, E.N.; Landsea, C.W. The Deadliest, Costliest, and Most Intense United States Tropical Cyclones from 1851 to 2006 (and Other Frequently Requested Hurricane Facts); NWS TPC-5; National Hurricane Center (NHC): Miami, FL, USA, 2007; p. 45. [Google Scholar]
- Gershunov, A.; Barnett, T.P. ENSO influence on intraseasonal extreme rainfall and temperature frequencies in the contiguous United States: Observations and model results. J. Clim 1998, 11, 1575–1586. [Google Scholar]
- GAO. Action Needed to Improve the Administration of the National Flood Insurance Program; GAO-11-297; United States General Accounting Office: Washington DC, USA, 2011; p. 89. [Google Scholar]
- King, R.O. National Flood Insurance Program: Background, Challenges, and Financial Status; R40650; Congressional Research Service: Washington, DC, USA; 1; July; 2011. [Google Scholar]
- GAO. Flood Insurance: Public Goals Goals Provide a Framework for Reform; United States Government Accountability Office: Washington, DC, USA; 23; June; 2011; p. 21. [Google Scholar]
- Flood Insurance Subcommittee. The National Flood Insurance Program: Past, Present, and Future? American Academies of Actuaries: Washington, DC, USA; July; 2011; p. 55. [Google Scholar]
- CBO. The National Flood Insurance Program: Factors Affecting Actuarial Soundness; 4008; Congress of the United States Congressional Budget Office: Washington DC, USA; November; 2009; p. 52. [Google Scholar]
- Multihazard Mitigation Council. Natural Hazard Mitigation Saves: An Independent Study to Assess the Future Savings from Mitigation Activities; National Institute of Buildings Sciences: Washington, DC, USA, 2005; p. 19. [Google Scholar]
- National Ocean Service. Gulf of Mexico at a Glance: A Second Glance; US Department of Commerce: Washington DC, USA, 2011; p. 34. [Google Scholar]
- Karl, T.R.; Melillo, J.M.; Peterson, T.C. Global Climate Change Impacts in the United States; Cambridge University Press: New York, NY, USA, 2009; p. 196. [Google Scholar]
© 2011 by the authors; licensee MDPI, Basel, Switzerland. This article is an open access article distributed under the terms and conditions of the Creative Commons Attribution license (http://creativecommons.org/licenses/by/3.0/).
Share and Cite
Gall, M.; Borden, K.A.; Emrich, C.T.; Cutter, S.L. The Unsustainable Trend of Natural Hazard Losses in the United States. Sustainability 2011, 3, 2157-2181. https://doi.org/10.3390/su3112157
Gall M, Borden KA, Emrich CT, Cutter SL. The Unsustainable Trend of Natural Hazard Losses in the United States. Sustainability. 2011; 3(11):2157-2181. https://doi.org/10.3390/su3112157
Chicago/Turabian StyleGall, Melanie, Kevin A. Borden, Christopher T. Emrich, and Susan L. Cutter. 2011. "The Unsustainable Trend of Natural Hazard Losses in the United States" Sustainability 3, no. 11: 2157-2181. https://doi.org/10.3390/su3112157