
Analysis of Carbon Emissions Embodied in the Provincial Trade of China Based on an Input–Output Model and k-Means Algorithm

1
National Engineering Research Center of Lower-Carbon Catalysis Technology, Dalian Institute of Chemical Physics, Chinese Academy of Sciences, Dalian 116023, China
2
University of Chinese Academy of Sciences, Beijing 100049, China
3
School of Chemistry and Materials Science, University of Science and Technology of China, Hefei 230026, China
*
Author to whom correspondence should be addressed.
Sustainability 2023, 15(12), 9196; https://doi.org/10.3390/su15129196
Submission received: 28 April 2023
/
Revised: 1 June 2023
/
Accepted: 3 June 2023
/
Published: 7 June 2023
/
Corrected: 14 November 2023
Abstract
:National or regional carbon emissions are generally accounted for by the principle of “producer responsibility”, which ignores the embodied carbon emissions implied in product consumption via inter-regional trade. Therefore, it is necessary to include the embodied carbon emissions into the product consumption regions for overall calculation. As an example, this paper analyzes the characteristics of China’s domestic regional carbon flow network based on a multiregional input–output table and carbon emission data, identifying three clusters of carbon emission characteristic regions by k-means—the clustering algorithm of machine learning. The research results show that some provinces—such as Beijing, Zhejiang, and Guangdong—are the net input areas of embodied carbon emissions (“consumers”), consuming products and services produced by “producers” such as Hebei, Shanxi, and Inner Mongolia through trade, implicitly transferring the responsibility for carbon emissions. Accounting for carbon emissions worldwide/countrywide should consider both production responsibility and trade income. Our findings provide a novel national or regional classification approach based on embodied carbon emissions, which calls for an equitable regional distribution system of carbon emission rights. Meantime, inter-regional cooperation is of great significance in achieving carbon neutrality. In particular, the economically developed regions need to offer assistance to improve the energy efficiency or optimize the energy structure in less developed regions, by means of capital investment and technology transformation.
1. Introduction
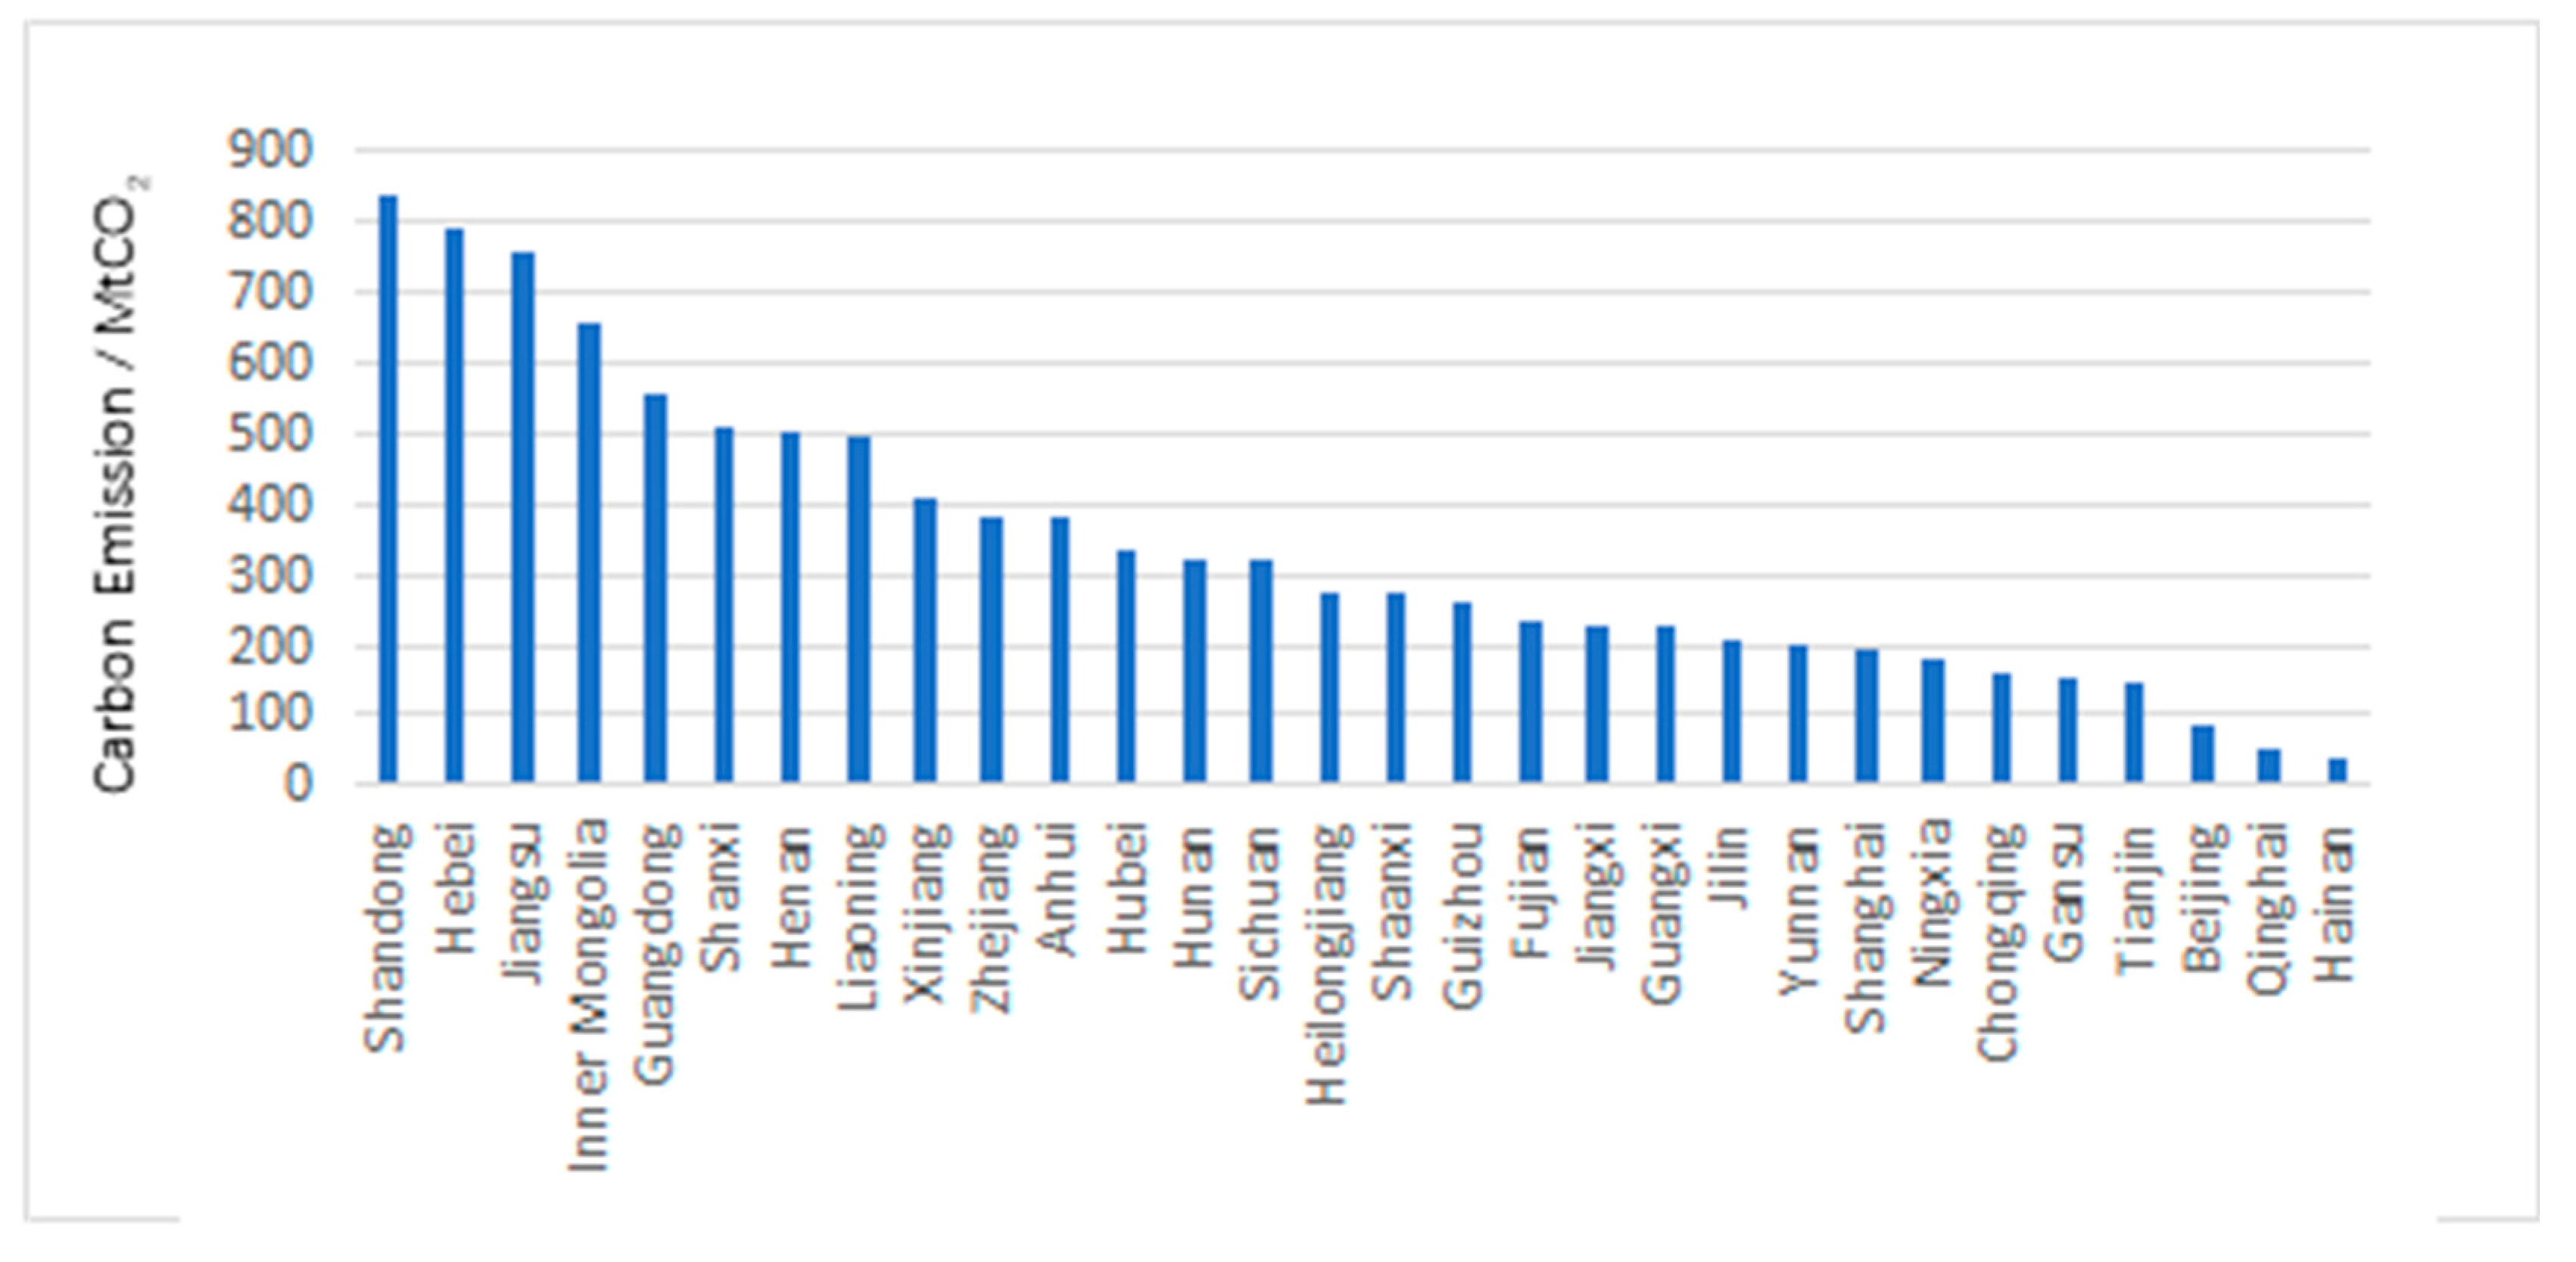
In recent years, China has experienced remarkable economic growth, resulting in a significant increase in domestic carbon dioxide emissions, driven by the escalating demand for fossil fuels. This surge in emissions propelled China to surpass the United States as the world’s largest carbon dioxide emitter in 2005 [1]. China’s commitment to addressing climate change is evident through its goals of achieving peak carbon dioxide emissions by 2030 and carbon neutrality by 2060, commonly known as the “carbon peaking and carbon neutrality goals” [2]. However, China, with its vast territorial expanse, faces the challenge of uneven regional carbon emissions and economic development. For instance, examining the carbon emissions data for 2017 reveals that provinces with low emissions exhibited direct carbon emissions of less than 100 million tons, while those with higher emissions approached close to 1 billion tons (Figure 1) [3,4,5]. It is crucial to recognize the substantial regional disparities in carbon emissions within China. Studies have shown that the difference in economic development levels between the eastern and western regions is an important factor that causes a shift in the center of gravity and intensity of carbon emissions to the west [6].
Commonly, the eastern regions of China manifest relatively lower carbon emissions but higher economic growth rates. Conversely, the western regions exhibit higher carbon emissions, while their economic growth is relatively slower [7]. However, the policymaking process seems to fail to account for these regional disparities adequately. For instance, the practical policies concerning regional energy consumption—which is closely related to carbon emissions—are still based on a one-size-fits-all approach. This apparently overlooks the different circumstances between the eastern and western regions [8,9]. In order to address the issue of regional disparities, it is crucial to consider the unique characteristics of each region in terms of carbon emissions. In view of the rapidly increasing complexity of global industrial chains, it can be shown that the embodied carbon emissions—i.e., the direct and indirect carbon emissions in the production process to meet final demand [10]—should be taken into account. In a certain region, the direct carbon emissions might be shifted to other regions via trading of products. In other words, the redistribution of resources—including goods and services—through trade channels is instrumental in facilitating the transfer of embodied carbon emissions from the consumer regions to producer regions [11]. Therefore, it is of practical significance to carry out targeted analysis of the flow of carbon emissions in trade, which is expected to provide the potential theoretical basis for understanding the regional imbalance of carbon emissions and its implications for the sustainable economic development of the whole country.
One of the effective approaches is to consider the flow of embodied carbon emissions resulting from trade activities between regions. Zhang et al. studied the embodied carbon emissions of China in the context of international trade, and they found that China’s production carbon emissions exceed its consumption emissions [12]. Long et al. analyzed the embodied carbon emissions resulting from trade activities between China and Japan, revealing that Japan’s carbon emissions from production were considerably lower than those from consumption [13]. Xu et al. investigated the embodied energy and pollutant emissions in China–US trade through environmental input–output analysis (IOA). The results indicated that from 2002 to 2007, the embodied carbon flow reflected in the eastbound trade between China and the United States ranged from 400 to 800 MtCO2, accounting for approximately 8–12% of China’s direct carbon emissions [14]. It is clear that the trade between two regions or countries can be the carrier that shifts the carbon emissions. For instance, the developed countries (e.g., the United States, Japan, and countries in Western Europe) dominating the final consumption of products in trade could become the net importers of carbon emissions, as most of the products are produced in developing countries (e.g., China, India, and Russia) with much higher carbon emissions [15,16]. If the “consumer responsibility principle” is used to allocate the carbon emission responsibilities, developing regions or countries (as the producers) should take less of the burden of carbon emission reduction than they actually do, while developed regions or countries with significant final consumption should hold greater responsibility and obligation for reducing carbon emissions. However, the above studies are mostly based on bilateral trade relations and cannot reflect the carbon emissions imbalance of the entire country/world.
The flow of embodied carbon emissions among different regions can be much more complicated. Cheng et al. studied the inter-regional bilateral trade and carbon emissions embodied in the interprovincial trade of Northeast China (Liaoning, Jilin, and Heilongjiang Provinces), and they showed that from 1997 to 2007 the net carbon emissions resulting from interprovincial trade primarily flowed from Northeast China to 16 southern and eastern provinces [17]. In another study on the carbon emissions embodied in trade in the Beijing–Tianjin–Hebei region in 2013, it was found that Beijing and Tianjin are net inflow provinces of carbon dioxide, while Hebei as a net outflow area [18]. Su et al. artificially divided China into eight regions based on geographical location, explaining how inter-regional trade and international trade affect China’s regional domestic emissions [19]. Li et al. calculated the net embodied carbon emissions outflowing from Shanxi and the embodied carbon emissions of 29 departments in interprovincial trade [20]. As can be seen, although some studies on the flow of embodied carbon emissions among different regions via trade have been conducted, they mostly focus on the regional carbon emissions flow in the bilateral trade between a certain region and its neighboring regions. The lack of a comprehensive analysis on the embodied carbon emissions in multilateral trade still hinders the understanding of regional imbalance in carbon emissions and its implications for policymaking for the whole country/regions.
Therefore, it is imperative to undertake further exploration and extract the intrinsic relationship between carbon emissions and multilateral trade for different regions. By identifying the unique features of each region, it is then possible to make a reasonable classification of the regions in terms of the trade-related carbon emissions flow, which would form the theoretical basis for making the corresponding carbon reduction policies according to the carbon emission characteristics of different regions. We believe that this work can shed some light on the endeavors of the targeted national or regional carbon reduction policies and the corresponding measures of implementation.
In light of these considerations, the purpose of this paper is twofold: to analyze the interprovincial embodied carbon emissions brought by multilateral trade using the IOA approach, and to classify the provinces using a k-means algorithm based on the carbon emission characteristics. The remaining parts of this paper are arranged as follows: Section 2 presents the calculation method of embodied carbon emissions from the perspective of production and consumption based on IOA, along with the calculation method of trade difference and production/consumption difference based on this, and clusters different provinces by using a machine learning algorithm. Section 3 presents the calculation results, reports the analysis of 30 provinces in China and the interprovincial emissions caused by trade circulation, clusters different provinces by using a machine learning k-means algorithm, and analyzes the provinces with similar characteristics. We discuss the experimental results in Section 4 and provide corresponding policy recommendations. Section 5 presents the conclusions and summarizes the research.
2. Methodology
The main measurement method of carbon emission transfer in recent years has been based on input–output analysis. This model was first proposed by the economist Wassily W. Leontief in the 1930s [21]. Since the 1960s, it has been widely used by geographers and economists in various fields, such as regional industrial composition analysis and regional interaction analysis, and it has been applied by experts and scholars to the calculation of embodied energy since the 1990s [22,23,24]. IOA can track the CO2 emissions in the direct and indirect energy use of product production. It is a mainstream method to study the carbon transfer of economy and trade at the macro level. By compiling the input–output (IO) table and establishing the corresponding mathematical model, we can demonstrate the relationships between regions, departments, or industries in the economic system. The application of IO models includes single-region input–output (SRIO), inter-regional input–output (IRIO), and multiregional input–output (MRIO) models, tracking financial and material flows in international trade, and establishing databases that are widely used in this research field—such as WIOD, EXIOBASE, and EORA [25,26,27,28]. Moreover, IOA can be used in environmental analysis by adding additional columns, such as energy, carbon emissions, water usage, etc. [29,30].
Studies incorporating IOA have analyzed environmental flows in different regions and sectors. For instance, one study utilized a multi-scenario factor analysis and multiregional input–output (MFA-MRIO) model to simulate the carbon dioxide emissions pathway in Beijing, Tianjin, and Hebei, revealing the individual and interactive effects of various factors, departments, and cities within the urban agglomeration. The study emphasized that the highest CO2 flow occurred from Hebei to Beijing. It also highlighted the potential positive impact on carbon intensity reduction if final demand reduction policies were implemented for high-carbon-emission sectors in Tianjin and Hebei [31]. Furthermore, Chen et al. analyzed the carbon transfer within the industry in Dongguan, based on the IO situation of Guangdong Province, and developed a method to analyze the urban carbon metabolism process using provincial IO tables [32].
This paper aims to calculate the flow of embodied carbon emissions brought about by interprovincial and inter-regional trade. To achieve this goal, we compiled an environmental extended IO table containing 30 provinces’ input–output situations by integrating regional trade flows into embodied carbon emission flows, where i represents the horizontal region and j represents the column area. In the horizontal relationship, it represents the sum of the quantity of products provided by region i to each region for production and consumption—that is, the quantity of intermediate products. From the perspective of column relationships, it represents the sum of the product quantities consumed by i regions in the production process. Yi represents the total final use of region i; Xi represents the total output of region i; Xj represents the total input of region j. There are
where aij is the direct consumption coefficient of the production–consumption relationship between region i and region j. Since the linear equations have a one-to-one correspondence with the matrix, the linear Equation (1) can be rewritten in the form of the following matrix:
where, A represents the direct consumption coefficient matrix composed of aij, which is an IO coefficient matrix reflecting the technical level. X and Y represent the total output column vector and final use column vector of each region, respectively, and the diagonal matrix Y is the final demand vector. Resolve (3) to obtain
Equation (4) describes all direct and indirect IO relationships between different departments, where (I − A)−1 is called the Leontief inverse matrix.
2.1. Defining System Boundaries
We compiled the Chinese IO table of 2017 for 30 provinces from the MRIO table as the boundary of the regional carbon emission transfer network in this work, excluding Tibet, Hong Kong, Macao, and Taiwan due to a lack of basic data.
The final demand and intermediate demand of each province also include imported products and services. As the carbon emissions indirectly caused by these imported products and services occur abroad, this paper only focuses on China’s domestic carbon emissions, so the imported part of carbon emissions is temporarily excluded.
2.2. Establishment of Provincial IO Table
Since the national IO table is compiled in the 2nd and 7th years of each decade, Zheng et al. calculated the MRIO table of 42 departments in 31 provinces in 2017 according to the latest national IO table [33]. On the basis of Zheng’s work, the IO tables of 30 provinces and regions were compiled by spatial aggregation.
In this way, the statistical data of the various factors that affect the model can be obtained and simplified through the values of the national provinces and industries, and the direct consumption coefficient matrix can be calculated according to the IO table of the 30 provinces. It must be stated that we assume that all of the provinces and regions share the same technical level in this work for better calculation.
2.3. Calculation of Embodied Carbon Emissions
China’s IO table can add additional columns by adding environmental extended input–output analysis (EEIOA), such as energy use, carbon emissions, water consumption, and air pollutants [23,24]. For example, data on energy inputs for each sector and region can be used to assess the carbon emissions reflected in trade between 30 sectors and 30 regions. Using the environmental emission coefficient, the carbon emission flow matrix between regional grids can be calculated with the following equations:
where F is the diagonal matrix of the direct carbon flow generating carbon emissions per unit of GDP in the region, i.e., carbon emission density. Y is the diagonal matrix of the final demand vector, and G is the carbon emission flow matrix after matrix multiplication. The assumption is that the products or services obtained by each region from other regions are completely used for regional use, and that all production inputs in the region come from regional resources and can be used as the final use of the region. Therefore, the embodied carbon emissions caused by trade flows in domestic regions only come from regional emissions. Through the matrix calculation in the network, the transfer channels and quantities of embodied carbon emissions in each region are obtained, so as to see the actual carbon emissions and transfer at the consumer end of each region in the process of national carbon emissions.
2.4. The Relationship between Monetary Trade Flow and Embodied Carbon Emissions
The traditional IO model does not consider the impact of trade on regional carbon emissions, so the model needs to be adjusted and improved. When adding the influencing factors of regional import and export trade, adjust the calculation method of embodied carbon emission migration brought by interprovincial trade gradually, and consider the impact of embodied carbon emissions brought by regional import and export trade.
where represents the net carbon emissions from province K to other provinces or regions; represents the total embodied carbon emissions from the perspective of the consumption of province K, while shows its total direct productive carbon emissions from the perspective of production. A positive or negative value of means that the embodied carbon emissions generated by consumption in province K are more or less than those generated by production, respectively.
Similarly, the net momentum trade value flow can be calculated according to the same principles:
where represents the net value flow of interprovincial monetary trade from province K to other provinces; represents the total monetary consumption of province K, while represents the total monetary output of province K. A positive or negative value means that the monetary consumption of province K is more or less than its monetary production, respectively. The positive trade surplus and net carbon emissions are not always consistent, but a large trade surplus is more likely to lead to positive provincial net carbon emissions [34].
Based on the above model, we can obtain the net carbon flow network between Chinese provinces caused by trade. We take the net carbon flow and balance of trade flow of provinces as two statistical dimensions to carry out machine learning clustering.
2.5. Clustering Provinces by the Machine Learning Clustering Algorithm
In order to overcome the weakness of the traditional statistical method, we imported the machine learning method to cluster the carbon flow network and trade flow network of different provinces as two statistical data dimensions and analyze the characteristics of different types of provinces and their roles in the carbon emission network.
The k-means clustering algorithm is one of the most popular and elegant clustering methods in machine learning. It is used to divide the dataset into k different and non-overlapping clusters [35,36]. Under the background of machine learning, k-means clustering analysis is an unsupervised task. It is a clustering algorithm based on the common characteristics of the sample set. Firstly, the algorithm automatically selects k seeds as the initial centroid of each class in class k. Then, it calculates the distance between each seed and the centroid of each class and re-divides all seeds into class k according to the distance. Furthermore, it recalculates the centroid of each class. The above calculation process is iterated for as many times as necessary until the requirement of function convergence is met; that is, the cluster’s center will not change. In our case, the k-means clustering algorithm was used to establish a regional evaluation model according to the economic carbon emission difference data in the IO model. The algorithm clustered the vectors of n = 30 provinces. We set the sample dimension m = 2 (namely, provincial economic difference and carbon emission difference) and divided them into clusters of quantity k by the k-means algorithm to determine the provinces with high or low economic/carbon emission differences with common characteristics.
In this study, we comprehensively clustered provinces through k-means clustering and its components. The clustering results were evaluated by the elbow method and CH method. We studied different clusters and then deeply analyzed the typical characteristics of different provincial clusters. The programming was implemented using the Python language to complete the k-means clustering.
2.6. Data Sources
Most of the data used in this paper are from China carbon emission accounts and datasets (CEADs) [37] and professional knowledge service systems for energy. In order to facilitate calculation, all carbon emissions data in this study were converted into million tons of carbon dioxide equivalents (MtCO2). Due to the cumbersome preparation of China’s IO table, the mantissa of the year is prepared every 2nd and 7th year of each decade, so 2017 is the latest year for which data are available at present.
3. Results
3.1. Carbon Flows Based on Production and Consumption between 30 Provinces
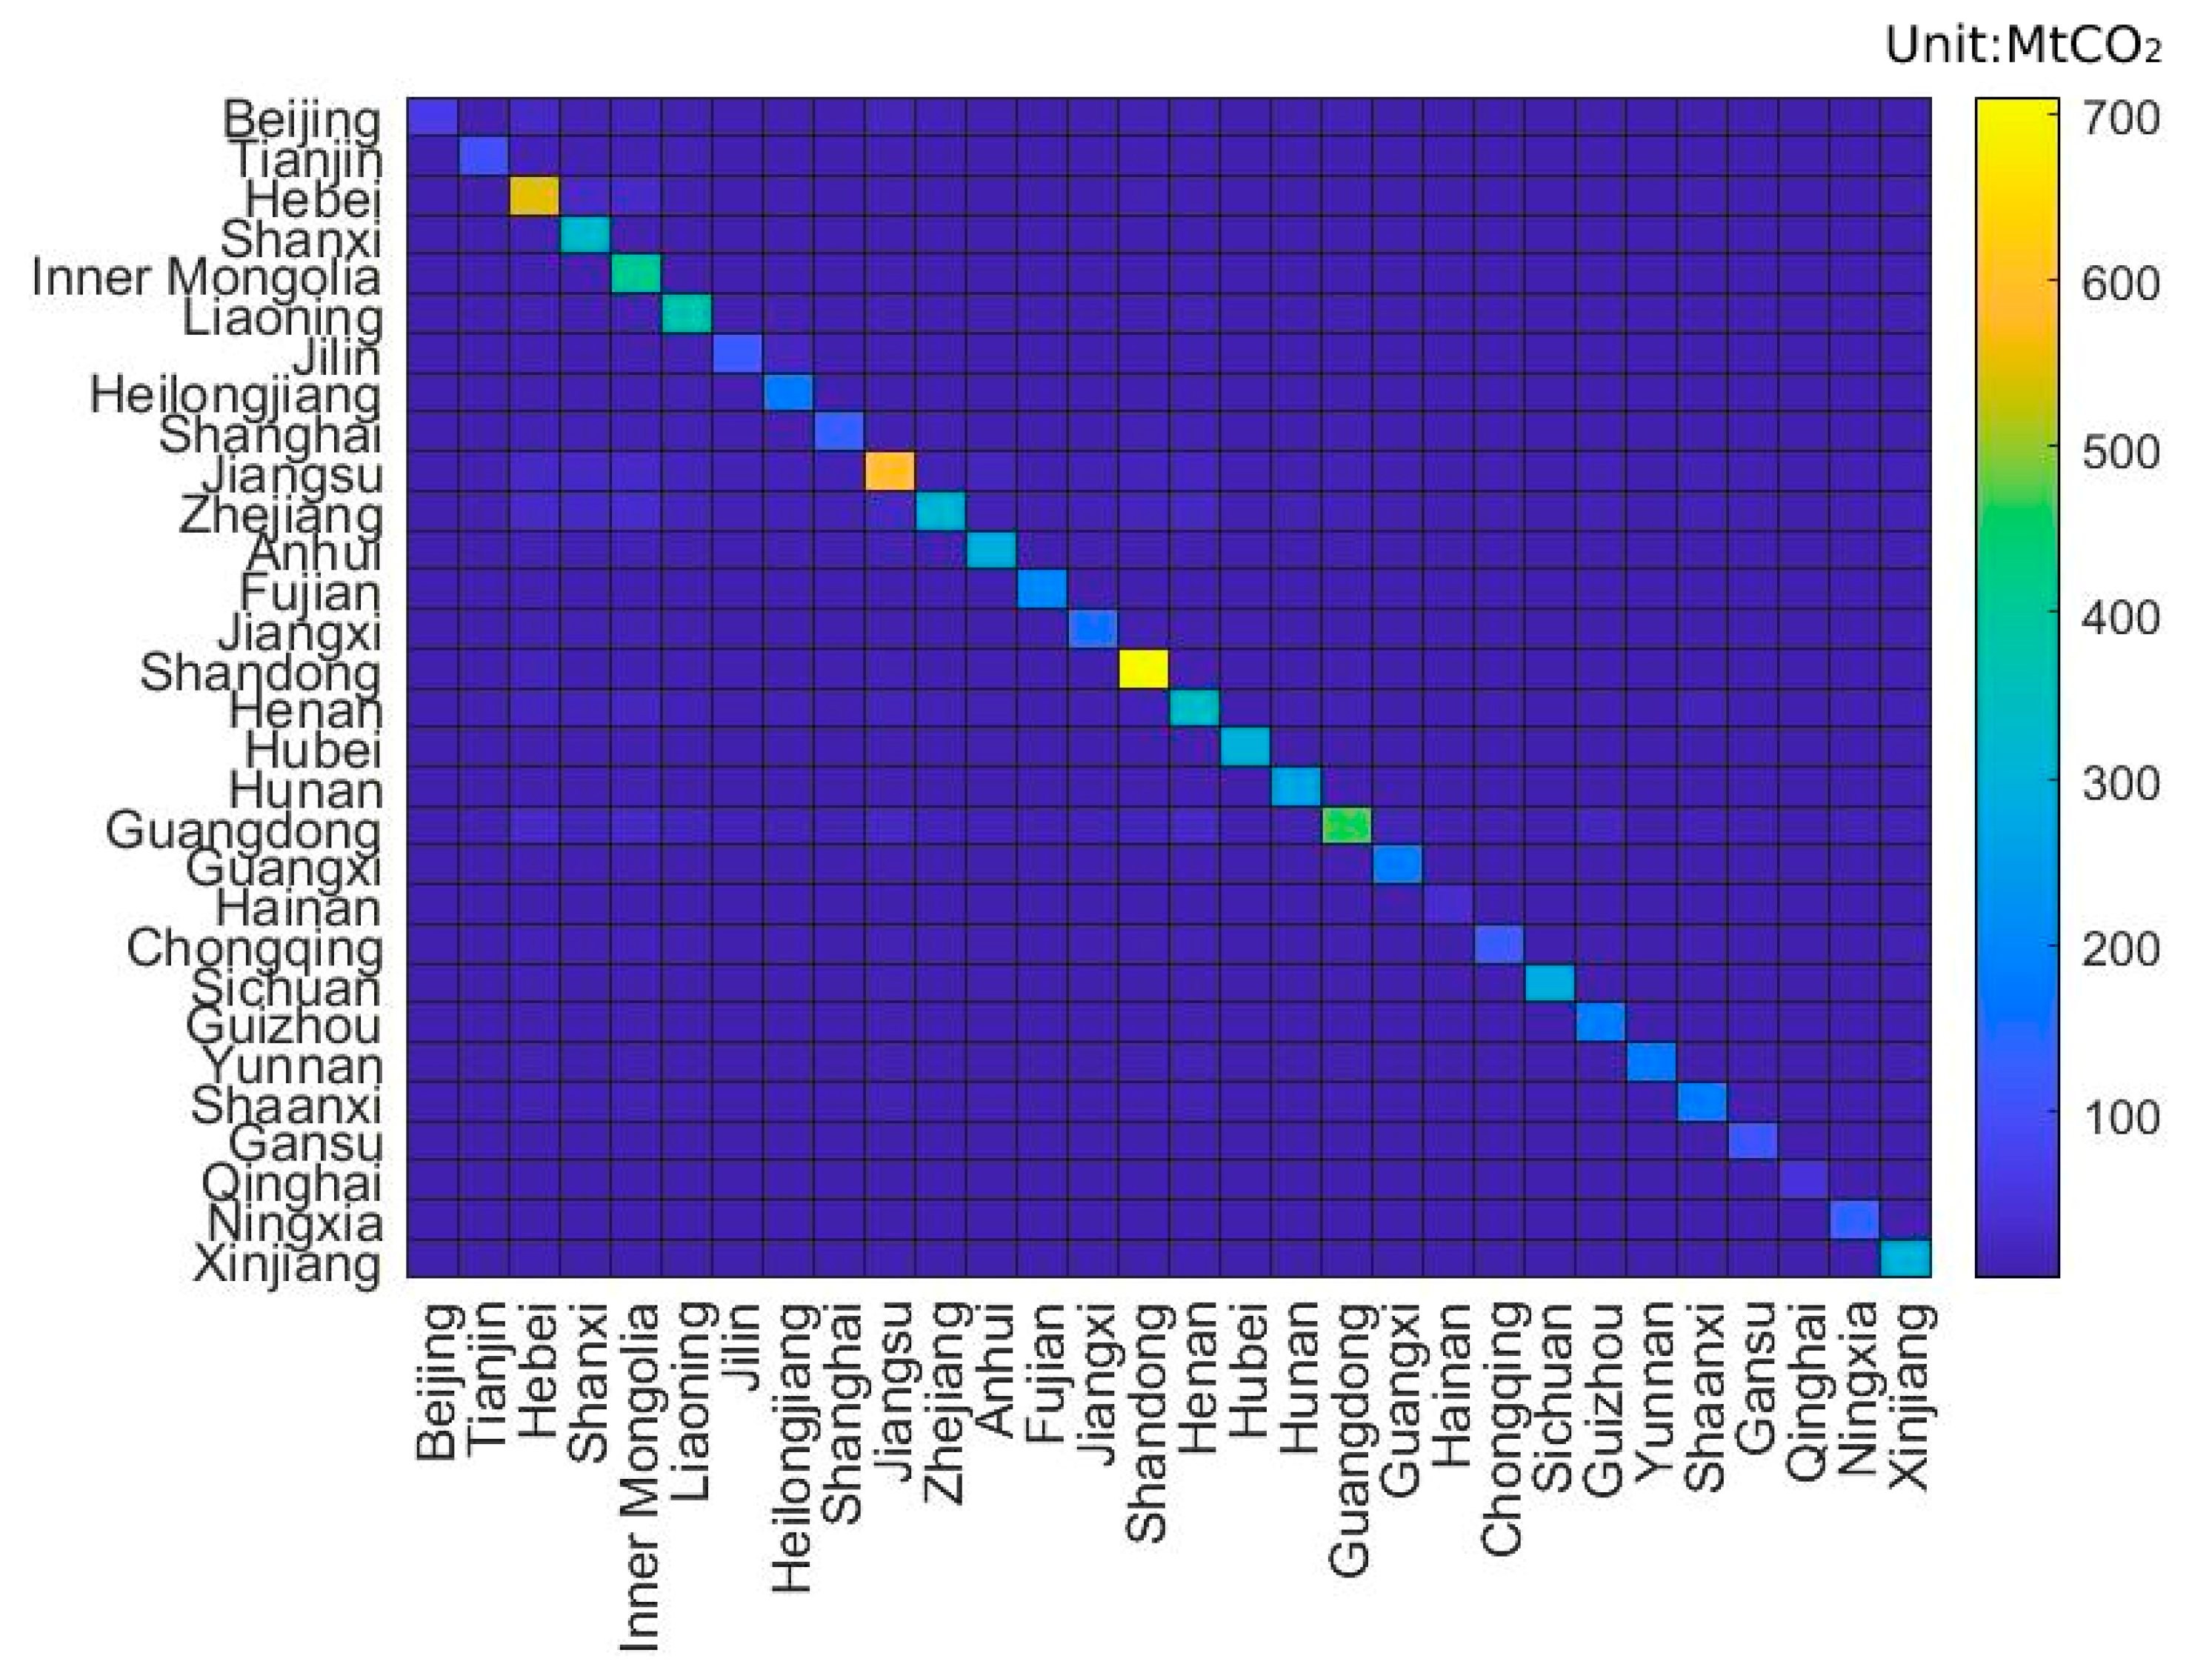
According to the calculation results, we obtained the carbon flow network among 30 provinces in China and drew the interprovincial flow visualization diagram of the embodied carbon flow network, as shown in Figure 2.
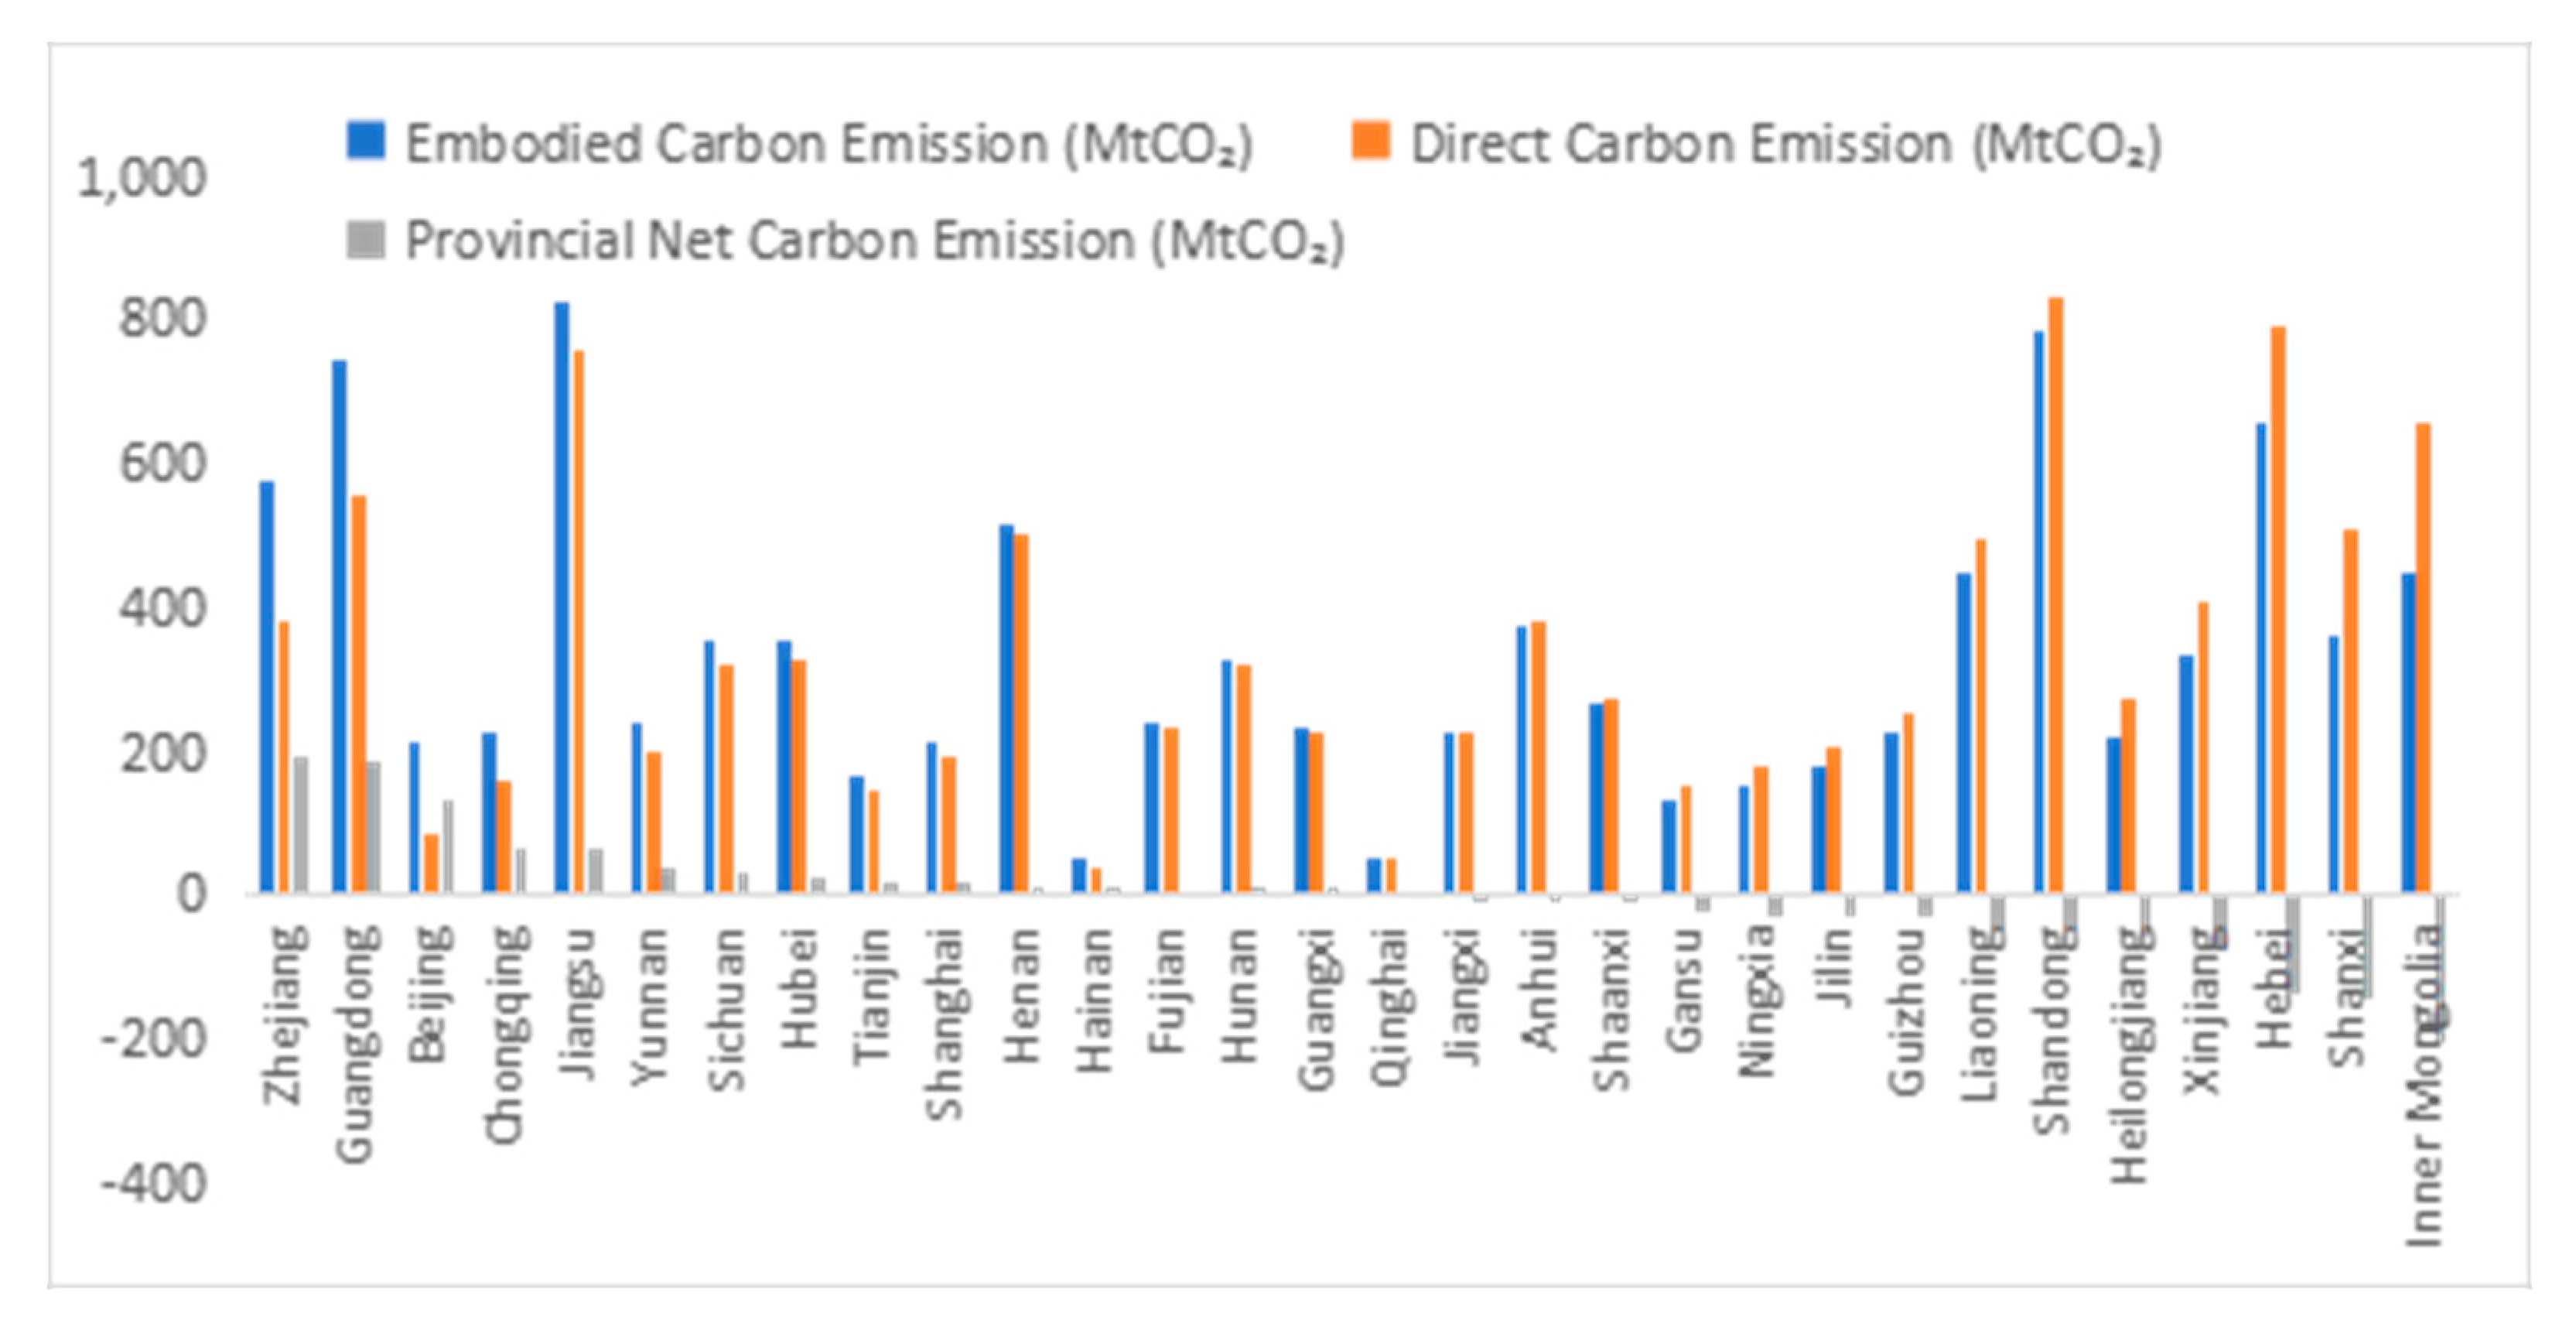
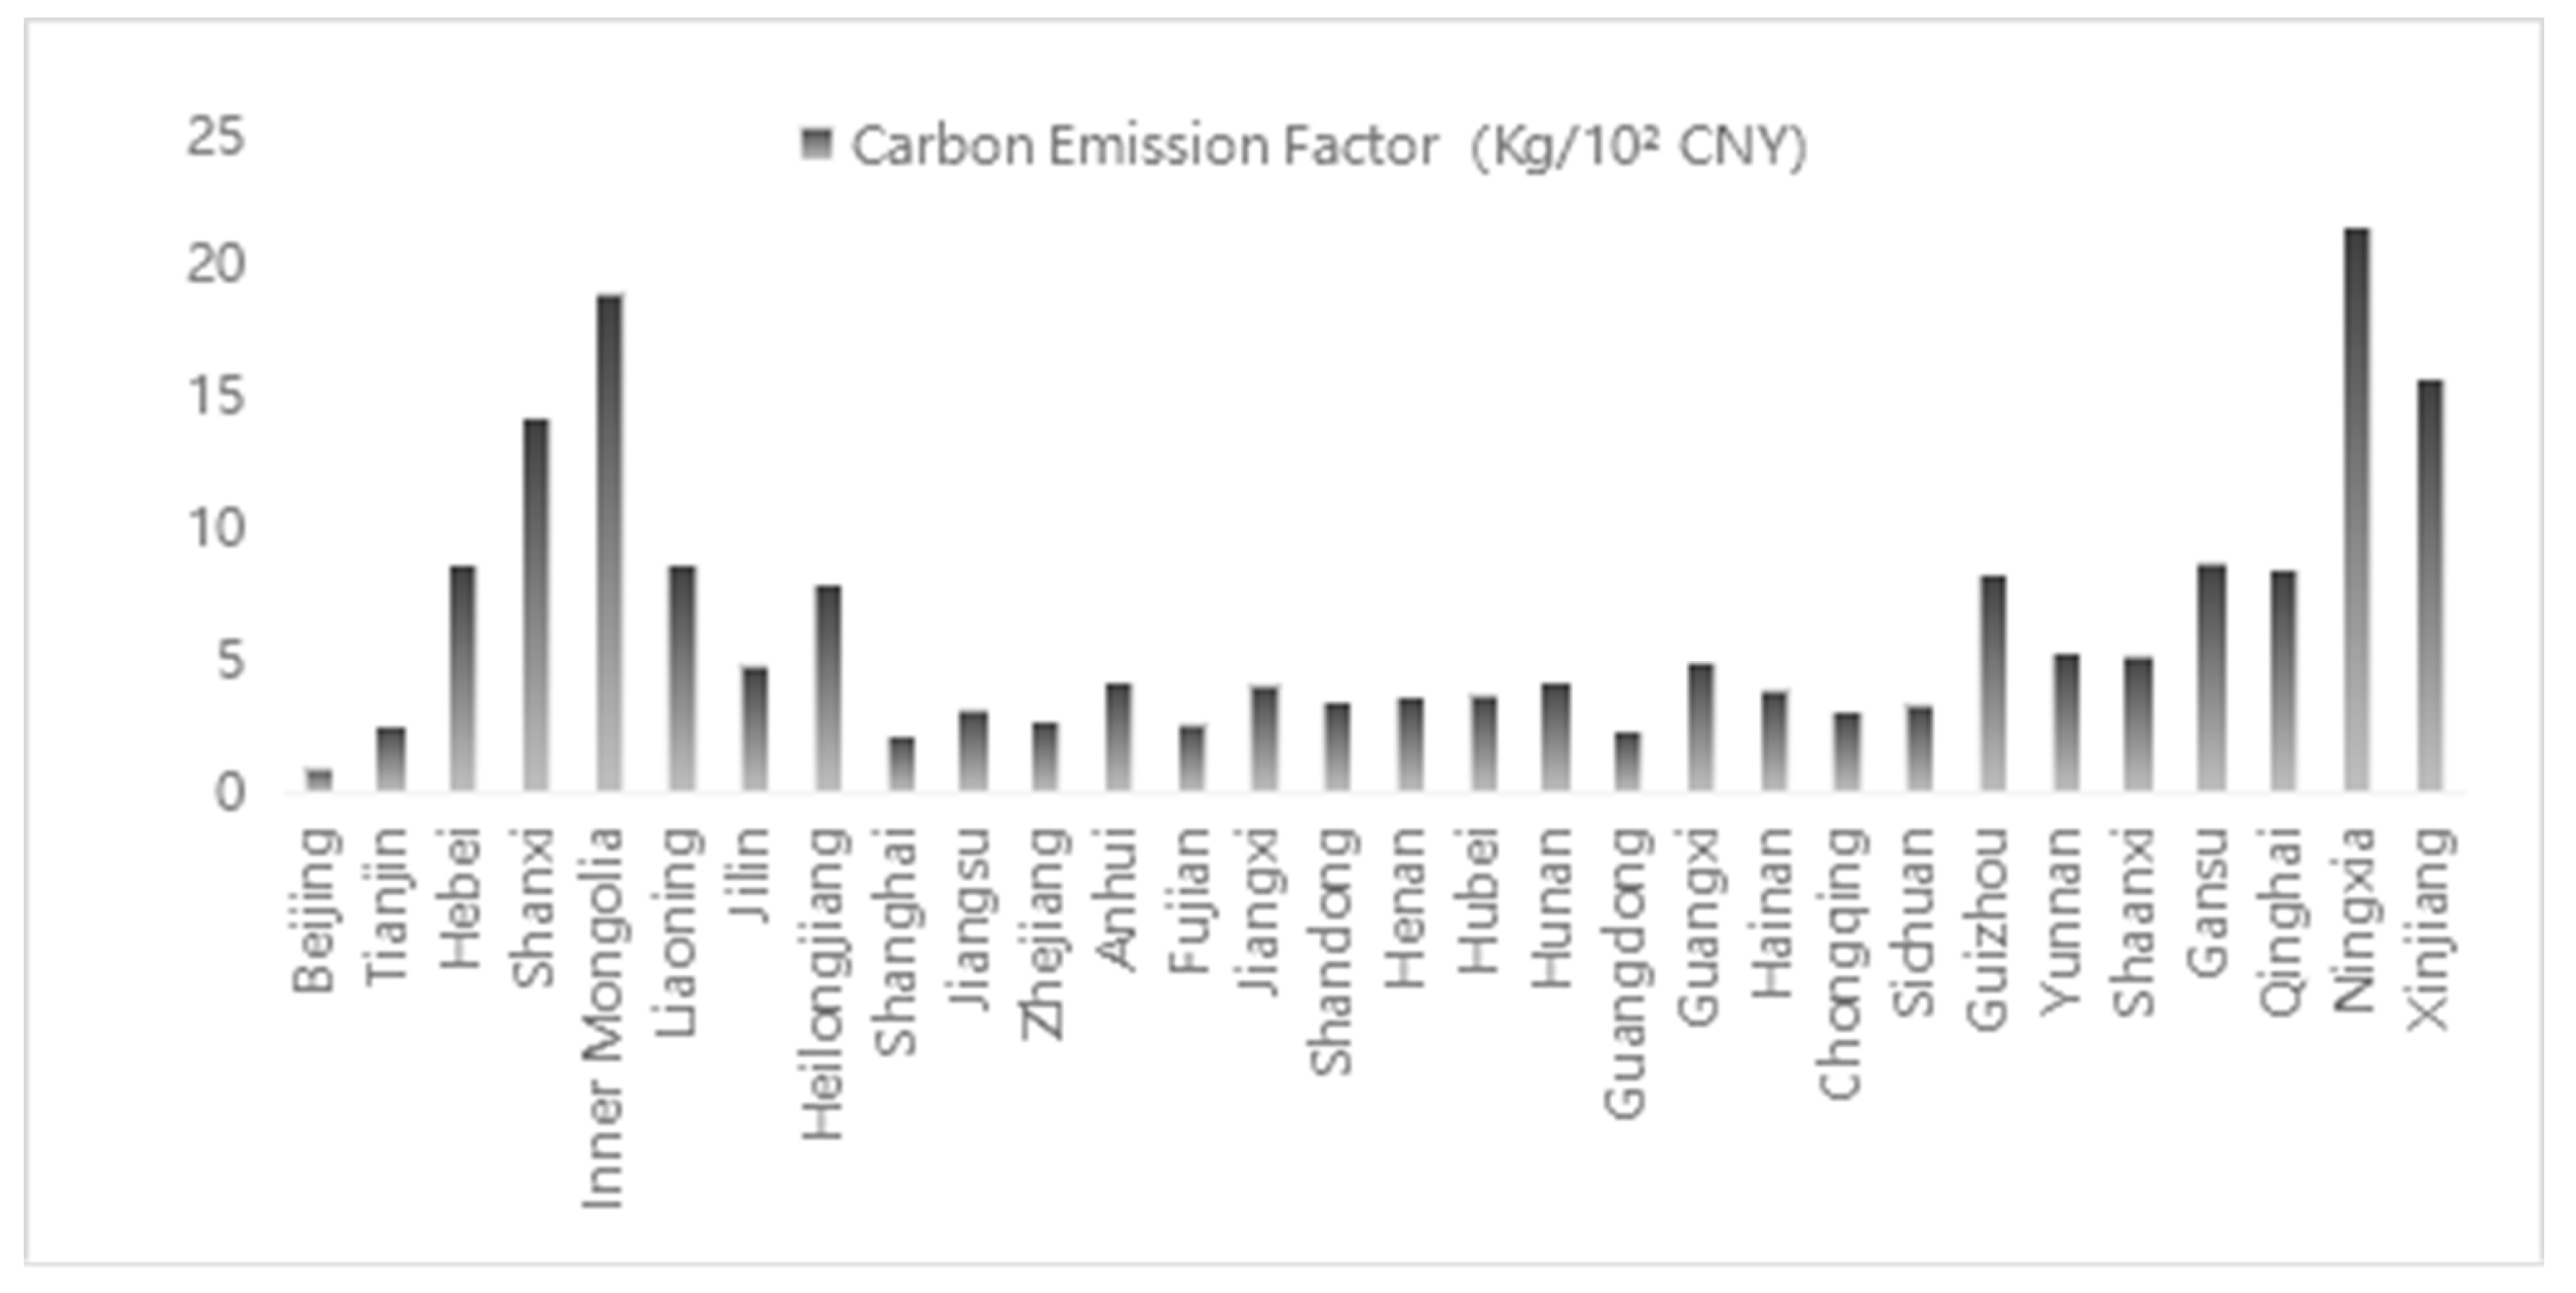
From the data of Table 1, the following can be seen: (1) On the basis of calculating the domestic technical level in the national IO table in 2017, the direct carbon analysis of carbon emissions was carried out first. Based on the direct carbon emissions of all provinces in China, Shandong has the highest direct carbon emissions, where direct carbon emissions reached 784 MtCO2, followed by Hebei (660 MtCO2), Jiangsu (824 MtCO2), and Inner Mongolia (452 MtCO2). (2) From the perspective of the carbon emissions flow network based on production and consumption in each province (Figure 2), the province’s own consumption products have the most embodied carbon, followed by the transfer to other regions for emission. This is because the products produced in the region are generally used to meet their own needs first, and the surplus part is used for export to other regions. In the process of transferring embodied carbon emissions (Figure 3), 16 provinces (including Zhejiang, Guangdong, and Beijing) are the inflow provinces of net embodied carbon emissions, so they have an advantage in the allocation of production emission responsibilities for direct carbon emissions. Meanwhile, 14 provinces (including Inner Mongolia, Shanxi, and Hebei) are the outflow areas of net embodied carbon emissions. This means that according to the existing carbon emission reduction allocation mechanism in China, the outflow regional provinces—as major producers—will bear greater pressure for reducing carbon emissions. (3) The carbon emissions per unit output of different provinces in China are shown in Figure 4, i.e., the environmental factors of carbon emissions. The provinces with large carbon emissions per unit output are Ningxia (21.58 kg/102 CNY), Inner Mongolia (19.13 kg/102 CNY), Xinjiang (15.8 kg/102 CNY), and Shanxi (5.34 kg/102 CNY), showing that there are high carbon emissions per unit output in energy-rich areas. This also shows that energy production is a great contributor to carbon emissions.
3.2. Carbon Flows Based on Interprovincial Trade
By calculating the IO values of 30 provinces, from the perspective of the interprovincial embodied carbon emission flow network, the carbon emission spillover areas—that is, the areas with dominant carbon emission flows and forming a carbon emission surplus—are the economically developed Zhejiang, Guangdong, and Beijing, among other places. The important carbon emission inflow regions and the regions forming carbon emission deficits are Inner Mongolia, Shanxi, and Hebei Provinces.
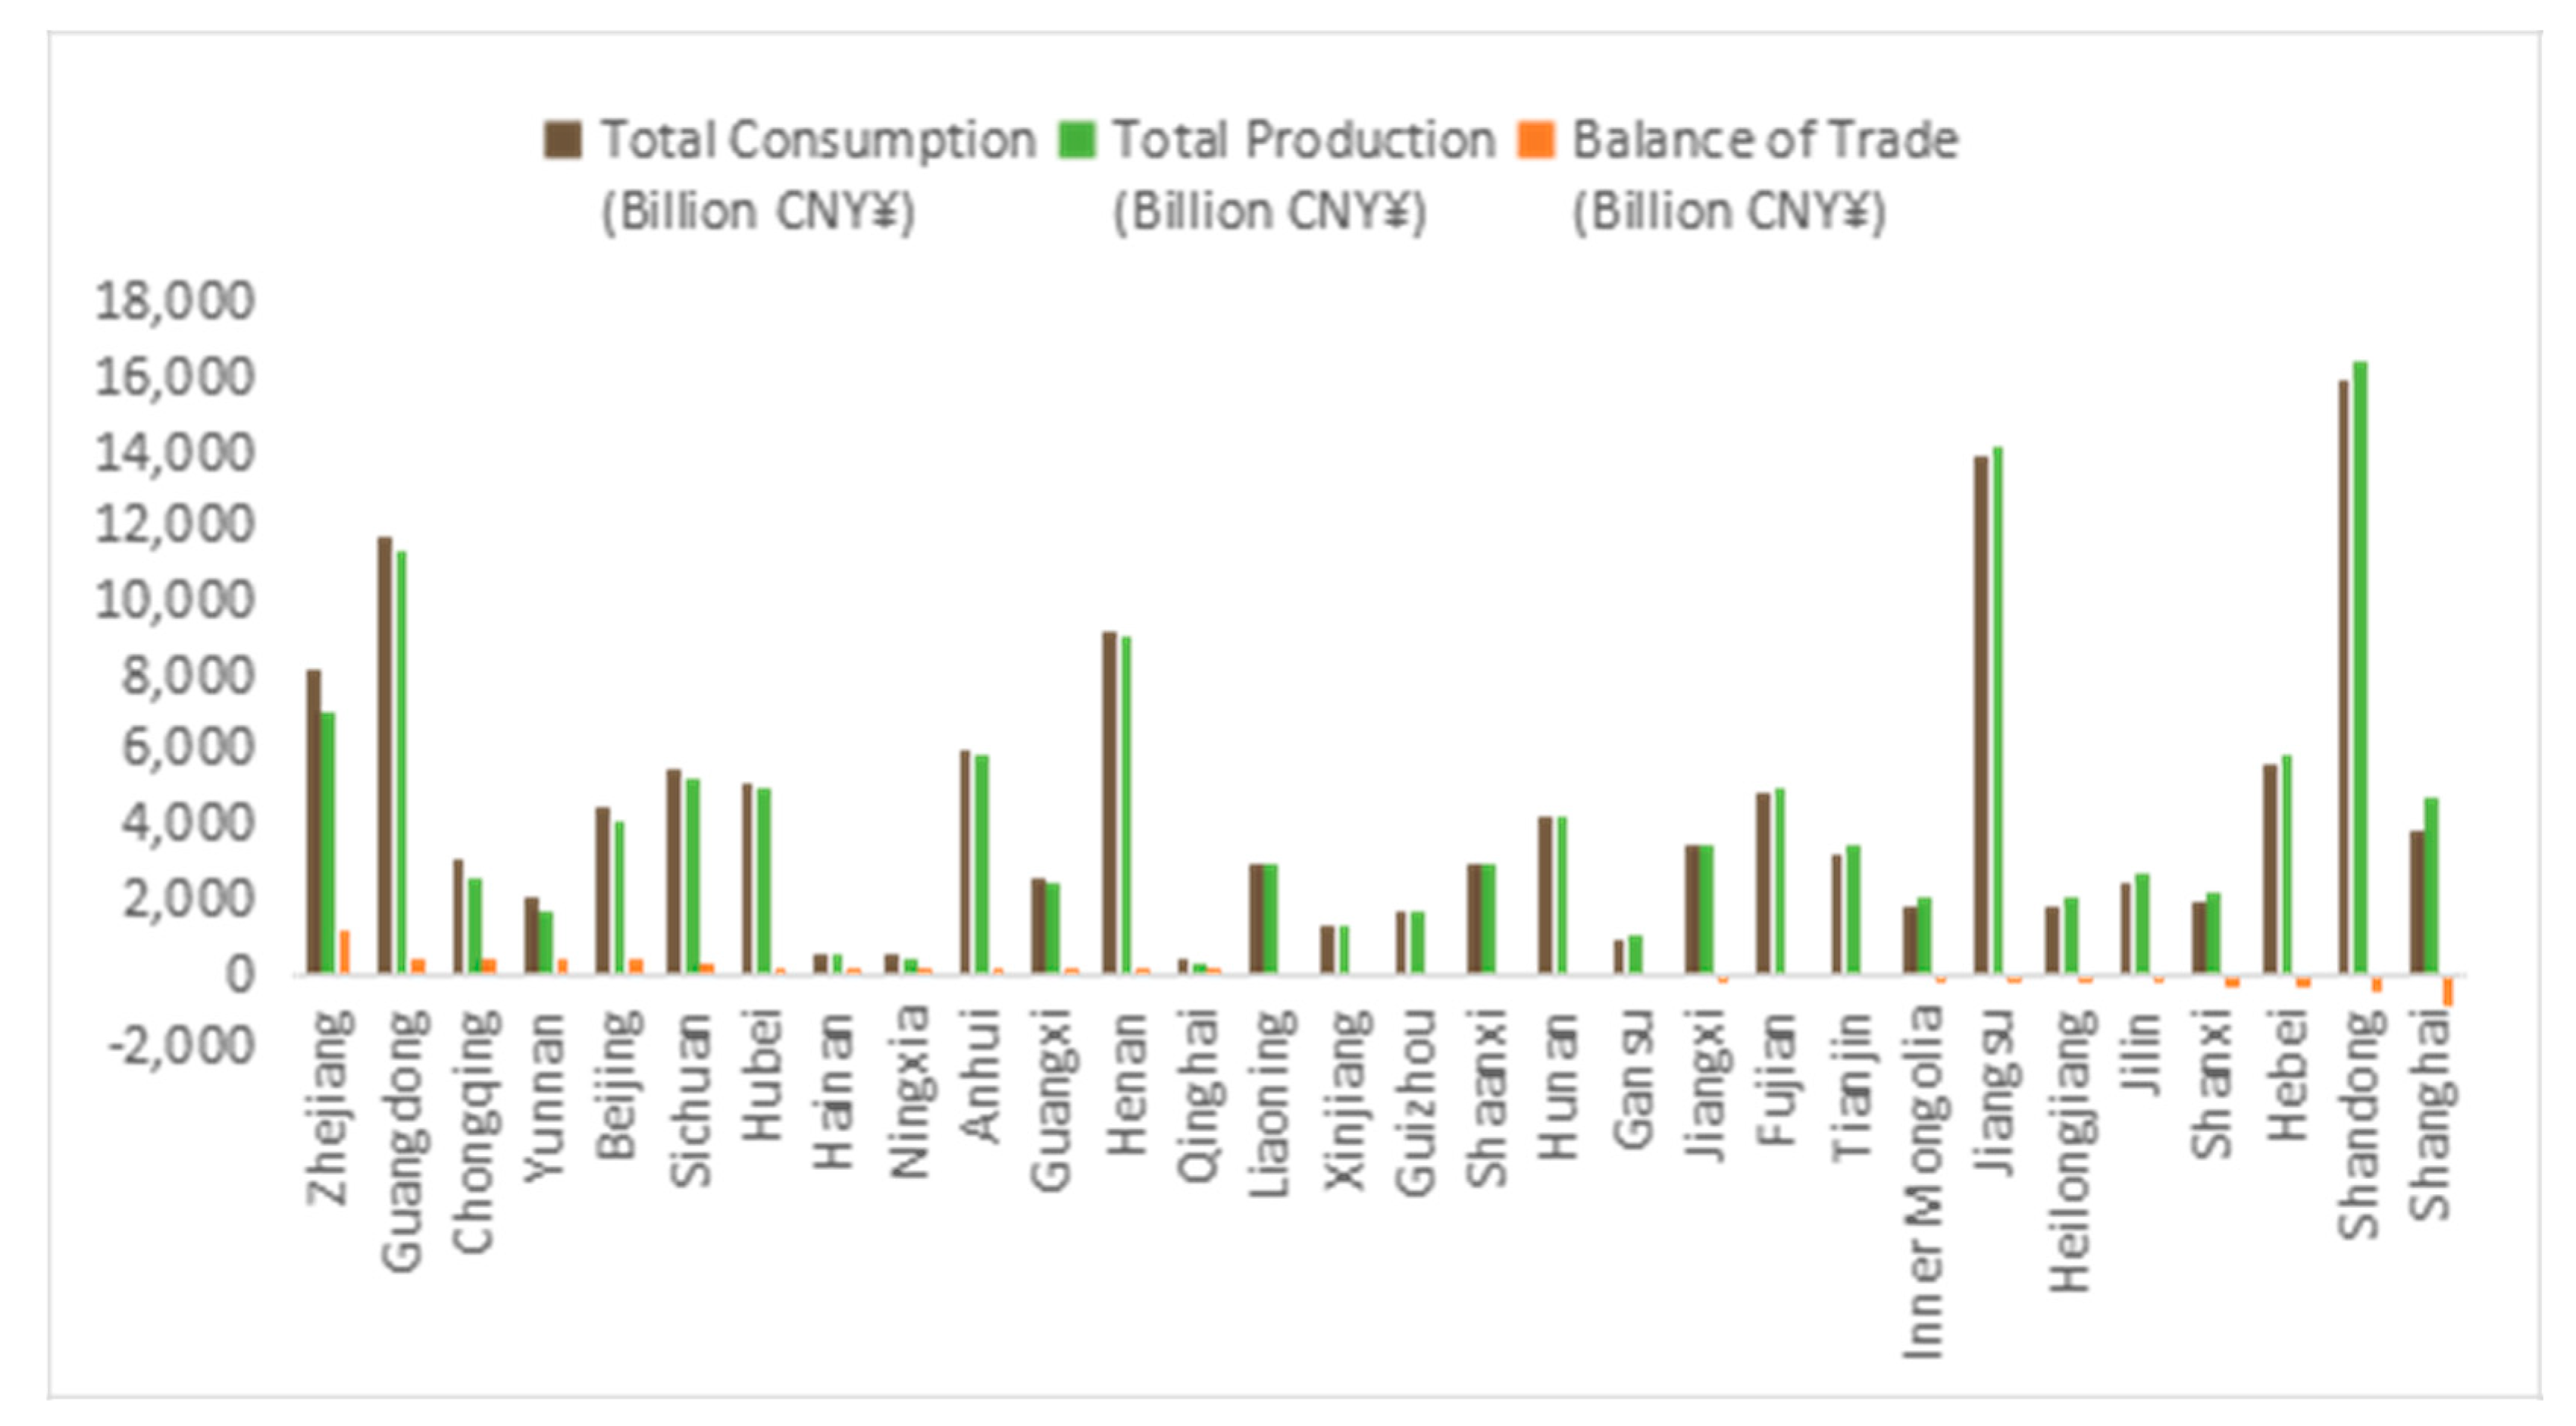
From Figure 5, we can easily observe that the regional consumption process of 13 provinces (including Zhejiang and Guangdong) is greater than their total regional output, which means that these provinces consume the products and services of other provinces that produce carbon emissions through trade activities, thereby occupying a dominant position in the process of embodied carbon emissions. Due to the trade balance of emissions among provinces, economically developed provinces (such as Zhejiang, Guangdong, and Beijing) are net importers of embodied carbon emissions from interprovincial trade, while developing provinces (e.g., Inner Mongolia, Shanxi, and Hebei) are mostly net exporters.
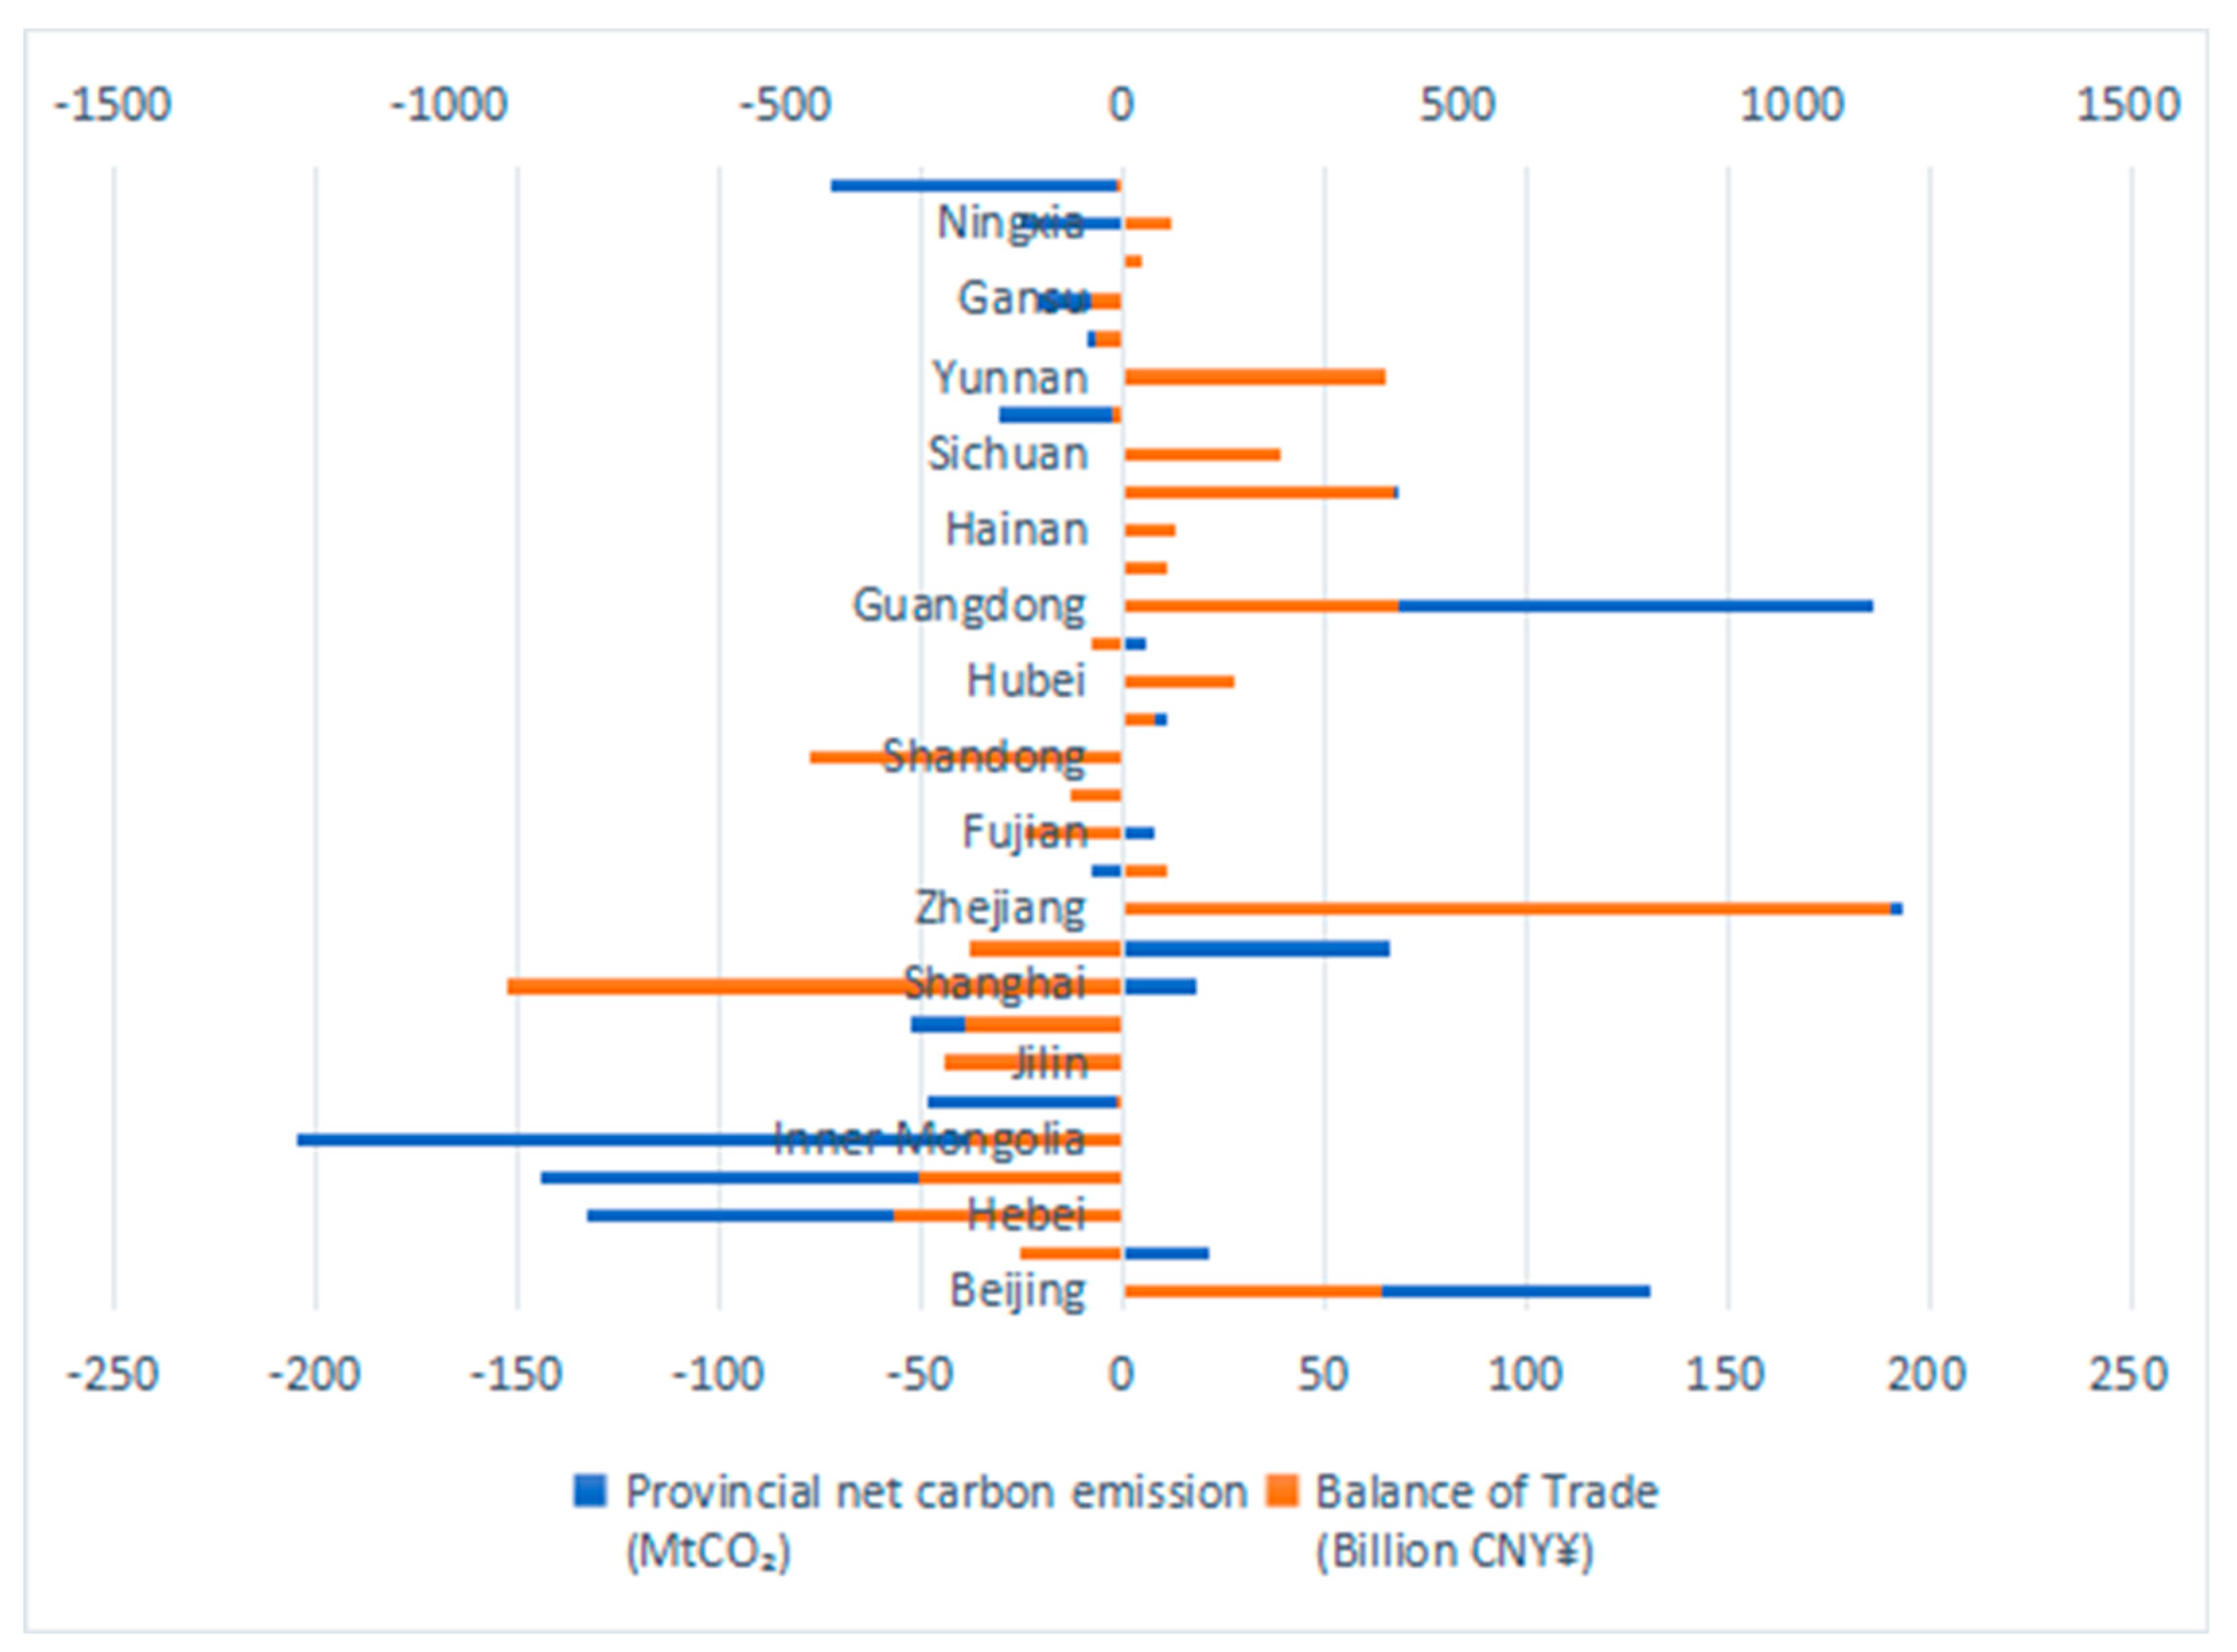
On the basis of the above results, according to the national carbon emission flow and trade flow in 2017, we can determine the trade balance of different provinces’ carbon emissions and trade flows—that is, the two dimensions of the k-means clustering. It can be seen from Figure 6 that if a province’s consumption increases more than its production, its net carbon emission difference will also rise, reflecting that the net carbon emission difference is related to the province’s total trade volume and the balance of trade. Although it is not always the case that the trade balance and the net carbon emission difference of provinces are positive, a large balance of trade is more likely to lead to a positive net carbon emission difference.
3.3. K-Means Clustering Results
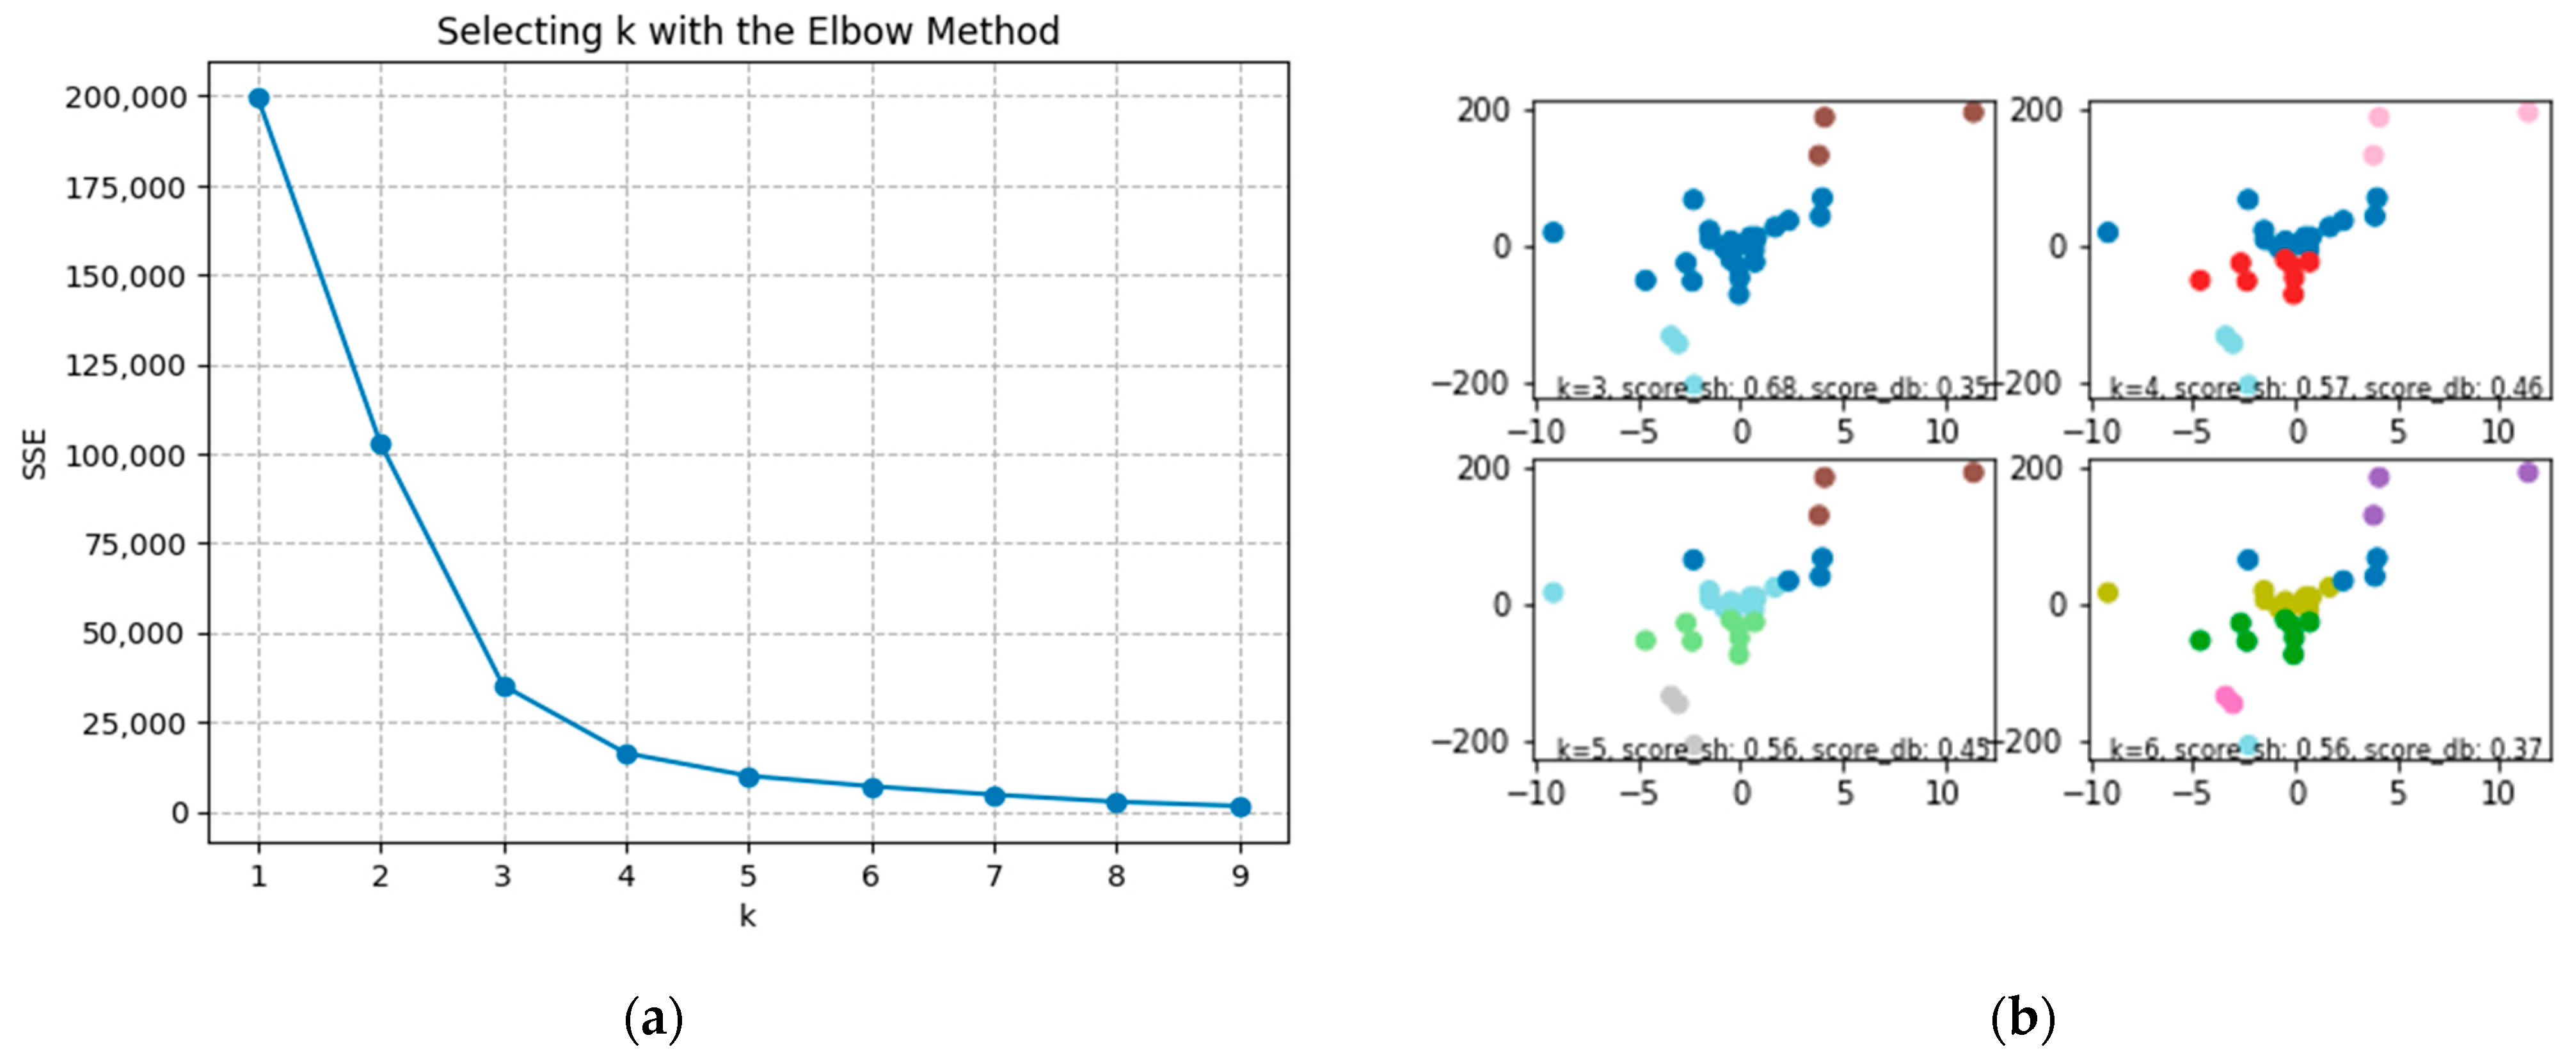
According to the calculation results of the IO model mentioned above, the k-means clustering algorithm was introduced to cluster the embodied carbon emission difference and trade difference of 30 provinces. It can be seen from Figure 7a that there is an obvious inflection point when k = 3. This allows us to tentatively evaluate the effects of numerical clustering before and after based on k = 3.
The evaluation of the clustering effect mainly uses the internal index coefficient and external index coefficient to evaluate the clustering effect, which is used to select the appropriate number of clusters. In this study, the silhouette coefficient (SH) and Calinski–Harabasz (CH) coefficient were used as the internal clustering evaluation indices (Figure 7b), but it was found that when k = 3, the SH and CH indices reach opposite conclusions (Table 2)—that is, the SH index is the largest and the CH index is the smallest, which shows that the datasets of 30 provinces in this paper are not cluster structure data, leading to the inconsistent evaluation of the two indices. Therefore, we referred to the external clustering index known as the Davies–Bouldin index (DB). When k = 3, the minimum DB index is obtained, which shows that the clustering result when k = 3 is reasonable. This also verifies the results of the elbow method—that the best clustering value will be obtained when the inflection point k = 3.
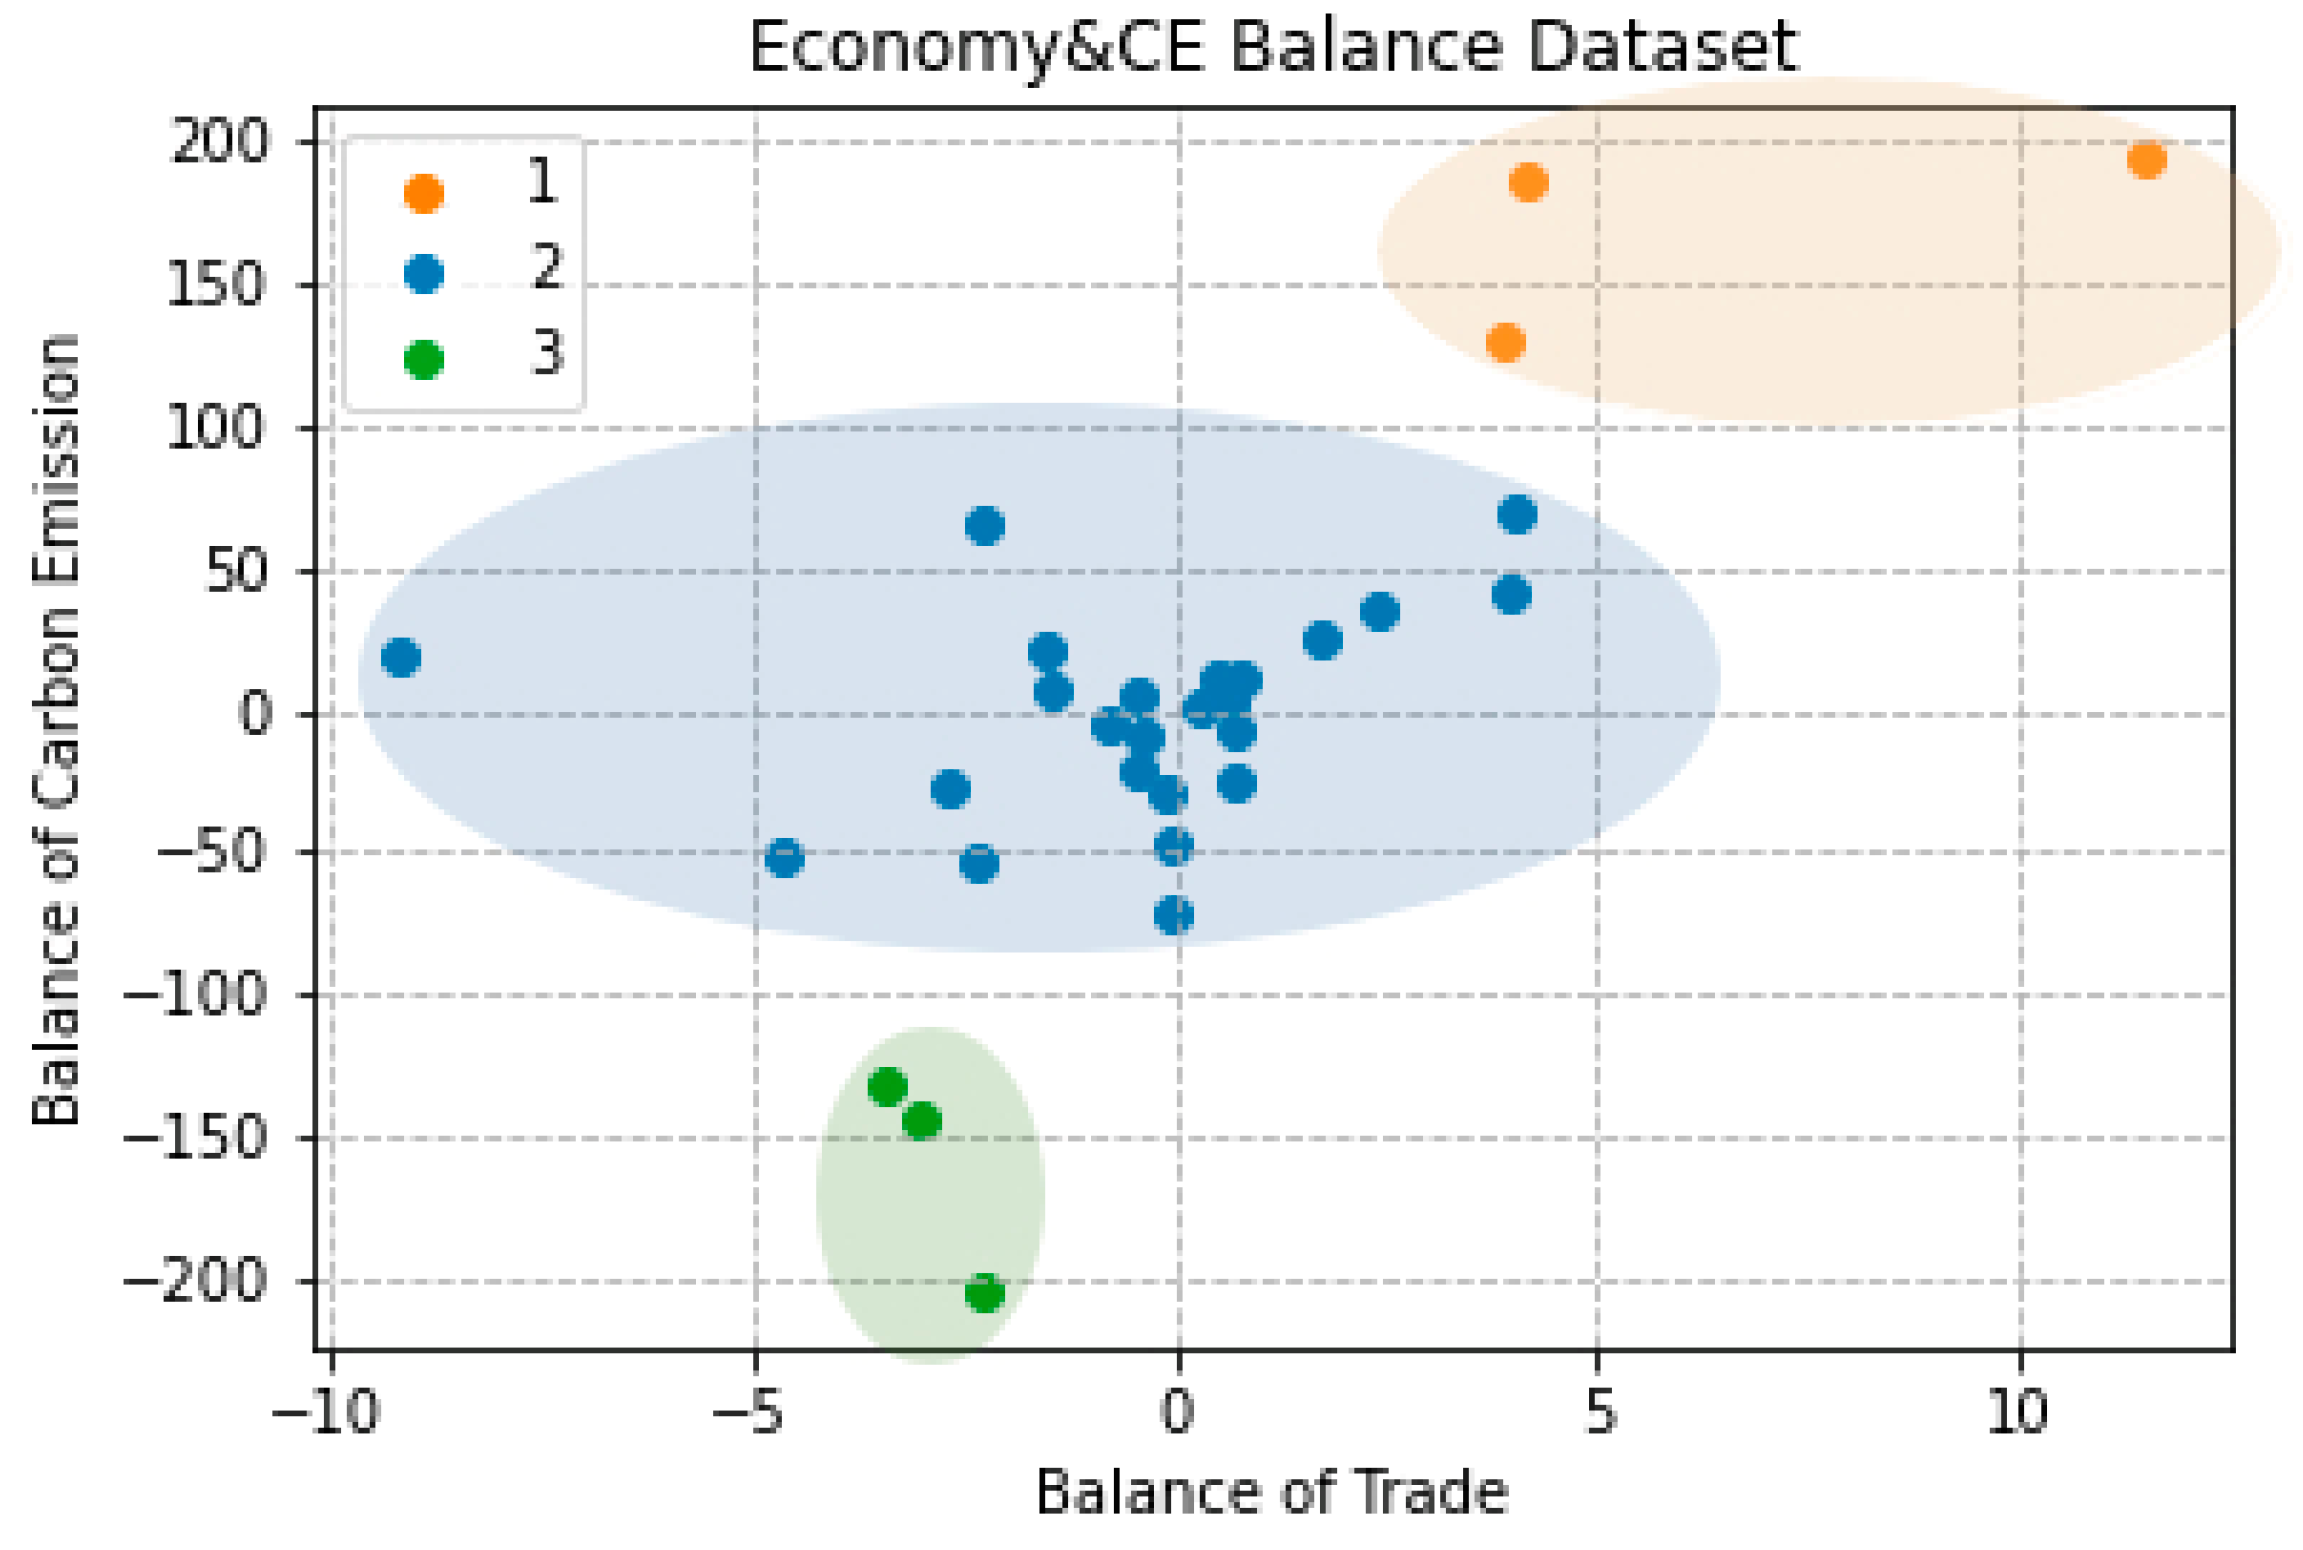
The final clustering result is shown in Figure 8; moreover, it can be seen from Table 3 that the provinces with the same number are classified into one category. For example, 23 provinces (including Liaoning, Jiangsu, and Hunan) belong to the first category, while Beijing, Zhejiang, and Guangdong are allocated to the second category, and the third category includes Hebei, Shanxi, and Inner Mongolia. From the results of k-means machine learning algorithm, the 30 provinces were clustered into three categories to accurately reflect the relationship between domestic embodied carbon emissions and trade flows.
From the clustering results in Figure 8 and Table 3, Cluster 1 and Cluster 3 have obvious category characteristics. By comparing and analyzing the data in Table 1, Beijing, Zhejiang, and Guangdong Provinces in Cluster 1 consume a large number of products and services produced by other provinces through trade consumption in the embodied carbon emissions and provincial trade relations. The interprovincial trade brought about by this demand has led to a large amount of embodied carbon emissions transfer, so that the embodied carbon emissions of the three provinces in this cluster are much higher than their direct production carbon emissions. Cluster 3 is the exact opposite situation of Cluster 1. In the flow of embodied carbon emissions, Hebei, Shanxi, and Inner Mongolia—the three typical provinces of Cluster 3—transfer large amounts of products and services produced in the region to the “buyers” of Cluster 1, so as to realize the outflow of embodied carbon to regions outside the province. From the perspective of the embodied carbon emissions transfer of Cluster 1 and Cluster 3, it is unfair for Cluster 3 to make carbon emission reduction policies only from the perspective of producer responsibility. There are 24 provinces in Cluster 2, which reflect that positive trade surplus and net carbon emissions are not always the same, but a large trade surplus is more likely to lead to positive regional net carbon emissions. Further analysis shows that the embodied carbon emission difference and its trade flow difference in different regions show some convergence but are not completely consistent.
4. Discussion and Policy Implementation
4.1. Distinct Roles of Different Regions in the Domestic Carbon Emission Network
Understanding the interconnected and intertwined dynamics between the economy and the environment in complex socioeconomic systems is essential for balancing human and natural development. Embodied carbon emissions provide a means to describe the intricate flows of economic and environmental interactions within society. It is crucial to recognize the connections between carbon emissions and economic activities, and to identify specific roles of different regions in order to implement targeted carbon reduction policies, for the achievement of a harmonious and sustainable coexistence between humanity and nature. Currently, the importance of implementing different carbon reduction policies for different regions has been recognized and emphasized by many scholars [38,39,40]. Existing research has focused on policy-level connections, although few studies have used machine learning algorithms to identify the attributes of different regions. To fill this gap, our research provides a new classification method for regional research on the embodied carbon emissions from trade against the background of global carbon neutrality goals. By considering the embodied carbon emissions in trade and regional characteristics, our research provides a foundation for defining the carbon emission responsibilities of each region [41]. Our findings contribute to the development of regional management strategies and offer policy implementation suggestions.
Based on experimental calculations, we identified the regional roles determined by the relationships between trade and carbon emissions in different regions of China. The clustering analysis of the 30 provinces (as shown in Table 1) reveals the diversity in trade and carbon flow characteristics among regions. This finding is consistent with previous studies [17,19,42] emphasizing the variation in regional carbon emissions in the context of trade. Regions within the same cluster have similar embodied carbon flow and trade characteristics. According to the research results, economically developed provinces such as Beijing, Zhejiang, and Guangdong, with the largest trade surplus and embodied carbon emissions consumption, were identified as dominant “buyers” or “consumers” in the carbon emission network, relying on trade channels to import products and services with embodied carbon emissions. Due to the regional separation of production and consumption of goods and services in inter-regional trade, the provinces in Cluster 1 have become the regions with the most obvious benefits from the division of carbon reduction responsibilities under the producer responsibility principle.
Conversely, provinces such as Hebei, Shanxi, and Inner Mongolia, with the largest trade deficits and embodied carbon emissions outflows, were identified as “sellers” or “producers”, indicating their relatively inferior net export status in the carbon emission network [43]. Guangdong is the region with the highest embodied carbon emissions consumption, while Inner Mongolia is the province with the largest carbon emissions outflow. While providing strong support for the economic development of other provinces, the provinces of Cluster 3 have become the most severely damaged areas in terms of carbon emission reduction responsibility under the principle of producer responsibility.
These findings reveal that the assessment of carbon emissions from a production responsibility perspective may underestimate the actual emissions. When considering the embodied carbon emissions transferred through trade, a different conclusion arises. Developed nations or regions tend to be net importers of carbon emissions, while developing nations or regions act as net exporters of emissions.
Our findings support the existing research that emphasizes the need for regions with net carbon emission inputs to assume greater responsibility for reducing carbon emissions [44,45]. The economic disparities among provinces, as evidenced by the decreasing trade volume from east to west and from south to north, reflect the imbalanced distribution of carbon emissions. For instance, provinces in Cluster 1—characterized by developed economies and high trade volumes—transfer a significant amount of direct carbon flow to net-output provinces through trade circulation. Consequently, it is essential for the net-input regions to shoulder more social and carbon emission reduction responsibilities by sharing their regional capital and technological advantages [46]. This mechanism would support the net-output regions in reducing their carbon dioxide emissions per unit of output value through financial support and technological improvements [47].
4.2. Policy Implementation
To address the challenges posed by embodied carbon emissions in trade, it is crucial to develop effective regional carbon emission reduction plans. The existing climate emission framework systems, such as the IPCC guidelines for national greenhouse gas inventories and the Kyoto Protocol, advocate for accounting for greenhouse gases generated within national territories, following the producer responsibility system [48]. However, relying solely on a production-responsibility-based carbon emission reduction scheme may result in unfair distribution and hinder the efficiency of regional carbon emission reduction efforts. In light of this, a carbon emission accounting system that combines the production responsibility system and the trade income principle can be adopted to formulate more equitable regional carbon emission reduction schemes [16]. The corresponding policy implications for the different regions clustered through our research are as follows:
For “producers”, it is crucial to increase the allocation of carbon emission rights and optimize the regional allocation index system of allowable carbon emissions. This can be achieved by promoting the upgrading of industrial technologies and incentivizing the production, use, and advancement of clean energy to reduce carbon emission intensity per unit of output value [49].
For “consumers”, there are two key aspects to consider: Firstly, sharing advanced management and production experience with other regions can facilitate their transition towards low-carbon practices. Secondly, implementing a carbon tax on industrial supply can provide economic incentives for carbon emission reduction. Through the allocation of special funds for carbon tax at the macro level, preferential support can be given to “producers” and labor groups, thereby minimizing the social challenges and adverse effects (e.g., poverty) resulting from low-carbon transformations. Studies have shown that carbon taxation can effectively incentivize carbon emission reductions and support sustainable development [50,51].
Moreover, reducing the total carbon emissions resulting from trade circulation necessitates not only local improvements in technical conditions and in production and consumption levels, but also the optimization of production and consumption structures across all regions along the trade path. Therefore, achieving worldwide or countrywide carbon emission reduction goals requires robust inter-regional cooperation.
The “carbon peaking and carbon neutrality goals” in all regions should not be pursued uniformly. Instead, it is crucial to strike a balance between overall and local perspectives, development, and emission reductions, and to formulate comprehensive plans that encompass all regions. This can be achieved through various means, including clarifying emission reduction responsibilities, regulating carbon emissions per region, and strengthening regional cooperation. Collaborative efforts can include knowledge exchange, sharing best practices, and jointly developing innovative solutions for reducing carbon emissions. Research highlights the significance of inter-regional collaboration in achieving sustainable development and effective carbon emission reductions [52].
By adopting these strategies, regions can work together to address the challenges posed by embodied carbon emissions in trade and contribute to the global carbon neutrality goal. This holistic approach promotes fairness, efficiency, and cooperation, allowing for a comprehensive and effective reduction in carbon emissions.
5. Conclusions
Adopting IOA and the k-means clustering algorithm, we first investigated the carbon emissions embodied in the multilateral trade of 30 provinces of China in this work. Considering the differences between direct and embodied carbon emissions across the provinces, we identified the direction of carbon emission transfers in trade, as well as the characteristics of different regions. Moreover, we propose that different carbon reduction policies should be recommended for different regions according to the k-means clustering. Essentially, the regions classified as either “producers” or “consumers” should have corresponding measures for the implementation of carbon reduction policies, and the impact of inter-regional trade on the embodied carbon emissions should be carefully taken into account.
We believe that the outcomes of this research have valuable implications for policymakers and regional managers to formulate effective carbon emission reduction strategies and policies. By acknowledging the distinct roles of regions in the carbon emission network, identifying the responsibilities of net-input and net-output regions, and promoting inter-regional cooperation, we can assist the advancement in reaching the goal of carbon neutrality in large countries such as China with significant regional imbalances of energy production and carbon emissions.
Despite the valuable insights gained from this research, there are still some gaps to be further filled with regard to the present work. Firstly, our analysis was mainly based on data from the IO table in 2017; thus, the results may not fully capture the dynamic changes in carbon emissions and trade patterns in more recent years. Secondly, this study focuses on China’s provinces, and the findings may not be directly applicable to other countries or regions with different economic structures and trade patterns. We intend to expand our analysis methodology of embodied carbon emissions and trade dynamics to other countries and regions. Future research is highly desirable to address these limitations and advance our understanding of the complex interplay between regional trade, embodied carbon emissions, and carbon emission reduction strategies.
Author Contributions
Conceptualization, D.L.; methodology, D.L.; software, D.L. and J.L.; validation, D.L., J.L., S.X. and M.Y.; formal analysis, D.L.; data curation, D.L.; writing—original draft preparation, D.L.; review and editing, S.X. and M.Y.; visualization, D.L.; supervision, M.Y. All authors have read and agreed to the published version of the manuscript.
Funding
This research was funded by the Strategic Priority Research Program of the Chinese Academy of Sciences, grant number XDA21030200 and XDA21010100.
Institutional Review Board Statement
Not applicable.
Informed Consent Statement
Not applicable.
Data Availability Statement
Not applicable.
Acknowledgments
The authors gratefully acknowledge the financial support from the Strategic Priority Research Program of the Chinese Academy of Sciences (XDA21030200 and XDA21010100).
Conflicts of Interest
The authors declare no conflict of interest.
References
- WRI. Climate Watch Historical GHG Emissions; World Resources Institute: Washington, DC, USA, 2021. [Google Scholar]
- Chen, Z.; Song, P.; Wang, B. Carbon emissions trading scheme, energy efficiency and rebound effect–Evidence from China’s provincial data. Energy Policy 2021, 157, 112507. [Google Scholar] [CrossRef]
- Shan, Y.; Huang, Q.; Guan, D.; Hubacek, K. China CO2 emission accounts 2016–2017. Sci. Data 2020, 7, 54. [Google Scholar] [CrossRef] [PubMed]
- Shan, Y.; Guan, D.; Zheng, H.; Ou, J.; Li, Y.; Meng, J.; Mi, Z.; Liu, Z.; Zhang, Q. Data descriptor: China CO2 emission accounts 1997–2015. Sci. Data 2018, 5, 170201. [Google Scholar] [CrossRef] [PubMed]
- Shan, Y.; Liu, J.; Liu, Z.; Xu, X.; Shao, S.; Wang, P.; Guan, D. New provincial CO2 emission inventories in China based on apparent energy consumption data and updated emission factors. Appl. Energy 2016, 184, 742–750. [Google Scholar] [CrossRef]
- Li, X.; Wang, J.; Zhang, M.; Ouyang, J.; Shi, W. Regional differences in carbon emission of China’s industries and its decomposition effects. J. Clean. Prod. 2020, 270, 122528. [Google Scholar] [CrossRef]
- Wang, Y.; Zheng, Y. Spatial effects of carbon emission intensity and regional development in China. Environ. Sci. Pollut. Res. 2021, 28, 14131–14143. [Google Scholar] [CrossRef]
- Chen, X.; Lin, B. Towards carbon neutrality by implementing carbon emissions trading scheme: Policy evaluation in China. Energy Policy 2021, 157, 112510. [Google Scholar] [CrossRef]
- Zhang, P.; Hu, J.; Zhao, K.; Chen, H.; Zhao, S.; Li, W. Dynamics and decoupling analysis of carbon emissions from construction industry in China. Buildings 2022, 12, 257. [Google Scholar] [CrossRef]
- Peters, G.P.; Hertwich, E.G. CO2 embodied in international trade with implications for global climate policy. Environ. Sci. Technol. 2008, 42, 1401. [Google Scholar] [CrossRef]
- Chen, G.; Hadjikakou, M.; Wiedmann, T. Urban carbon transformations: Unravelling spatial and inter-sectoral linkages for key city industries based on multi-region input–output analysis. J. Clean. Prod. 2017, 163, 224–240. [Google Scholar] [CrossRef]
- Zhang, W.; Peng, S. Analysis on CO2 emissions transferred from developed economies to China through trade. China World Econ. 2016, 24, 68–89. [Google Scholar] [CrossRef]
- Long, R.; Li, J.; Chen, H.; Zhang, L.; Li, Q. Embodied carbon dioxide flow in international trade: A comparative analysis based on China and Japan. J. Environ. Manag. 2018, 209, 371–381. [Google Scholar] [CrossRef]
- Xu, M.; Allenby, B.; Chen, W. Energy and air emissions embodied in China–US trade: Eastbound assessment using adjusted bilateral trade data. Environ. Sci. Technol. 2009, 43, 3378–3384. [Google Scholar] [CrossRef]
- Davis, S.J.; Caldeira, K. Consumption-based accounting of CO2 emissions. Proc. Natl. Acad. Sci. USA 2010, 107, 5687–5692. [Google Scholar] [CrossRef] [PubMed]
- Zhu, Y.; Shi, Y.; Wu, J.; Wu, L.; Xiong, W. Exploring the characteristics of CO2 emissions embodied in international trade and the fair share of responsibility. Ecol. Econ. 2018, 146, 574–587. [Google Scholar] [CrossRef]
- Cheng, H.; Dong, S.; Li, F.; Yang, Y.; Li, S.; Li, Y. Multiregional input-output analysis of spatial-temporal evolution driving force for carbon emissions embodied in interprovincial trade and optimization policies: Case study of northeast industrial district in China. Environ. Sci. Technol. 2018, 52, 346–358. [Google Scholar] [CrossRef] [PubMed]
- Fan, J.; Meng, S.; Wang, J.; Zhang, X. Coordinated emission mitigation mechanism of Beijing-Tianjin-Hebei region in China: A perspective from CO2 emissions embodied in domestic trade. Energy Procedia 2019, 158, 3893–3900. [Google Scholar] [CrossRef]
- Su, B.; Ang, B. Input–output analysis of CO2 emissions embodied in trade: A multi-region model for China. Appl. Energy 2014, 114, 377–384. [Google Scholar] [CrossRef]
- Li, W.; Wang, Q.; Jin, B.; Li, G.; Su, B. Multiregional input–output analysis of carbon transfer in interprovincial trade and sectoral strategies for mitigation: Case study of Shanxi province in China. J. Clean. Prod. 2023, 391, 136220. [Google Scholar] [CrossRef]
- Leontief, W.W. Quantitative input and output relations in the economic systems of the United States. Rev. Econ. Stat. 1936, 18, 105–125. [Google Scholar] [CrossRef]
- Miller, R.E.; Blair, P.D. Input-Output Analysis: Foundations and Extensions; Cambridge University Press: Cambridge, UK, 2009. [Google Scholar]
- Ackerman, F.; Ishikawa, M.; Suga, M. The carbon content of Japan–US trade. Energy Policy 2007, 35, 4455–4462. [Google Scholar] [CrossRef]
- Shepard, J.U.; Pratson, L.F. Hybrid input-output analysis of embodied energy security. Appl. Energy 2020, 279, 115806. [Google Scholar] [CrossRef] [PubMed]
- Tarne, P.; Lehmann, A.; Finkbeiner, M. A comparison of Multi-Regional Input-Output databases regarding transaction structure and supply chain analysis. J. Clean. Prod. 2018, 196, 1486–1500. [Google Scholar] [CrossRef]
- Chen, G.; Wu, X.; Guo, J.; Meng, J.; Li, C. Global overview for energy use of the world economy: Household-consumption-based accounting based on the world input-output database (WIOD). Energy Econ. 2019, 81, 835–847. [Google Scholar] [CrossRef]
- Beylot, A.; Secchi, M.; Cerutti, A.; Merciai, S.; Schmidt, J.; Sala, S. Assessing the environmental impacts of EU consumption at macro-scale. J. Clean. Prod. 2019, 216, 382–393. [Google Scholar] [CrossRef]
- Albert, O.-O.K.; Richard, W.; Lekve, B.E.; Dario, C.; Marianne, T. Understanding the trends in Denmark’s global food trade-related greenhouse gas and resource footprint. J. Clean. Prod. 2021, 313, 127785. [Google Scholar]
- Mi, Z.; Wei, Y.-M.; Wang, B.; Meng, J.; Liu, Z.; Shan, Y.; Liu, J.; Guan, D. Socioeconomic impact assessment of China’s CO2 emissions peak prior to 2030. J. Clean. Prod. 2017, 142, 2227–2236. [Google Scholar] [CrossRef]
- Mi, Z.; Zhang, Y.; Guan, D.; Shan, Y.; Liu, Z.; Cong, R.; Yuan, X.-C.; Wei, Y.-M. Consumption-based emission accounting for Chinese cities. Appl. Energy 2016, 184, 1073–1081. [Google Scholar] [CrossRef]
- Wang, P.; Li, Y.; Huang, G.; Wang, S.; Suo, C.; Ma, Y. A multi-scenario factorial analysis and multi-regional input-output model for analyzing CO2 emission reduction path in Jing-Jin-Ji region. J. Clean. Prod. 2021, 300, 126782. [Google Scholar] [CrossRef]
- Chen, Q.; Su, M.; Meng, F.; Liu, Y.; Cai, Y.; Zhou, Y.; Yang, Z. Analysis of urban carbon metabolism characteristics based on provincial input-output tables. J. Environ. Manag. 2020, 265, 110561. [Google Scholar] [CrossRef]
- Zheng, H.; Zhang, Z.; Wei, W.; Song, M.; Dietzenbacher, E.; Wang, X.; Meng, J.; Shan, Y.; Ou, J.; Guan, D. Regional determinants of China’s consumption-based emissions in the economic transition. Environ. Res. Lett. 2020, 15, 074001. [Google Scholar] [CrossRef]
- Pan, J.; Phillips, J.; Chen, Y. China’s balance of emissions embodied in trade: Approaches to measurement and allocating international responsibility. Oxf. Rev. Econ. Policy 2008, 24, 354–376. [Google Scholar] [CrossRef]
- Lloyd, S.P. Least Squares Quantization in PCM. IEEE Trans. Inf. Theory 1982, 28, 129–137. [Google Scholar] [CrossRef]
- Sammut, C.; Webb, G.I. (Eds.) K-Means Clustering. In Encyclopedia of Machine Learning; Springer Science & Business Media: Berlin/Heidelberg, Germany, 2011. [Google Scholar] [CrossRef]
- CEADS. Available online: http://www.ceads.net (accessed on 19 April 2023).
- Lai, S.; Lu, J.; Luo, X.; Ge, J. Carbon emission evaluation model and carbon reduction strategies for newly urbanized areas. Sustain. Prod. Consum. 2022, 31, 13–25. [Google Scholar] [CrossRef]
- Geng, Y.; Sarkis, J. Achieving National Emission Reduction Target—China’s New Challenge and Opportunity. Environ. Sci. Technol. 2012, 46, 107–108. [Google Scholar] [CrossRef]
- Tian, G.; Yu, S.; Wu, Z.; Xia, Q. Study on the emission reduction effect and spatial difference of carbon emission trading policy in China. Energies 2022, 15, 1921. [Google Scholar] [CrossRef]
- Zhong, Z.; Jiang, L.; Zhou, P. Transnational transfer of carbon emissions embodied in trade: Characteristics and determinants from a spatial perspective. Energy 2018, 147, 858–875. [Google Scholar] [CrossRef]
- Qu, S.; Yang, Y.; Wang, Z.; Zou, J.-P.; Xu, M. Great divergence exists in Chinese provincial trade-related CO2 emission accounts. Environ. Sci. Technol. 2020, 54, 8527–8538. [Google Scholar] [CrossRef]
- Lv, K.; Feng, X.; Kelly, S.; Zhu, L.; Deng, M. A study on embodied carbon transfer at the provincial level of China from a social network perspective. J. Clean. Prod. 2019, 225, 1089–1104. [Google Scholar] [CrossRef]
- Liu, L.-C.; Liang, Q.-M.; Wang, Q. Accounting for China’s regional carbon emissions in 2002 and 2007: Production-based versus consumption-based principles. J. Clean. Prod. 2015, 103, 384–392. [Google Scholar] [CrossRef]
- Yang, M.; Hou, Y.; Wang, Q. Rethinking on regional CO2 allocation in China: A consideration of the carbon sink. Environ. Impact Assess. Rev. 2022, 96, 106822. [Google Scholar] [CrossRef]
- Li, R.; Wang, Q.; Wang, X.; Zhou, Y.; Han, X.; Liu, Y. Germany’s contribution to global carbon reduction might be underestimated—A new assessment based on scenario analysis with and without trade. Technol. Forecast. Soc. Chang. 2022, 176, 121465. [Google Scholar] [CrossRef]
- Liu, Y.; Tang, L.; Liu, G. Carbon Dioxide Emissions Reduction through Technological Innovation: Empirical Evidence from Chinese Provinces. Int. J. Environ. Res. Public Health 2022, 19, 9543. [Google Scholar] [CrossRef] [PubMed]
- Eggleston, H.; Buendia, L.; Miwa, K.; Ngara, T.; Tanabe, K. 2006 IPCC Guidelines for National Greenhouse Gas Inventories; Institute for Global Environmental Strategies (IGES): Hayama, Japan, 2006. [Google Scholar]
- Yi, W.-J.; Zou, L.-L.; Guo, J.; Wang, K.; Wei, Y.-M. How can China reach its CO2 intensity reduction targets by 2020? A regional allocation based on equity and development. Energy Policy 2011, 39, 2407–2415. [Google Scholar] [CrossRef]
- Wesseh, P.K., Jr.; Lin, B.; Atsagli, P. Carbon taxes, industrial production, welfare and the environment. Energy 2017, 123, 305–313. [Google Scholar] [CrossRef]
- Jorgenson, D.W.; Slesnick, D.T.; Wilcoxen, P.J.; Joskow, P.L.; Kopp, R. Carbon taxes and economic welfare. Brook. Pap. Econ. Act. Microecon. 1992, 1992, 393–454. [Google Scholar] [CrossRef]
- Sun, X.; Zhang, H.; Wang, X.; Qiao, Z.; Li, J. Towards Sustainable Development: A Study of Cross-Regional Collaborative Carbon Emission Reduction in China. Sustainability 2022, 14, 9624. [Google Scholar] [CrossRef]
Figure 1.
Carbon emissions of China in 2017, by province.

Figure 2.
Embodied carbon flow network among 30 provinces in 2017. In each grid, rows and columns represent the embodied carbon emissions of consumption and production in the province, respectively.
Figure 2.
Embodied carbon flow network among 30 provinces in 2017. In each grid, rows and columns represent the embodied carbon emissions of consumption and production in the province, respectively.

Figure 3.
Carbon emission spillovers in different provinces.

Figure 4.
Carbon emission factors of China.

Figure 5.
Trade balance of different provinces.

Figure 6.
Comparison of net trade flows and carbon emission flows of each province.

Figure 7.
The elbow method and the CH, SH, and DB indicators were used to evaluate the clustering results: (a) Elbow method to select k value. (b) Evaluation results of different clustering indicators (CH, SH, and DB) when k = 3–6, each color represents one cluster of provinces.
Figure 7.
The elbow method and the CH, SH, and DB indicators were used to evaluate the clustering results: (a) Elbow method to select k value. (b) Evaluation results of different clustering indicators (CH, SH, and DB) when k = 3–6, each color represents one cluster of provinces.

Figure 8.
The k-means clustering results, clustering samples from 30 provinces into 3 clusters.


Table 1.
Emissions and economic data of the IO table.
| Province | (MtCO2) | (Billion CNY) | Value of Total Output X (Billion CNY) | Carbon Emission Intensity (CO2 Emissions Per X in kg/Billion CNY) |
|---|---|---|---|---|
| Beijing | 130.8447534 | 386.25 | 8057.62595353 | 0.10618573 |
| Tianjin | 21.30661562 | −151.43 | 5477.25936850 | 0.26288875 |
| Hebei | −132.8549652 | −339.44 | 9048.22766085 | 0.875669578 |
| Shanxi | −144.092038 | −303.39 | 3552.66430072 | 1.43156913 |
| Inner Mongolia | −204.7213401 | −226.33 | 3432.71953823 | 1.913488243 |
| Liaoning | −47.8913827 | −2.85 | 5655.79638150 | 0.878448236 |
| Jilin | −26.26580856 | −265.24 | 4168.24178385 | 0.490221102 |
| Heilongjiang | −52.87473351 | −235.29 | 3451.64238694 | 0.80225821 |
| Shanghai | 18.1690189 | −916.46 | 8595.22130804 | 0.228212284 |
| Jiangsu | 66.11943215 | −229.12 | 23,163.05044022 | 0.327193738 |
| Zhejiang | 193.5345881 | 1144.43 | 13,686.24859557 | 0.280985829 |
| Anhui | −7.563860822 | 68.53 | 8880.76230130 | 0.430386974 |
| Fujian | 7.737647196 | −146.74 | 8613.30414124 | 0.272798681 |
| Jiangxi | −4.671829386 | −78.45 | 5425.54276535 | 0.422039993 |
| Shandong | −51.70723951 | −463.87 | 23,655.20768753 | 0.353334056 |
| Henan | 11.57950805 | 49.27 | 13,630.94432928 | 0.368173852 |
| Hubei | 25.9937036 | 170.06 | 8667.56873359 | 0.382590306 |
| Hunan | 5.831142998 | −45.97 | 7531.59592419 | 0.429733686 |
| Guangdong | 186.450015 | 413.68 | 23,171.18855864 | 0.24032389 |
| Guangxi | 3.454222982 | 67.18 | 4494.85337619 | 0.507005601 |
| Hainan | 11.54509415 | 80.70 | 1051.87564881 | 0.400775434 |
| Chongqing | 68.57056298 | 403.01 | 5101.27381082 | 0.314724855 |
| Sichuan | 35.49972612 | 237.48 | 9195.37610680 | 0.346740327 |
| Guizhou | −30.18334765 | −13.11 | 3072.79321962 | 0.838513195 |
| Yunnan | 41.92336883 | 392.45 | 3705.88377753 | 0.537007932 |
| Shaanxi | −8.33299848 | −40.84 | 5134.13032839 | 0.533741104 |
| Gansu | −21.43795239 | −46.71 | 1709.14735799 | 0.889090504 |
| Qinghai | 1.145232259 | 26.77 | 621.48655149 | 0.860616388 |
| Ningxia | −24.98614166 | 71.46 | 827.83322521 | 2.157734511 |
| Xinjiang | −72.12099436 | −6.04 | 2579.73318038 | 1.58061342 |
Table 2.
Evaluation results of different clustering indicators (CH, SH, and DB) obtained by different clustering values.
Table 2.
Evaluation results of different clustering indicators (CH, SH, and DB) obtained by different clustering values.
| Amount of Clusters | Silhouette Score | Davies–Bouldin Score | Calinski–Harabasz Score |
|---|---|---|---|
| 3 | 0.6781 | 0.3464 | 63.0233 |
| 4 | 0.5678 | 0.4575 | 97.5296 |
| 5 | 0.5646 | 0.4543 | 118.9320 |
| 6 | 0.5571 | 0.3676 | 131.2678 |
Table 3.
Final results of k-means clustering analysis.
| Cluster | Provinces |
|---|---|
| Cluster 1 | Beijing, Zhejiang, Guangdong |
| Cluster 2 | Tianjin, Liaoning, Jilin, Heilongjiang, Shanghai, Jiangsu, Anhui, Fujian, Jiangxi, Shandong, Henan, Hubei, Hunan, Guangxi, Hainan, Chongqing, Sichuan, Guizhou, Yunnan, Shaanxi, Gansu, Qinghai, Ningxia, Xinjiang |
| Cluster 3 | Hebei, Shanxi, Inner Mongolia |
Disclaimer/Publisher’s Note: The statements, opinions and data contained in all publications are solely those of the individual author(s) and contributor(s) and not of MDPI and/or the editor(s). MDPI and/or the editor(s) disclaim responsibility for any injury to people or property resulting from any ideas, methods, instructions or products referred to in the content. |
© 2023 by the authors. Licensee MDPI, Basel, Switzerland. This article is an open access article distributed under the terms and conditions of the Creative Commons Attribution (CC BY) license (https://creativecommons.org/licenses/by/4.0/).
Share and Cite
MDPI and ACS Style
Liu, D.; Liang, J.; Xu, S.; Ye, M. Analysis of Carbon Emissions Embodied in the Provincial Trade of China Based on an Input–Output Model and k-Means Algorithm. Sustainability 2023, 15, 9196. https://doi.org/10.3390/su15129196
AMA Style
Liu D, Liang J, Xu S, Ye M. Analysis of Carbon Emissions Embodied in the Provincial Trade of China Based on an Input–Output Model and k-Means Algorithm. Sustainability. 2023; 15(12):9196. https://doi.org/10.3390/su15129196
Chicago/Turabian StyleLiu, Danzhu, Jinqiang Liang, Shuliang Xu, and Mao Ye. 2023. "Analysis of Carbon Emissions Embodied in the Provincial Trade of China Based on an Input–Output Model and k-Means Algorithm" Sustainability 15, no. 12: 9196. https://doi.org/10.3390/su15129196
Note that from the first issue of 2016, this journal uses article numbers instead of page numbers. See further details here.