1. Introduction
Road traffic safety is a crucial global concern, with vulnerable road users being a significant focus. In China’s rapidly growing urban population, the incidence of urban traffic congestion, violations and accident risk has increased dramatically. In China, the urbanization rate of the resident population is expected to reach 65.22% by the end of 2022 and 75–80% by 2035 [
1]. Furthermore, more than 70% of the world’s natural resources are consumed in cities [
2]. Beijing’s central city has a peak hour road traffic index of 5.58 in 2021, up 10.1% year-on-year; peak hour ground bus operating speed of 17.3 km/h, down 4.4% year-on-year. Traffic congestion is becoming more frequent and poses a greater risk to road safety. In 2018, the World Health Organization defined vulnerable road users as pedestrians, bicyclists, and motorcyclists in the Global Status Report on Road Safety and reported that more than 1.35 million people die in road traffic accidents worldwide each year, with over half of the fatalities being vulnerable road users [
3]. Therefore, protecting vulnerable road users in road traffic safety is urgent. Holländer et al. classified road users and proposed a classification scheme for vulnerable road users, as shown in
Figure 1 [
4]. In China, vulnerable road users accounted for 66% of all road traffic casualties from 2001 to 2015. Given the actual traffic situation in the Wudaokou study area of Beijing, motorcycles are rarely used, and besides pedestrians and bicycles, e-bikes are prevalent. Therefore, this study focuses primarily on pedestrians, bicycles, and e-bikes concerning vulnerable road users.
China provides a natural laboratory for studying road traffic safety due to several characteristics. Firstly, China is focusing on smart city construction and high-quality urban development, where the safety of road traffic participants is critical and receives significant attention [
5]. Convenient, safe and humane road traffic links are an important foundation for the construction and sustainable development of smart cities. Secondly, China has a vast geographical area with uneven regional development, rapid urban population growth, and a significant difference in education levels among its people. Thirdly, there is a rapid increase in motor vehicle ownership, and there is a high density of motorized and non-motorized vehicles and pedestrians. Fourthly, the construction of road infrastructure lags behind the growth of transportation demand. Lastly, the official statistics and analysis of road traffic accidents in China are incomplete. Therefore, based on the above characteristics, China provides a rich and diverse traffic scenario for road traffic research, while at the same time urgently needing comprehensive and effective road traffic safety research results.
Many scholars in China focus on road safety research, and their research directions can be broadly divided into three categories. The first category is accident prevention, which focuses on avoiding traffic accidents and reducing traffic conflicts. It is the primary measure for improving traffic safety. This method mainly studies the human-vehicle-road system and the relationship between them, including vehicle safety design, vehicle maintenance and upkeep, road design, road safety facilities, and safety education for road traffic participants [
6]. The second category is injury reduction, which focuses on how to reduce the harm caused by traffic accidents. It involves safety measures for vehicle design and road traffic control, including safety airbags, cab design, and emergency management system design for roads [
7]. The third category is accident investigation and analysis, which involves macro and micro-analytic methods. The former is used for macroscopic analysis of traffic accidents involving a group of people, a city, or a region. The latter is used for the micro-analysis of specific traffic facilities or sections of roads, such as road intersections [
7].
Traditional road traffic safety research often focuses on environmental structural safety issues or considers human factors as the cause of accidents. However, in the road traffic system where humans, vehicles, roads, and the environment are interconnected, many factors contribute to traffic accidents and need more targeted evaluation methods and preventive measures. Understanding the decision-making process of vulnerable road users can help develop more effective countermeasures to reduce traffic accidents. This study can provide valuable insights into the decision-making process of vulnerable road users, using schema theory and the perceptual cycle model.
1.1. Schema Theory
The concept of a schema can be traced back to the early 19th century [
8,
9,
10]. German philosopher Kant regarded a schema as a specific form or rule of “productive imagination”. Piaget, a renowned Swiss child psychologist, explored the role of schemas in children’s growth in the 1920s. In addition, it is generally believed that the research on memory, carried out by British experimental psychologist Bartlett in the 1930s, laid a solid foundation for the establishment of schema theory [
10], where the research showed that the interaction between existing knowledge and new information caused the distortion of the latter; this research brought the word “schema” into mainstream psychology. This study revealed, for the first time, the role of past experience in guiding cognitive processes and changing information about the world. Bartlett believed that a schema is the active organization of past experiences and responses, which can be combined with the information of the new world to guide behaviors. After decades of development, schema theory has been continuously enriched and improved.
The modern schema theory came into being after the rise of cognitive psychology in the mid-1970s. In 1976, Neisser described a schema as a mental template of thoughts and behaviors, and our cognition and understanding of our world are organized by schemas [
11]. He believed that many schemas are interrelated and have a hierarchical arrangement, referred to as schemata. This view is recognized by Plant and Stanton, who believe that one’s knowledge should be regarded as an information network that is activated by one’s experience of the world [
12]. When an individual is performing a task, schemata not only affect the way that an individual perceives useful information in the world and guides them to take appropriate actions to deal with the world but also affect the storage mode of the acquired information [
13]. This means that schemata can enable individuals to actively adapt to the received environmental stimuli based on previous experience, and they guide them to formulate appropriate behavioral responses [
10]. If the schemata are suitable for the situation, they will produce appropriate behavioral responses. However, if the stimulus information received from the world is misunderstood, it may lead to maladjustment [
14]. These eventually lead to slips of action or lapses in attention. Neisser put forward two types of schemata in 1976: the genotype and phenotype [
11]. The genotype reflects the residential structure in the mind, which can continue to guide one’s behaviors in the world. Therefore, the genotype schemata serve as a template for the basis of our action response. It is possible for these templates to continue to develop, but a key determinant of their development is their interaction with the world [
15]. In contrast, the phenotype schemata reflect the “present” behaviors, which are manifested by our actions in the world [
16]. According to Norman, there are three basic errors related to genotype schemata that can be used to explain most errors: activating the wrong schemata, failing to activate the proper schemata, and triggering the active schemata by mistake. All these types of errors are common in road traffic environments [
14]. So far, schema theory has been widely used in cross-cultural communication, road traffic, aviation, the military and other fields [
17,
18].
1.2. The Perceptual Cycle Model
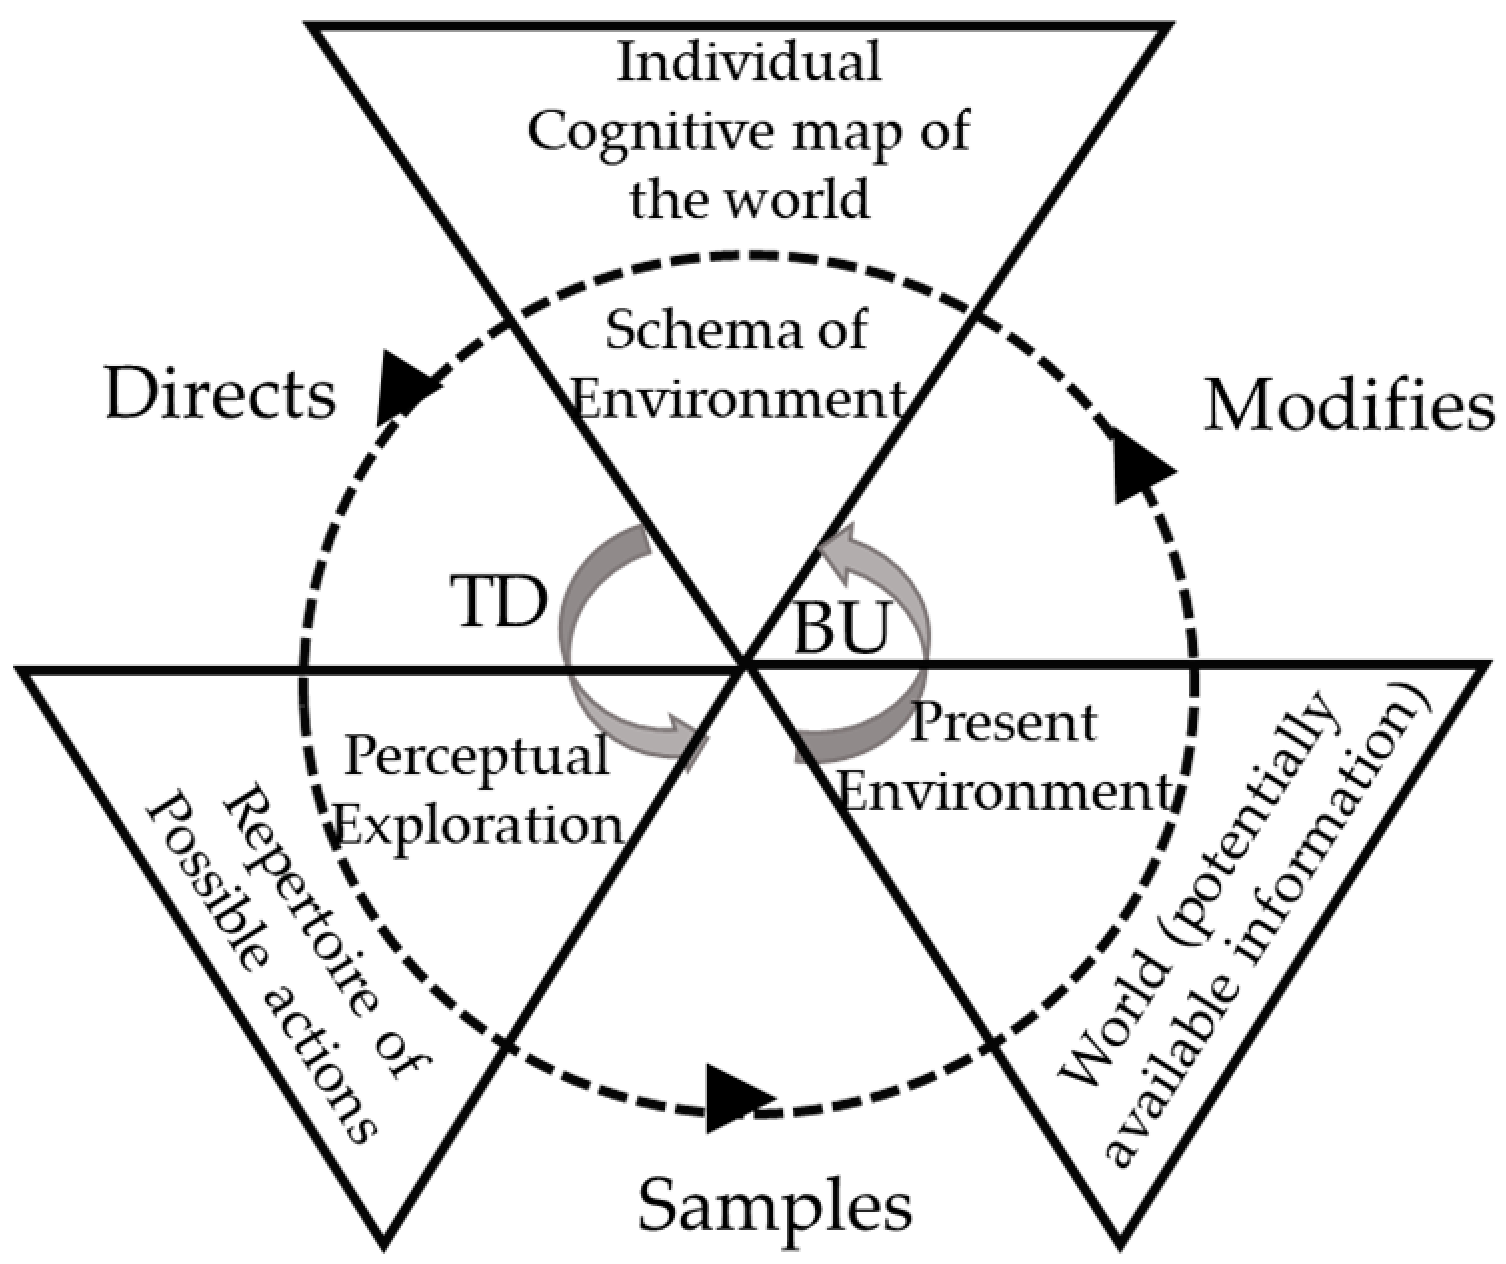
In 1976, Neisser put forward the concept of the perceptual cycle model (as shown in
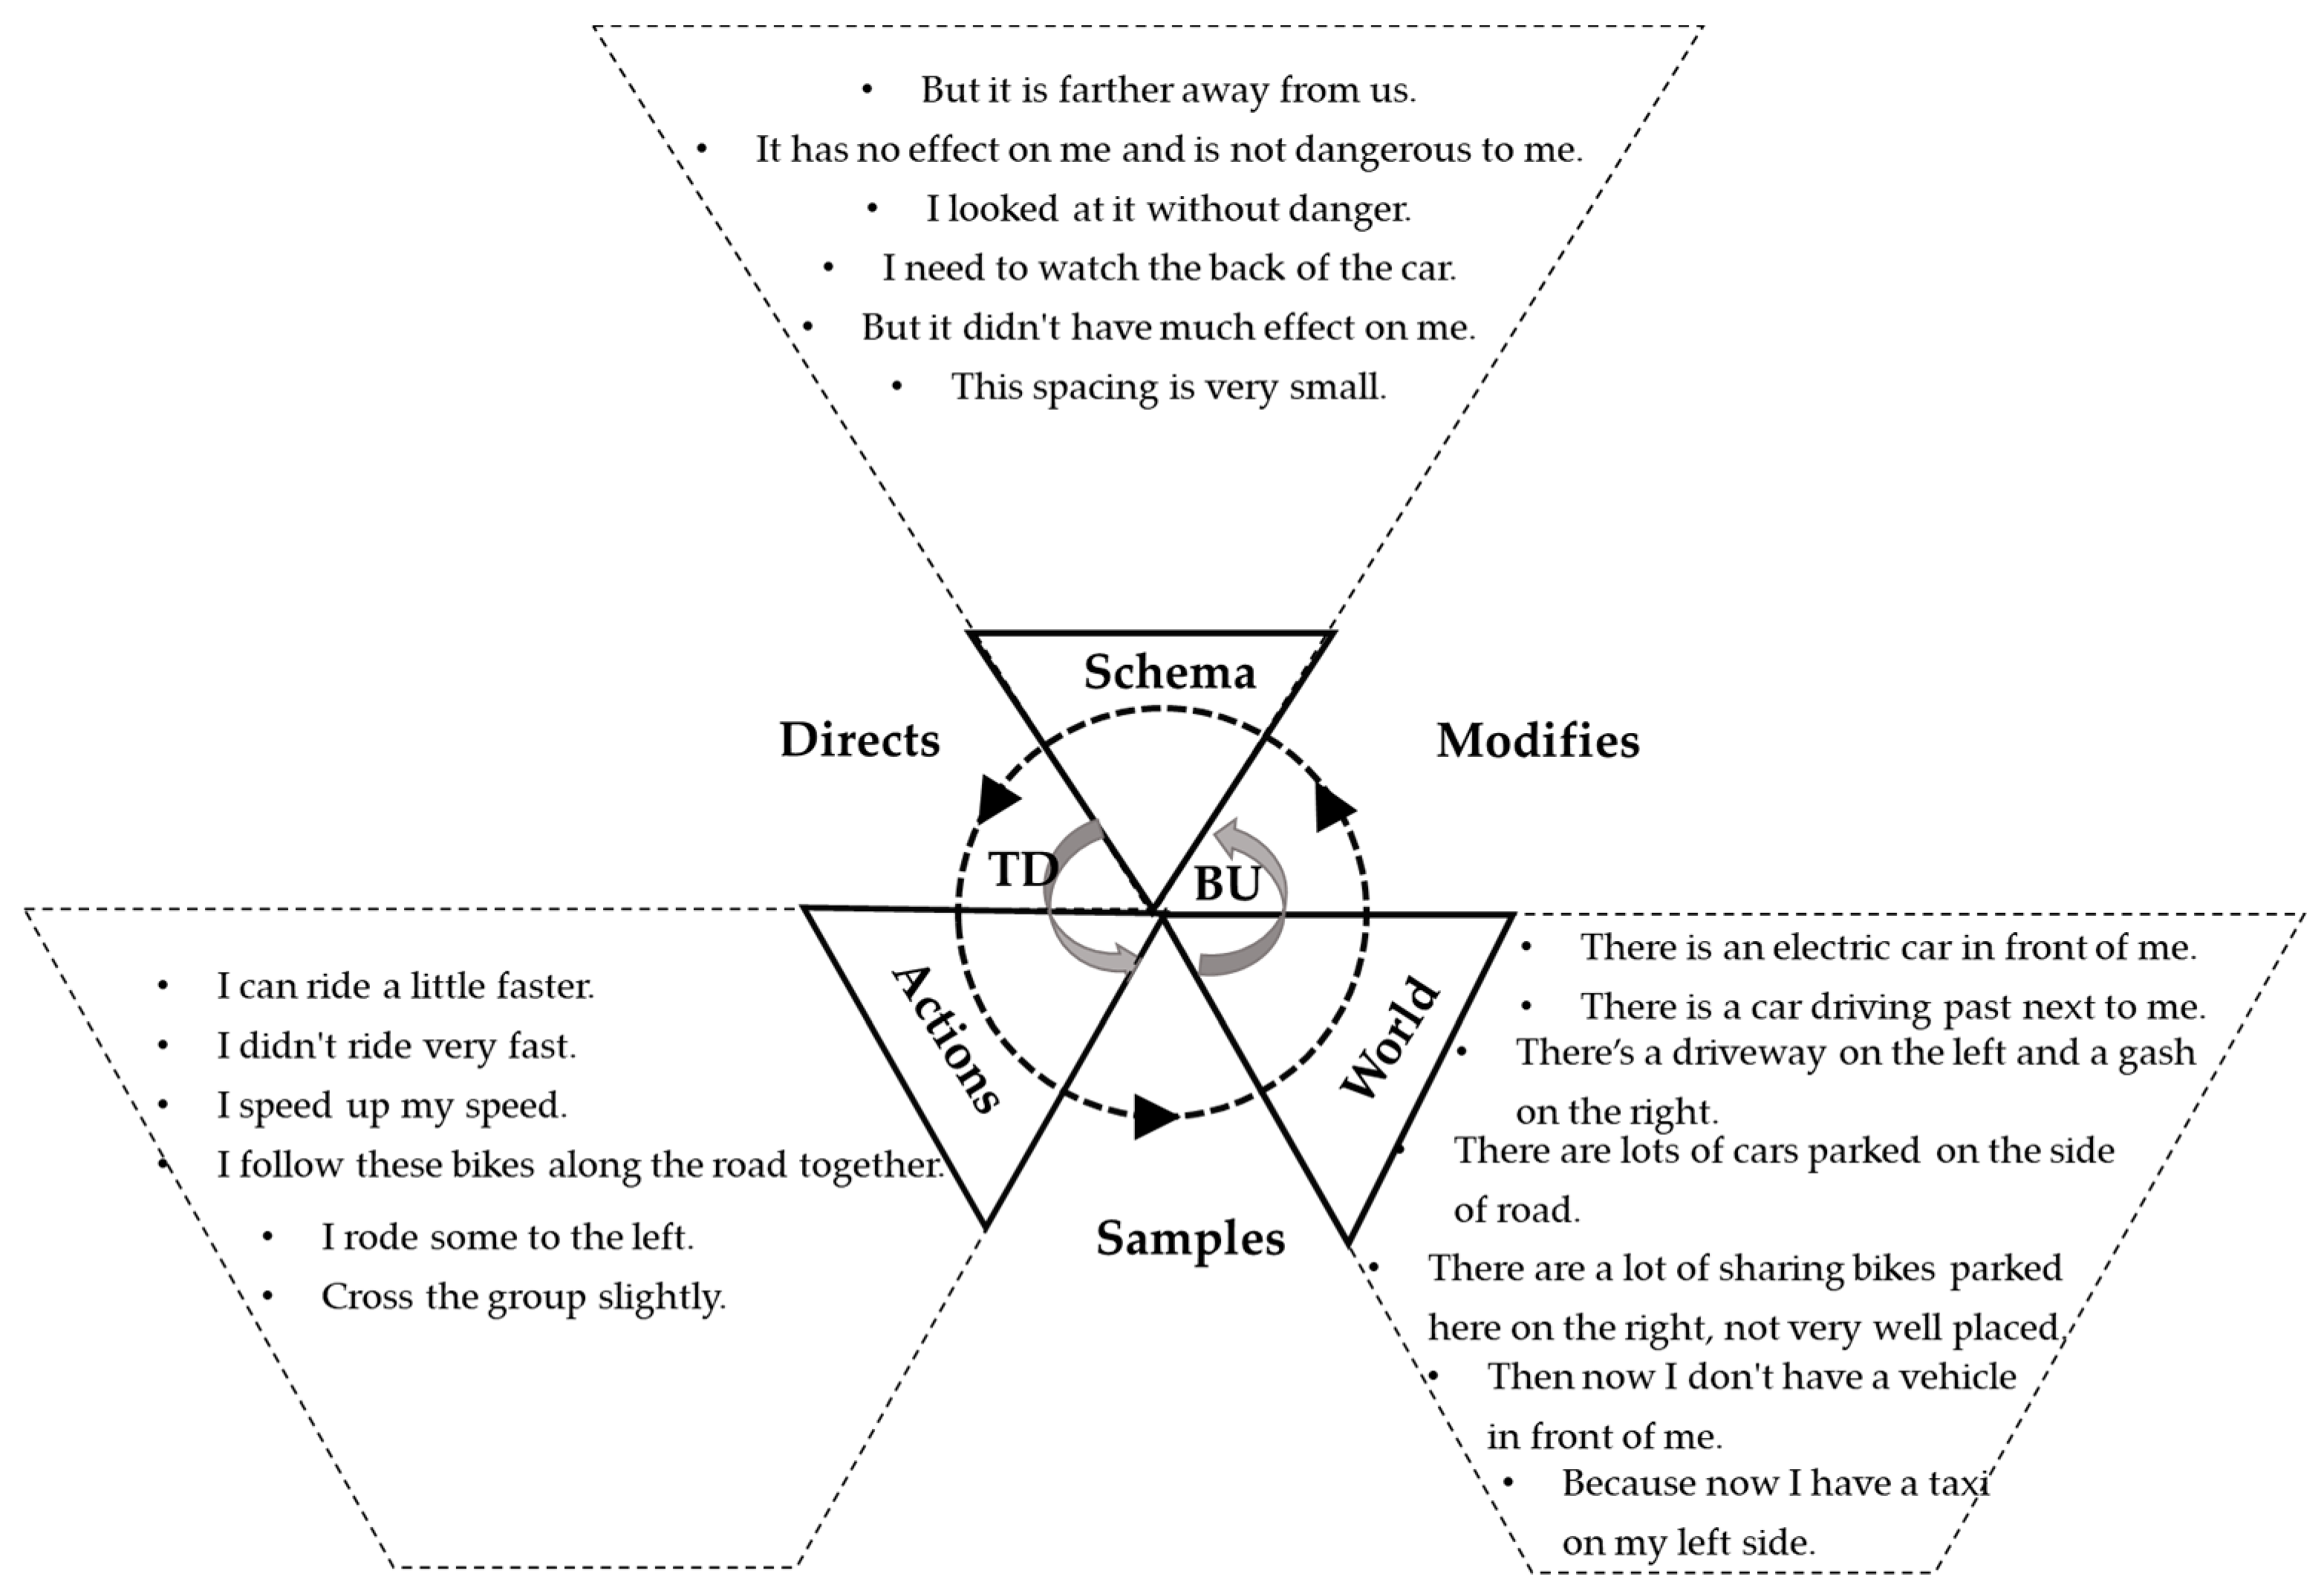
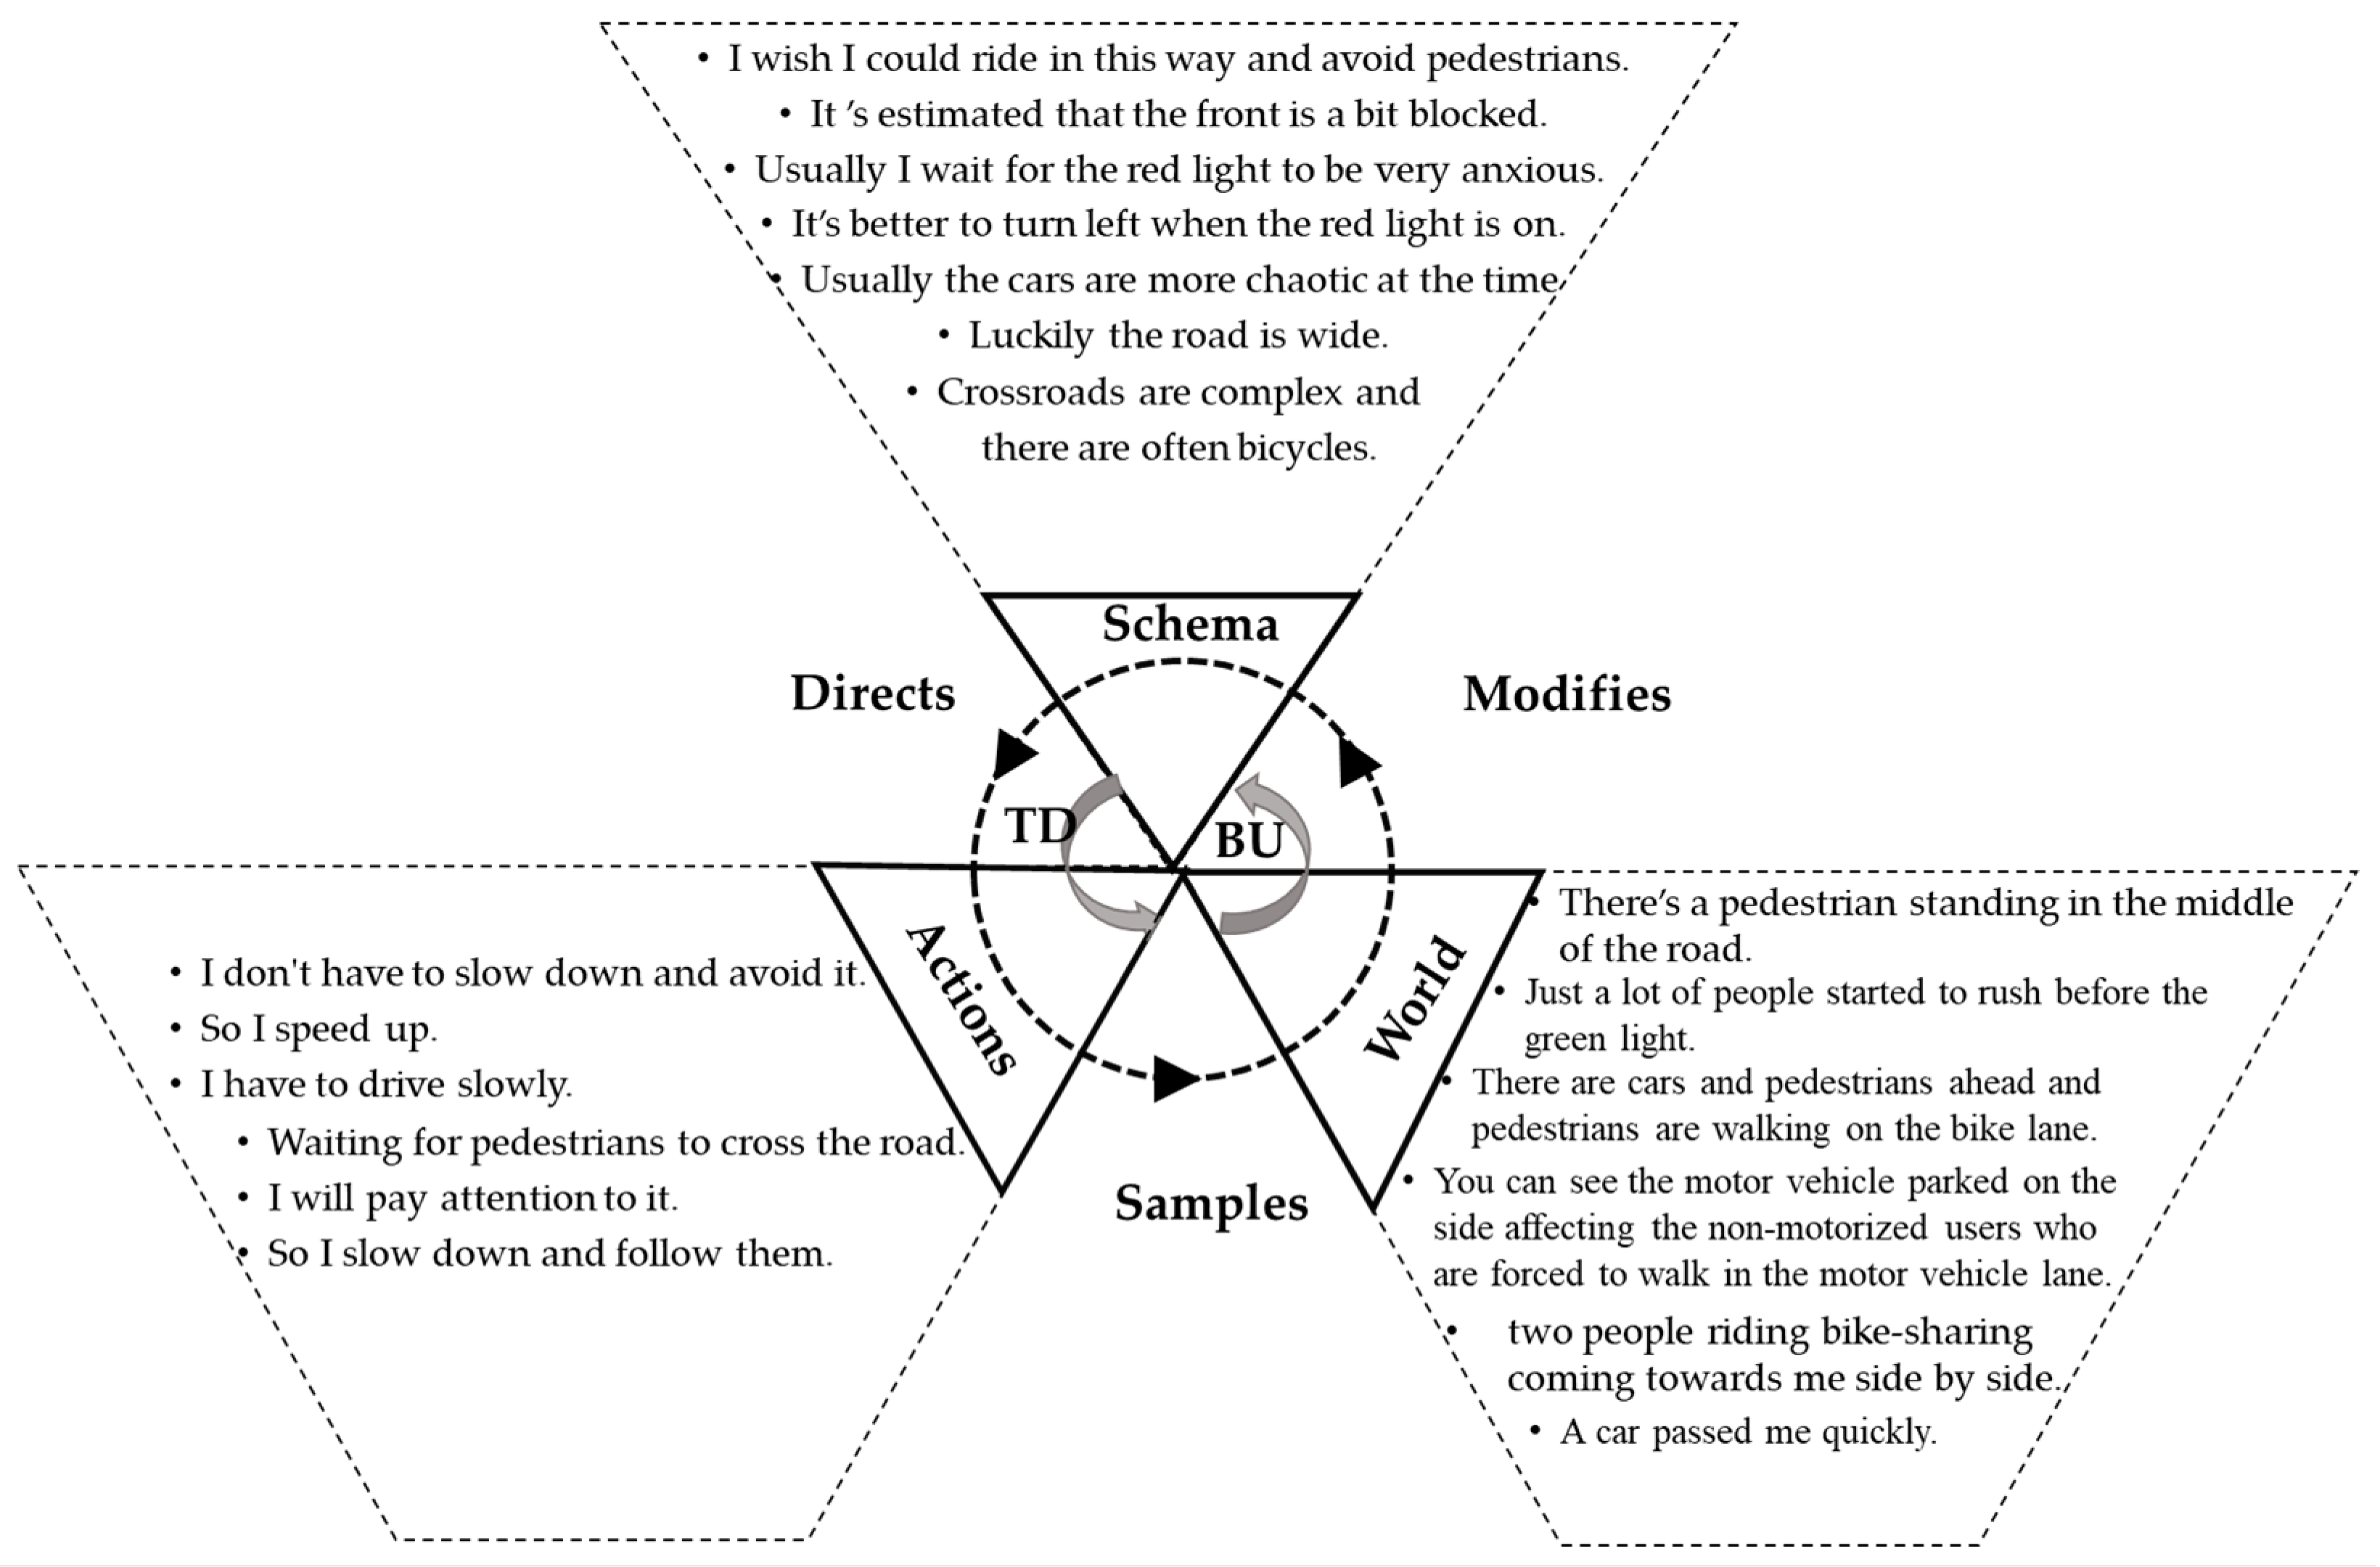
Figure 1). Its key components are the world, the schema and the action, and it is believed that there are reciprocal and cyclical relationships between them that profoundly reveal the interaction mechanism between people and their environment or a larger system. Based on the model of schema theory, this model emphasizes the role of schemas. Similarly, schema theory plays a greater role when it is incorporated into the perceptual cycle model. Specifically, the PCM model constructs the operational mode of information interaction between individuals and their environment. According to the introduction of the above schema theory, all individuals form a schema tower based on experience. When individuals receive interactive information from the world, they trigger the corresponding schema, thus realizing the expectation of the current environment. In this process, the previous experience is combined with the currently received information to guide the generation of corresponding behaviors. These behaviors try to explain the information available to them in the environment to realize the experience generated in the current environment, revise and update the existing schema, and influence their future interactions with the environment. As shown in
Figure 2, the information flow processing mechanism proposed by the PCM includes both the top-down schema-driven process on the left and the bottom-up environmentally driven process on the right, and the behavior of individuals determines the specific local environment that they face, i.e., the sampling process from the action to the world.
In the field of ergonomics, the PCM model is helpful for further understanding the complex interactions between human beings and their environments. By considering the psychological and situational factors that dominate behavior, this method helps to bridge the gap between the current ecological and information processing perspectives, thus providing a systematic explanation of decision-making and action. As stated by [
16], PCM, together with schema theory, provides a theory of everything, which can explain the interaction between people and the environment and acknowledge the decision-making and action processes rather than merely offering a description of what has happened. The PCM model allows for analysis and interpretation to transcend all levels of the system so that it can describe all levels of a distributed control system and its interactions. As simulated by the PCM model, human beings are not linear information processors. On the contrary, human behavior is the product of data-driven (world) and knowledge-driven (schema) information fusion [
12]. With the gradual development and perfection of the perceptual cycle model, many scholars have begun to pay attention to the validity of the model. By using the perceptual cycle model to analyze the data of critical decision-making methods, Plant et al. showed that the perceptual cycle model can be used to analyze the decision-making process and emphasized the important influence of schemata on this process. The reliability of this method was verified, and its general applicability was discussed [
19]. In 2015, Plant et al. attempted to explore the structural validity of the perceptual cycle model in aviation decision-making by analyzing the critical decision-making of 20 helicopter pilots [
20].
In the 1980s, Donald Norman continued to apply schema theory, especially in his error classification work. He described how the inappropriate activation of schemas led to unexpected behavior (errors). The application of schema theory and the PCM model in SA, NDM and error analysis has attracted much attention.
The pattern of information flow of the PCM is helpful for understanding the decision-making and behavior processes of road users. The application of schema theory and the PCM model to study road safety has attracted more and more attention. According to [
21], the application of schema theory and the perceptual cycle model in the 1989 Kegworth accident provides a systematic human explanation, which can help to explain the incorrect causality. They believed that schema theory and the PCM explained why the actions and evaluations of operators at that time were meaningful to them. [
22] used the PCM model to analyze an accident in which a semi-trailer truck collided with a train at the intersection of a railway and a road in Northern Victoria, Australia. The investigation results showed that the main cause of the incident was the apparent but invisible error caused by the incorrect activation of the mode error, which led the truck driver to initially assume that the intersection was inactive, and no train was present. In addition, various system-wide factors affecting the accidents of railway-grade crossings were determined. When analyzing Tesla’s serious car accident in May 2016, Banks et al. used the perceptual cycle model to analyze the driver’s environmental factors at the time of the accident, and they suggested that the cause of the accident was not only related to the driver’s mistakes but also to the problems existing in the automatic driving function design [
23]. In the Dhaka Metropolitan Area in Bangladesh, the perceptual cycle model (PCM) was used to analyze 46 pedestrians’ oral reports to study how the pedestrians interacted with different road users and the factors that affected the pedestrians’ decision-making and crossing behavior in different road sections [
24]. It was found that many external factors affected the use of roads, leading to more dangerous crossings. To effectively integrate user information input in the early stage of the design process of new aviation application technology and better improve the current system, Parnell et al. interviewed airline pilots in depth and analyzed their responses to different engine failure events caused by birds striking the engine by using the perceptual cycle model (PCM) [
25]. Based on this research, through in-depth interviews with eight experienced airline pilots, Parnell et al. performed a comparative analysis of pilots’ decisions when they encountered twin engine failures during take-off, applying the recognition primed decision model, decision ladders and the perceptual cycle model [
26]. In a study of railway crossing accidents in Bangladesh, as a cognitive method, the perceptual cycle model (PCM), Accimaps, and a systems theoretical incident model and process-causal analysis were separately used to analyze the impact factors of collisions, and different intervention measures were put forward for accidents with different risk management frameworks [
27]. The three methods complemented each other, and the analysis was more comprehensive. With the development of autonomous driving technology, many semi-autonomous cars are gradually arriving on the road. In the UK, the perceptual cycle model (PCM) was used to analyze how six British drivers interacted with semi-autonomous cars while driving, explore the existing problems and put forward seven key design considerations to promote more active and safer interactions between drivers and autonomous vehicles [
28]. Lynch et al. explored the basic decision-making processes of unmanned aerial vehicle operators by applying the perceptual cycle model to UAV flight accident analysis [
29]. In order to expand the application scope of the perceptual cycle model, Plant et al. interviewed and analyzed the responses of four crew members of a helicopter search and rescue team regarding an engine oil temperature accident, and then explored the application of the model in distributed team decision-making [
30].
In China, the PCM model was used in the understanding of language learning mechanisms, but it has not been found in road safety research. In this context, the purpose of this research was to use the PCM model to help to understand the behavior of urban road participants in China and the importance of the cognitions and actions of the participants in designing traffic safety interventions. The research of behavior and decision-making phenomena in complex road traffic environments will help to enhance urban road characteristics to improve traffic safety, especially in developing countries.
This study presents a novel approach to investigating the perception and decision-making processes of vulnerable road users (VRUs) in urban environments.
Firstly, the study collected language data through oral reports and applied the schema theory and perceptual cycle model to analyze the attentional focus and decision-making processes of VRUs.
Secondly, the study also proposed a new perspective for analyzing traffic accidents and risks by not only considering the risks and human factors in traffic but also focusing on the design flaws of infrastructure and traffic flow organization that underlie human factors. The study found that the decision-making of VRUs is influenced by their past experiences, environment and actions.
Thirdly, although many studies have been conducted on road traffic safety in China, the application of the perceptual cycle model to road traffic safety has been largely overlooked. Thus, this study makes a valuable contribution to this research area.
Lastly, from the perspective of VRUs, the study provides useful recommendations for improving the current state of road traffic in the research area, which has significant practical implications.
The structure of this paper is as follows. In
Section 2, we specifically introduced the subjects, locations, and the process of data collection and processing in the experiment.
Section 3 presents the experimental results and analysis.
Section 4 further expands on the discussion based on
Section 3. In
Section 5, we summarize the article from two aspects. On the one hand, we introduce the research findings of the paper, and on the other hand, we discuss the shortcomings of the article and future research directions.
4. Discussion
According to the statistics of word frequency in the texts, it was found that problems such as illegal parking, running a red light, retrograde motion and delivery vehicles were common, which were recognized as the main problems in the Wudaokou district under the current study.
The above behavior of other road users is one of the most important factors that lead to the downgrading of road safety among the three groups of road users. Since the subjects were all strict observers of traffic rules, the others’ traffic disruptions could increase their anxiety and antipathy. The Wudaokou district is close to the entrance and exit of a subway station, and there are many large-scale restaurants and shopping centers, with a relatively closed office area. Thus, the phenomenon of pedestrians gathering in groups is obvious, and commuters are sensitive to commuting times; therefore, there is a widespread phenomenon of rushing through red lights, and this violation is gradually becoming more common, with a great impact on traffic safety at intersections. In addition, the retrograde movement of electric bicycles and bicycles is also common, attracting more participants’ attention during the course of the participants’ travel. To some extent, the retrograde movement of non-motor vehicles leads to confusion in the traffic flow in non-motor vehicle lanes, which reduces the driving speed and increases the traffic risk.
From the perspective of road infrastructure in the target area, the main reason for these traffic disturbances can be analyzed from two perspectives. On the one hand, the road that we studied lacked punishment measures for the retrograde motion phenomenon. On the other hand, there were more merchants on both sides of the Chengfu Road section, and long isolation facilities on the road, and thus, the retrograde motion also increased the convenience for road users to a certain extent. Road users did not travel on the prescribed lanes, which was mainly manifested in the fact that some pedestrians walk in non-motor vehicle lanes and non-motor vehicles occupy motor vehicle lanes. The reasons behind this phenomenon may be that there was a certain randomness in the traffic behavior of road users and the supervision was lax; moreover, it may also be strongly related to parking occupancy. It is very common for motor vehicles to occupy non-motor vehicle lanes, especially on non-main roads, and the occupation of non-motor vehicles on the road section under study was also very common. Most lane space in the studied road was occupied, and this sometimes even forced non-motor vehicles to temporarily change direction and drive in motor vehicle lanes. These behaviors greatly increase the risk of traffic accidents. This illegal and disordered condition is closely related to the imbalance between the supply and demand for parking spaces.
Imperfections in infrastructure design also have a certain impact on current road safety. Many people report that parking space is very limited, and the existing non-motor vehicle parking lots cannot meet the demand and, therefore, are quite inconvenient. At present, bike sharing, which is developing rapidly, lacks a corresponding standard parking area and occupies the existing sidewalks and non-motor vehicle lanes instead. There are many college students and office workers who mostly use bicycles near Wudaokou and who rely on bike sharing in connecting the “last mile”. When Chengfu Road approaches the intersection near the subway station, the road width narrows and the narrowed non-motor vehicle lanes often become temporary parking places for motor vehicles and non-motor vehicles, which take up the most space in the non-motor vehicle lanes, forcing non-motor vehicles to turn to drive on motor vehicle lanes frequently, thus increasing the risk of road traffic accidents. In the case of heavy traffic, many pedestrians pay more attention to the traffic flow environment, and it is often near the road steps that they suddenly discover the existence of the steps, increasing their likelihood of falling.
Delivery/takeaway workers need to be paid more attention to in the future. With the rapid development of the delivery industry, more and more people favor takeaways. As the main gathering place for universities, business districts and SOHO offices, the vicinity of Wudaokou Research Road resembles an amalgam of several traffic hubs for takeaway transportation. More and more delivery motorcycles and electric bicycles shuttle through the busy daily traffic. They have a definite time limit, and their performance is closely related to the number of bills received. Therefore, to earn more money, many of them violate traffic rules, such as speeding, retrograde motion and running a red light. Even when they are not working, random parking is often seen in non-motor vehicle lanes on the roadside, which may further lead to the retrograde motion of other road users. The proper solution to this problem needs to be considered from a systematic point of view, involving the cooperation of the government, merchants, users and riders from all walks of life.
Appropriate publicity and mandatory requirements are necessary measures to improve traffic safety. Following the present PCM analysis, the study found that it was very common for people to play on mobile phones while riding and while walking, which also caused great interference with other road users. These are phubbers, which are becoming more and more popular nowadays with the rapid development of mobile technologies. Phubbers, staring at their screens, wearing earbuds or headphones, tend to be indifferent to the approaching dangers. Some motor vehicles turn without using a turn signal, which will cause a certain risk to other road users when passing through intersections. Most motorcycles and electric cars do not regularly use turn signals. The existence of police officers at the intersection near the subway and the intersection near the southeast gate of Tsinghua plays a significant role in regulating the behavior of road users and reducing the unstable factors causing traffic risks.
It is necessary to analyze the actual behavior of vulnerable road users and the expected behaviors in terms of observing traffic rules and regulations from a systematic point of view to understand and consider their violations. In the analysis of many problems, such as parking, running a red light, delivery vehicles and moving backward, we often attribute them to people’s mistakes due to not following the rules. In fact, we should pay more attention to the motivation behind them by means of PCM analysis, and we need to use systematic analysis thinking.
Slow speed is an important reason for the low incidence of traffic accidents in Wudaokou. Speed has an important influence on the traffic accident rate and fatality rate [
3]. Traffic saturation in Wudaokou is high. Given this, a reduction in speed has a great influence on the incidence of traffic accidents. In other words, when the traffic saturation is greater than 0.5, the incident rate is negatively correlated with the traffic volume. When the traffic volume increases, the frequency of overtaking decreases. For every 1% increase in the average vehicle speed, the risk of a fatal collision increases by 4%, and the risk of accidents resulting in injury increases by 3%. Low speed guarantees safe travel.
In sum, the present work conducted relevant experiments by employing three groups of road users: pedestrians, cyclists and E-cyclists. From their perspectives, we were able to examine their thoughts and attitudes toward the different factors encountered while using the road in Wudaokou by transcribing their words while thinking aloud during their trips in or around the Wudaokou district, which is a central business and education district. From the viewpoints of real road users, the real problems and potential dangers for vulnerable road users were identified accordingly. The present work determined three main influencing factors. First, the traffic disturbance behaviors of other road participants increased the risk of accidents. Second, the imperfections of the traffic infrastructure were also a major cause. As is known, takeaway delivery services and co-sharing bikes are products of modern innovations that were introduced much later than the urban infrastructure. Therefore, infrastructure must keep up with the pace of development. The third factor was a social phenomenon, namely, phubbers. Since the invention of smartphones, this has always been a concerning issue regarding not only human well-being but also traffic accidents. Solutions can be found in the promotion and redesign of city infrastructures according to the present research results.
5. Conclusions
5.1. Summary of the Findings
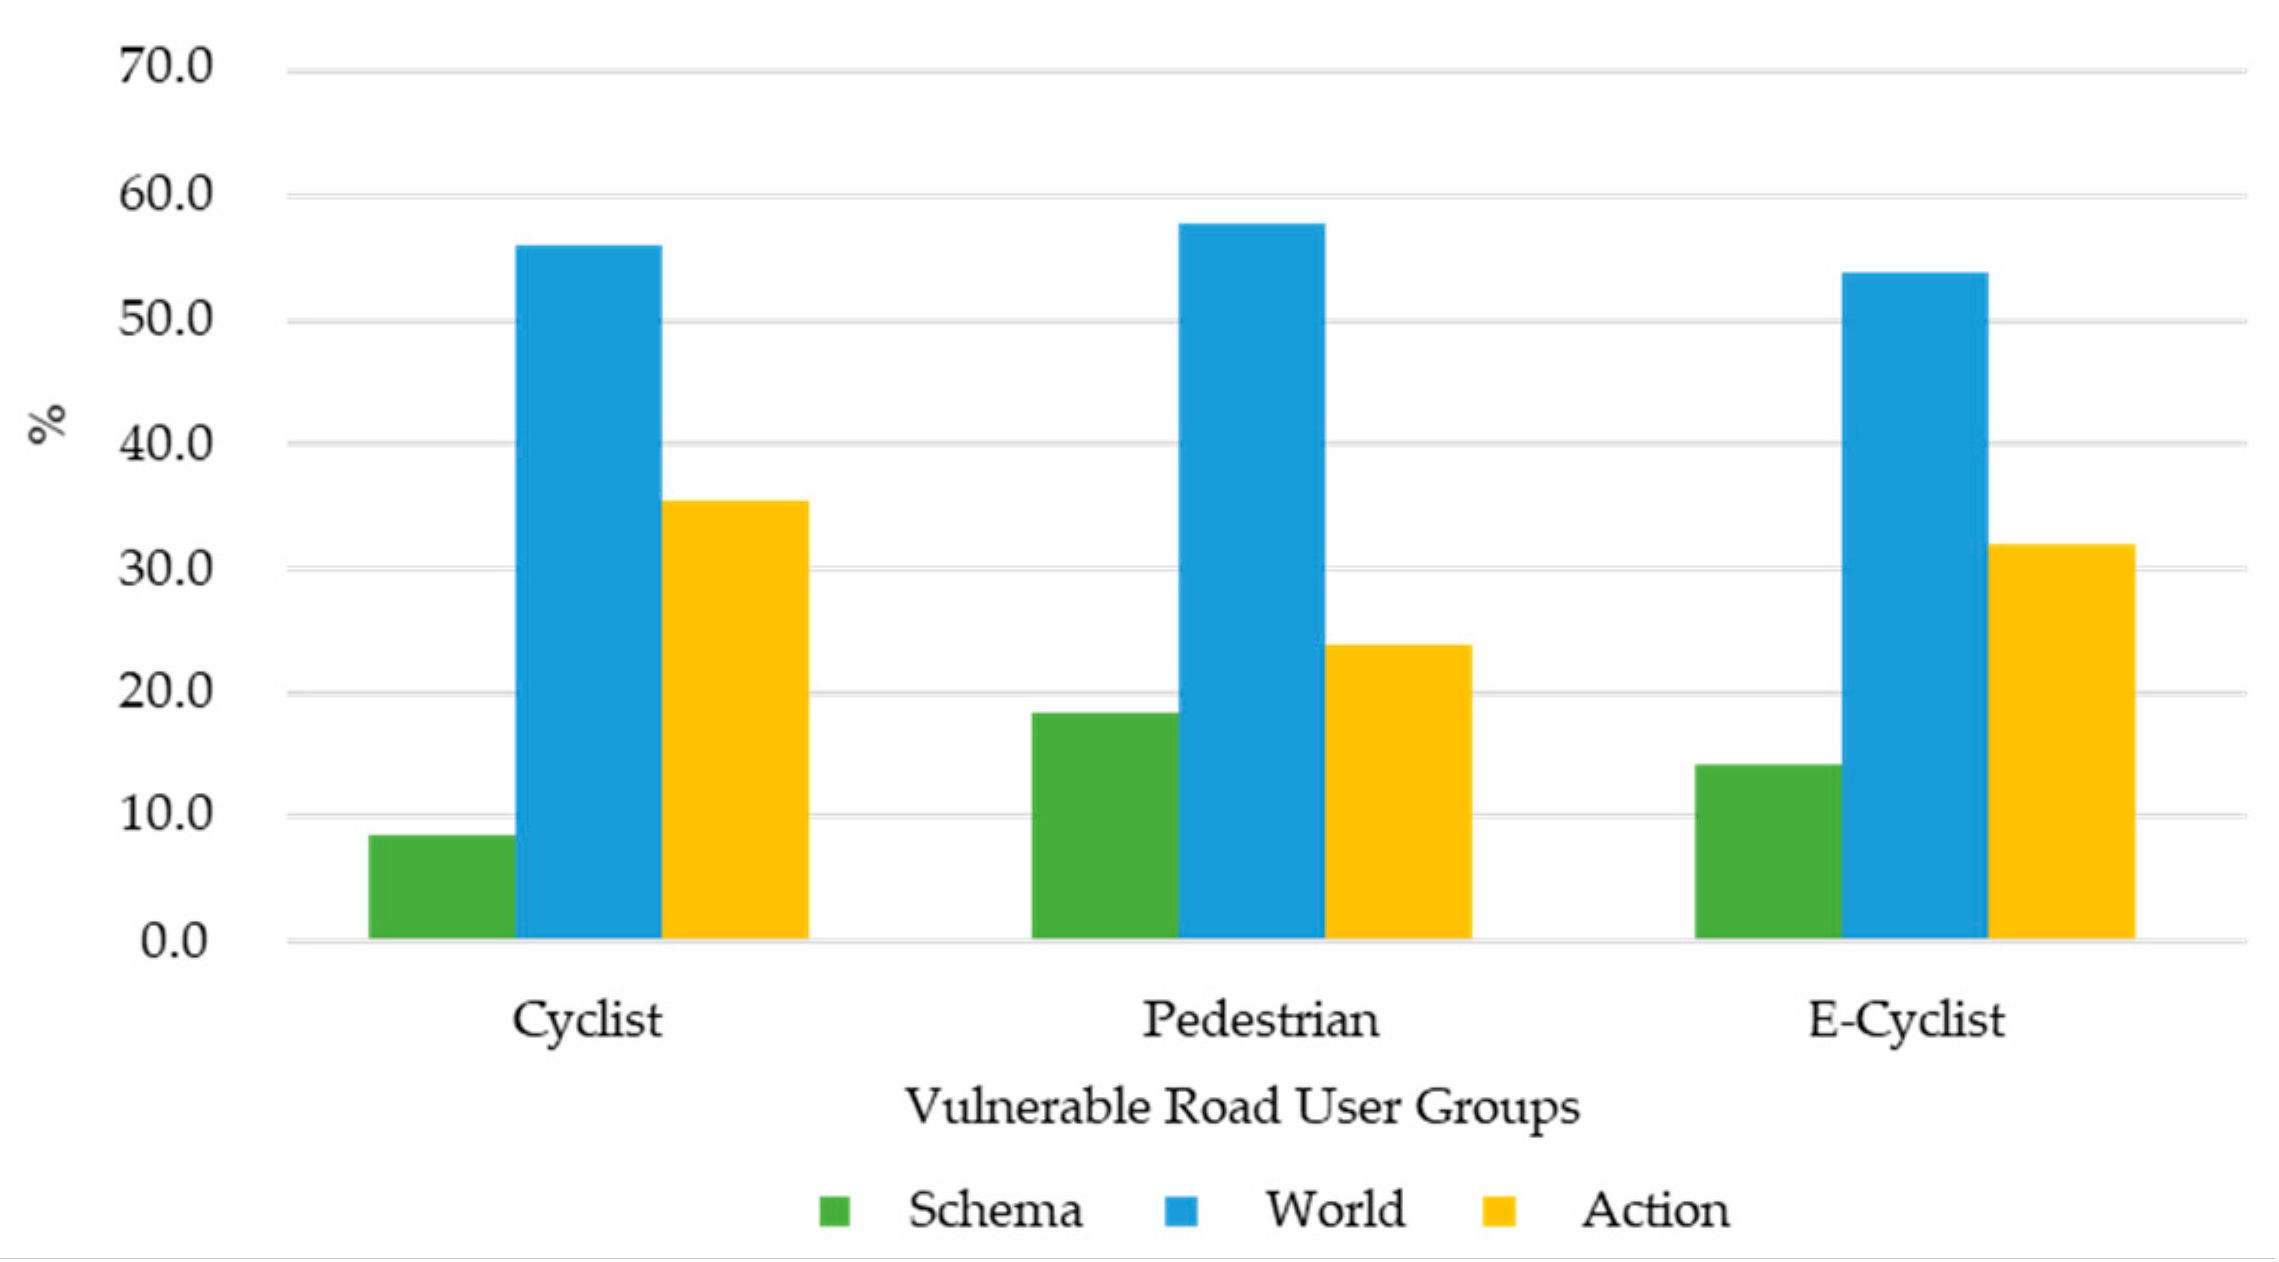
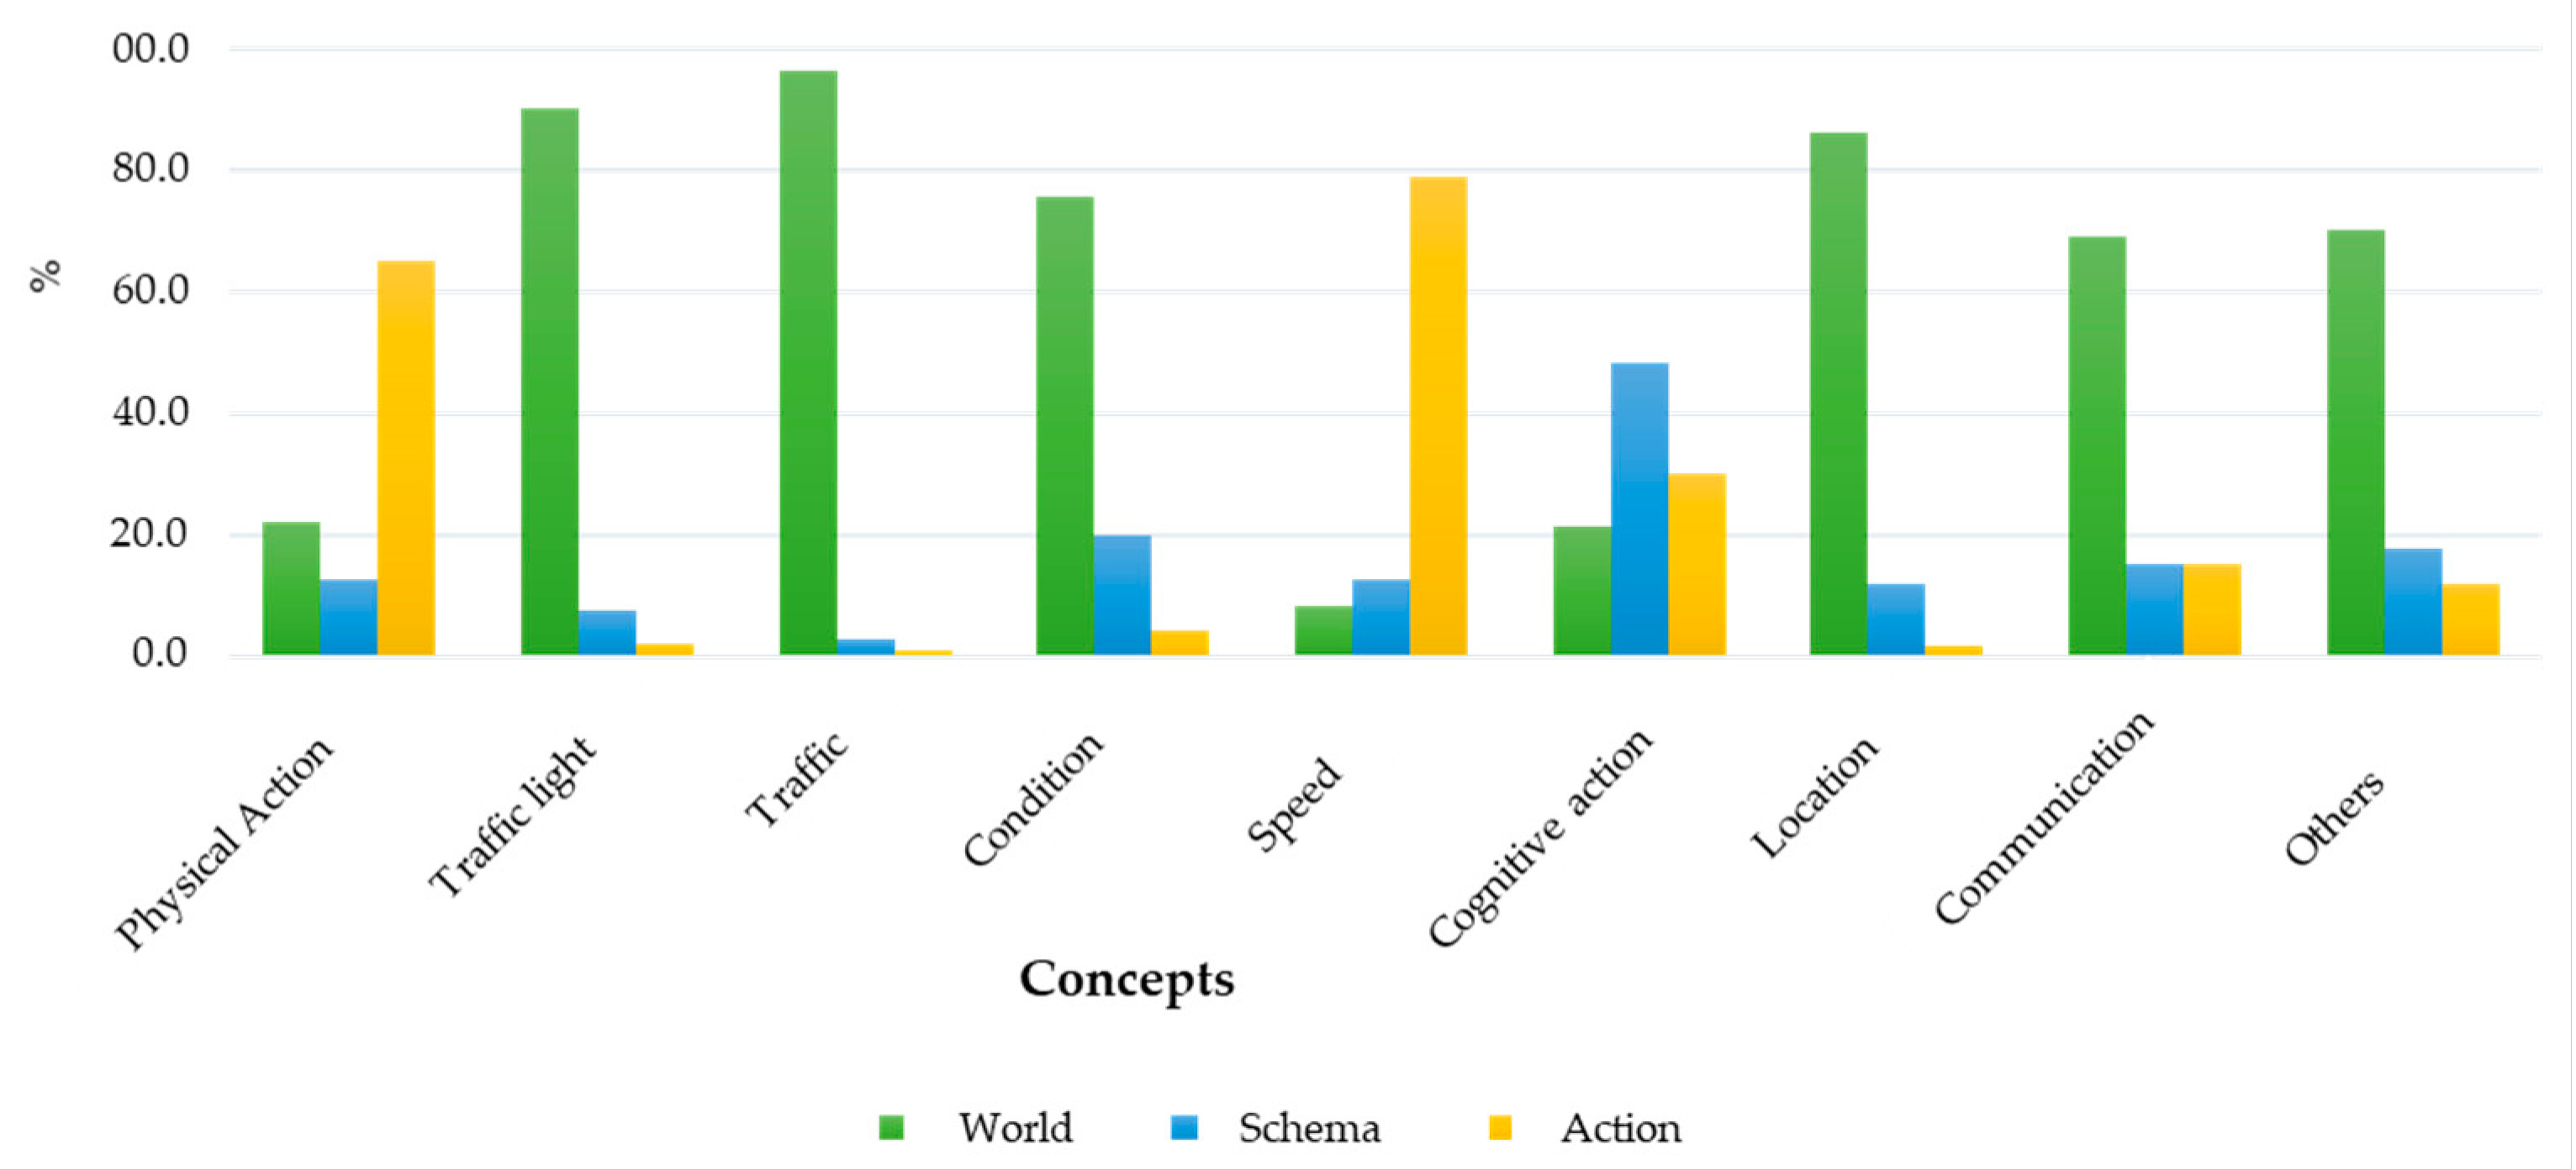
This study used the PCM model to investigate the environmental perceptions, schemata and action processes of pedestrians, cyclists and E-cyclists in the Wudaokou area through the oral report analysis method to analyze the current situation of road traffic safety and the improvements that can be focused on in the future. Through sorting and coding the oral report contents of 30 respondents according to the world, schema and action, a chart was drawn. The proportions of world segments, schema segments and action segments among the different road traffic participants were similar, and there were far more statements about the world than about schemas and actions, which indicated that the existence of automatic cognition and behavior can lead to incorrect decisions as long as conscious attention is lacking. In the Wudaokou area, the traffic flow is busy due to factors such as developed commerce, numerous universities, and the proximity to subway station entrances and exits. Sometimes, unconscious decisions and behaviors may lead to insufficient perceptions of the real situation in the environment, or the incorrect identification of environmental characteristics, resulting in traffic accidents.
At present, there are many violations of traffic rules, and the behaviors of all types of road traffic participants are influenced by the environment and by experience. The oral reports collected in the present research showed that many road traffic participants habitually violated traffic rules, such as retrograde motion, running red lights and carrying people on electric bicycles. At present, takeaway vehicles and bike sharing do bring convenience to life, on the one hand, but the illegal parking of vehicles, on the other hand, has also increased, forcing pedestrians and non-motor vehicles to temporarily occupy other lanes, increasing the risk of accidents. In the design of road networks, it is necessary to take into account the decisions and behaviors of all types of road traffic participants, improve our understanding through PCM analysis and research, minimize the risk of road safety accidents and put forward intervention measures to promote the awareness of compatibility among different road users. The results can provide a reference for road design, traffic management and traffic accident prevention from the perspective of actual vulnerable road users, better focusing on practical needs.
5.2. Limitations and Future Scope of Study
The translation may have influenced the overall analysis. For the translation, we relied on the assistance of two undergraduates fluent in English. They managed to translate all paragraphs from Chinese to English. During the text analysis phase, we made some adjustments, such as changing “bikes” to “bicycles”, to maintain consistency among all documents. (1) From the perspective of all Chinese collaborators, the translation was correct. We attempted to translate the English version back to Chinese and adjusted the paragraphs based on a one-to-one correspondence. The factor of word choices exerted a great influence on this work. (2) We tried to be as accurate as possible in the translation, but we believe that there are still some parts that need additional consideration. The subject factors caused by translation could have undermined the accuracy of this analysis model.
The limitations of the present study lay in two aspects. First, the participants were limited to a group of young Chinese individuals. Although their educational backgrounds and living conditions were similar, this group still could not cover all types of participants in the Wudaokou area’s traffic network and conditions. Second, the search methods were largely quantitative, and few qualitative methods were used. The analysis of the participants’ oral reports lacked close reasoning due to the length limit of the present study.
For future studies, from the perspective of the participants, comparisons can be made between the performance of individuals with different degrees of familiarity with the road environment. Comparisons between experienced and novice cyclists or E-cyclists could bring a further understanding of how to reduce the probability of users being involved in accidents. There was research on the differences in the eye movement of experienced and novice drivers, which could reveal what people notice when driving that could help them the most in avoiding accidents. More cognitive methods similar to think-aloud and eye movements can be employed to study road users’ behavior with a broader view. More analysis can also be explored in the future for the collected video and other data.


 ,
, 


