
Analysis of Consumer Willingness to Pay for Community Solar Business Using Contingent Valuation Method


1
Korea Institute of Ocean Science and Technology, 385, Haeyang-ro, Yeongdo-gu, Busan 49111, Republic of Korea
2
Korea Energy Economics Institute, 405-11, Jongga-ro, Jung-Gu, Ulsan 44543, Republic of Korea
3
School of Business, Pusan National University, 2, Busan Daehak-ro 63beon-gil, Geumjeong-gu, Busan 46241, Republic of Korea
*
Authors to whom correspondence should be addressed.
Sustainability 2023, 15(6), 5029; https://doi.org/10.3390/su15065029
Submission received: 21 February 2023
/
Revised: 6 March 2023
/
Accepted: 8 March 2023
/
Published: 12 March 2023
(This article belongs to the Special Issue Perspectives on Community Engagement in Energy Transition)
Abstract
:Electricity production using renewable energy instead of fossil-fuel-based energy sources has been expanding worldwide. Recently, the South Korean government has set a transition from a government and power company-led energy system to a public-participatory energy system as a basic policy direction in terms of power production. It has been actively providing budgetary and institutional support. A comprehensive understanding of the consumer (public)-oriented preferences of potential business participants is crucial for implementing a successful community solar business. This study analyzes the preferences of potential participants in the community solar business from the perspective of policymakers to derive policy implications. We used the contingent valuation method of the stated preference approach targeting potential participants (public) to create a hypothetical market for community solar businesses and measured the value by inducing survey respondents to trade for goods or services. The monthly average willingness-to-pay was estimated to be 25,572 won (USD 21.90), and gender, photovoltaic business experience, and income were the main influencing factors. Based on the results of this study, the preferences of potential consumers in South Korea were analyzed to contribute to the effectiveness of the national energy policy.
1. Introduction
Economic, environmental, and social costs are increasing worldwide because of energy production using fossil fuel combustion. The concentration of greenhouse gases, such as CO2, in the Earth's atmosphere, has increased owing to the increase in greenhouse gas emissions. This has led to many changes in the climate crisis caused by global warming.
The CO2 emissions from fossil fuel combustion and industrial processes reached the highest annual level of 36.3 Gt in 2021, an increase of 6% compared with 2020. Despite the decline in energy demand owing to the COVID-19 pandemic and the largest growth in renewable energy production, coal-borne CO2 emissions are at an all-time high, and greenhouse gas emissions are increasing [1].
Climate change has increased the global average temperature by approximately 1.11 ± 0.13 °C from the pre-industrial average since 2021, and the global average sea level has increased by 4.5 mm, the highest ever recorded [2].
Supercritical CO2 (scCO2, the social cost of carbon dioxide), an indicator of economic damage caused by climate change, refers to the social cost incurred for 1 ton of CO2 emissions. It is estimated to be between USD 158 and USD 307, which means that carbon emissions result in enormous socioeconomic damage [3].
The Paris Agreement—a legally binding international treaty on climate change that took place in Paris in December 2015—commenced in November 2016. Accordingly, parties to the United Nations (UN) climate change conference are striving to achieve carbon neutrality: they have submitted climate action plans by 2020 and established Nationally Determined Contributions (NDC) [4]. According to the Secretariat of the UN Framework Convention on Climate Change (Secretariat, UNFCCC, 2021), 193 UN member states have submitted the NDC and established and implemented greenhouse gas emission reduction goals and policies as of September 2022 [5].
While the world is reducing the use of fossil fuels and expanding the production of renewable energy to achieve carbon neutrality by 2050, the International Energy Agency [6] has argued that 630 GW of new solar photovoltaic (PV) facilities (which is four times the size of that in 2020) should be built by 2030 to achieve carbon neutrality. It is forecasted that by 2050, global energy demand will decline by 8%; however, the size of the economy will more than double, and renewable energy will account for 90% of power generation. Particularly, PV and wind energy are expected to account for 70% of total energy consumption. Hence, numerous countries are increasing the proportion of alternative energy sources to satisfy the growing energy demand and achieve energy independence, a stable energy supply, and greenhouse gas reduction. Particularly, electricity production using renewable energy sources, such as PV, wind, and bio-energy, is gaining prominence. The South Korean government also established a carbon neutrality strategy in 2020 as part of its efforts to reduce dependence on fossil fuels and accelerate the transition to renewable energy [7].
New global renewable energy capacity is expected to increase from 350 GW in 2020 to 400 GW in 2027, with PV and wind energy accounting for 90% of renewable energy [8]. Governments worldwide are continuously implementing decarbonization policies and actively supporting the transition to renewable energy. The public is encouraged to participate directly in the production of renewable energy, a shift from the government and power company-centered electricity production and supply.
However, communities participating in renewable energy businesses may lack awareness from the standpoint of the public, the main stakeholders of the business. Owing to the nature of the business, limitations exist in establishing policies because of the non-market valuation. In this context, this study presents quantitative values and influential factors to prepare preliminary data for the establishment of national policies. Regarding non-market valuation, it is imperative to estimate the economic values of non-marketed goods that are useful for providing goods and services to people, although their prices cannot be verified because they are not traded along with private goods, whose prices have been formed in the current market.
The contingent valuation method (CVM) is a typical method for estimating the economic value of non-marketed goods [9,10]. It is a stated preference-based method that estimates the values of non-marketed goods by providing a hypothetical setting for the non-marketed goods to the survey participants and asking about the monetary amount they are willing to pay for them.
This study estimates the amount people are willing to pay for the community solar business in South Korea using the CVM, considering demographic and social characteristics. Community solar business refers to a mechanism in which community members (subscribers) voluntarily bear a certain cost and share the profit by offsetting the electricity produced from the subscribers’ electricity bills as part of the solar business sharing program. In this business, the financial gain from a single solar PV array is exclusively distributed to subscribers [11].
Global research is being conducted, led by governments, using the aforementioned CVM to estimate the non-market value of renewable energy. The survey methods include the face-to-face and online survey methods using e-mail, and the estimation models used include the logit, probit, and Tobit models.
While examining studies by continent, we found that, in the case of Europe, researchers such as Zografakis et al. (2010), Paravantis (2018), and Ntanos et al. (2018) estimated the value of renewable energy in Greece [12,13,14]; Claudy et al. (2011) in Ireland [15]; Bollino (2009) in Italy [16]; Kowalska-Pyzalska (2019) in Poland [17]; Botelho et al. (2016) in Portugal [18]; Dogan and Muhammad (2019) and Muhammad et al. (2021) in Turkey [19,20]; and Batley et al. (2000) and Akcura (2015) in the UK [21,22]. On the American continent, Whitehead et al. (2007) and Gracia et al. (2011) estimated the value of targeting people in the US [23,24]. On the African continent, Entele (2020) estimated the values in Ethiopia; Abdullah and Jeanty (2011) in Kenya [25,26]; Ayodele et al. (2021) and Adeleke et al. (2022) in Nigeria [27,28]. Nomura and Akai (2004) estimated the value of renewable energy in Japan [29]; Zhang and Wu (2012), Guo et al. (2014), and Jin et al. (2019) in China [30,31,32]; Han et al. (2020) in Myanmar; and Yu et al. (2022) in Vietnam [33,34].
In South Korea, Yoo and Kwak (2009), Kim et al. (2012), Kim et al. (2013), Huh et al. (2015), Lee and Heo (2016), Park et al. (2016), Woo et al. (2018, 2019), and Kim et al. (2020) have used the CVM to estimate the willingness-to-pay (WTP) for renewable energy [35,36,37,38,39,40,41,42,43].
This study makes three marginal contributions compared with previous studies. First, whereas previous studies have estimated WTP for all renewable energy sources or for a specific renewable energy source, this study estimates the WTP for the recently emerging community solar business, which is the first time, to the best of our knowledge, that this analysis has been attempted. Second, although this study estimates the WTP for community solar in South Korea, its analysis results will have meaningful implications for policies in many countries that consider the adoption of community solar businesses. For example, in the United States, community solar facilities (in 39 states and Washington, DC, USA) with a scale of 3253 MW are installed, and community energy facilities (wind and solar) are also expanding in European countries such as Germany, the Netherlands, Scotland, and Belgium [11,44,45,46]. Third, policy implications were derived to expand the community solar business by considering the personal characteristic variables that affect the community solar WTP.
The remainder of this paper is organized as follows. Section 2 reviews previous studies that estimated the WTP of consumers using the CVM for renewable energy. Section 3 explores methods of estimating the WTP of potential consumers for the community solar business in South Korea by considering the research methods of previous studies. Section 4 employs the survey response results and the CVM to estimate the WTP with Model 1 (without covariates) and Model 2 (considering covariates). Section 5 concludes the paper and discusses the implications.
2. Literature Review
The methodologies of CVM and selective experimental methods are mainly used for non-market valuation. In this study, we used the CVM to perform the analysis based on studies that estimated the WTP of potential consumers for renewable energy. Previous studies using CVM were mainly performed by estimating the WTP for all renewable energy or for specific renewable energy sources. Studies on the estimation of consumers’ WTP using CVM for renewable energy (including green energy) can be classified based on the target region, estimation model, survey type, and survey method.
CVM is widely used in the evaluation of various non-market value products; however, it has limitations in terms of its effectiveness and reliability. Consequently, in reviewing research papers that estimated the WTP for renewable energy, we have found that most studies have been conducted mainly in developed countries [47], and in recent years, research has been actively conducted in Africa and Southeast Asia [25,27,28,33].
Gracia et al. (2011) estimated that the WTP for electricity generated by renewable energy in the US was 5.77–10.00 USD/month, and WTP for North Carolina’s green energy program was 4.24 USD/household/month and 51.00 USD/year [23,24]. Batley et al. (2000) estimated that the WTP for renewable energy in the UK was 7.93 USD/month [21]. Zografakis et al. (2010) and Zoric and Hrovatin (2012) estimated the WTP for renewable energy in Greece and Slovenia to be 5.13 USD/month and 6.15 USD/month, respectively [12,48]. Notably, Nomura and Akai (2004) estimated that the WTP for renewable energy in Japan was 17.00 USD/month, which was relatively high, whereas Zhang and Wu (2012) estimated the WTP for renewable energy in China at 1.15–1.51 USD/month [29,30].
We reviewed studies on WTP estimation for renewable energy using CVM by country divided by continent. First, in the case of Europe, the WTP for additional electricity bills for renewable energy sources in Italy has been estimated by classifying it based on household distribution. The results revealed EUR 9.11/two months in a normal distribution, 8.85 EUR/two months in log-normal distribution, and 6.07 EUR/two months in a Gumbel distribution [16].
The payment methods of people in the UK for renewable energy were divided into the voluntary payment method and the compulsory payment method to analyze WTP, which indicated that WTP was higher in the compulsory payment method than in the voluntary payment method [22].
Consequent to estimating the WTP for renewable energy in Greece based on principal component, cluster, and regression analyses, it was found that age, family size, and awareness of renewable energy were related to actual WTP for electricity bills, while income and the impact of renewable energy projects affected WTP [13]. Conversely, it was found that people were willing to pay an additional EUR 26.50 per quarterly electricity bill for renewable energy [14].
In Turkey, environmental awareness, membership in environmental organizations, age, education level, gender, and household income were effective factors, and the WTP per household was estimated at approximately 1.00 USD/month [19]. Furthermore, upon estimating the WTP of people in Turkey for green electricity using one-way ANOVA, it was found that they were willing to pay USD 0.49 every month to achieve a 30% proportion of renewable energy in energy production [23]. The estimated WTP of Polish people for renewable energy was found to be 3.50 USD/month [17]. In the case of Africa, the WTP for grid electricity (GE) and PV electricity in Kenya’s Kisumu region were estimated. It was found that the WTP was higher for GE services than for PV: the estimated WTP was Ksh840/month (USD 6.84) for GE and Ksh660/month (USD 5.38) for PV [26]. In Ethiopia, WTP values for GE and PV electricity were estimated. Income level, education level, age, and region were important variables, and the WTP was estimated at USD 3.00/month for GE and 0.45 USD/month for PV electricity based on monthly installments [25].
Consequent to estimating the WTP for renewable energy targeting urban people in Ibadan, Nigeria, it was found that income, age, marital status, and education level were the main influential variables, and the WTP was estimated at 0.014 USD/kWh [27]. The analysis of the WTP of people in the southwestern region of Nigeria for renewable energy technology showed that age, marital status, education level, household size, region, income, and awareness of renewable energy were factors affecting WTP [28].
In Asia, the WTP of people in Beijing, China, for PV was estimated at 0.86 USD /month per household [32]. The additional WTP for the R&D support for PV in Myanmar was estimated at 1.00 USD/month per household and was affected by demographic characteristics such as education level, income size, and region [33]. In a survey in Ho Chi Minh, Vietnam, WTP for renewable energy was estimated at 4.39 USD/month, and the awareness level of air quality was an important factor [34].
In South Korea, renewable energy policies were divided into three categories to estimate the WTP for renewable energy. The estimated results were 3287.5 KRW/month based on the Renewable Portfolio Standard, 4432.9 KRW/month based on Renewable Fuel Standard, and 3971.1 KRW/month based on the Renewable Heat Obligation [38]. Upon estimating WTP using the CVM for renewables, it was found that people were willing to pay an additional 3.21 USD/month [39]. Another study estimated the WTP of consumers for renewable energy, which was found to be 85.00 USD/month [40]. It was also estimated that people were willing to pay an additional 1.80 USD/month for the transition from nuclear power generation to other energy sources [41].
In another study, the entire population and local residents were classified to estimate their WTP for renewable energy projects. In the case of the general public, the expected return was 3.1%/year for PV, 5.4%/year for wind power generation, and 7.1%/year for biomass power generation; in the case of local residents, it was 12.3%/year for PV, 9.1% for wind power generation, and 10.8% for biomass power generation [42]. The result of estimating WTP for renewable energy recently through the spike model was 0.05 USD/kWh [43].
Summing up previous studies, we found that WTP was estimated based on the face-to-face method and online survey method using e-mail, double-bounded dichotomous choice method, single-bounded dichotomous choice method, and open-ended questionnaires in terms of survey types. The single bounded dichotomous choice (SBDC) is a method of asking whether or not to support a bid amount. The double-bounded dichotomous choice (DBDC) is a method of asking two dichotomous questions to improve the efficiency of WTP estimation [10]. Furthermore, the logit, probit, and Tobit models were used as the estimation models. As for the survey targets, 201–2500 people were surveyed in the face-to-face surveys, whereas 304–2000 people were surveyed in the online surveys, thus showing no clear difference between the face-to-face and online survey types.
As reported above, the WTP for renewable energy varies significantly by country and renewable energy sources. WTP for renewable energy is significant because it is generally highly related to acceptance. Furthermore, this study is the first of its kind to be conducted in South Korea.
This study differs from previous studies in that it estimates WTP based on the public participatory community solar business of renewable energy. Therefore, it can contribute to evaluating the economic value of the community solar business as a whole and, simultaneously, designing a community solar business that can maximize the utility of potential participants. Table 1 presents a review of the previous studies.
In summary, previous studies have estimated the WTP for all renewable energy sources or for each renewable energy source. However, this study estimates WTP considering the covariates from the institutional perspective of community solar, which has recently emerged. This has significant implications for countries seeking to adopt or vitalize community solar businesses and contribute to policy decision-making.
3. Methodology
A comprehensive evaluation of the use and existence value of public goods, such as environmental goods, can be performed using a survey method [50]. Here, the CVM is most widely used, which is a method of providing a hypothetical new situation based on the current situation and enquiring regarding WTP. It is also widely used in the valuation of renewable energy.
CVM has the advantage of being able to directly calculate the Hicksian welfare concepts of equivalent and compensating surplus through survey responses without deriving general hypotheses or demand functions. However, it should be used carefully with appropriate criteria when estimating WTP. In empirical studies of CVM, the dichotomous choice question method is usually employed. It has also been employed in this study.
The respondent’s indirect utility function comprises deterministic and stochastic parts, as shown below:
In the above equation, m denotes the respondent's income variable, and S denotes the respondent's personal characteristic variable. j denotes the status of participation in the community solar business: indicates non-participation, and indicates participation.
The stochastic part is independent of j, which has a mean of zero and the same distribution. CVM applies the random utility maximization theory to model the choices of individuals. In the CVM, when the amount offered to the respondent is A, the respondent compares their WTP for community solar power and the bid amount A. If the respondent’s WTP is larger, they answer “Yes,” and if it is smaller, they answer “No,” thus maximizing the respondent’s utility. If the respondent answers “Yes,” they will participate in the community solar business, in which case the utility function is . The indirect utility function containing the error term is summarized as follows:
In the above equation, if the cumulative distribution function (CDF) of η is expressed as , the probability that the respondent will answer “Yes” is the same as the following equation:
In the above equation, if , then the answer can be assumed to be “No.” However, if WTP is expressed as W, the CDF of the stochastic variable W is expressed as . Therefore, the probability that the respondent will answer “Yes” to the initial bid amount for the community solar business can be expressed as follows:
As Equations (3) and (4) are the same, the following equation holds:
As W, which represents WTP, can have a negative value (if W is negative, it is the marginal willingness to accept), the mean of W can be calculated by integrating Equation (5). If the mean of W is expressed as , then can be derived using the following equation:
If the median WTP is expressed as , the CDF value is 0.5. Therefore, the following equation holds:
Depending on the situation, it may be necessary to apply the condition that WTP is positive. Here, if the mean WTP is expressed as , then can be calculated using the following equation:
Hanemann (1991) suggested a double-bounded model theory for CVM. First, the initial bid amount of the i-th respondent is defined as , the second-highest bid amount as , and the second-lowest bid amount as . is the amount offered when the respondent answers “Yes” to the initial bid amount, and is the amount offered when the respondent answers “No” to the initial bid amount. Therefore, the following four cases may occur in the double-bounded model [10].
The log-likelihood function of the four response types can be expressed as follows:
Generally, is defined as a logistic CDF. If is combined with the logistic function, the CDF of the WTP is in the following form:
If the mean and median of WTP are calculated using Equation (10), the following equations are derived:
In the above equation (11), it can be observed that the mean and median have the same values. Equation (12) refers to the truncated mean of WTP, which ignores values of less than 0.
4. Empirical Results
4.1. Analysis Results of Descriptive Statistics
In this study, we conducted a survey using the proportional quota sampling method based on residence area, gender, and age in 16 cities and provinces across South Korea. We targeted 1000 male and female adults aged 20 to 69 years to perform CVM for the community solar business. The survey was conducted from 31 August to 7 September 2020 by GRI Research, a survey company. We employed a web-based survey to obtain survey data. The payment amounts provided in the survey were presented along with the average electricity bill to prevent design bias, which may occur because of respondents’ lack of realistic understanding of the payment amount (for example, the average monthly electricity usage and bill for a four-person household were 400 kWh and approximately KRW 55,000 (USD 47.20), respectively (converted at KRW 1166.11/USD 1.00 based on the exchange rate in 2020). As a condition for participating in the community solar business, it was stated in the questionnaire that “It is assumed that you can receive an electricity bill discount benefit of approximately KRW 26,000 (USD 22.30) per month on average if you enter into a contract for 1 kW in the PV business.” The bid amounts were derived using the open-ended question method through a preliminary survey of ten people. Since the distribution of the initial bid amount of CVM has a great effect on the efficiency of coefficient estimation in the binary choice model, a thorough preliminary investigation was conducted. Therefore, based on the average electricity usage and the results of the preliminary survey, five initial bid amounts were determined within the range of 15 to 85% of the WTP distribution.
KRW 22,800 (USD 19.60)/month, KRW 23,900 (USD 20.50)/month, KRW 25,500 (USD 21.90)/month, and KRW 26,000 (USD 22.30)/month were set based on the mean of KRW 24,00 (USD 21.30), and they were randomly offered to the respondents. Furthermore, to control the bias of the non-face-to-face survey method, the respondents were given a schedule that allowed them to understand the information sufficiently (e.g., a logic that prevented them from turning to the next page in less than one minute).
Regarding educational background, it was found that 53.0% of the respondents had four-year university degrees or higher, accounting for the highest proportion, and the majority had a high school diploma or higher degrees (98.3%). Regarding the occupation of the respondents, office/management/professional workers accounted for 43.3%, the highest proportion, followed by homemakers (15.5%) and the self-employed (8.9%). The average monthly personal income distribution was generally evenly distributed across the ten income bands in total (from “less than KRW 1 million (USD 857.60)” to “greater than or equal to KRW 10 million (USD 8575.50)”). The income band of KRW 1.5 million to 2 million (USD 1286.30 to USD 1715.10) accounted for the largest proportion with 20.7%, while the band of KRW 3 million to 4 million (USD 2572.70 to USD 3430.20) accounted for 13.2%, and the band of KRW 2 million to 2.5 million (USD 1715.10 to USD 2143.90) accounted for 12.8%. Regarding the income class, the respondents corresponding to the middle-income class of greater than KRW 1.8 million (USD 1543.60) and less than or equal to KRW 7.7 million (USD 6603.20) per month accounted for 83.7%, the majority, while the low-income class (KRW 1.8 million (USD 1543.60) or less per month) accounted for 10.7%, and the high-income class (greater than KRW 7.7 million (USD 6603.20) per month) accounted for 5.6%. Considering the family size of the respondents, three to four people (61.5%) accounted for the highest proportion, and most respondents answered that the number of household members earning income was one (43.5%) or two (39.5%). Those who answered that the average monthly household income was between KRW 5 million and 7 million (USD 4287.8 to USD 6002.90) accounted for 23.0%, the largest proportion. Table 2 summarizes the composition of the 1000 respondents.
The number of respondents for each bid amount was approximately 200, and the questions were asked to 1000 respondents. As expected, the percentage of “Yes” responses decreased with an increase in the initial bid amount. Table 3 presents the response distribution of respondents to the CVM-based survey. In total, 10% of the respondents were willing to pay twice the first bid amount, and 38% were willing to pay at the level of the first bid. Conversely, 33% of the respondents were willing to pay half of the first bid amount. Regarding the use of electricity produced by renewable energy, 129 people (13% of the total 1, 000 people) indicated that their WTP was zero, indicating their intention to refuse to subscribe.
Consequent to enquiring regarding the reason for not intending to subscribe to the community solar business, it was found that “Not interested” accounted for 45.0%, the highest proportion, followed by “Worried about environmental pollution and ecosystem destruction” (21.7%), “Don’t like the business method for the power generation facility construction/operation” (15.5%), and “Worried about falling house and land prices” (11.6%).
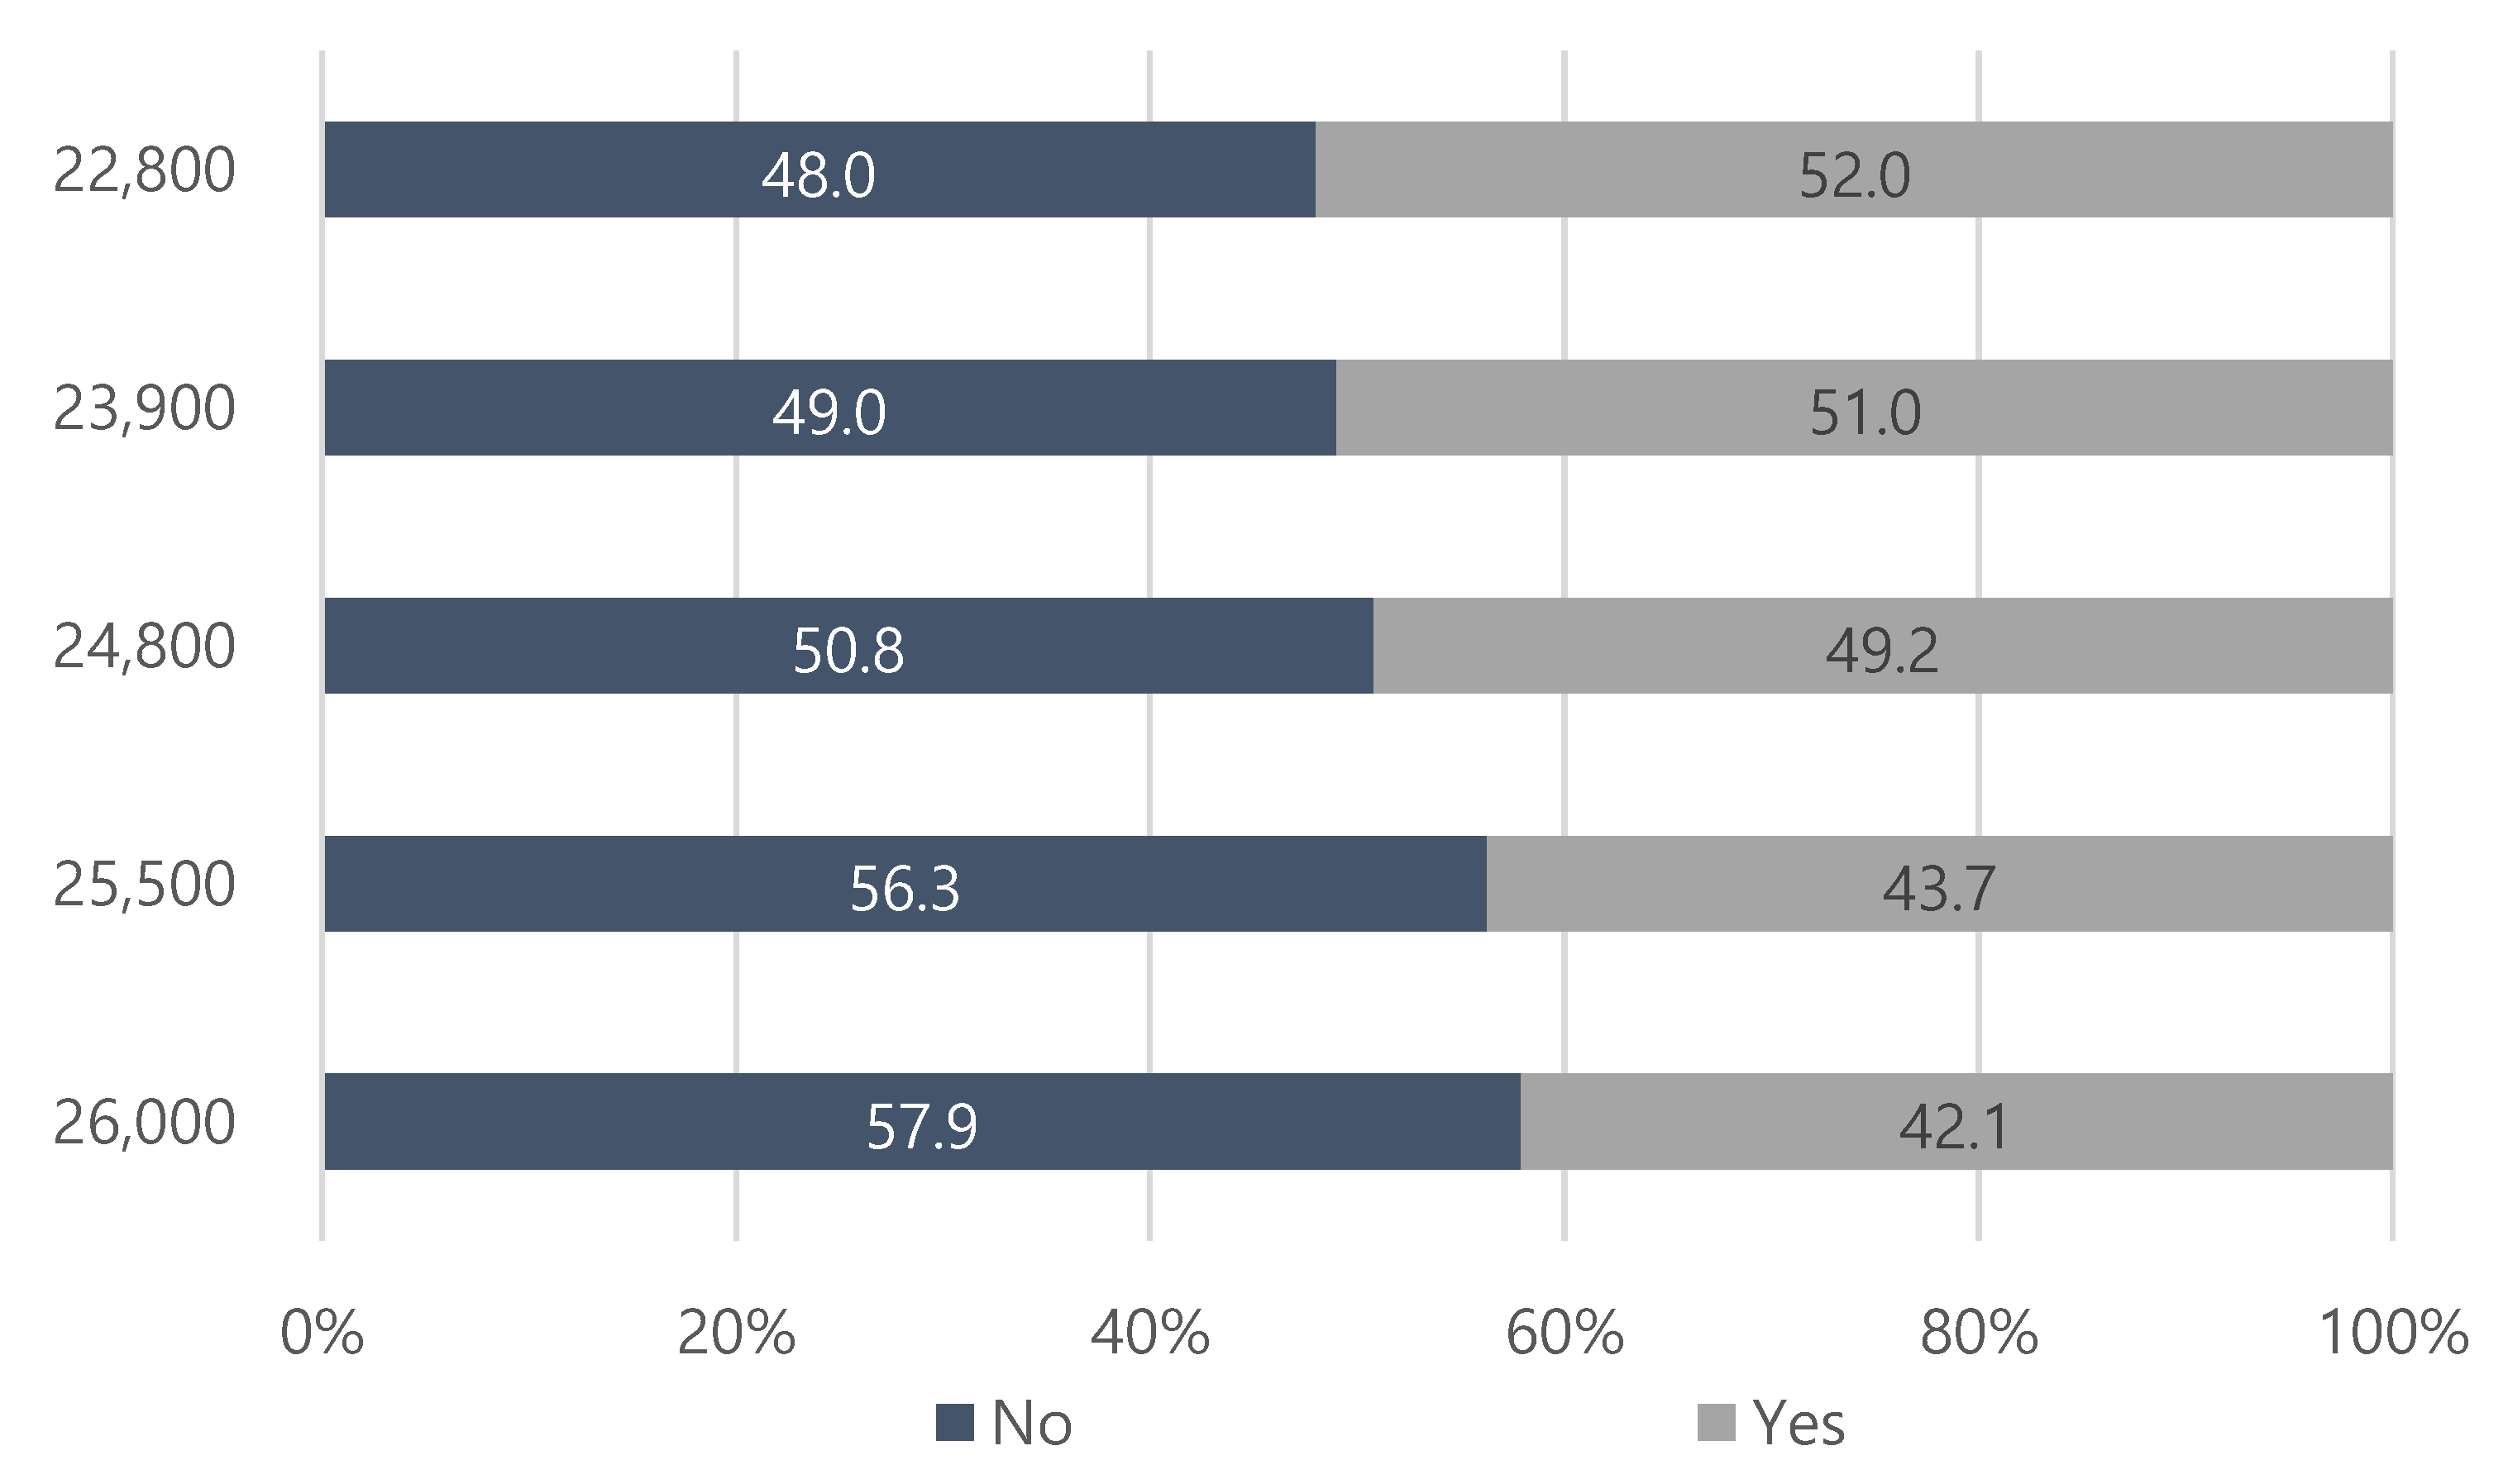
Examining the subscription intention by the first offered amount, we have found that 52.0% answered “Yes” to an initial bid amount of KRW 22,800 (USD 19.60), 51.0% to KRW 23,900 (USD 20.50), 49.2% to KRW 24,800 (USD 21.30), 43.7% to KRW 25,500 (USD 21.90), and 42.1% to KRW 26,000 (USD 22.30) (Figure 1).
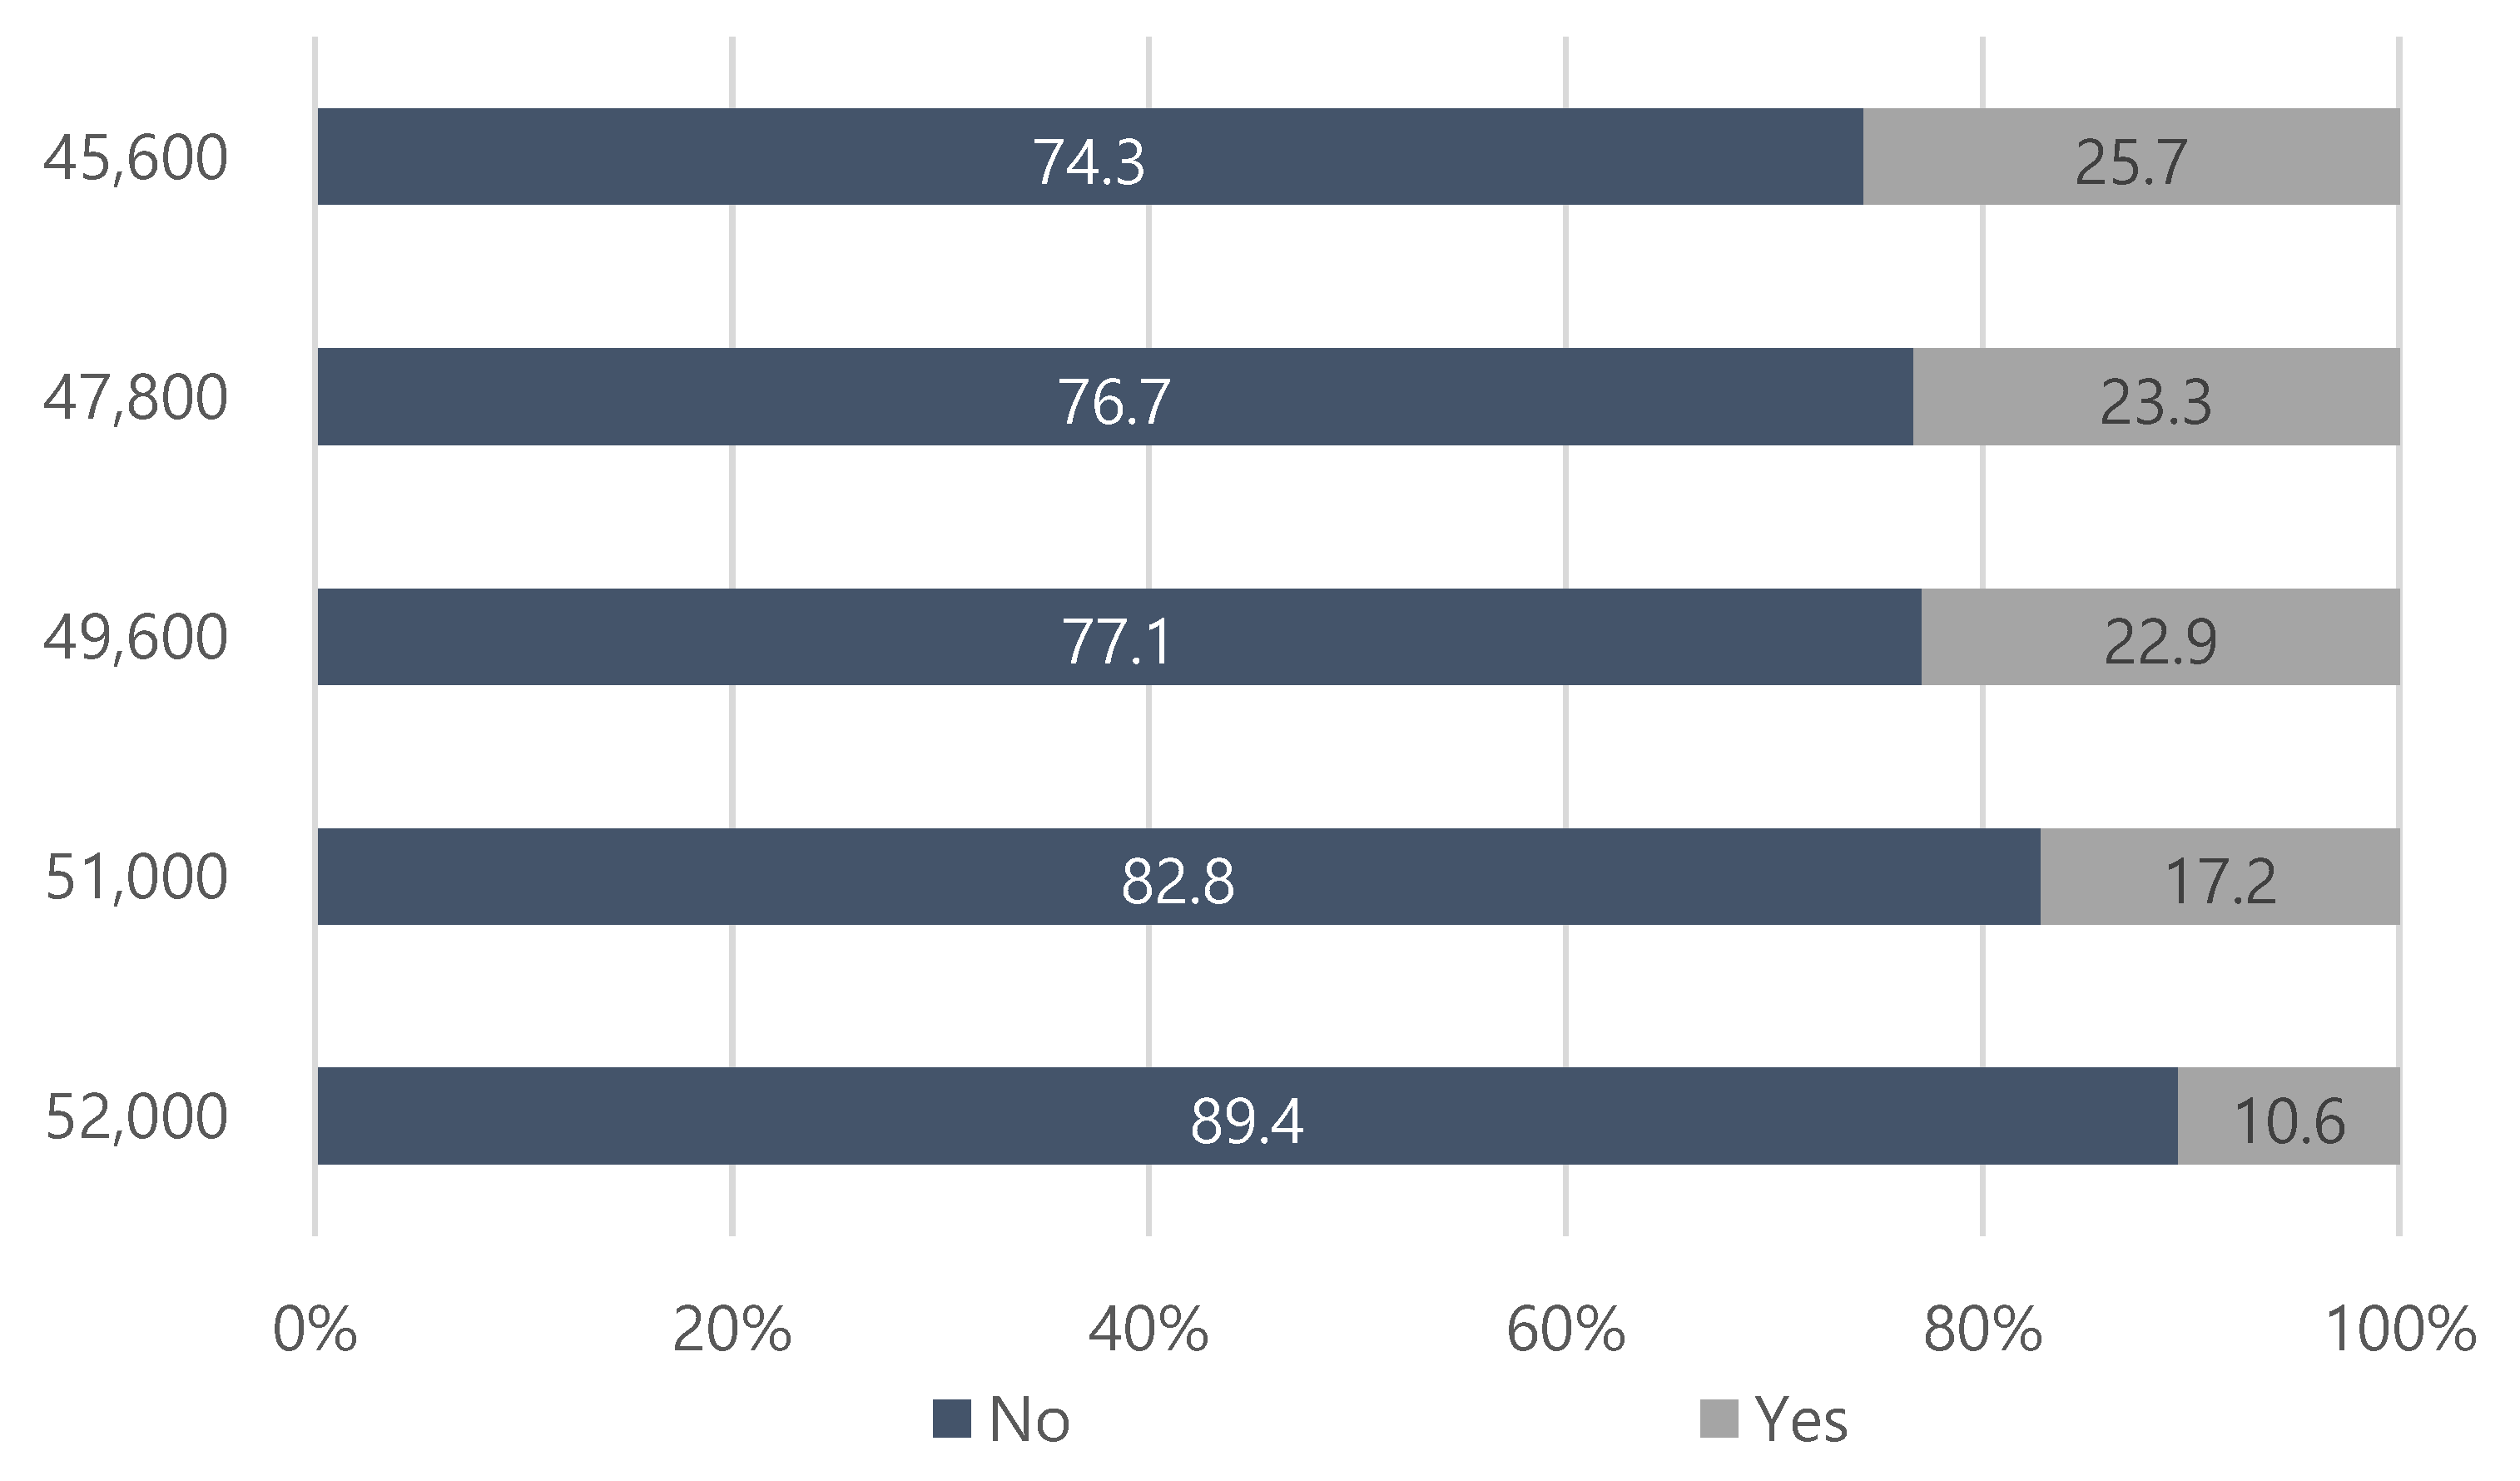
Respondents who showed an intention to subscribe to the initially offered monthly membership fee were offered double the fee if they willingly subscribed. As shown in Figure 2, 25.7% said that they would subscribe to a bid amount of KRW 45,600 (USD 39.10), 23.3% at KRW 47,800 (USD 41.00), 22.9% at KRW 49,600 (USD 42.50), 17.2% at KRW 51,000 (USD 43.70), and 10.6% at KRW 52,000 (USD 44.60), indicating that the lower the offered monthly membership fee, the greater the intention to subscribe.
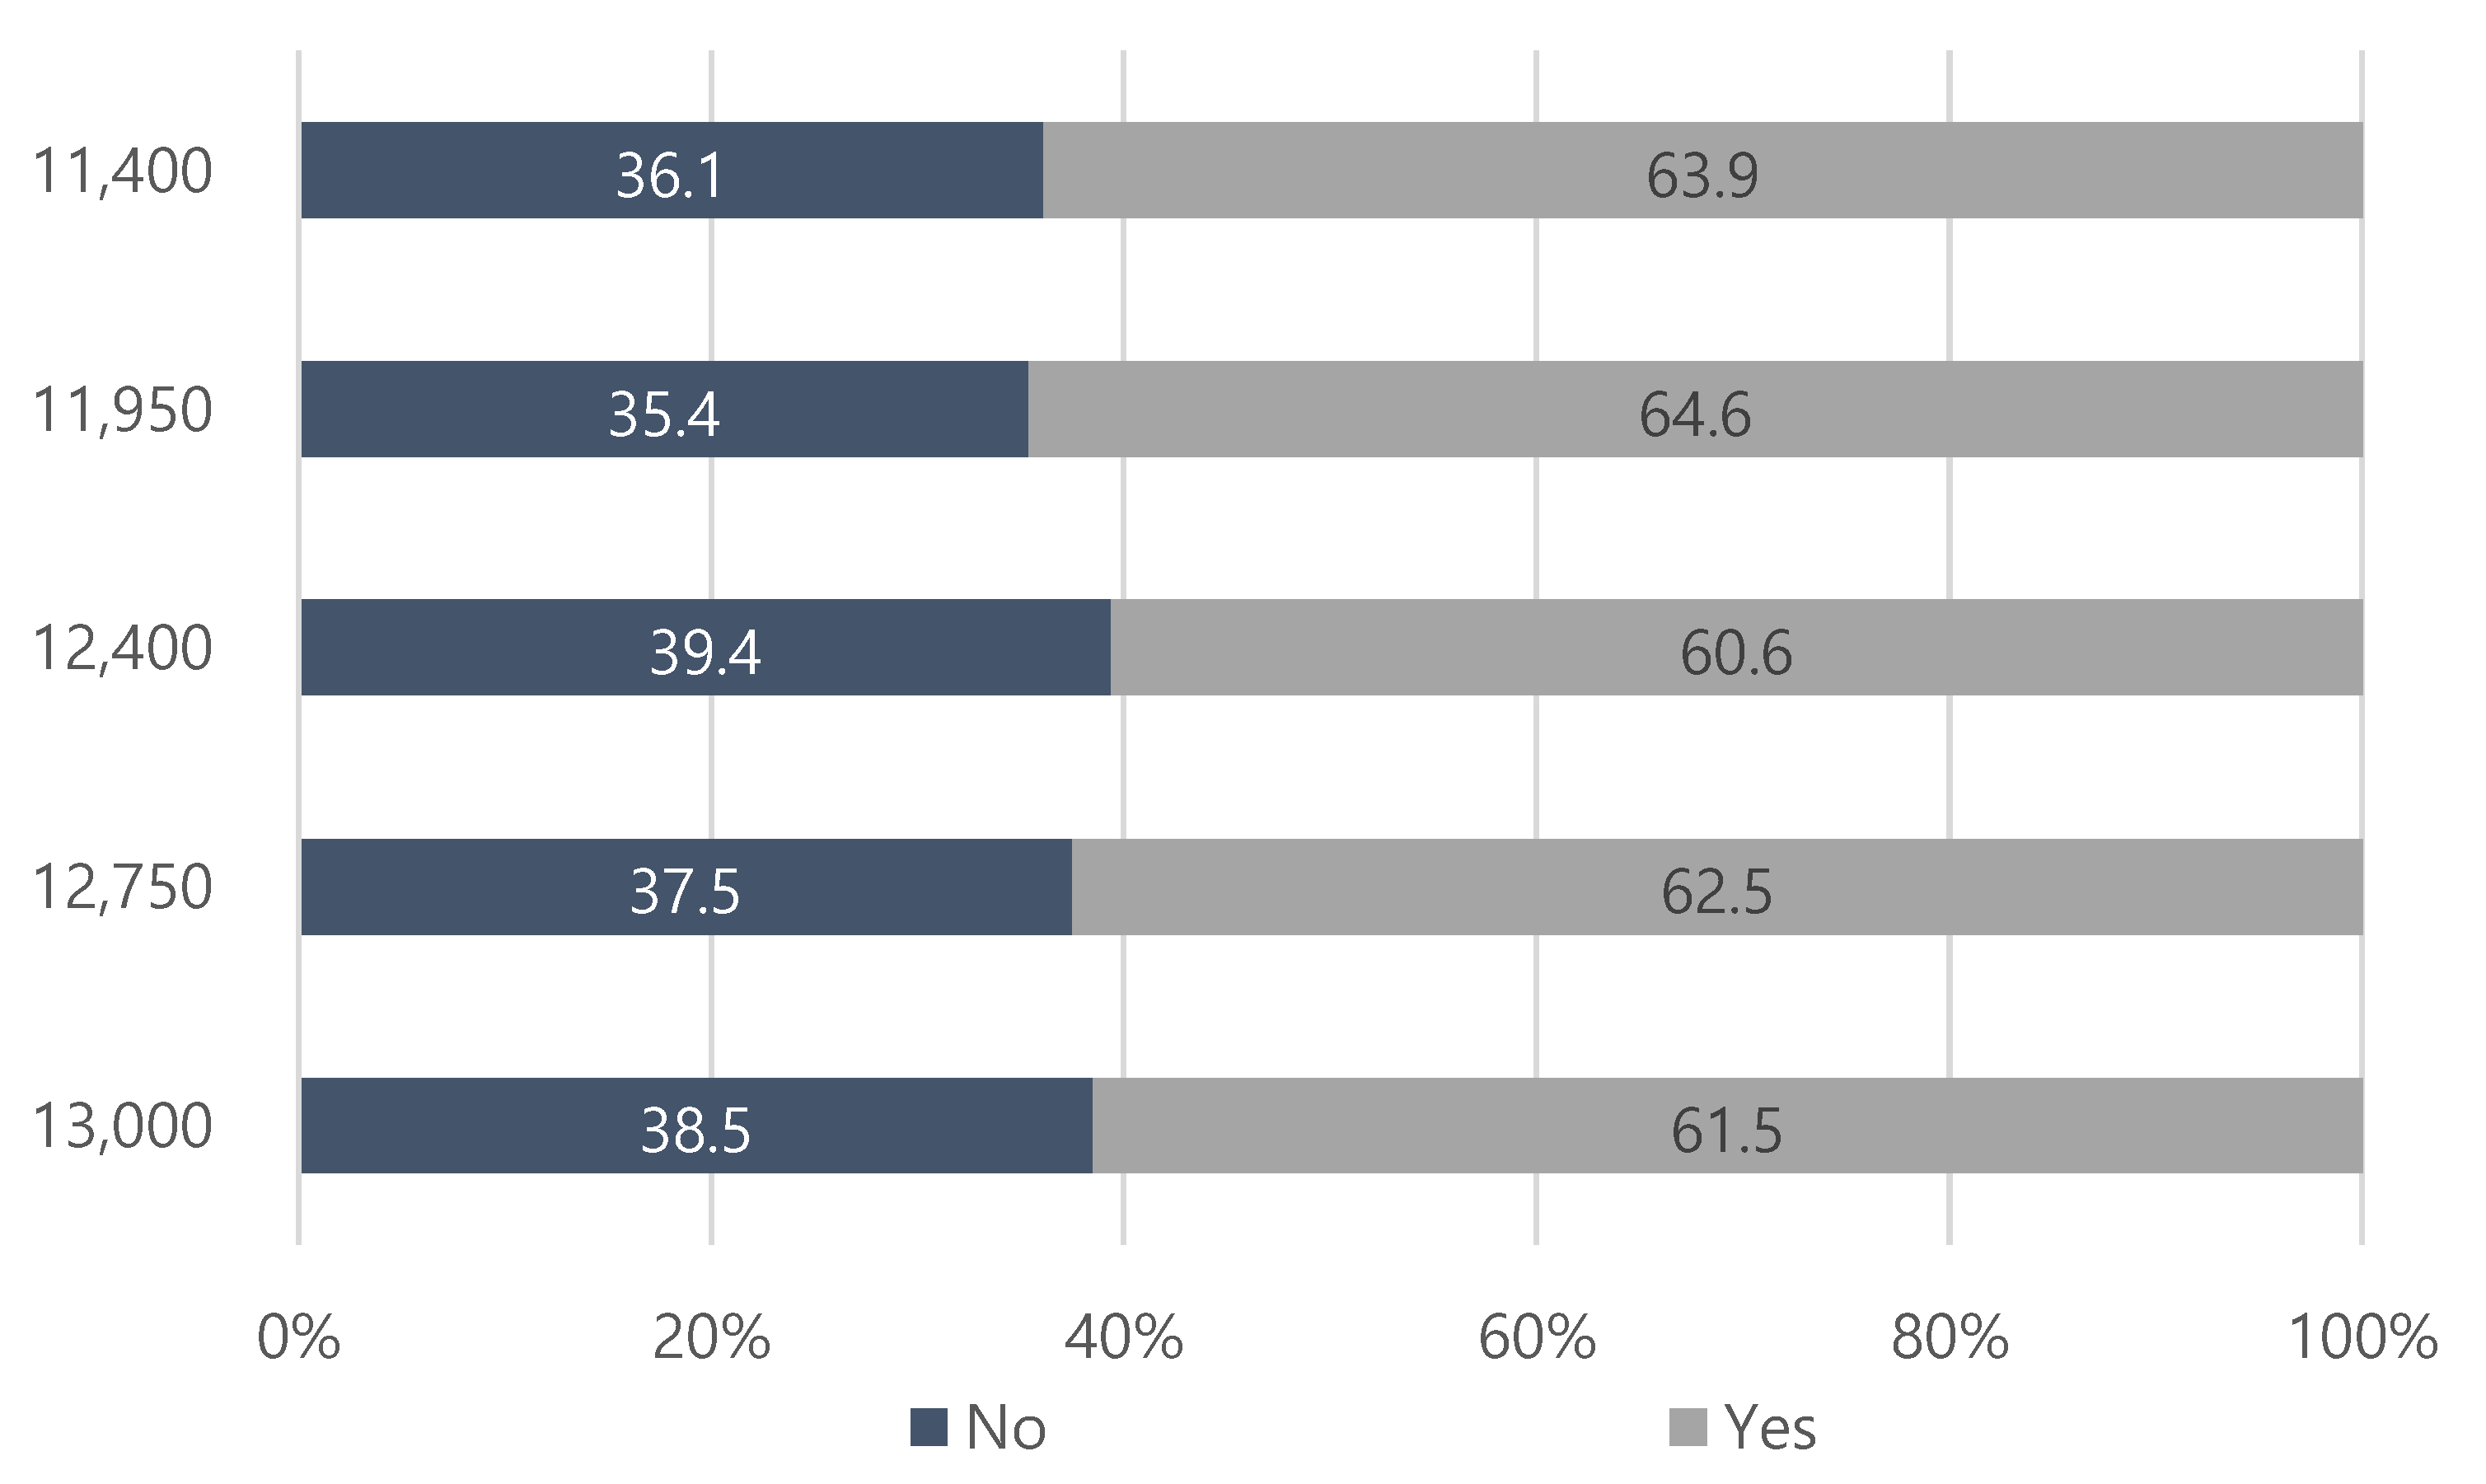
Respondents who showed no intention to subscribe to the initially offered monthly membership fee were asked whether they would be willing to subscribe if the fee was reduced by half. As shown in Figure 3, 63.9% of respondents indicated that they would subscribe to a bid amount of KRW 11,400 (USD 9.80), 64.6% at KRW 11,950 (USD 10.20), 60.6% to KRW 12,400 (US10.60), 62.5% to KRW 12,750 (USD 10.90), and 61.0% at KRW 13,000 (USD 11.10) based on the half level of the initially offered monthly membership fee.
4.2. WTP Estimation Results
Table 4 presents the CVM-based estimation results for community solar business participation. Model 1 does not include covariates (socioeconomic variables), whereas Model 2 does. In both models, because the null hypothesis that all estimation coefficients are zero is rejected at the 1% significance level, the estimated equations are all statistically significant. Furthermore, the coefficient sign of the bid amounts is negative, which is consistent with the economic theory that the greater the cost burden, the lower the acceptance.
The results of Model 2 reflect the heterogeneity of consumers and can be used as preliminary data for solar community policies. Model 2 indicates that males and those with PV business experience and high income tend to have a higher WTP for community solar businesses. It is generally known that females are more interested in environmental problems than males are. However, as this survey assumed that they would be directly investing in the community solar business, males were more willing to participate than females.
It was found that the WTP of respondents with PV business experience was high, and it was interpreted that this is because the PV business is favorable from environmental and business perspectives. In other words, consumers with experience in PV businesses want to participate more actively in them. Therefore, it is necessary to actively promote PV businesses, such as community solar, to encourage the participation of many people. Finally, WTP tends to increase with higher income, which is intuitively understandable because people with high income will feel less of a burden from community solar costs.
The mean WTP per household for the community solar business can be estimated from the estimated coefficients. Table 5 provides the average WTP and 95% confidence interval for each model. The confidence interval reflects uncertainty in the estimated WTP. The confidence interval was determined by repeating the Monte Carlo simulation technique 5000 times. As this technique randomly extracts parameters from the distribution of the coefficients estimated by the CVM, it is also called the parametric bootstrap method. This method has been used in several studies since it was first proposed by Krinsky and Robb (1986) [51]. The mean WTP value was estimated using , which considers only a positive WTP.
In the estimation results, Model 1 showed that the mean WTP value was KRW 24,260 (USD 20.80) per month, with a minimum value of KRW 22,209 (USD 19.00) and a maximum value of KRW 26,302 (USD 22.60). For Model 2, the mean WTP was KRW 25,572 (USD 21.90), with a minimum value of KRW 20,983 (USD 18.00) and a maximum value of KRW 30,585 (USD 26.20).
As the CVM-based questionnaire provided KRW 26,000 (USD 22.30) per month for the electricity bill discount benefit of participating in the community solar business, the expected profit of the community solar business based on the mean WTP is estimated to be KRW 1740 (USD 1.50) per month. The interest cost is added to the monthly membership fee method of community solar, indicating higher costs compared with the lump-sum payment and the annual fee. Therefore, in this study, KRW 1740 (USD 1.50), which was derived as the expected monthly profit for 1 kW of community solar, can be evaluated as the minimum expected profit.
This is approximately KRW 3000 (USD 2.60) lower than the actual monthly profit generated when a household, to which the level-2 price of the progressive pricing scheme is applied, installs 1 kW private PV power generation of the same capacity. Even if the third party’s community solar operation cost payment is considered, the expected return of potential participants is significantly low. This may be because of the lack of information on actual returns. Information about the cost and profit of community solar should be provided accurately to consumers to resolve this information asymmetry.
5. Conclusions
In this study, we estimated the WTP of potential consumers for the community solar business, which was in line with the government policy for expanding the community participatory energy business. Five payment amounts were set through a preliminary survey, and sufficient time and information were given to the respondents to understand the payment amounts and to induce sincere answers from the respondents. Particularly, the community solar business was sufficiently explained during the survey, and WTP was estimated using CVM based on the responses of 1000 people through the survey.
The WTP for community solar power was estimated using the CVM by classifying Model 1, which did not consider the demographic characteristics, and Model 2, which considered the characteristics as variables. Both Model 1 and Model 2 indicated negative coefficients for bid amounts at a statistically significant level (less than 1%), which is consistent with economic theory. In Model 2, the variables of gender, PV business experience, and income level had significant positive coefficients. Specifically, males demonstrated a more positive attitude towards the renewable energy business than females, and the experience of participating in the PV business was a positive factor affecting their WTP for the business. Furthermore, as the income level increased, people showed a higher intention to participate actively in the renewable energy business.
The WTP was KRW 24,260 (USD 20.80) in Model 1 and KRW 25,572 (USD 21.90) in Model 2s, thus showing a difference.
In the survey question, KRW 26,000 (USD 22.30) per month was offered as the benefit of participating in the community solar business, which was similar to the WTP for participating in community solar. In other words, potential consumers were willing to pay as much as the benefit they received from the community solar business. Therefore, when implementing renewable energy projects, the government should establish policies such that consumers will be financially compensated. This implies that there are limits to asking consumers to make unilateral sacrifices in response to climate change. It should be noted that the economic aspect is becoming crucial in energy transition policies.
According to the IEA and NEA (Nuclear Energy Agency) (2020), the Levelized Cost of Electricity (LCOE) for PV in South Korea is USD 96.60/MWh (based on the median value for utility), which is relatively high compared with an LCOE of USD 43.10/MWh in the US [52]. Therefore, a higher level of national consensus is required regarding power generation costs. Particularly, according to IRENA (International Renewable Energy Agency) (2022), although the fossil gas-based power generation cost in South Korea is USD 180.00/MWh, the electricity price is only USD 99.00/MWh, and the electricity price experienced by people is actually low [53]. Therefore, because there is little incentive for participating in renewable energy, such as PV, the electricity price should be increased rationally as a policy.
However, the lack of information about the community solar business is a factor that reduces acceptance. This is because the respondents who demonstrated a negative attitude towards the community solar business were either not interested in the business or were highly concerned about the environmental pollution caused by solar cells. Therefore, to resolve the information asymmetry problem for the community solar business, publicity is required for sufficient business awareness.
As a limitation of this study, there is a bias due to the information asymmetry of the respondents for the community solar business, and the possibility of survey method bias caused by the limitations of the online, non-face-to-face survey cannot be ruled out. Therefore, despite efforts to minimize the bias occurring in the survey structure and the research hypothesis process according to the WTP estimation methodology using the CVM, it may still exist.
Nevertheless, as mentioned above, CVM is applied in various fields. In particular, this study theoretically contributed to renewable energy businesses by applying CVM to an energy system called community solar. In the future, the CVM methodology will be applied to more fields, requiring theoretical development considering the characteristics of each field. In addition, it is necessary to develop an advanced model that can solve problems such as hypothetical bias, design bias, temporal selection bias, embedding effects, and scope effects.
In future studies, the policy effects should be verified through a comparison between countries with active community solar businesses, such as the US, and countries that are seeking to or have not yet adopted the policy by comparing the WTP estimates between countries using the method proposed in this study. Furthermore, if the WTP is relatively high, the acceptance of the community solar business can be said to be high. Based on this, consumer preferences for the community solar business can be identified. Particularly, selective experiments can be used to identify consumer preferences for the main attributes of the community solar business and derive specific policy implications.
Author Contributions
Conceptualization, J.A.; methodology, C.-Y.L.; software, C.-Y.L.; validation, C.-Y.L.; formal analysis, C.-Y.L.; investigation, J.A.; resources J.A.; data curation, J.A.; writing—original draft preparation, C.-Y.L.; writing—review and editing, K.-W.H.; visualization, K.-W.H.; supervision, C.-Y.L.; project administration, J.A.; funding acquisition, J.A. All authors have read and agreed to the published version of the manuscript.
Funding
This research was funded by the Korea Energy Economics Institute (KEEI), and the Korean Ministry of Environment (MOE) as「Graduate School specialized in Climate Change」.
Institutional Review Board Statement
Ethical review and approval were waived for this study, due to national public service program by Guideline of Pusan National university Institutional Review Board.
Informed Consent Statement
Informed consent was obtained from all subjects involved in the study. This study was performed in compliance with the 64th WMA Declaration of Helsinki. Participation in the research was voluntary.
Data Availability Statement
Data is unavailable due to privacy of the respondents.
Acknowledgments
The authors would like to thank the anonymous reviewers for their valuable comments to improve the quality of the paper.
Conflicts of Interest
The authors declare no conflict of interest.
References
- IEA (International Energy Agency). Global Energy Review: CO2 Emissions in 2021; IEA: Paris, France, 2022; Available online: https://www.iea.org/reports/global-energy-review-CO2-emissions-in-2021-2 (accessed on 7 March 2023).
- World Meteorological Association. State of the Global Climate 2021. 2022. Available online: https://library.wmo.int/index.php?lvl=notice_display&id=21982#.Y-zZk3ZBzMV (accessed on 7 March 2023).
- Kikstra, J.S.; Waidelich, P.; Rising, J.; Yumashev, D.; Hope, C.; Brierley, C.M. The social cost of carbon dioxide under climate-economy feedbacks and temperature variability. Environ. Res. Lett. 2021, 16, 094037. [Google Scholar] [CrossRef]
- UNFCCC (United Nations Framework Convention on Climate Change) Webpage. Available online: https://unfccc.int/process-and-meetings/the-paris-agreement/the-paris-agreement (accessed on 7 March 2023).
- Secretariat, UNFCCC (United Nations Framework Convention on Climate Change). Nationally Determined Contributions under the Paris Agreement-Synthesis Report. 2021. Available online: https://unfccc.int/documents/306848 (accessed on 7 March 2023).
- Bouckaert, S.; Pales, A.F.; McGlade, C.; Remme, U.; Wanner, B.; Varro, L.; Spencer, T. Net Zero by 2050: A Roadmap for the Global Energy Sector. 2021. Available online: https://www.iea.org/reports/net-zero-by-2050 (accessed on 7 March 2023).
- Government of the Republic of Korea. 2050 Carbon Neutral Strategy of the Republic of Korea: Towards a Sustainable and Green Society; Government of the Republic of Korea: Seoul, Republic of Korea, 2020; pp. 1–131. Available online: https://unfccc.int/documents/267683 (accessed on 7 March 2023).
- IEA (International Energy Agency). Renewables 2022; International Energy Agency: Paris, France, 2022; Available online: https://www.iea.org/reports/renewables-2022 (accessed on 7 March 2023).
- Randall, A.; Ives, B.; Eastman, C. Bidding games for valuation of aesthetic environmental improvements. J. Environ. Econ. Manag. 1974, 2, 132–149. [Google Scholar] [CrossRef]
- Hanemann, M.; Loomis, J.; Kanninen, B. Statistical efficiency of double-bounded dichotomous choice contingent valuation. Am. J. Agric. Econ. 1991, 73, 1255–1263. [Google Scholar] [CrossRef]
- Heeter, J.; Xu, K.; Chan, G. Sharing the Sun: Community Solar Deployment, Subscription Savings, and Energy Burden Reduction (No. NREL/PR-6A20-80246); National Renewable Energy Lab. (NREL): Golden, CO, USA, 2021. [Google Scholar] [CrossRef]
- Zografakis, N.; Sifaki, E.; Pagalou, M.; Nikitaki, G.; Psarakis, V.; Tsagarakis, K.P. Assessment of public acceptance and willingness to pay for renewable energy sources in Crete. Renew. Sustain. Energy Rev. 2010, 14, 1088–1095. [Google Scholar] [CrossRef]
- Paravantis, J.A.; Stigka, E.; Mihalakakou, G.; Michalena, E.; Hills, J.M.; Dourmas, V. Social acceptance of renewable energy projects: A contingent valuation investigation in Western Greece. Renew. Energy 2018, 123, 639–651. [Google Scholar] [CrossRef]
- Ntanos, S.; Kyriakopoulos, G.; Chalikias, M.; Arabatzis, G.; Skordoulis, M. Public perceptions and willingness to pay for renewable energy: A case study from Greece. Sustainability 2018, 10, 687. [Google Scholar] [CrossRef] [Green Version]
- Claudy, M.C.; Michelsen, C.; O’Driscoll, A. The diffusion of microgeneration technologies–assessing the influence of perceived product characteristics on home owners’ willingness to pay. Energy Policy 2011, 39, 1459–1469. [Google Scholar] [CrossRef] [Green Version]
- Bollino, C.A. The willingness to pay for renewable energy sources: The case of Italy with socio-demographic determinants. Energy J. 2009, 30, 81–96. [Google Scholar] [CrossRef]
- Kowalska-Pyzalska, A. Do consumers want to pay for green electricity? A case study from Poland. Sustainability 2019, 11, 1310. [Google Scholar] [CrossRef] [Green Version]
- Botelho, A.; Pinto, L.M.; Lourenço-Gomes, L.; Valente, M.; Sousa, S. Social sustainability of renewable energy sources in electricity production: An application of the contingent valuation method. Sustain. Cities Soc. 2016, 26, 429–437. [Google Scholar] [CrossRef]
- Dogan, E.; Muhammad, I. Willingness to pay for renewable electricity: A contingent valuation study in Turkey. Electr. J. 2019, 32, 106677. [Google Scholar] [CrossRef]
- Muhammad, I.; Shabbir, M.S.; Saleem, S.; Bilal, K.; Ulucak, R. Nexus between willingness to pay for renewable energy sources: Evidence from Turkey. Environ. Sci. Pollut. Res. 2021, 28, 2972–2986. [Google Scholar] [CrossRef] [PubMed]
- Batley, S.L.; Fleming, P.D.; Urwin, P. Willingness to pay for renewable energy: Implications for UK green tariff offerings. Indoor Built Environ. 2000, 9, 157–170. [Google Scholar] [CrossRef]
- Akcura, E. Mandatory versus voluntary payment for green electricity. Ecol. Econ. 2015, 116, 84–94. [Google Scholar] [CrossRef]
- Whitehead, J.C.; Cherry, T.L. Willingness to pay for a green energy program: A comparison of ex-ante and ex-post hypothetical bias mitigation approaches. Resour. Energy Econ. 2007, 29, 247–261. [Google Scholar] [CrossRef] [Green Version]
- Gracia, A.; Barreiro-Hurlé, J.; y Pérez, L.P. Can renewable energy be financed with higher electricity prices? Evidence from a Spanish region. Energy Policy 2012, 50, 784–794. [Google Scholar] [CrossRef] [Green Version]
- Entele, B.R. Analysis of households’ willingness to pay for a renewable source of electricity service connection: Evidence from a double-bounded dichotomous choice survey in rural Ethiopia. Heliyon 2020, 6, e03332. [Google Scholar] [CrossRef]
- Abdullah, S.; Jeanty, P.W. Willingness to pay for renewable energy: Evidence from a contingent valuation survey in Kenya. Renew. Sustain. Energy Rev. 2011, 15, 2974–2983. [Google Scholar] [CrossRef]
- Ayodele, T.R.; Ogunjuyigbe, A.S.O.; Ajayi, O.D.; Yusuff, A.A.; Mosetlhe, T.C. Willingness to pay for green electricity derived from renewable energy sources in Nigeria. Renew. Sustain. Energy Rev. 2021, 148, 111279. [Google Scholar] [CrossRef]
- Adeleke, A.T.; Odesola, O.V.; Hussayn, J.A.; Odesola, M.M.; Odesola, O. Household poverty status and willingness to pay for renewable energy technologies: Evidence from Southwestern Nigeria. Environ. Sci. Proc. 2022, 15, 3. [Google Scholar] [CrossRef]
- Nomura, N.; Akai, M. Willingness to pay for green electricity in Japan as estimated through contingent valuation method. Appl. Energy 2004, 78, 453–463. [Google Scholar] [CrossRef]
- Zhang, L.; Wu, Y. Market segmentation and willingness to pay for green electricity among urban residents in China: The case of Jiangsu Province. Energy Policy 2012, 51, 514–523. [Google Scholar] [CrossRef]
- Guo, X.; Liu, H.; Mao, X.; Jin, J.; Chen, D.; Cheng, S. Willingness to pay for renewable electricity: A contingent valuation study in Beijing, China. Energy Policy 2014, 68, 340–347. [Google Scholar] [CrossRef]
- Jin, J.; Wan, X.; Lin, Y.; Kuang, F.; Ning, J. Public willingness to pay for the research and development of solar energy in Beijing, China. Energy Policy 2019, 134, 110962. [Google Scholar] [CrossRef]
- Han, M.S.; Biying, Y.; Cudjoe, D.; Yuan, Q. Investigating willingness-to-pay to support solar energy research and development in Myanmar. Energy Policy 2020, 146, 111820. [Google Scholar] [CrossRef]
- Yu, Y.; Yamaguchi, K.; Thuy, T.D.; Kittner, N. Will the public in emerging economies support renewable energy? Evidence from Ho Chi Minh City, Vietnam. Renew. Sustain. Energy Rev. 2022, 169, 112942. [Google Scholar] [CrossRef]
- Yoo, S.H.; Kwak, S.Y. Willingness to pay for green electricity in Korea: A contingent valuation study. Energy Policy 2009, 37, 5408–5416. [Google Scholar] [CrossRef]
- Kim, J.; Park, J.; Kim, H.; Heo, E. Assessment of Korean customers’ willingness to pay with RPS. Renew. Sustain. Energy Rev. 2012, 16, 695–703. [Google Scholar] [CrossRef]
- Kim, J.; Park, J.; Kim, J.; Heo, E. Renewable electricity as a differentiated good? The case of the Republic of Korea. Energy Policy 2013, 54, 327–334. [Google Scholar] [CrossRef]
- Huh, S.Y.; Lee, J.; Shin, J. The economic value of South Korea׳ s renewable energy policies (RPS, RFS, and RHO): A contingent valuation study. Renew. Sustain. Energy Rev. 2015, 50, 64–72. [Google Scholar] [CrossRef]
- Lee, C.Y.; Heo, H. Estimating willingness to pay for renewable energy in South Korea using the contingent valuation method. Energy Policy 2016, 94, 150–156. [Google Scholar] [CrossRef]
- Park, S.H.; Jung, W.J.; Kim, T.H.; Lee, S.Y.T. Can renewable energy replace nuclear power in Korea? An economic valuation analysis. Nucl. Eng. Technol. 2016, 48, 559–571. [Google Scholar] [CrossRef] [Green Version]
- Woo, J.; Lim, S.; Lee, Y.G.; Huh, S.Y. Financial feasibility and social acceptance for reducing nuclear power plants: A contingent valuation study. Sustainability 2018, 10, 3833. [Google Scholar] [CrossRef] [Green Version]
- Woo, J.; Chung, S.; Lee, C.Y.; Huh, S.Y. Willingness to participate in community-based renewable energy projects: A contingent valuation study in South Korea. Renewable and Sustainable Energy Rev. 2019, 112, 643–652. [Google Scholar] [CrossRef]
- Kim, J.H.; Kim, S.Y.; Yoo, S.H. Public acceptance of the “Renewable Energy 3020 Plan”: Evidence from a contingent valuation study in South Korea. Sustainability 2020, 12, 3151. [Google Scholar] [CrossRef] [Green Version]
- Fernandez, R. Community renewable energy projects: The future of the sustainable energy transition? Int. Spect. 2021, 56, 87–104. [Google Scholar] [CrossRef]
- REN21 (Renewable Energy Policy Network for the 21st Century). Renewables 2016 Global Status Report. 2016. Available online: https://www.ren21.net/gsr-2016/index.php (accessed on 7 March 2023).
- Hockenos, P. As Big Energy Gains, Can Europe’s Community Renewables Compete? Yale School of the Environment, 6 January 2021. Available online: https://e360.yale.edu/features/can-europes-community-renewables-compete-with-big-wind-and-solar (accessed on 7 March 2023).
- Oerlemans, L.A.; Chan, K.Y.; Volschenk, J. Willingness to pay for green electricity: A review of the contingent valuation literature and its sources of error. Renew. Sustain. Energy Rev. 2016, 66, 875–885. [Google Scholar] [CrossRef] [Green Version]
- Zorić, J.; Hrovatin, N. Household willingness to pay for green electricity in Slovenia. Energy Policy 2012, 47, 180–187. [Google Scholar] [CrossRef]
- Wiser, R.H. Using contingent valuation to explore willingness to pay for renewable energy: A comparison of collective and voluntary payment vehicles. Ecol. Econ. 2007, 62, 419–432. [Google Scholar] [CrossRef] [Green Version]
- Freeman, A.M. Economic Valuation: What and Why. In A Primer on Nonmarket Valuation; Springer: Berlin/Heidelberg, Germany, 2003; pp. 1–25. [Google Scholar] [CrossRef]
- Krinsky, I.; Robb, A.L. On approximating the statistical properties of elasticities. Rev. Econ. Stat. 1986, 68, 715–719. [Google Scholar] [CrossRef] [Green Version]
- Lorenczik, S.; Kim, S.; Wanner, B.; Bermudez Menendez, J.M.; Remme, U.; Hasegawa, T.; Mertens, T. Projected Costs of Generating Electricity-2020 Edition (No. NEA--7531). Organisation for Economic Co-Operation and Development. 2020. Available online: https://inis.iaea.org/search/search.aspx?orig_q=RN:52007078 (accessed on 7 March 2023).
- IRENA (International Renewable Energy Agency). Renewable Power Generation Costs in 2021, International Renewable Energy Agency, Abu Dhabi. 2022. Available online: https://www.irena.org/publications/2022/Jul/Renewable-Power-Generation-Costs-in-2021 (accessed on 7 March 2023).
Figure 1.
Intention to subscribe for community solar based on the initial bid amount.

Figure 2.
Intention to subscribe for community solar business at twice the initial bid amount.

Figure 3.
Intention to subscribe for community solar business at ½ of the initial bid amount.


Table 1.
Previous studies on the estimation of WTP for renewable energy using CVM.
| Researcher | Year | Model | Questionnaire Method | Type of Survey | Number of Samples | Country |
|---|---|---|---|---|---|---|
| Batley et al. [21] | 2000 | Multiple Regression | Payment Card | 746 | UK | |
| Nomura and Akai [29] | 2004 | MLE | DBDC | 370 | Japan | |
| Whitehead and Cherry [23] | 2007 | Logit Model | SBDC | Telephone | 353 | USA |
| Wiser [49] | 2007 | Logit Model | SBDC | Online | 1574 | USA |
| Bollino [16] | 2009 | Probit Model | DC+Open-ended | Online | 1601 | Italy |
| Yoo and Kwak [35] | 2009 | Spike Model | SBDC | Face-to-Face | 800 | Korea |
| Zografakis et al. [12] | 2010 | Logit Model | DBDC | Face-to-Face | 1440 | Greece |
| Claudy et al. [15] | 2011 | Probit Model | DBDC | Face-to-Face | 1012 | Ireland |
| Gracia et al. [24] | 2011 | Tobit Model | DBDC+Open-ended | Online | 367 | USA |
| Abdullah and Jeanty [26] | 2011 | Logit Model | DBDC | Face-to-Face | 200 | Kenya |
| Kim et al. [36] | 2012 | Spike Model | DBDC | Face-to-Face | 720 | Korea |
| Zhang and Wu [30] | 2012 | Logit Model | Payment Card | Online+Mail | 1139 | China |
| Kim et al. [37] | 2013 | Spike Model | DBDC | Face-to-Face | 490 | Korea |
| Guo et al. [31] | 2014 | Logit Model | SBDC | Face-to-Face | 571 | China |
| Akcura [22] | 2015 | Probit Model | DBDC | Online | 2000 | UK |
| Huh et al. [38] | 2015 | Spike Model | DBDC | Face-to-Face | 500 | Korea |
| Botelho et al. [18] | 2016 | Binomial Model | Open-ended | Face-to-Face | 219 | Portugal |
| Lee and Heo [39] | 2016 | Spike Model | DBDC | Face-to-Face | 1000 | Korea |
| Park et al. [40] | 2016 | Logistic Regression | DBDC | Online | 1525 | Korea |
| Woo et al. [41] | 2018 | Spike Model | DBDC | Online, Face-to-Face | 814 | Korea |
| Paravantis et al. [13] | 2018 | Multiple Regression | Open-ended | Face-to-Face | 201 | Greece |
| Ntanos et al. [14] | 2018 | one-way ANOVA, Logit Regression | SBDC | Face-to-Face | 400 | Greece |
| Dogan and Muhammad [19] | 2019 | Tobit, Probit, Logit Model | Open-ended | Face-to-Face | 2500 | Turkey |
| Jin et al. [32] | 2019 | Logit Model | SBDC | Face-to-Face | 800 | China |
| Woo et al. [42] | 2019 | Spike Model | DBDC | Face-to-Face | 400 | Korea |
| Kowalska-Pyzalska [17] | 2019 | Logit Model | Payment Card | Telephone | 502 | Poland |
| Entele [25] | 2020 | Probit Model | DBDC | Face-to-Face | 220 | Ethiopia |
| Kim et al. [43] | 2020 | Spike Model | SBDC | Face-to-Face | 1000 | Korea |
| Han et al. [33] | 2020 | Probit Model | SBDC | Online | 550 | Myanmar |
| Muhammad et al. [20] | 2021 | one-way ANOVA | Payment Card | Face-to-Face | 1981 | Turkey |
| Ayodele et al. [27] | 2021 | Random Utility Model (RUM) | Payment Card | Face-to-Face | 400 | Nigeria |
| Adeleke et al. [28] | 2022 | Probit Model, Multiple Regression | SBDC | Online | 304 | Nigeria |
| Yu et al. [34] | 2022 | Probit Model | DBDC | Face-to-Face | 294 | Vietnam |
Table 2.
Composition of respondents.
| Category | Number of Respondents | Composition Ratio (%) | |
|---|---|---|---|
| Total | 1000 | 1000 | |
| Gender | Male | 510 | 51.0 |
| Female | 490 | 49.0 | |
| Age | 19 to 29 | 183 | 18.3 |
| 30 to 39 | 189 | 18.9 | |
| 40 to 49 | 222 | 22.2 | |
| 50 to 59 | 233 | 23.3 | |
| 60 to 69 | 173 | 17.3 | |
| Education | Elementary school | 9 | 0.9 |
| Middle school | 8 | 0.8 | |
| High school | 205 | 20.5 | |
| College (less than four years) | 149 | 14.9 | |
| University (four years or more) | 530 | 53.0 | |
| Master’s degree | 82 | 8.2 | |
| Ph.D. degree | 17 | 1.7 | |
| Occupation | Agriculture/Forestry/Fishery | 4 | 0.4 |
| Self-employment | 89 | 8.9 | |
| Sales/Services | 67 | 6.7 | |
| Production/Technical/Labor | 82 | 8.2 | |
| Office/Management/Professional | 433 | 43.3 | |
| Research | 14 | 1.4 | |
| Teacher/Professor | 28 | 2.8 | |
| Homemaker | 155 | 15.5 | |
| Student | 24 | 2.4 | |
| Unemployed/Retired/Others | 104 | 10.4 | |
| Average Monthly Personal Income | Less than 100 (KRW 10,000) (USD 857.6) | 144 | 14.4 |
| 100-150 (KRW 10,000) (USD 857.6–1286.3) | 86 | 8.6 | |
| 150-200 (KRW 10,000) (USD 1286.3–1715.1) | 207 | 20.7 | |
| 200-250 (KRW 10,000) (USD 1715.1–2143.9) | 128 | 12.8 | |
| 250-300 (KRW 10,000) (USD 2143.9–2572.7) | 95 | 9.5 | |
| 300-400 (KRW 10,000) (USD 2572.7–3430.2) | 132 | 13.2 | |
| 400-500 (KRW 10,000) (USD 3430.2–4287.8) | 76 | 7.6 | |
| 500-700 (KRW 10,000) (USD 4287.8–6002.9) | 83 | 8.3 | |
| 700-1000 (KRW 10,000) (USD 6002.9–8575.5) | 29 | 2.9 | |
| More than 1000 (KRW 10,000) (USD 8575.5) | 20 | 2.0 | |
Table 3.
Response distribution of respondents to the CVM-based survey.
| Initial Bid Amount (KRW) | Yes-Yes | Yes-No | No-Yes | No-No | Total | |||||||
|---|---|---|---|---|---|---|---|---|---|---|---|---|
| WTP ≥ 0 | WTP = 0 | |||||||||||
| N | Percentage (%) | N | Percentage (%) | N | Percentage (%) | N | Percentage (%) | N | Percentage (%) | N | Percentage (%) | |
| 22,800 (19.6USD ) | 27 | 3% | 78 | 8% | 62 | 6% | 15 | 2% | 20 | 2% | 202 | 20% |
| 23,900 (20.5USD ) | 24 | 2% | 79 | 8% | 64 | 6% | 13 | 1% | 22 | 2% | 202 | 20% |
| 24,800 (21.3USD ) | 22 | 2% | 74 | 7% | 60 | 6% | 15 | 2% | 24 | 2% | 195 | 20% |
| 25,500 (21.9USD ) | 15 | 2% | 72 | 7% | 70 | 7% | 18 | 2% | 24 | 2% | 199 | 20% |
| 26,000 (22.3USD ) | 9 | 1% | 76 | 8% | 72 | 7% | 6 | 1% | 39 | 4% | 202 | 20% |
| Total | 97 | 10% | 379 | 38% | 328 | 33% | 67 | 7% | 129 | 13% | 1000 | 100% |
Table 4.
CVM-based estimation results for community solar business.
| Model 1 | Model 2 | ||||
|---|---|---|---|---|---|
| Variables | Coefficient | Standard Error | Variables | Coefficient | Standard Error |
| Constant | 2.0000 *** | 0.1009 | Constant | 1.7547 *** | 0.2056 |
| BID | −0.0001 *** | 0.0000 | BID | −0.0001 *** | 0.0000 |
| Gender | 0.2114 * | 0.1171 | |||
| PV Business Experience | 0.8118 *** | 0.1798 | |||
| Income | 0.1020 *** | 0.0272 | |||
| log-likelihood | −1299.7 | log-likelihood | −1265.7 | ||
| Wald statistic | 126.5202 | Wald statistic | 32.5547 | ||
| p-value for Wald statistic | 0.0000 | p-value for Wald statistic | 0.0000 | ||
Note: * Statistically significant at the 10% level. *** Statistically significant at the 1% level.
Table 5.
WTP estimates for community solar business.
| Model 1 | Model 2 | |
|---|---|---|
| Mean WTP | 24,260 (USD 20.8) | 25,572 (USD 21.9) |
| 2.5% percentile | 22,209 (USD 19.0) | 20,983 (USD 18.0) |
| 97.5% percentile | 26,302 (USD 22.6) | 30,585 (USD 26.2) |
Disclaimer/Publisher’s Note: The statements, opinions and data contained in all publications are solely those of the individual author(s) and contributor(s) and not of MDPI and/or the editor(s). MDPI and/or the editor(s) disclaim responsibility for any injury to people or property resulting from any ideas, methods, instructions or products referred to in the content. |
© 2023 by the authors. Licensee MDPI, Basel, Switzerland. This article is an open access article distributed under the terms and conditions of the Creative Commons Attribution (CC BY) license (https://creativecommons.org/licenses/by/4.0/).
Share and Cite
MDPI and ACS Style
Hwang, K.-W.; Ahn, J.; Lee, C.-Y. Analysis of Consumer Willingness to Pay for Community Solar Business Using Contingent Valuation Method. Sustainability 2023, 15, 5029. https://doi.org/10.3390/su15065029
AMA Style
Hwang K-W, Ahn J, Lee C-Y. Analysis of Consumer Willingness to Pay for Community Solar Business Using Contingent Valuation Method. Sustainability. 2023; 15(6):5029. https://doi.org/10.3390/su15065029
Chicago/Turabian StyleHwang, Kyu-Won, Jaekyun Ahn, and Chul-Yong Lee. 2023. "Analysis of Consumer Willingness to Pay for Community Solar Business Using Contingent Valuation Method" Sustainability 15, no. 6: 5029. https://doi.org/10.3390/su15065029
Note that from the first issue of 2016, this journal uses article numbers instead of page numbers. See further details here.