
The Social Exclusion Perspective of Food Insecurity: The Case of Blacked-Out Food Areas


1
Department of Political and Social Sciences, University of Florence, 50127 Florence, Italy
2
Department of Biosciences and Territory, University of Molise, 86090 Pesche, Italy
3
Department of Architecture and Project, University of Rome La Sapienza, 00186 Rome, Italy
4
Department of Policies and Bio-Economics, CREA Council for Agricultural Research and the Analysis of Agricultural Economics, 00187 Rome, Italy
*
Author to whom correspondence should be addressed.
Sustainability 2023, 15(4), 2974; https://doi.org/10.3390/su15042974
Submission received: 12 December 2022
/
Revised: 4 January 2023
/
Accepted: 6 January 2023
/
Published: 7 February 2023
(This article belongs to the Special Issue Sustainable Research on the Nutrition Security and Food Policy)
Abstract
:The United Nations Global Agenda for Sustainable Development, particularly through Goal 2, simultaneously seeks to end hunger, achieve food security, improve nutrition and promote sustainable agriculture. Therefore, it is crucial to focus on the agricultural production system and on consumption conditions. This means that ‘access’ to food should be determined with respect to the three dimensions of economic, physical and solidarity access to a quantity of food that fulfils both people’s nutritional needs and environmentally responsible consumption patterns. In Italy, 9.9% of the total population, i.e., six million people, live in a state of food insecurity. In Rome, 9.4% of the population lives in a condition of material deprivation, and applications for Citizens’ Income have increased, as well as food aids which amounted to EUR 20 million in 2020. The relationships between the cost of healthy and sustainable diets (which would cost 60% more than a staple diet) and the increasing economic difficulties people are facing, have prompted a focus on the multidimensional nature of food security, with particular emphasis on people’s ability to access food. In this paper, analyzing the Metropolitan City of Rome (Italy) as a case study, we present a pilot and innovative work on an affordability index to healthy and sustainable diet. A geospatial analysis highlights areas where economic difficulties in accessing food overlap with the shortage/absence of food retail outlets and with a lack of solidarity networks (e.g., civil society food distribution initiatives), allowing a new concept to come into focus, namely the blacked-out food areas. This concept helps to identify those areas in which people are socially excluded and cannot enjoy the same substantive food-related choices as people in other areas. The research outcomes provide insights into the geographical areas and neighborhoods characterized by critical access to healthy and sustainable food, providing crucial information for the planning and implementation of targeted social policies to tackle food insecurity.
1. Introduction
The global humanitarian crisis caused by the spread of COVID-19 pandemic has had spill-over effects on food security, due to the resulting economic and social shocks. The pandemic has highlighted how food system plays a key role within a broader reflection in terms of environmental and human sustainability. Indeed, the ways food is produced, consumed, and rescued (e.g., in food surplus management) provide a litmus test to analyze both the health of the planet [1] and the nutritional conditions of people [2], as well as the social inequalities arising from disruptions in the local food system that prevent people from accessing food available on the market [3,4,5,6,7,8]. Against this backdrop, an innovative approach to food systems has been discussed and promoted during and after the pandemic by scholars and international agencies to link environmental sustainability with the means of production, consumption, recycling, and recovery of food, on the one hand, and to tackle social inequalities, on the other hand.
The concept of food security is multidimensional in nature. In particular, it is characterized as a condition for which “all people, at all times, have physical, social and economic access to sufficient, safe and nutritious food that meets their dietary needs and food preferences for an active and healthy life” [9].
A complex definition emerges that relies on four main dimensions of food security, namely availability, accessibility, utilization, and stability [10]. Each of these dimensions has its own socioeconomic drivers, creating ripple effects on each other. The complexity of these interactions impacts the achievement of Goal 2 of the UN Global Agenda for Sustainable Development, which aims to end hunger, achieve food security, improve nutrition and promote sustainable agriculture.
The definitional and solution-finding difficulties bring out the ‘wicked’ nature of food security [11,12], which, as such, is ambiguous, contentious, and hardly subject to solutions due to the controversies with respect to the models to be used and the important data to be considered [13]. Precisely, food security presents a ‘super wicked’ nature [14]. In other words, in addition to the crucial features of a wicked problem, it also presents a profoundly policy-impacting aspect. Food security, in its multidimensional nature, presents a tipping point defined as planetary boundary [15] (e.g., the loss of biodiversity linked to the impacts of food production), and as a social boundary [16] (e.g., inequality and poverty), given the fundamental and continuous shifts in the nature of the problem [17].
This ‘super wicked’ nature requires a continuous, open-ended, reflexive debate [18] on the conceptual aspect of food security underlying the measurement exercise, by anchoring the whole within an area-based approach. Such an approach allows for bridging of the epistemological gap between local/contextual and global/generalized knowledge [19,20], structuring social learning in a bottom-up process.
Therefore, this article investigates the conceptual and measuring aspect of food security using a local case study, the Metropolitan City of Roma Capitale (MCRC), as a pilot case. The objective is to develop an affordability index with respect to a healthy and sustainable diet, capturing the inequalities and critical issues generated by the economic, physical and solidarity-based disruptions in the local food system that prevent people from being food-secure.
Whereas the literature on food security prominently focuses on the right to food, exploring the effects of food poverty on society, the aim of this research is to reason about food security as the ability of people, as well as territories, to ensure healthy and sustainable food for themselves. Food security thus emerges as a significant part of social security, requiring special attention to be paid to the consumption conditions determined by the threefold dimensions of access:
- i.
- Physical, i.e., the presence or proximity of retail outlets with fresh, nutritious, and safe food (failing this, conditions for food deserts occur).
- ii.
- Economic, i.e., the entitlements that enable people to access food (affordability).
- iii.
- Solidarity, i.e., the presence of local solidarity networks that enable and ensure that people are food secure.
The purpose of this article is to analyze food security comprehensively according to a multidimensional perspective rooted in poverty and social exclusion. Therefore, this work is not focused on single isolated disruptions of the local food system (e.g., food desert), which should not be addressed independently and in absolute terms but as a simultaneous contributor to defining food security as a socioeconomic outcome [21], highlighting inequalities and critical issues in the investigated territory.
Through cartography, this research highlights the presence of ‘black-out’ food areas.
The expression blacked-out area is often referred in relation to Google Maps to indicate a series of blurred regions around the world e.g., government buildings and military bases. The concept of blacked-out food areas allows us to refer to areas which are so blurred that they avoid being detected, where people are socially excluded and cannot enjoy the same substantive food-related freedoms as people in other areas. In other words, this concept highlights areas with worrying and remarkable social exclusion, where there is a simultaneous absence of retail food outlets, compromised affordability and an absence of solidarity networks.
2. Food Insecurity as a Socioeconomic Outcome
The following question is often asked, and we might as well face it. Although the world’s food supply is sufficient to provide more than 2900 kcal/person/day, an amount that exceeds our nutritional needs [22], with the resulting issue of food waste, why are there people living in a state of food insecurity?
According to the World Food Summit’s 1996 definition of food security, it can be inferred that the condition of food security occurs when people have secure, guaranteed, and consistent access to an amount of food that allows them to lead healthy and active lives [23]. Conversely, the condition of food insecurity occurs when socioeconomic disruptions in the local food system not properly adjusted for by socioinstitutional mechanisms preclude people from achieving a food-secure situation.
In this regard, it can be agreed that Poverty and Hunger by the World Bank Policy Study [24] and Poverty and Famines [25] by Nobel laureate in Economics Amartya Sen played a pioneering role in shifting the focus of food security analysis from food supply-based analysis to an income-centered analysis. The reasons for people experiencing food insecurity should be researched from the perspective that the current entitlements system is not providing people with adequate rights and resources to purchase enough food [26].
Entitlements are property rights over food, which people are entitled to exercise [27]. Sen describes them as “The set of alternative commodity bundles that a person can command in a society using the totality of rights and opportunities that he or she faces” [28,29].
A decline in endowments (i.e., the resources that a person legally owns), a decrease in the price of goods a person produces or an increase in the price of food to be purchased, can affect one’s ability to access food. Therefore, the role of public policies in supporting entitlements by providing antipoverty programs is pivotal (e.g., in India, after the Independence in 1947, by developing emergency public labor opportunities to replenish the lost entitlements of deprived people, the risk of famine was prevented [30]).
Thus, rights and resources are connected and interdependent but in an unstable way. Indeed, in a free-market economy, they are not only constrained by endowment, i.e., workforce and other productive inputs, but also by the price trends of goods sold or purchased. In addition, they are strongly conditioned by non-economic institutions that enter the configuration of opportunities (e.g., civil society initiatives and antipoverty public programs).
Moreover, Amartya Sen’s research work has been crucial in broadening the food security literature, turning the focus from the “availability” of food to “access” and actual “use” of food. Indeed, the conversion of food intake into the ability to be well-nourished [26] depends both on social and personal characteristics (e.g., age, gender and environmental conditions) access to complementary inputs (e.g., the availability of drinking water, health services and epidemic prevention programs).
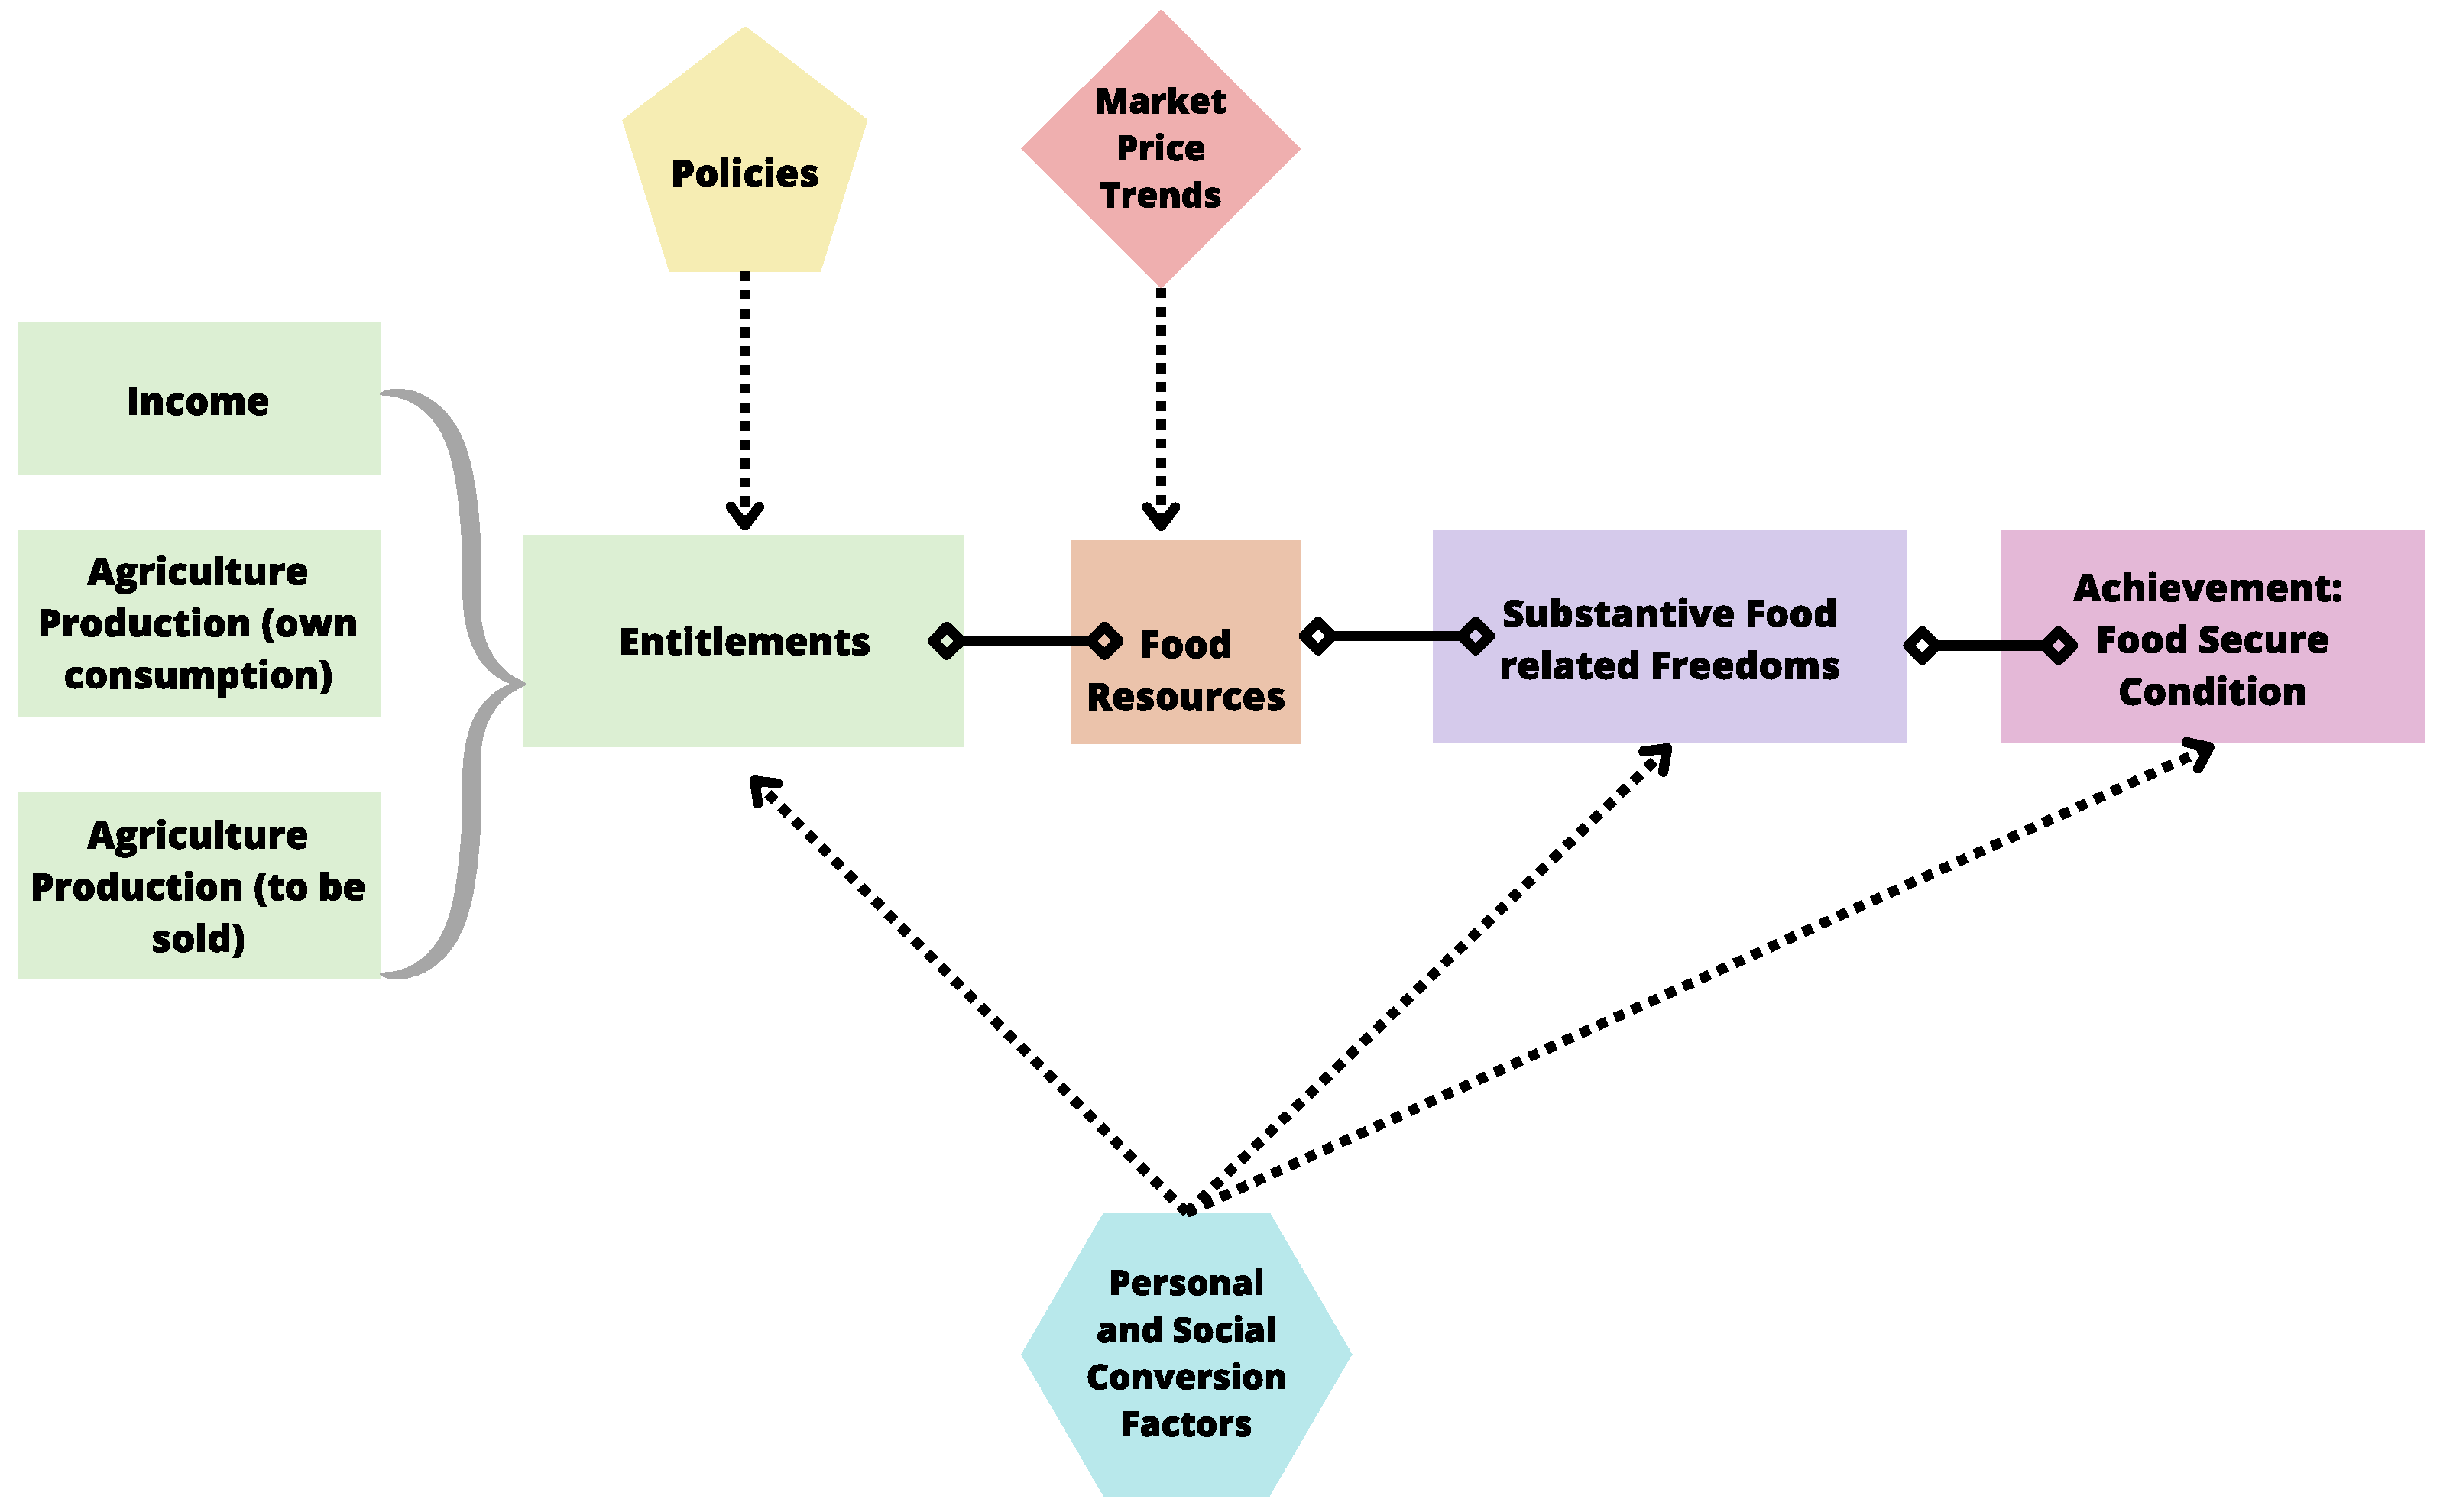
Thus, according to a multidimensional perspective, the state of food security can be outlined as a dynamic flow [25,26] that results in a distinctive mechanism of food access depending on entitlements (i.e., one’s own food production, income earned from the sale of one’s own production and labor income), welfare policies (e.g., means-tested policies) and personal and social conversion factors (e.g., personal heterogeneity, environmental diversity, social context, etc.) and that is influenced by market and price trends (Figure 1).
Furthermore, personal and social conversion factors first convert food resources into food-related substantive freedoms, i.e., the freedom to choose from different combinations of foods that meet one’s nutritional and social needs. Then, individual and social conversion factors turn food-related freedoms into the achievement of a ‘food-secure’ condition in its most comprehensive meaning, encompassing the availability, access and use of food. Therefore, to address the cross-cutting issues of the disconnection between food production and the state of food security, a multidimensional approach seems to be crucial to implement.
3. Access to Healthy and Sustainable Food: Framing the Problem
According to George Kent, who argued that “dignity comes not from being fed, but from being able to feed oneself” [31], food insecurity not only concerns the lack of access to an amount of food sufficient for one’s survival but involves a deprivation in terms of autonomy and control over one’s state of food security, with significant social effects [32,33]. Therefore, it seems crucial to place the food insecurity investigation as a part of a broader analysis of poverty and social exclusion measured in terms of substantive deprivations of freedoms [34,35,36].
Therefore, social exclusion and food insecurity strengthen each other through a multifaceted process of deprivations (i.e., the state of food insecurity implies social stigma, social isolation and anxiety due to the lack of autonomy in accessing food), leading food insecurity to assume a multidimensional and dynamic nature anchored in socioeconomic drivers that are not appropriately corrected by socioinstitutional mechanisms.
The level of unequal access to food available on the market is reflected, at the European level, by the worrying rates of food poverty and social exclusion. Indeed, Europe has experienced an increase in the number of people who are unable to access food [35,36], which is exacerbated by an increase in both absolute and relative poverty and by unstable geopolitical conditions threatening food provisioning. In 2019—one year before the pandemic began—one in five citizens in Europe was at risk of poverty and social exclusion, with 6.8 percent of the European population (almost 27 million people) unable to afford a meal with meat, fish or a vegetarian equivalent every second day. Due to the pandemic, the percentage has increased to 8.6 percent of the EU population [37]. In Italy, 9.9%, i.e., six million people, experienced food poverty in 2020.
Economic difficulties lead to food expenditure being squeezed not only in terms of quantity (thus, reducing the number of meals consumed daily) but also—and above all—in terms of quality and, consequently, of balanced, diverse and nutritious diets [38,39,40]. In the literature, there is growing attention on the strong compatibility between diets with a low ecological footprint and healthy diets [41,42]. For instance, the double pyramid elaborated by the Barilla Center for Food and Nutrition [43] or the diet elaborated by EAT-Lancet [40], which doubles the consumption of fruit, vegetables and legumes while reducing sugar and red meat consumption. According to the most recent data [38], diets that are sustainable for the environment and human health would cost 60% more than a staple diet and five times more than a diet with a predominance of starchy foods [38]. The relationships between the cost of healthy and sustainable diets and the increasing economic difficulties people face in accessing food, lead food security studies to adopt a methodological posture that emphasizes a multidimensional nature, placing special emphasis on people’s ability to access healthy food [44]. Thus, alongside studies investigating food insecurity as an infringement of the right to food, there are also emerging perspectives that address food security as the substantive freedoms of territories and people to access healthy and sustainable food.
The Dimensions of Food Access
There is a growing interest in the concept of foodability [45] in the literature, which refers to an approach that aims to address people’s ability to access a quantity of healthy and nutritious food. Foodability not only identifies the most fragile social groups, but also geographical areas and neighborhoods characterized by critical access to food resources available on the market [46].
Foodability is based on three dimensions:
- i.
- Spatial-temporal dimension, which refers to the ability to reach (in reasonable time) places where food can be purchased.
- ii.
- Economic dimension, i.e., the ability of people to access food, considering prices and household purchasing power; and
- iii.
- Cultural–social dimension, which is related to both people’s ability to access food that meets nutritional and cultural needs (e.g., bio or vegan) and their skills to process, cook and preserve it.
In detail, the spatial-temporal dimension highlights the presence of food retail outlets in the territory, highlighting possible areas of food desertification [47,48,49]. The term food desert was first coined in a London Department of Health Study Project [50] in order to describe urban areas not served by food. It was intended to address the issue concerning closing inner-city outlets and the growth of large supermarkets in suburban areas with difficult access to low-income city residents. As pointed out by Zimmermann [51], food deserts represent a displacement due to the pursuit of larger spaces at an affordable price. More recently, the concept has been used to describe areas with no food outlets or where the food that is sold is of low quality, low-nutritional value and a generally unhealthy nature [52].
Indeed, food deserts can be defined as “parts of the country vapid of fresh fruit, vegetables and other healthful whole foods, usually found in impoverished areas, largely due to a lack of grocery stores, farmers’ markets and healthy food providers” [53].
Therefore, food desert are areas recognized for a lack of physical access to healthy food. Depending on the methodology used, food deserts take on different characteristics.
Thus, some literature focuses on the presence or lack of food outlets in a territory [54,55], concentrating on what is called ‘territorial cohesion’, i.e., an equal distribution of resources and services throughout a territory [56]. In this regard, literature (mainly from the United States) using the concept of walkability has assessed the extent to which individuals are physically near or far from food outlets, using walking distance (generally 10–15 min) as a yardstick for analysis [45].
This perspective assumes that the presence of food outlets automatically leads to equitable access to healthy and nutritious food, ignoring other issues related and connected to food security, such as the nutritional value of food, the affordability (i.e., the economic access) and the presence of solidarity network of civil society initiatives that acts as a buffer against food insecurity (i.e., solidarity access). Retail outlets might be locally present, but the issue of food insecurity might lie in the inability of people to access food through their own economic resources or through the resources provided by solidarity networks. A compromised system of substantive food-related freedoms thus arises.
This research is not focused on single disruptions in the local food system (e.g., a lack of retail outlets); instead, we interpret food security through a multidimensional perspective, investigating this issue within the broader context of poverty and social exclusion. Indeed, the socioeconomic dimension of food insecurity takes on a crucial role, especially in the urban context, where money (including income from work or forms of public social support) represents the main means to access to food [41]. Furthermore, the economic crisis and the socio-health crisis linked to the spread of COVID-19, have exacerbated the problem of food insecurity, with an increasing number of people who, due to job displacement or inadequate income and insufficient social transfers, are compelled to turn to local solidarity networks to achieve food security [57,58].
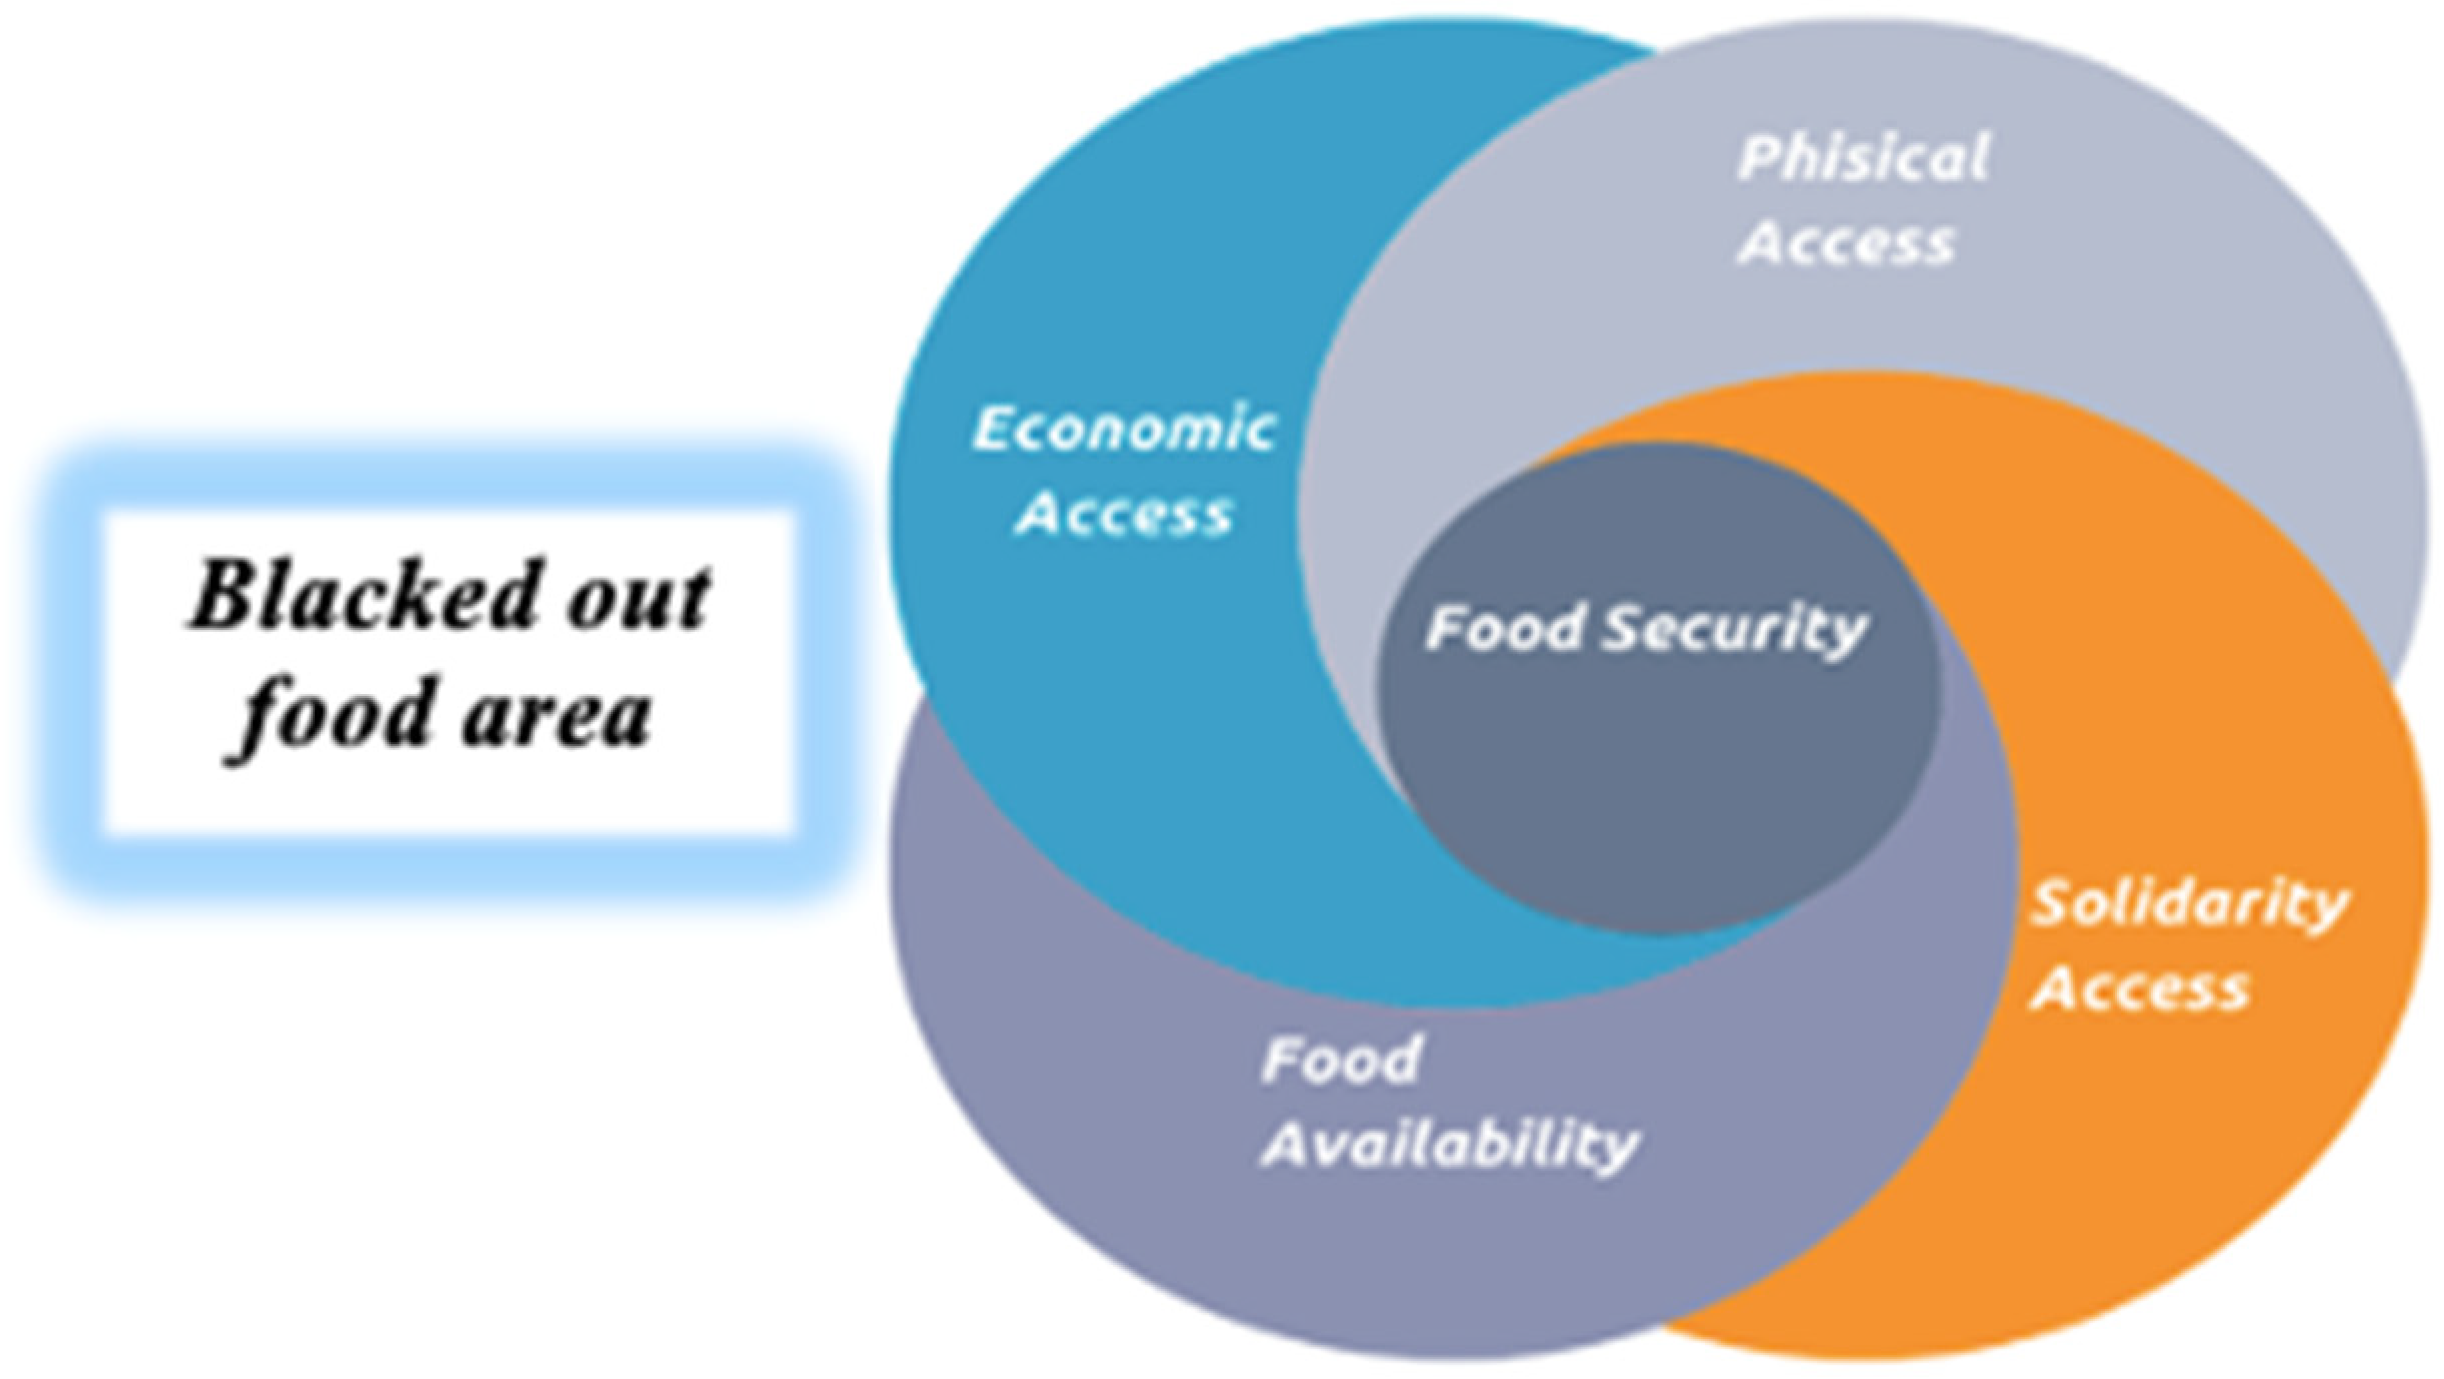
Thus, the aim of this research is to address food security in terms of: (a) food availability and physical access, in other words, the presence or absence of food retail outlets; (b) the economic access, hence, the ability of people to access healthy and sustainable diet (developing an innovative and experimental affordability index); (c) the solidarity access, i.e., the presence of solidarity networks to tackle food insecurity. Using a mapping tool, this multidimensional study (see Figure 2) can help to identify the presence of blacked-out food areas, which are defined as areas where people are socially excluded and, therefore, cannot enjoy the same substantive food-related freedoms as people in other areas. Therefore, these are areas where there are simultaneously no food outlets, compromised affordability and an absence of solidarity networks.
4. Case Study: The Metropolitan City of Rome
In Lazio Region, according to ISTAT (The National Statistical Institute) data [59], approximately 600,000 people lived in poverty in 2020. The Region’s territorial context presents a strong sociodemographic diversification, and wealth disparity which is typical of regions with large metropolis.
In the Metropolitan City of Rome (121 Municipalities), the average income per taxpayer in the metropolitan hinterland is EUR 18.629, compared with EUR 22.818 in the Municipality of Rome. However, there are higher average municipal taxable incomes than in Rome, such as in the municipalities of Formello (EUR 25.426) and Grottaferrata (EUR 25.374). There are lower average incomes compared to Rome in the municipalities of Vallepietra (EUR 11.039) and Percile (EUR 14.323) [60].
According to Lelo, Monni and Tomassi [61], income is unequally distributed in the Municipality of Rome. Using data from the Ministry of Economy and Finance on the incomes declared by Roman taxpayers for 2019, the city’s economic inequalities emerge. Thus, it can be noted that among Rome’s districts, the average income per taxpayer is highest in districts I and II, particularly the areas of Parioli, Quirinale and Spagna. The lowest average income can be found in social housing districts and former illegal housing suburbs, e.g., the VI district (such as, Tor Bella Monaca and Ponte di Nona).
In Rome, according to 2019 Caritas Report (the report of the pastoral body of the Italian Bishops’ Conference for the promotion of charity), the share of people with incomes below EUR 35,000, was 80% among the entire population [62]. Since the beginning of the pandemic, poverty in Rome has increased drastically. The ISTAT’s BES 2020 Report on “Fair and Sustainable Wellbeing in Italy” [63], highlights the worrying increase in material deprivation affecting the city. Indeed, 9.4 % of the Roman population is experiencing difficulties due to the inability to meet unexpected expenses or those related to the housing (such as mortgages or bills). Applications for Citizen’s Income have also increased; in 2020, in the Municipality of Rome, such applications have involved 80,351 people, whereas Citizen’s Pensions applications have involved 6629 people.
As shown by the research by Lelo, Monni and Tomassi [61], which has applied the UNDP’s Human Development Index at the level of Rome’s districts, the economic inequalities are also reflected in social inequalities. In districts that are richer, people study more and have better health conditions, while poorer districts suffer from educational and health inequalities among their inhabitants. This is confirmed by the distribution of COVID-19 infections, which occur—with greater intensity—in the most vulnerable areas of the city [64].
The economic dimension also affects the access to food. Before the beginning of the pandemic, Caritas Rome, in its report “Poverty in Rome: a point of view” [62], highlighted the increase in the number of people (called by Caritas as the “equilibrists of poverty”) forced to squeeze their food expenditure to be able to meet rent, utility bills and loan payments. Social fragility is also confirmed by the data of “Social Policies Department—Reception and Inclusion Division” of the Municipality of Rome, regarding the free distribution of meals: in 2019, 106,300 meals and 3226 food parcels were distributed monthly by solidarity canteens, home, and street assistance. Due to the pandemic, the food assistance system was able to count both on the distribution of food vouchers, which were distributed to approximately 70,000 families (involving a total of 200,000 people) for a value of EUR 21 million, and on the distribution of 45,000 food parcels.
Investigating food insecurity in Rome is not easy. Indeed, the lack of systemic analysis of the phenomenon is associated with a lack of data. The only available data come from the databases of several civil society initiatives dealing with poverty and which, therefore, provide a partial/fragmented picture of food insecurity linked to the distribution of food aids [65].
5. The Research Stages: How to Develop an Affordability Index
In this paper, the focus is both on the presence of food retailers and solidarity food distribution initiatives in the Metropolitan City of Rome and on the economic capacity to access healthy and sustainable food, highlighting any potential blacked-out food areas.
As has already been highlighted, it is crucial to consider food from a multidimensional perspective, assessing whether people have effective, safe, and socially guaranteed access to healthy food that meets their nutritional and cultural needs and is also environmentally sustainable. On the basis these premises, in this research, we developed an affordability index that analyzes both the quantitative and qualitative dimensions of food security, with a focus on the nutritional and environmental aspects. Therefore, we first identified a healthy and sustainable diet model for a family of four (two adults and two children) based on the “Guidelines for a healthy diet” published in 2018 by CREA (Council for Agricultural Research and Analysis of Agricultural Economics) [39]. The diet model identified focuses on the consumption of fruit, vegetables, cereals, legumes, eggs, and milk and dairy products, limiting the consumption of alcohol, sugar, red meat, frozen products, and processed meats. Based on this diet, a price survey was carried out at nineteen points of sales in Rome, to reveal the cost of ‘healthy and green’ food shopping in the various distribution channels.
This study is based on:
- ▪
- ‘Non-branded’ products available in discount shops.
- ▪
- Mass-market retailer (MMR) labels.
- ▪
- Branded products available from MMRs; and
- ▪
- Organic food purchased from ‘discounters’, ‘MMRs’ and ‘specialized shops’.
According to this survey, the average cost of shopping at discounters (EUR 721) allows a family of four to save 7% compared to shopping for MMR label products (EUR 774) and 6% compared to branded products present in the large-scale retail trade (EUR 767). On the contrary, analysis of the food expenditure of organic products at the three distribution channels shows that the expenditure with the lowest cost occurs in organic MMR shops (average monthly cost of EUR 1.449), whereas the organic expenditure at discount shops (EUR 1.617) is 10% higher than at MMRs but 23% less than that of organic products purchased through the “specialized organic shops” channel (EUR 1.989). Using these findings, an affordability index for healthy and sustainable diet has been developed. The affordability index (AI) measures the distance between the actual incidence of expenditure on healthy, sustainable diet compared to the average values. The greater the distance between these two values, the greater the difficulty in accessing to healthy and sustainable diet.
The index is based on the following equation:
The A factor is calculated using ISTAT data on household consumption, in particular, the average monthly data on food expenditure compared to total consumption. The ISTAT data are recalibrated with a correction coefficient that considers the territorial district (central Italy), the type of municipality (rural/urban; municipalities with up to 50,000 inhabitants; central metropolitan area; periphery metropolitan area) and the number of household members. Thus, the data vary between municipalities in the metropolitan area.
The B factor is expressed by the ratio of expenditure on healthy and sustainable diet to the declared monthly income (data provided by the Italian Revenue Agency). In other words, it measures the proportion of healthy and sustainable diet expenditure on the monthly income.
Thus, the index measures the ratio between the percentage of actual food expenditure on total consumption, and the percentage of a healthy and sustainable expenditure to declared income.
An index value less than 1 indicates that the household’s income provides more access to a healthy and sustainable diet than the average and, therefore, that the household has a comparative advantage in accessing food; on the contrary, whether the value is more than 1, the household has a relative disadvantage in accessing to healthy and sustainable diet compared to the average.
Thus, the developed index was calculated for all six ‘points of sale/product type’ combinations, for all 121 municipalities of the Metropolitan City and, in the case of Rome, for the 15 districts.
For example, as shown in Table 1, the inhabitants of Affile would have to earn 17% more to be able to afford a healthy and sustainable diet at the discount stores. In contrast, the inhabitants of Albano Laziale earn 2% more than the budget needed to access to healthy and sustainable diet at the discount stores.
6. Economic, Physical and Solidarity Access to a Sustainable and Healthy Diet
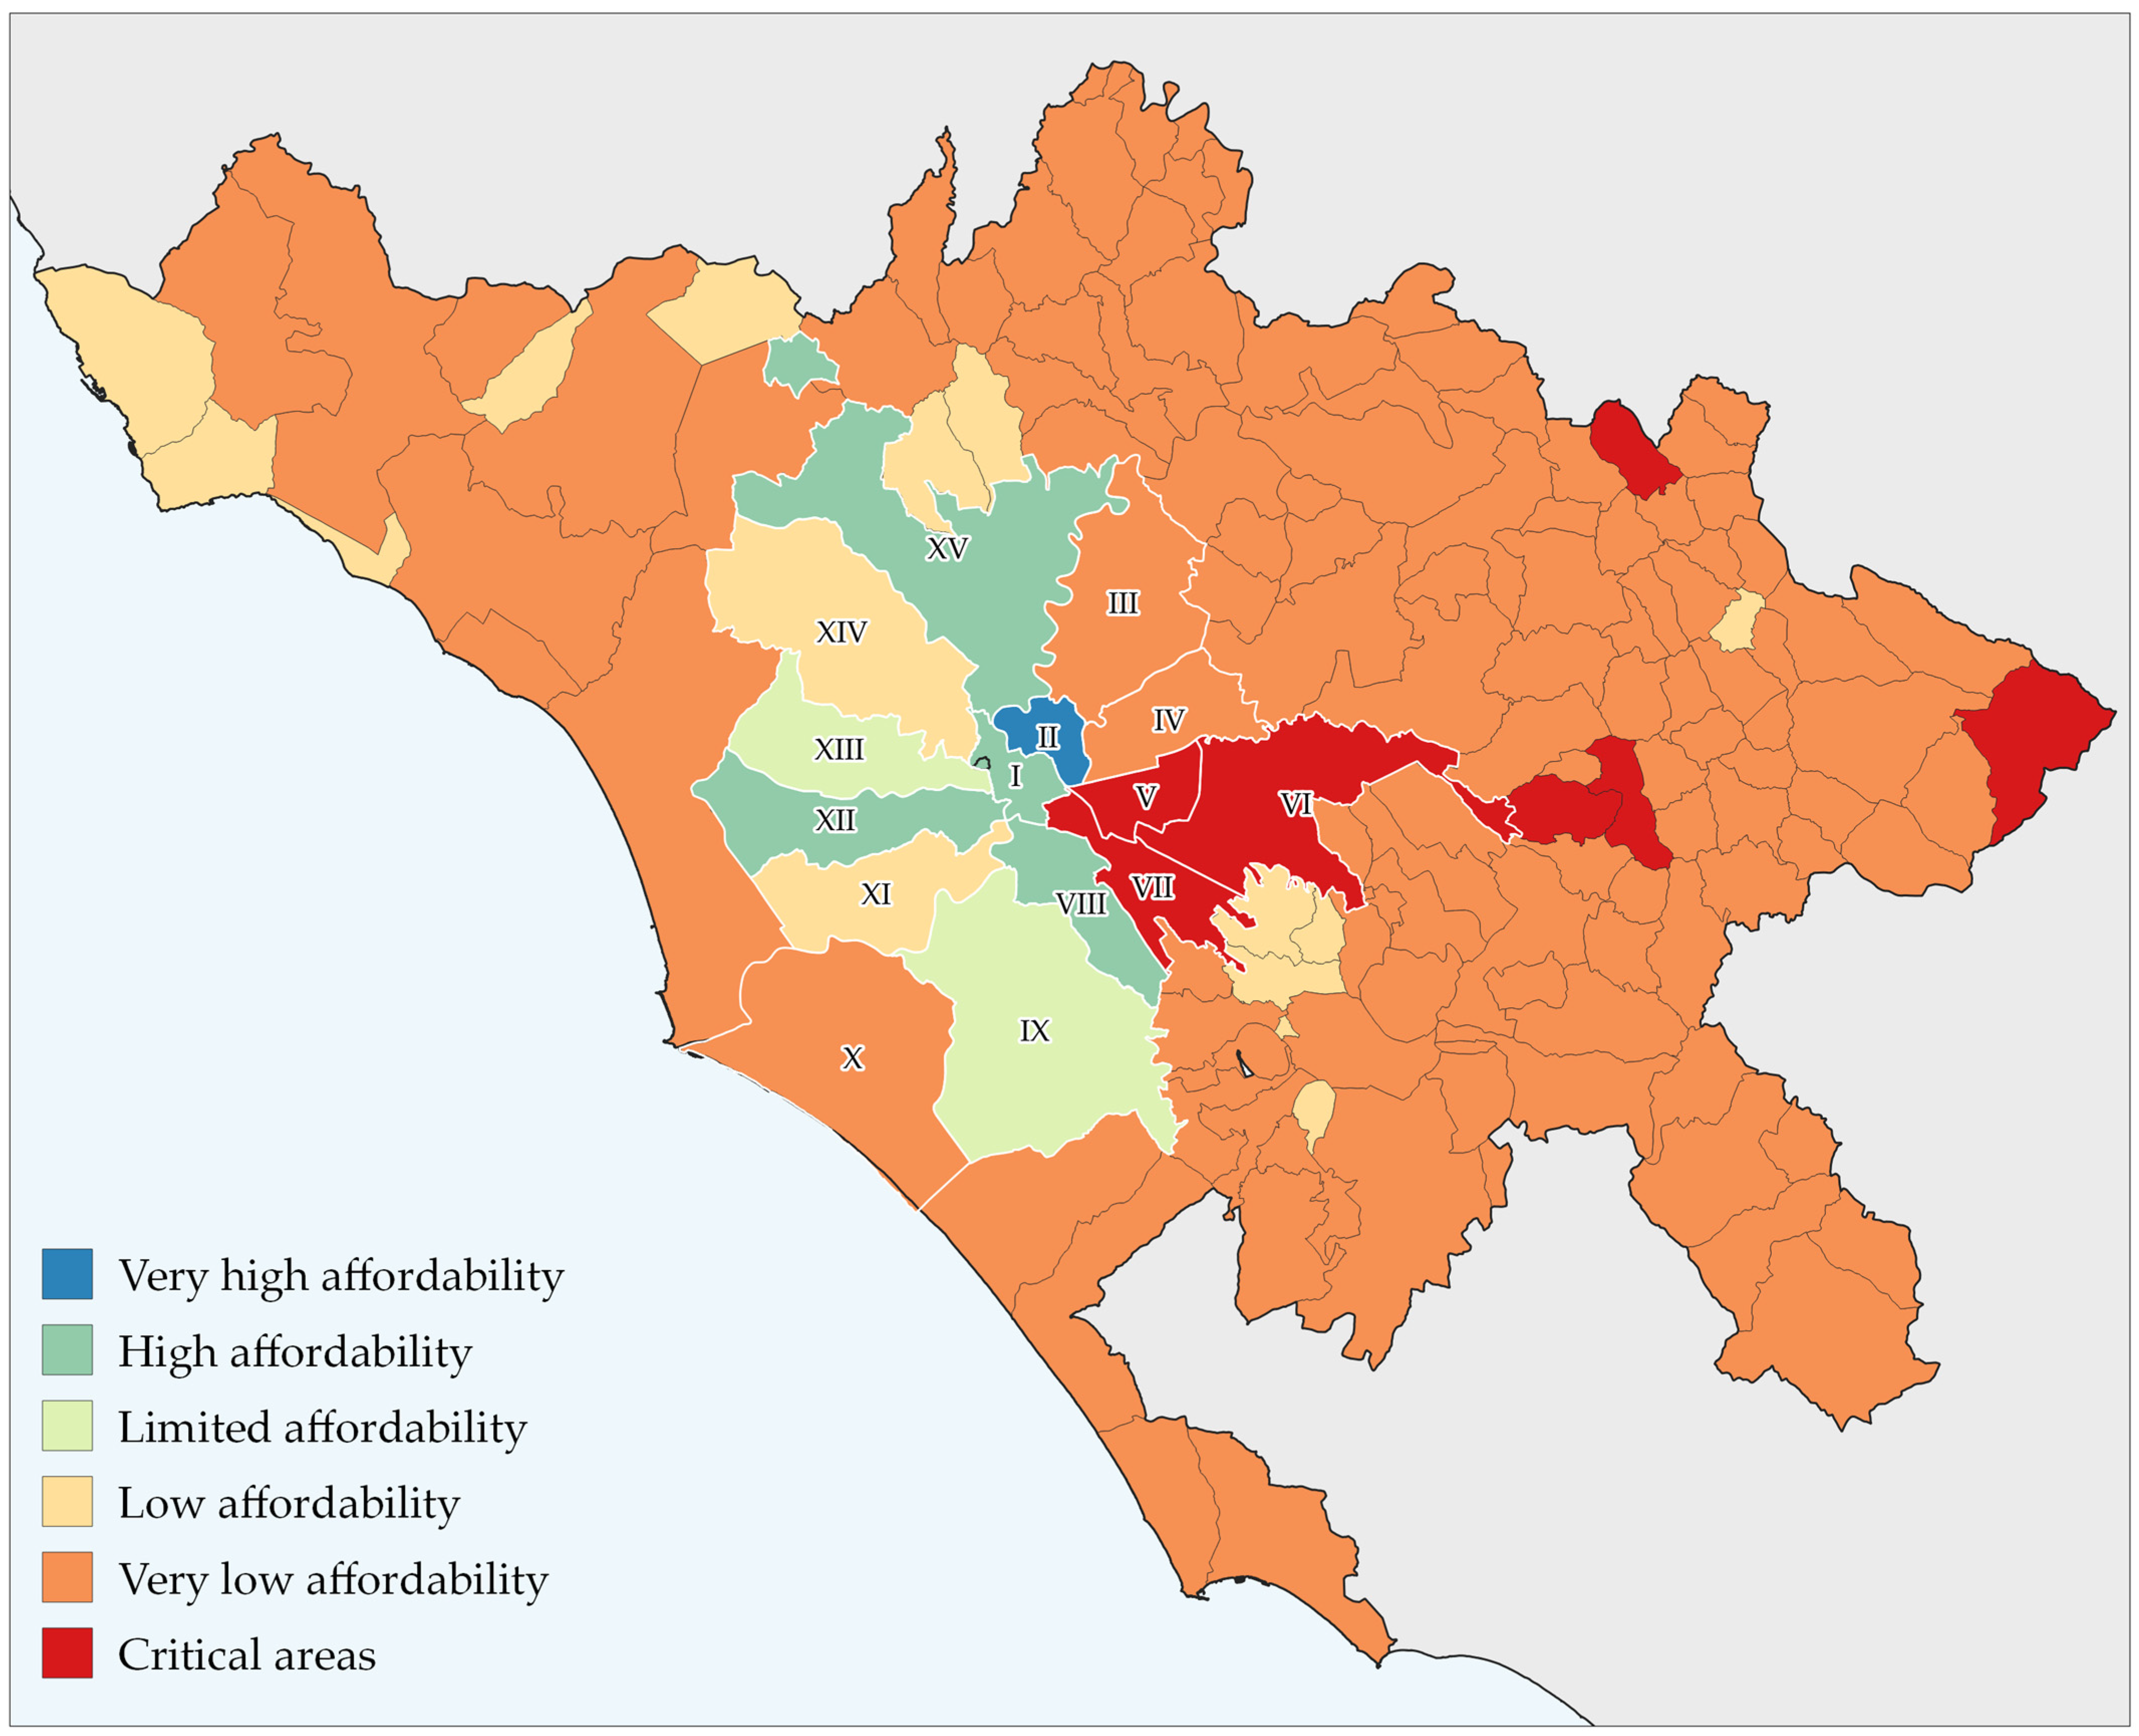
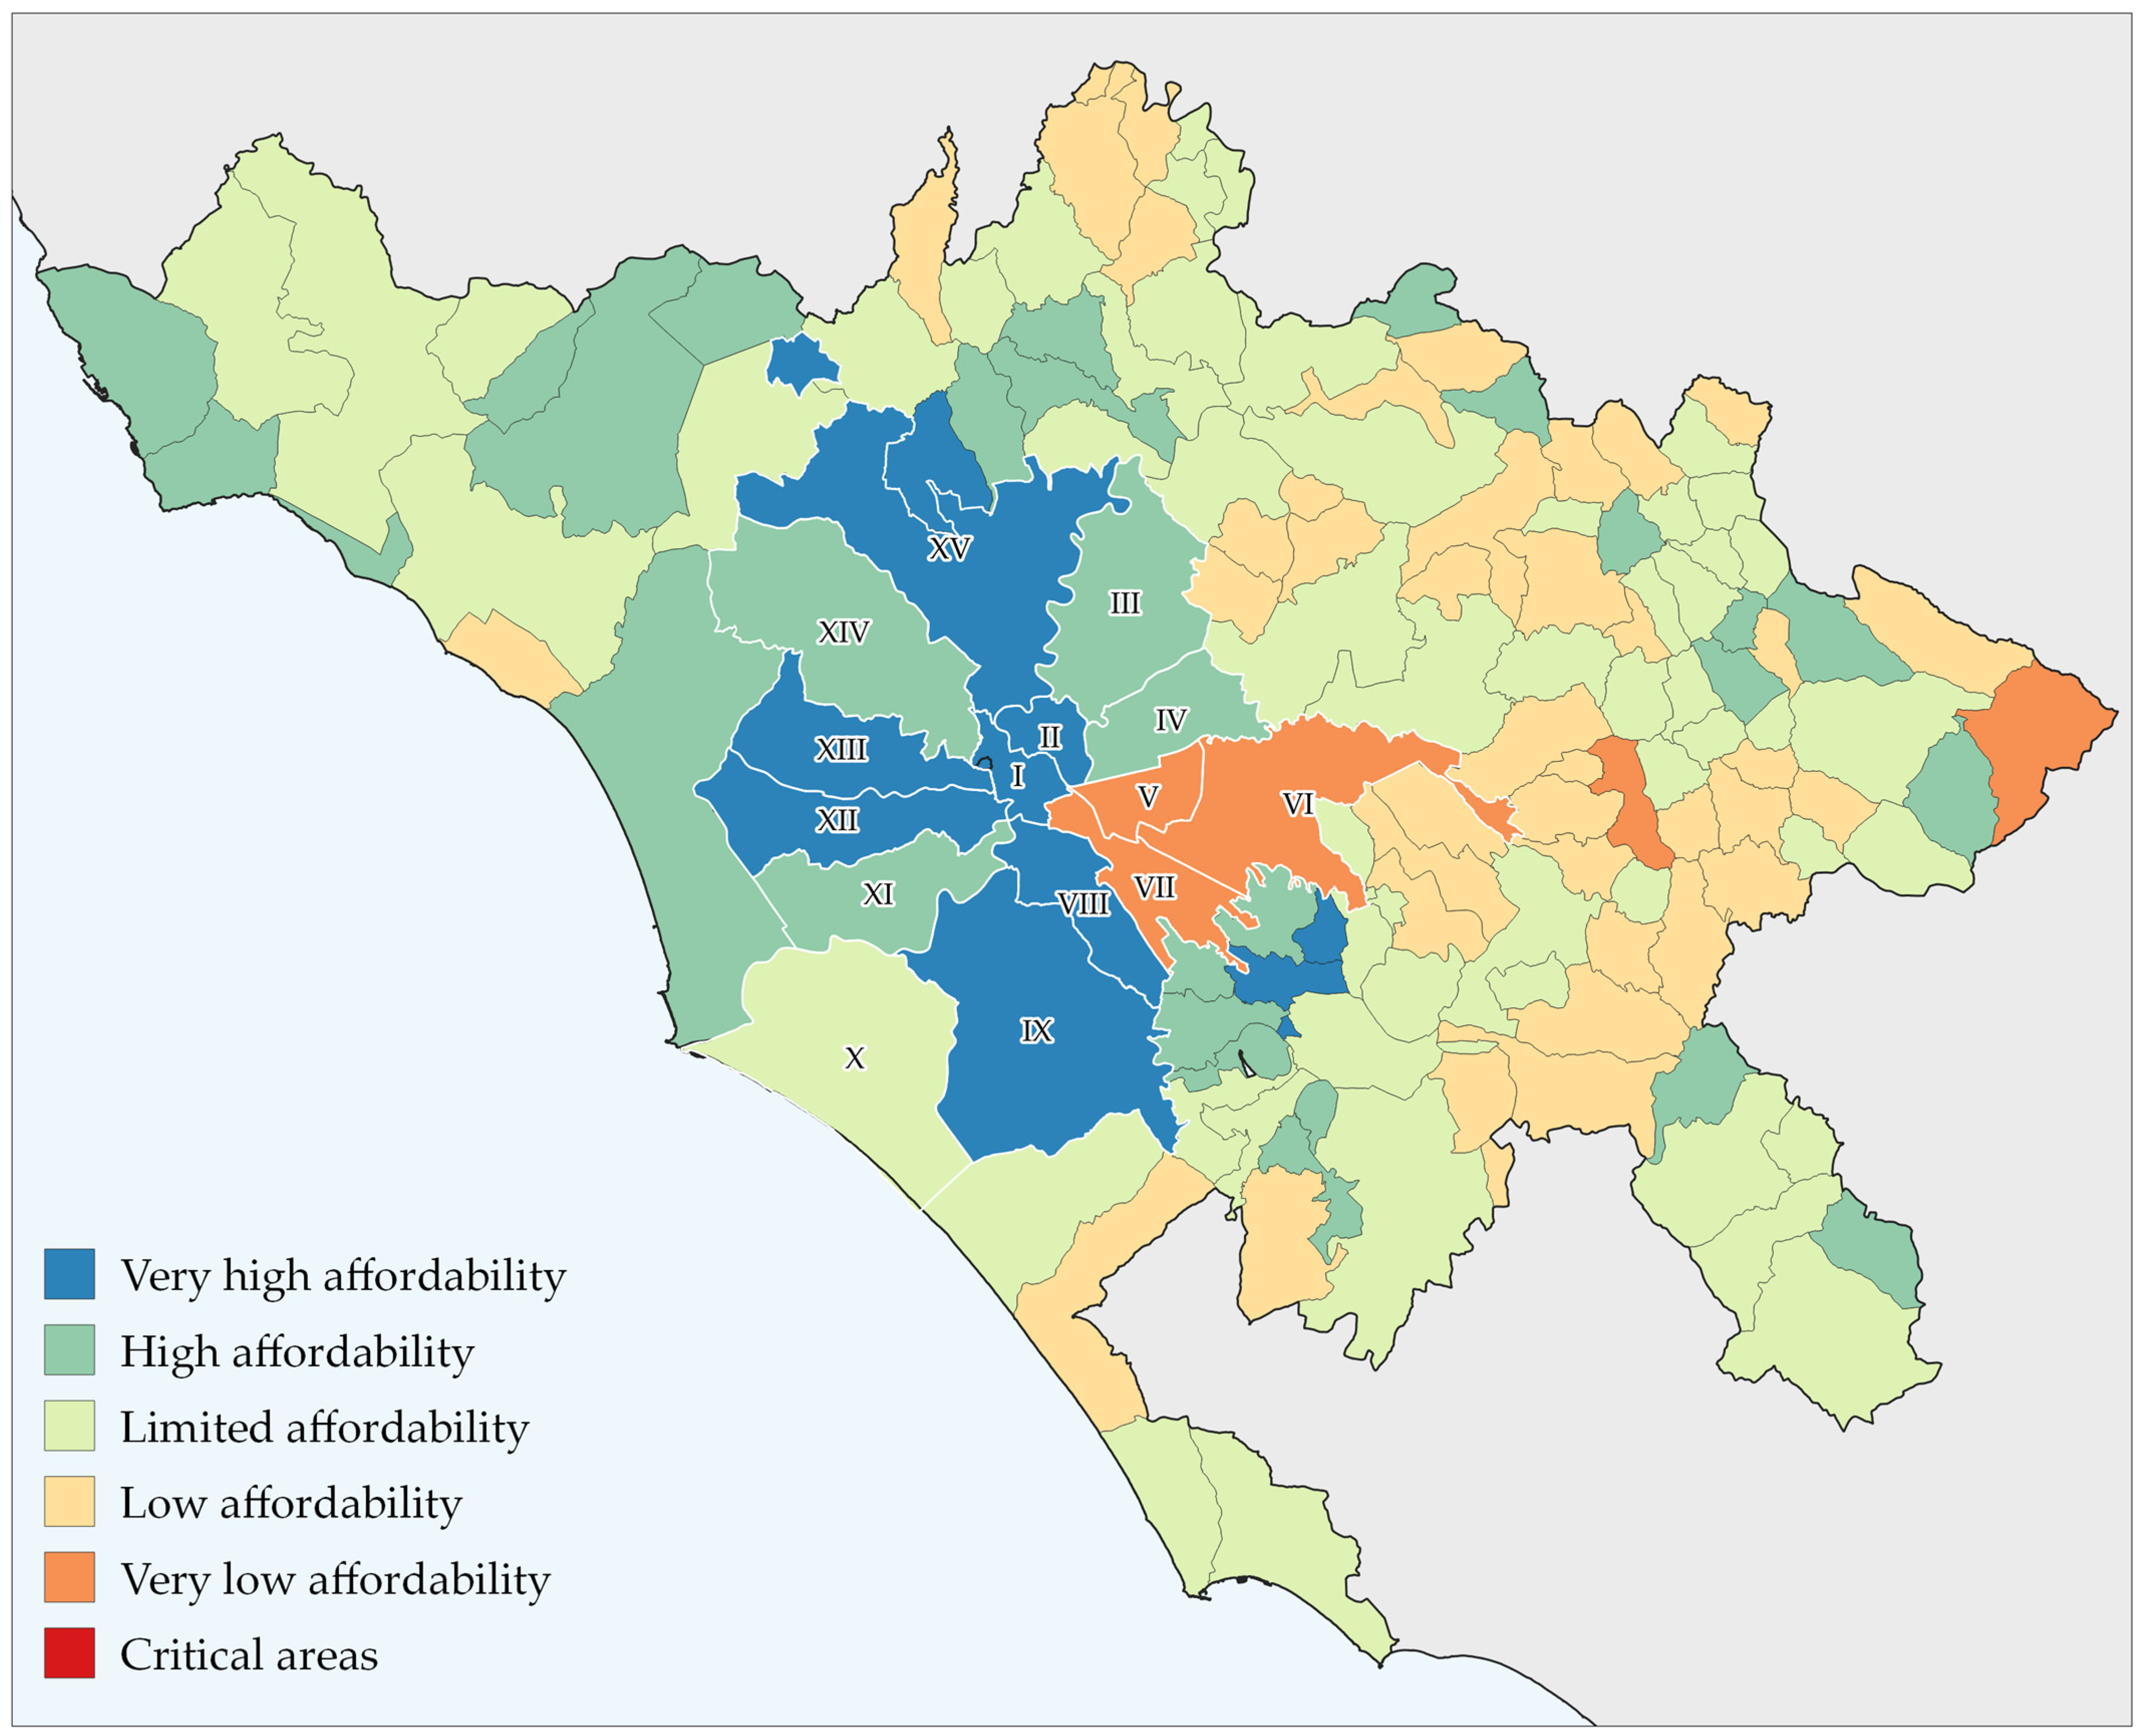
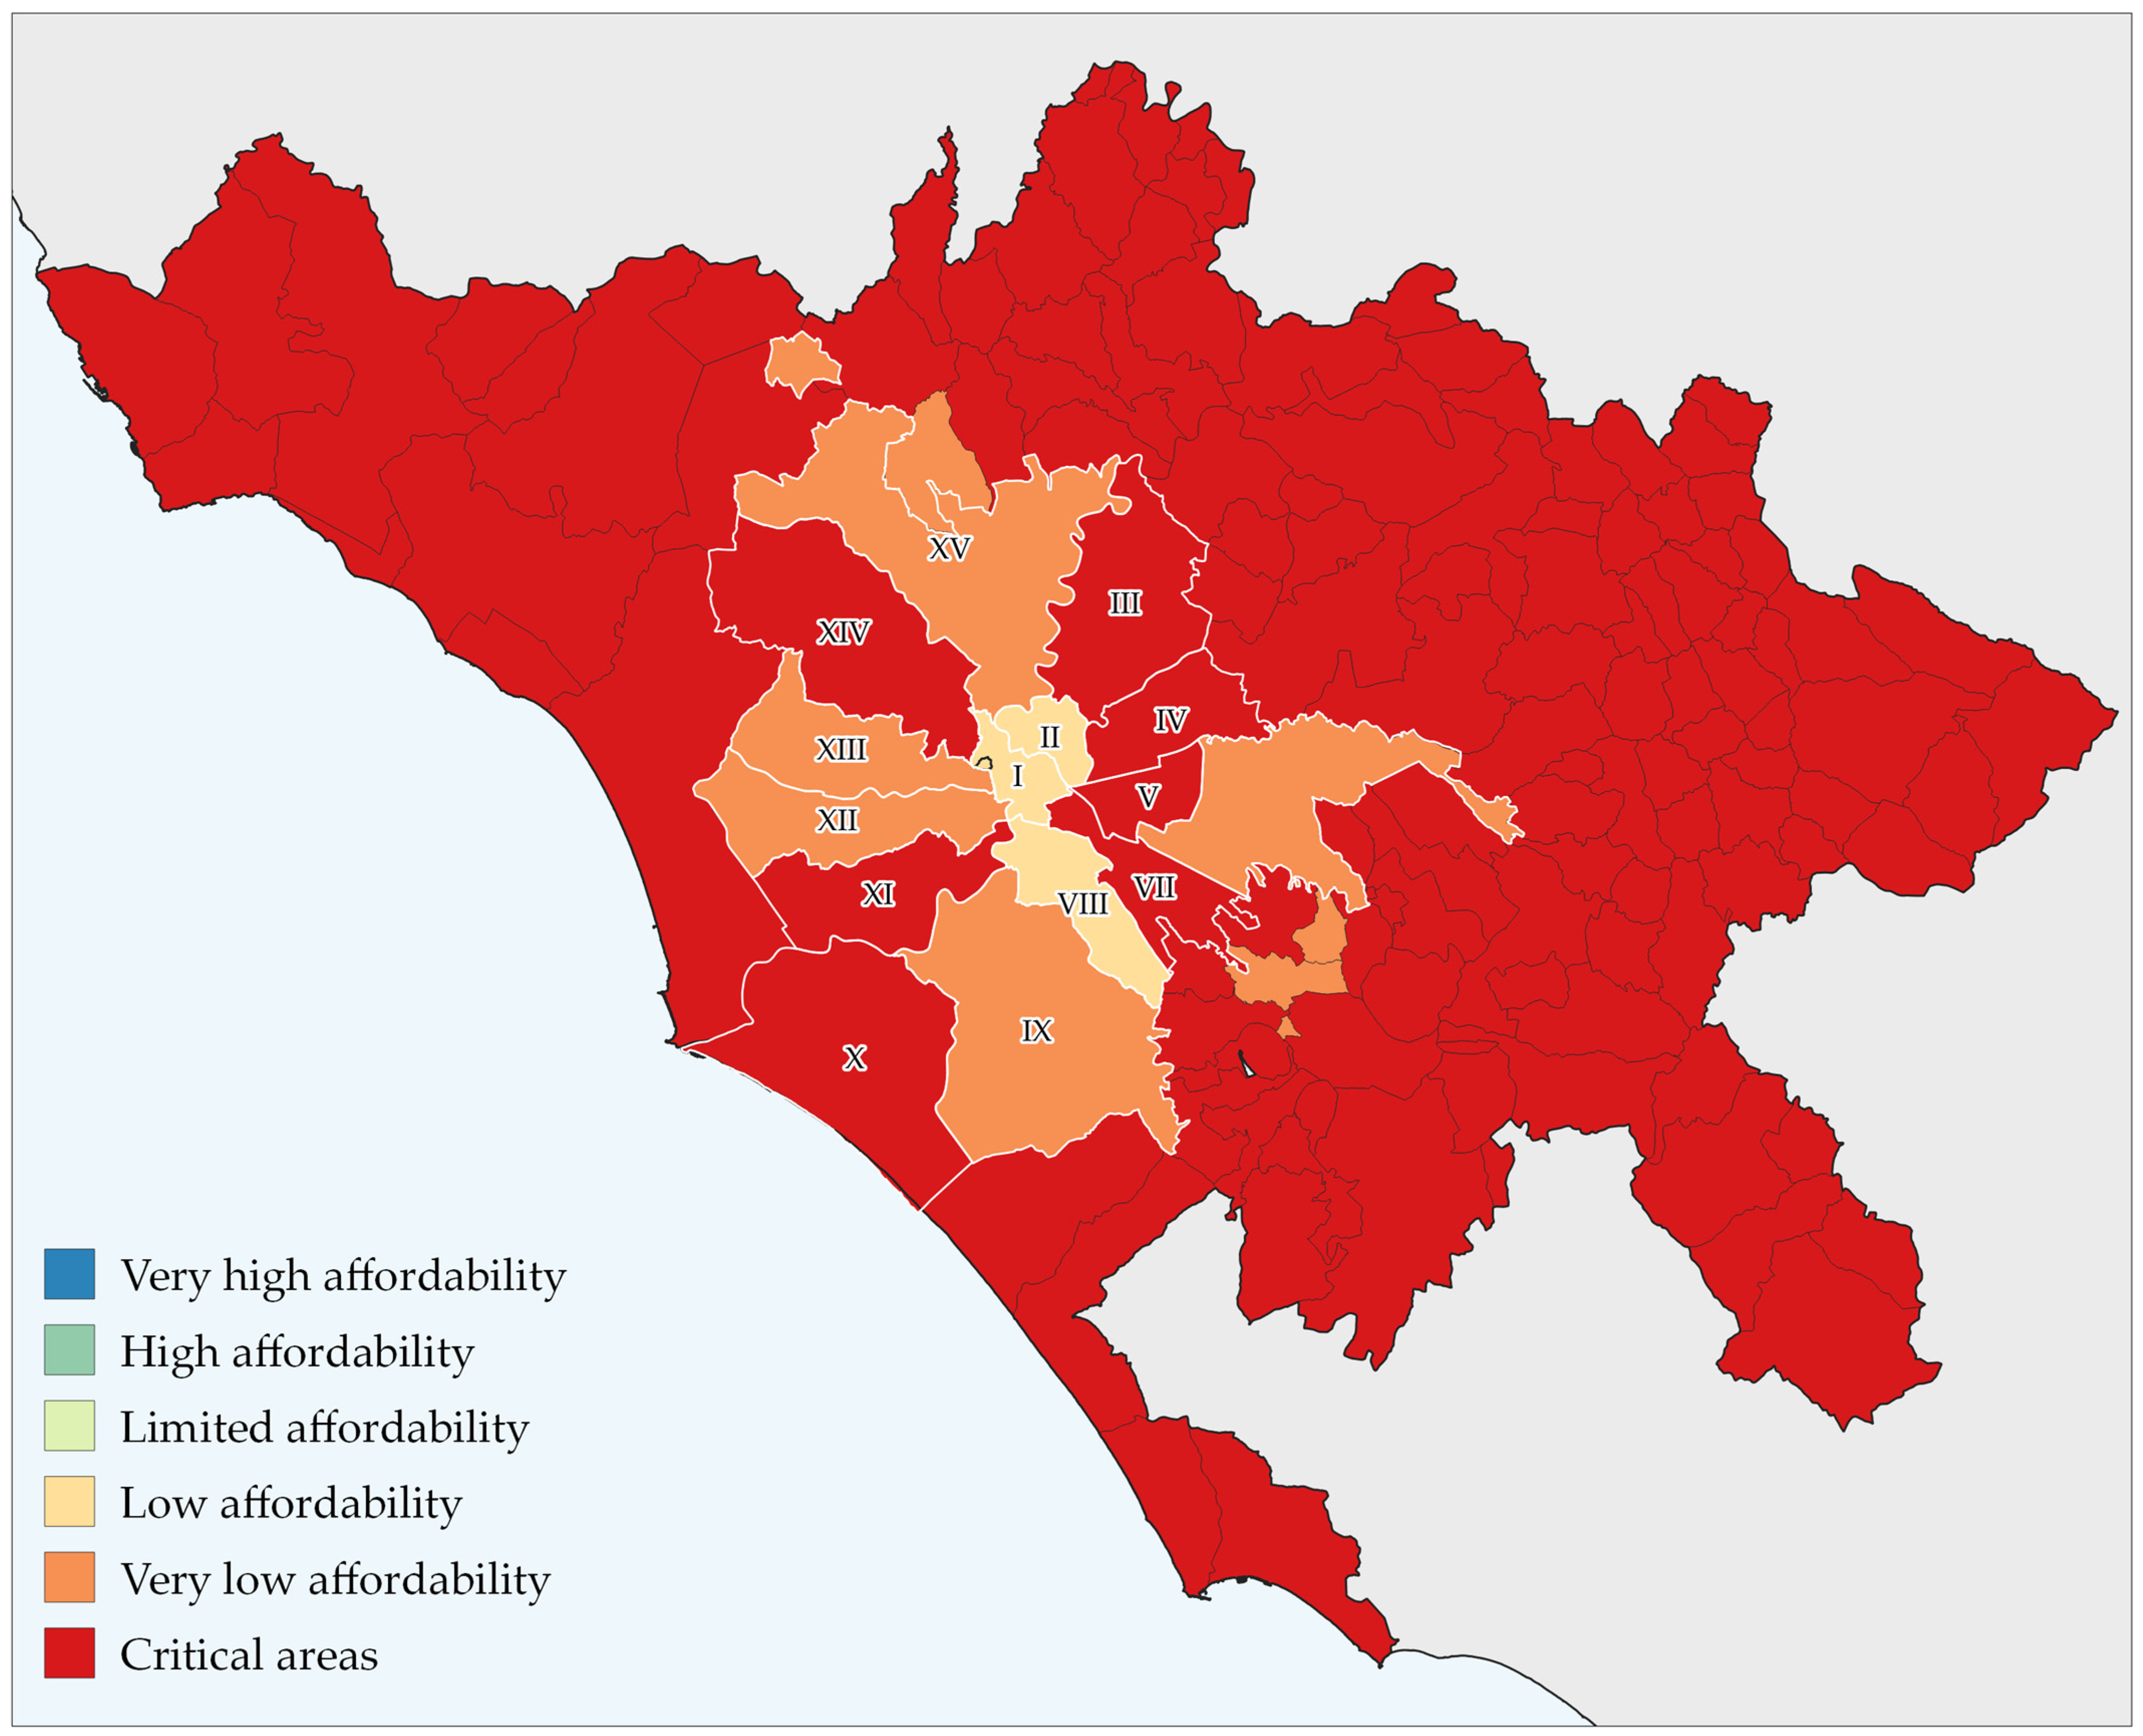
In order to understand the spatial distribution of inequalities in accessing to sustainable and healthy diet -in the MCRC municipalities and Rome districts-, the mapping provides a picture of the most vulnerable areas. Figure 3 shows the degrees of AI, from the areas characterized by “very high” affordability, where people earn 21% more than they need to afford a healthy and sustainable diet, to the “critical areas”, where inhabitants would have to integrate their income by +115% to access healthy and sustainable diet. In the MCRC, the ‘average’ AI shows that almost all the municipalities in the Metropolitan City have ‘very low’ affordability. The presence of four ‘critical areas’ also emerges: Poli, Capranica Prenestina, Percile and Vallepietra. In the Municipality of Rome, the ‘critical areas’ are districts V, VI and VII. High affordability is recorded only within the Municipality of Rome, namely in districts I, VIII, XII and XV. The only district with ‘very high’ affordability is district II.
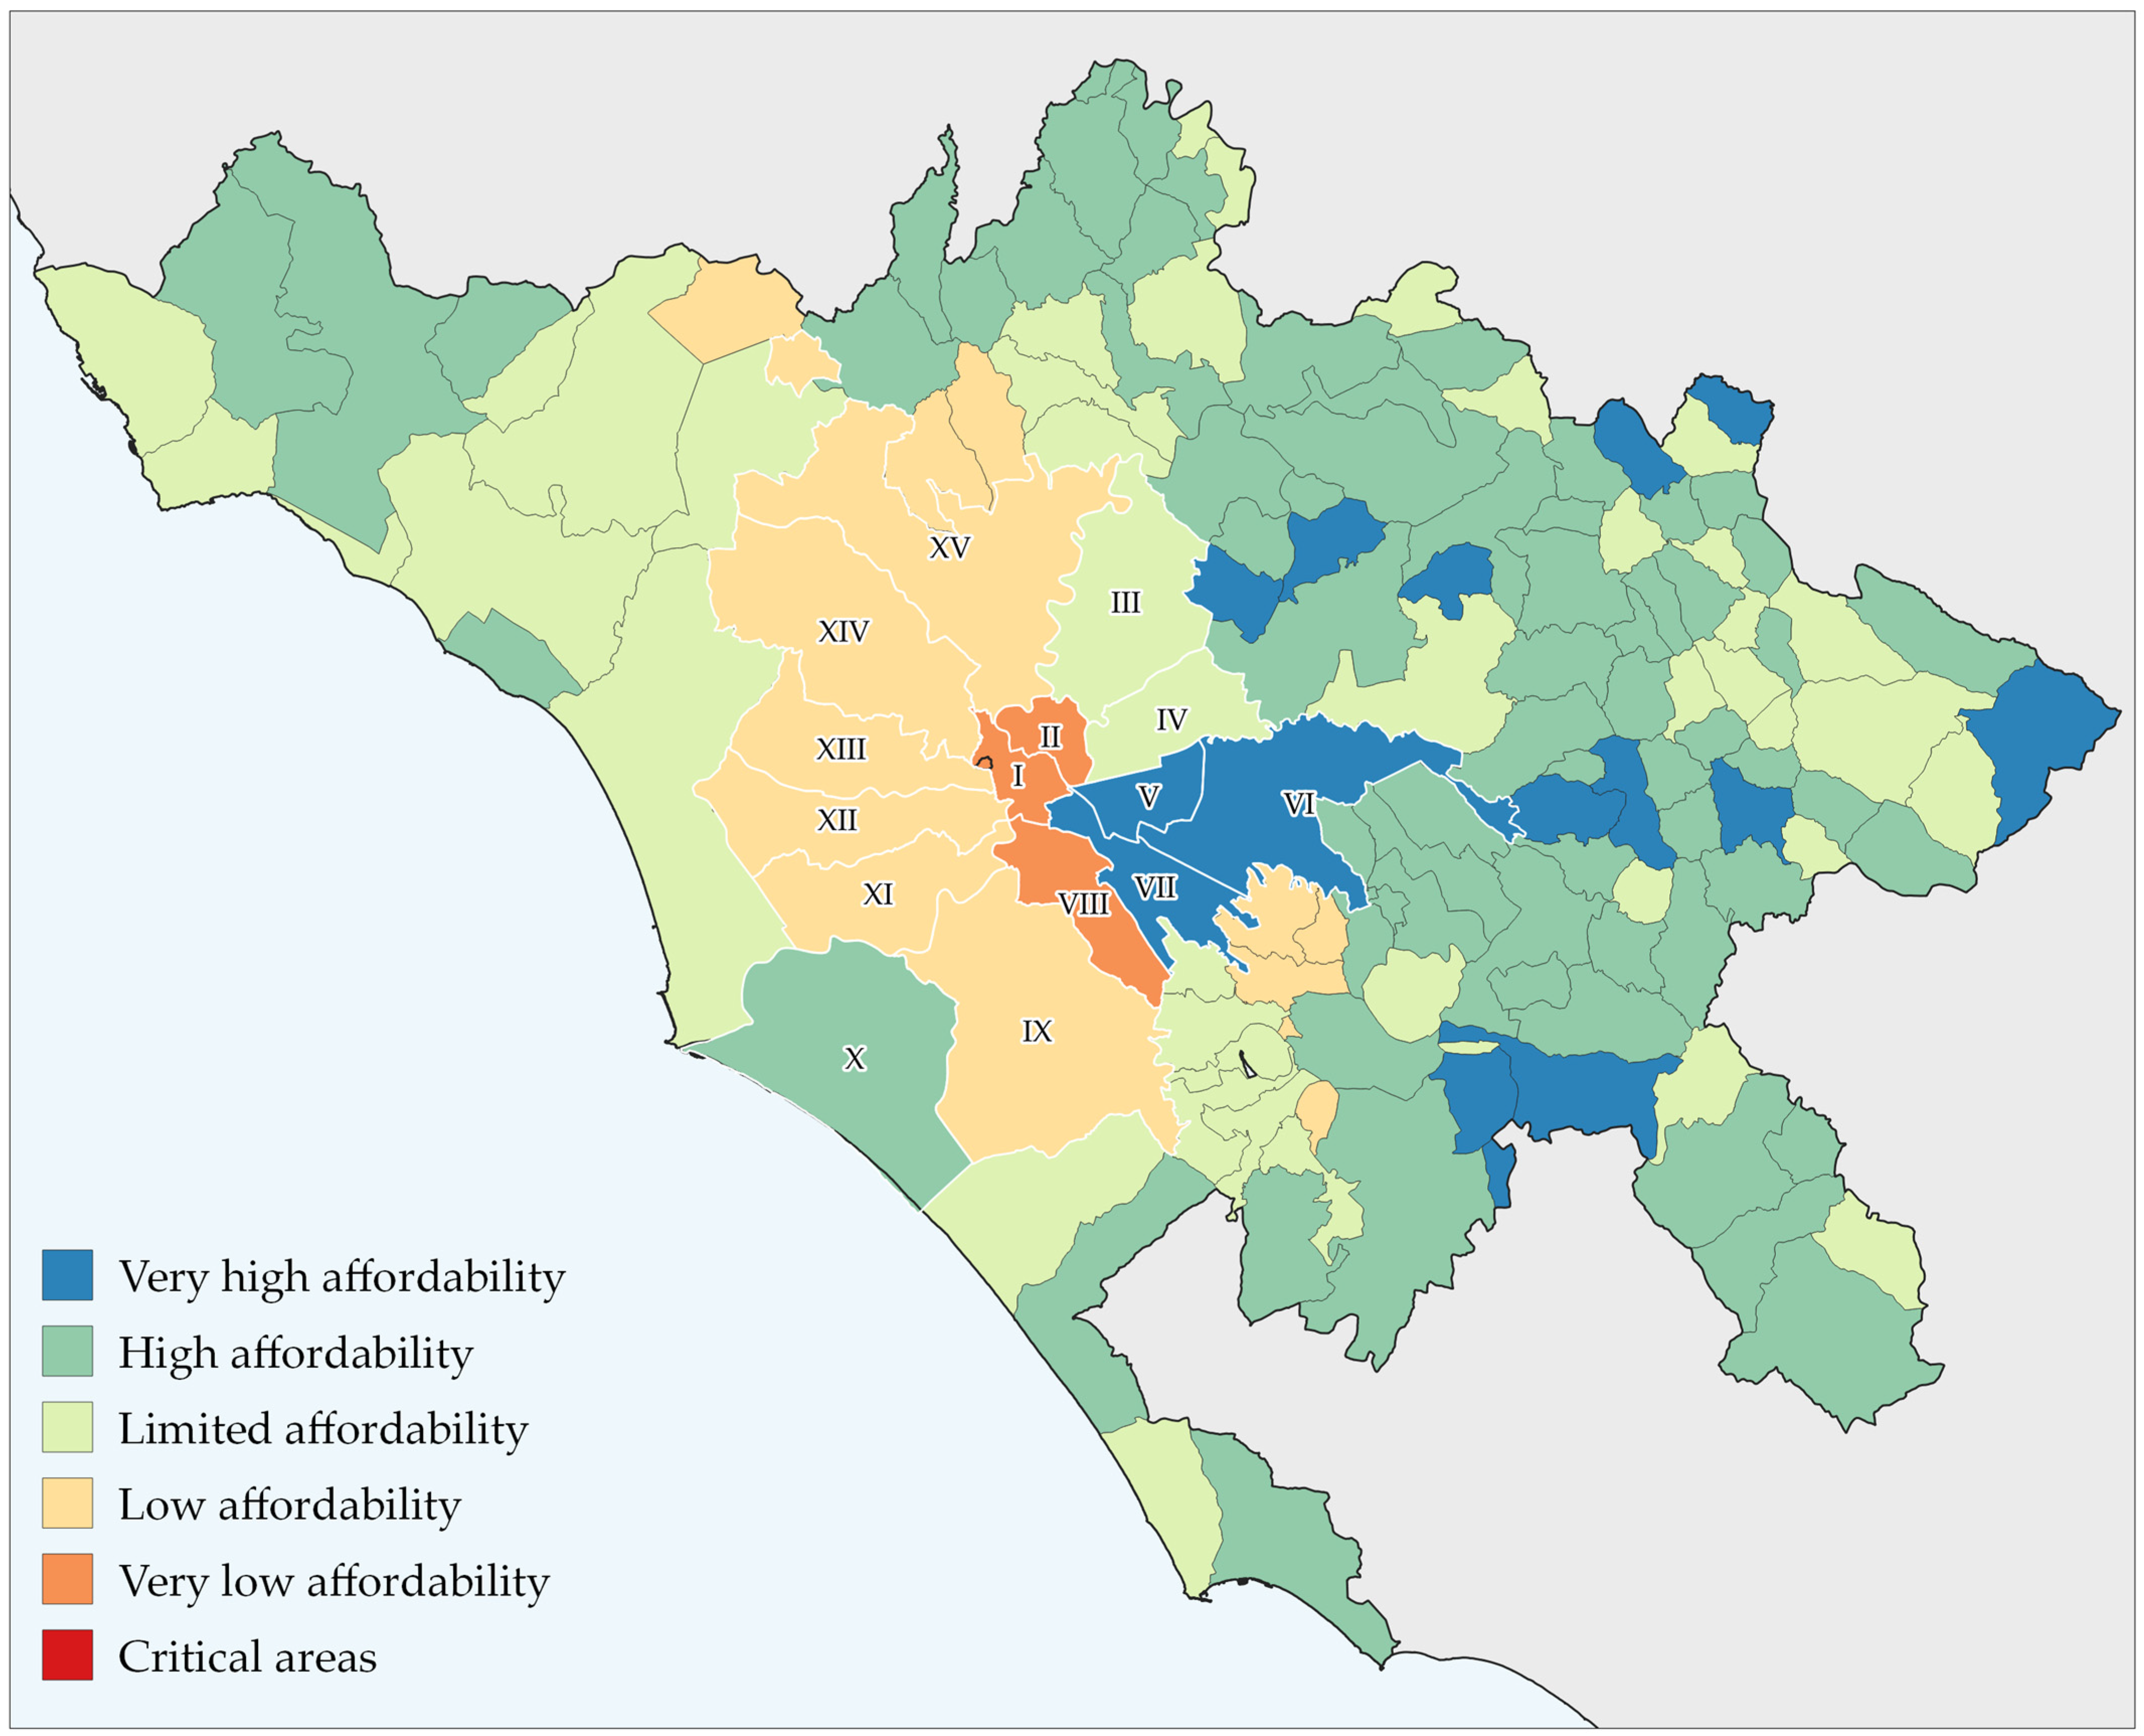
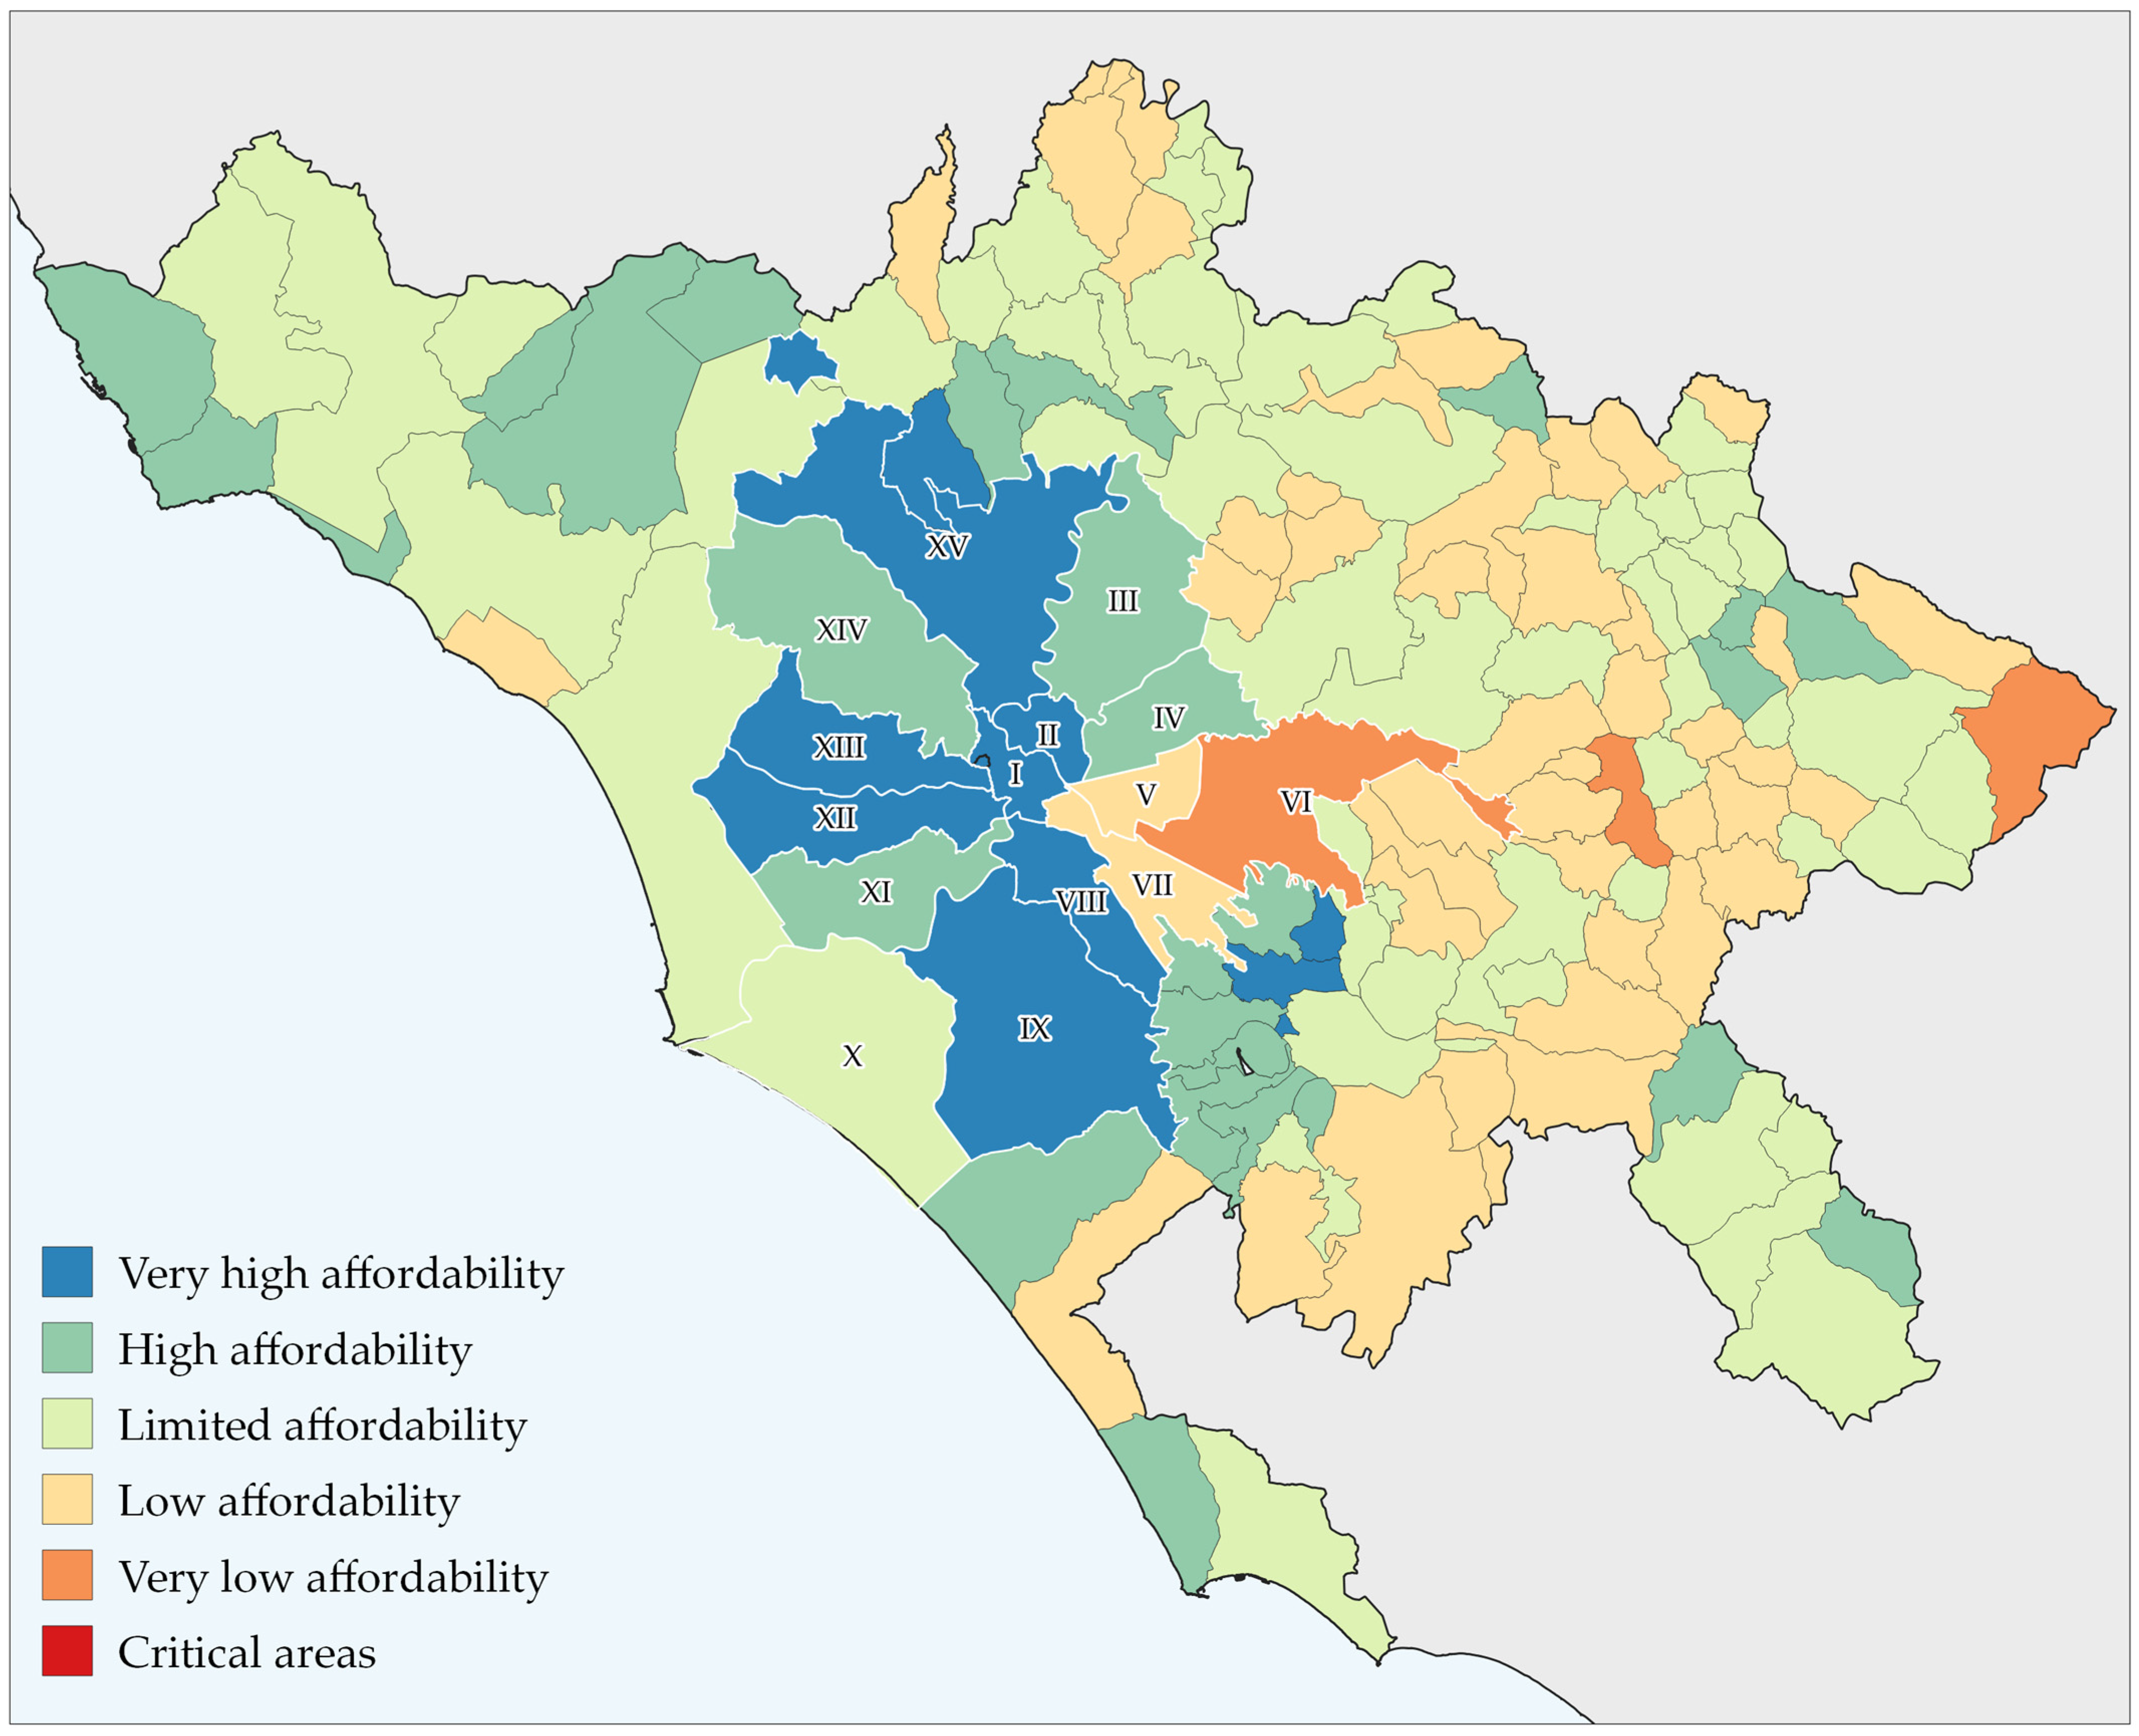
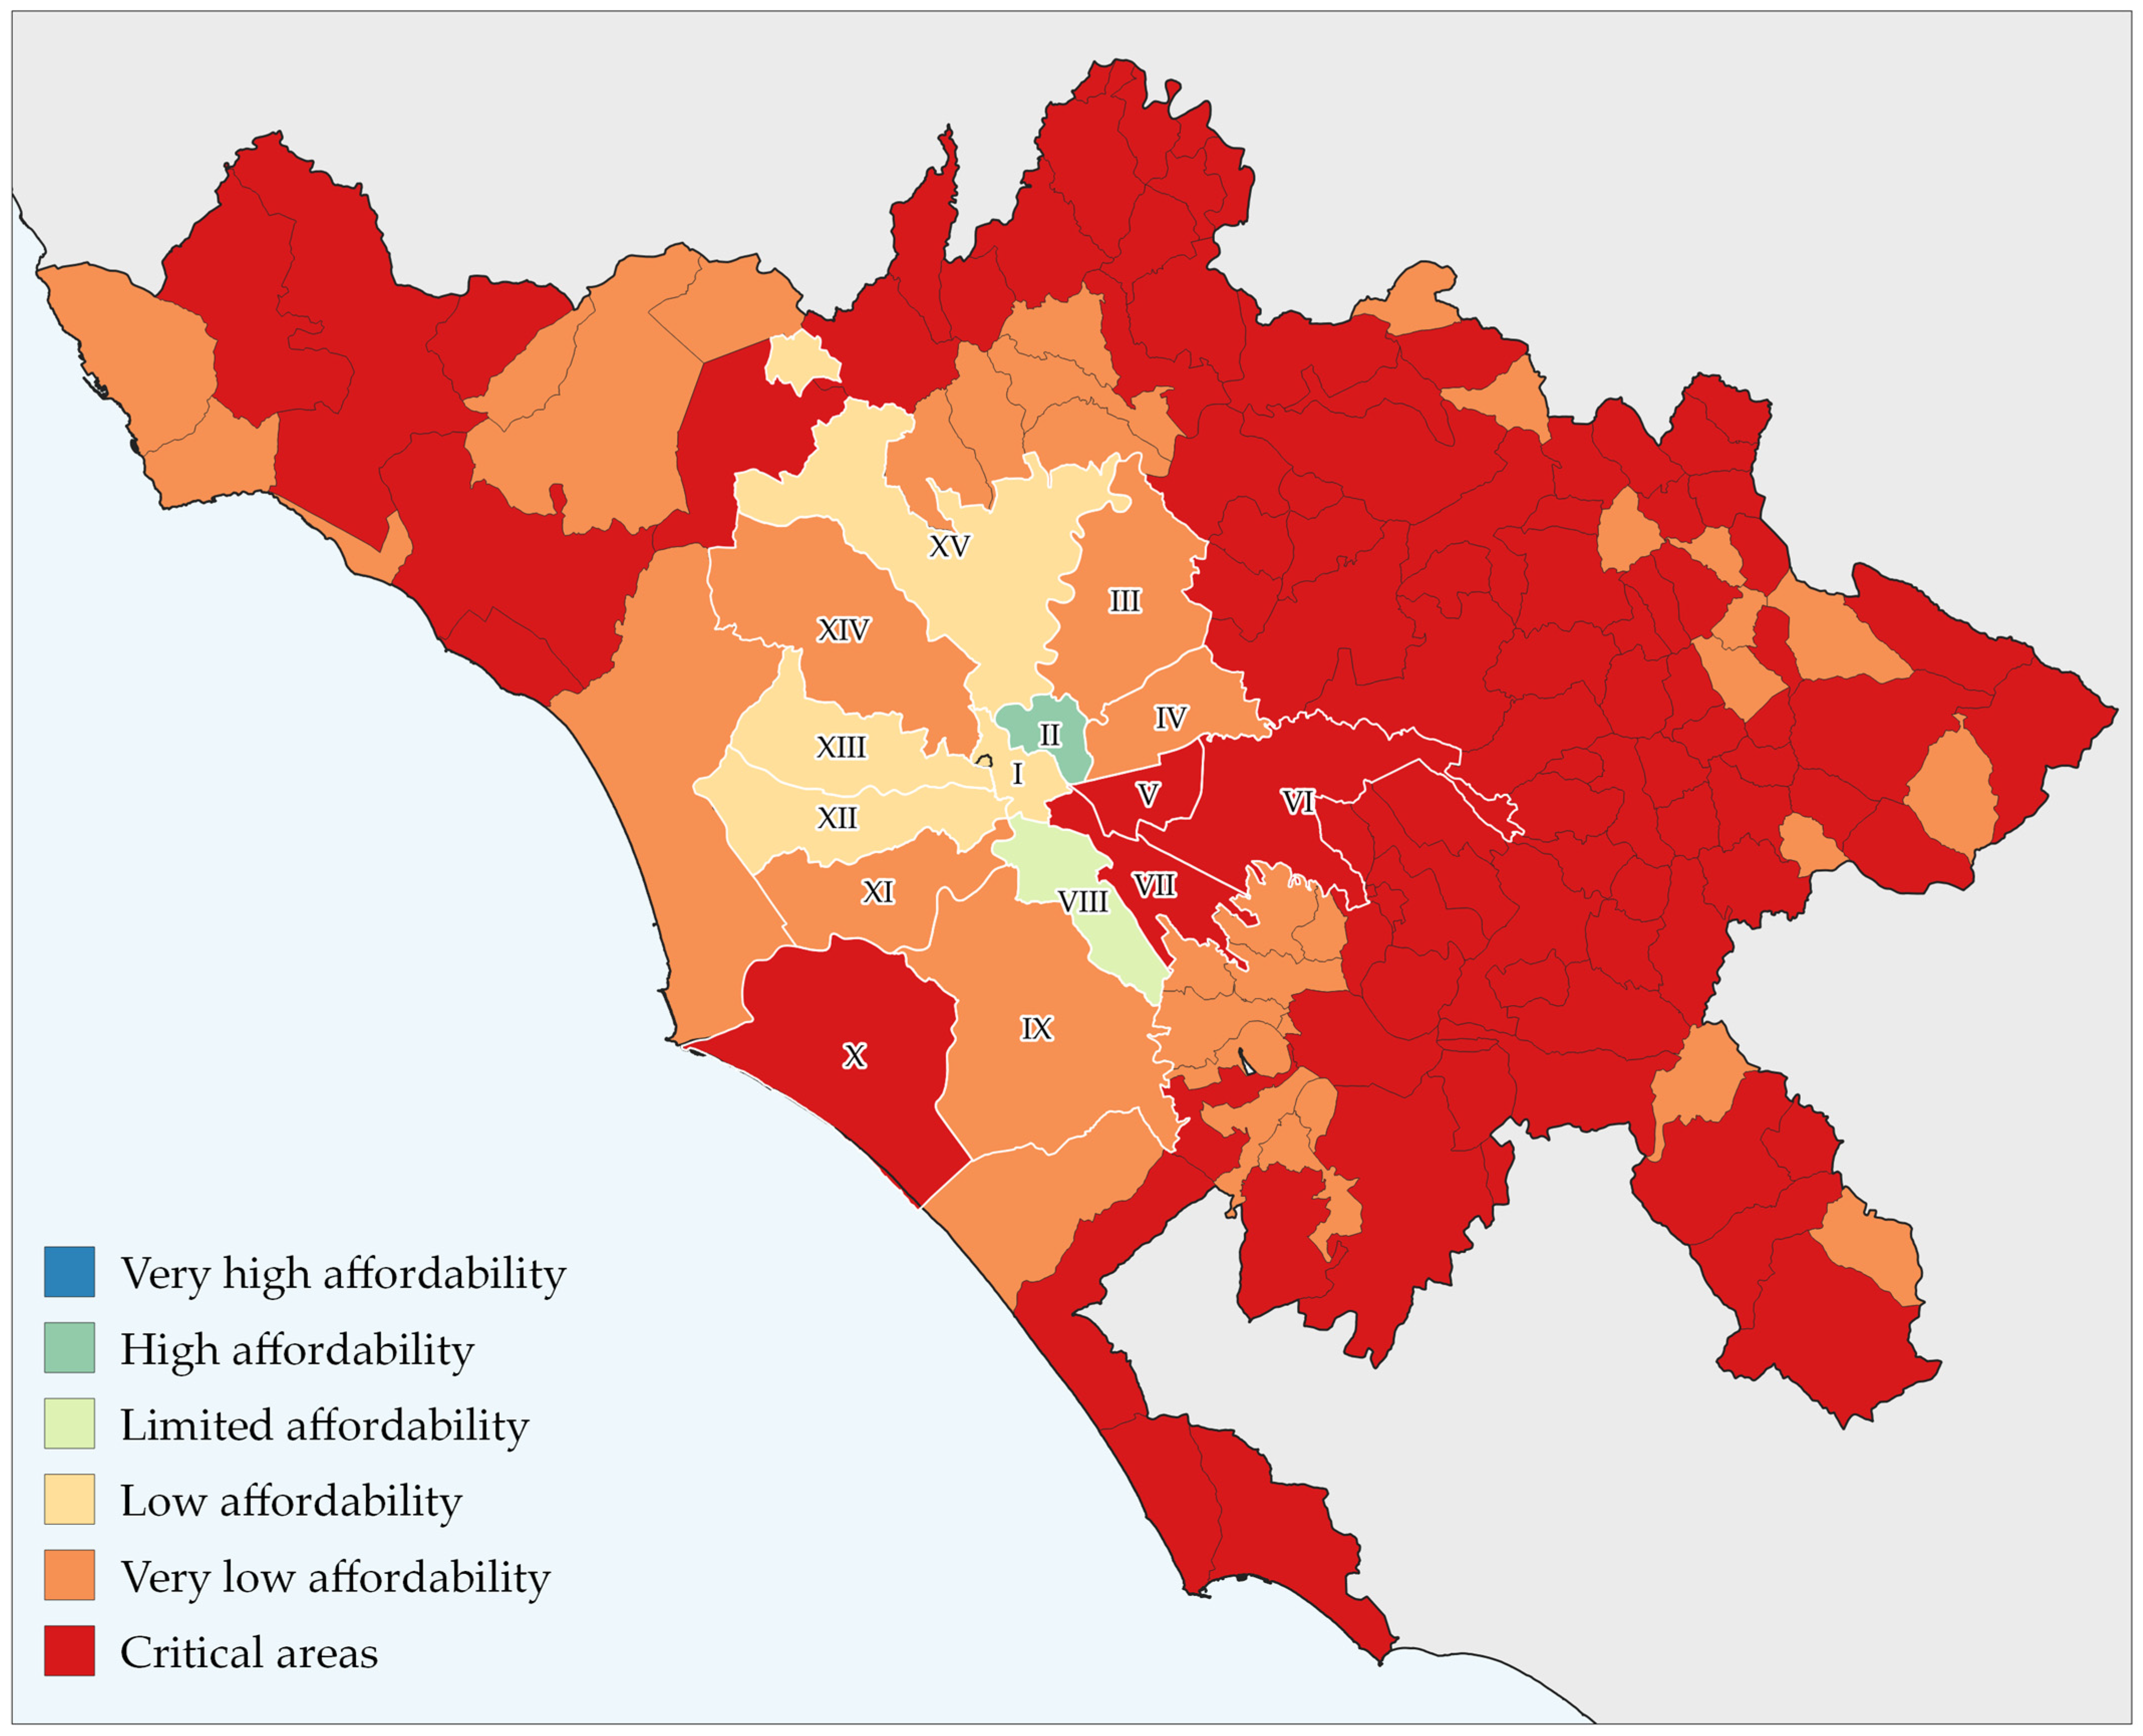
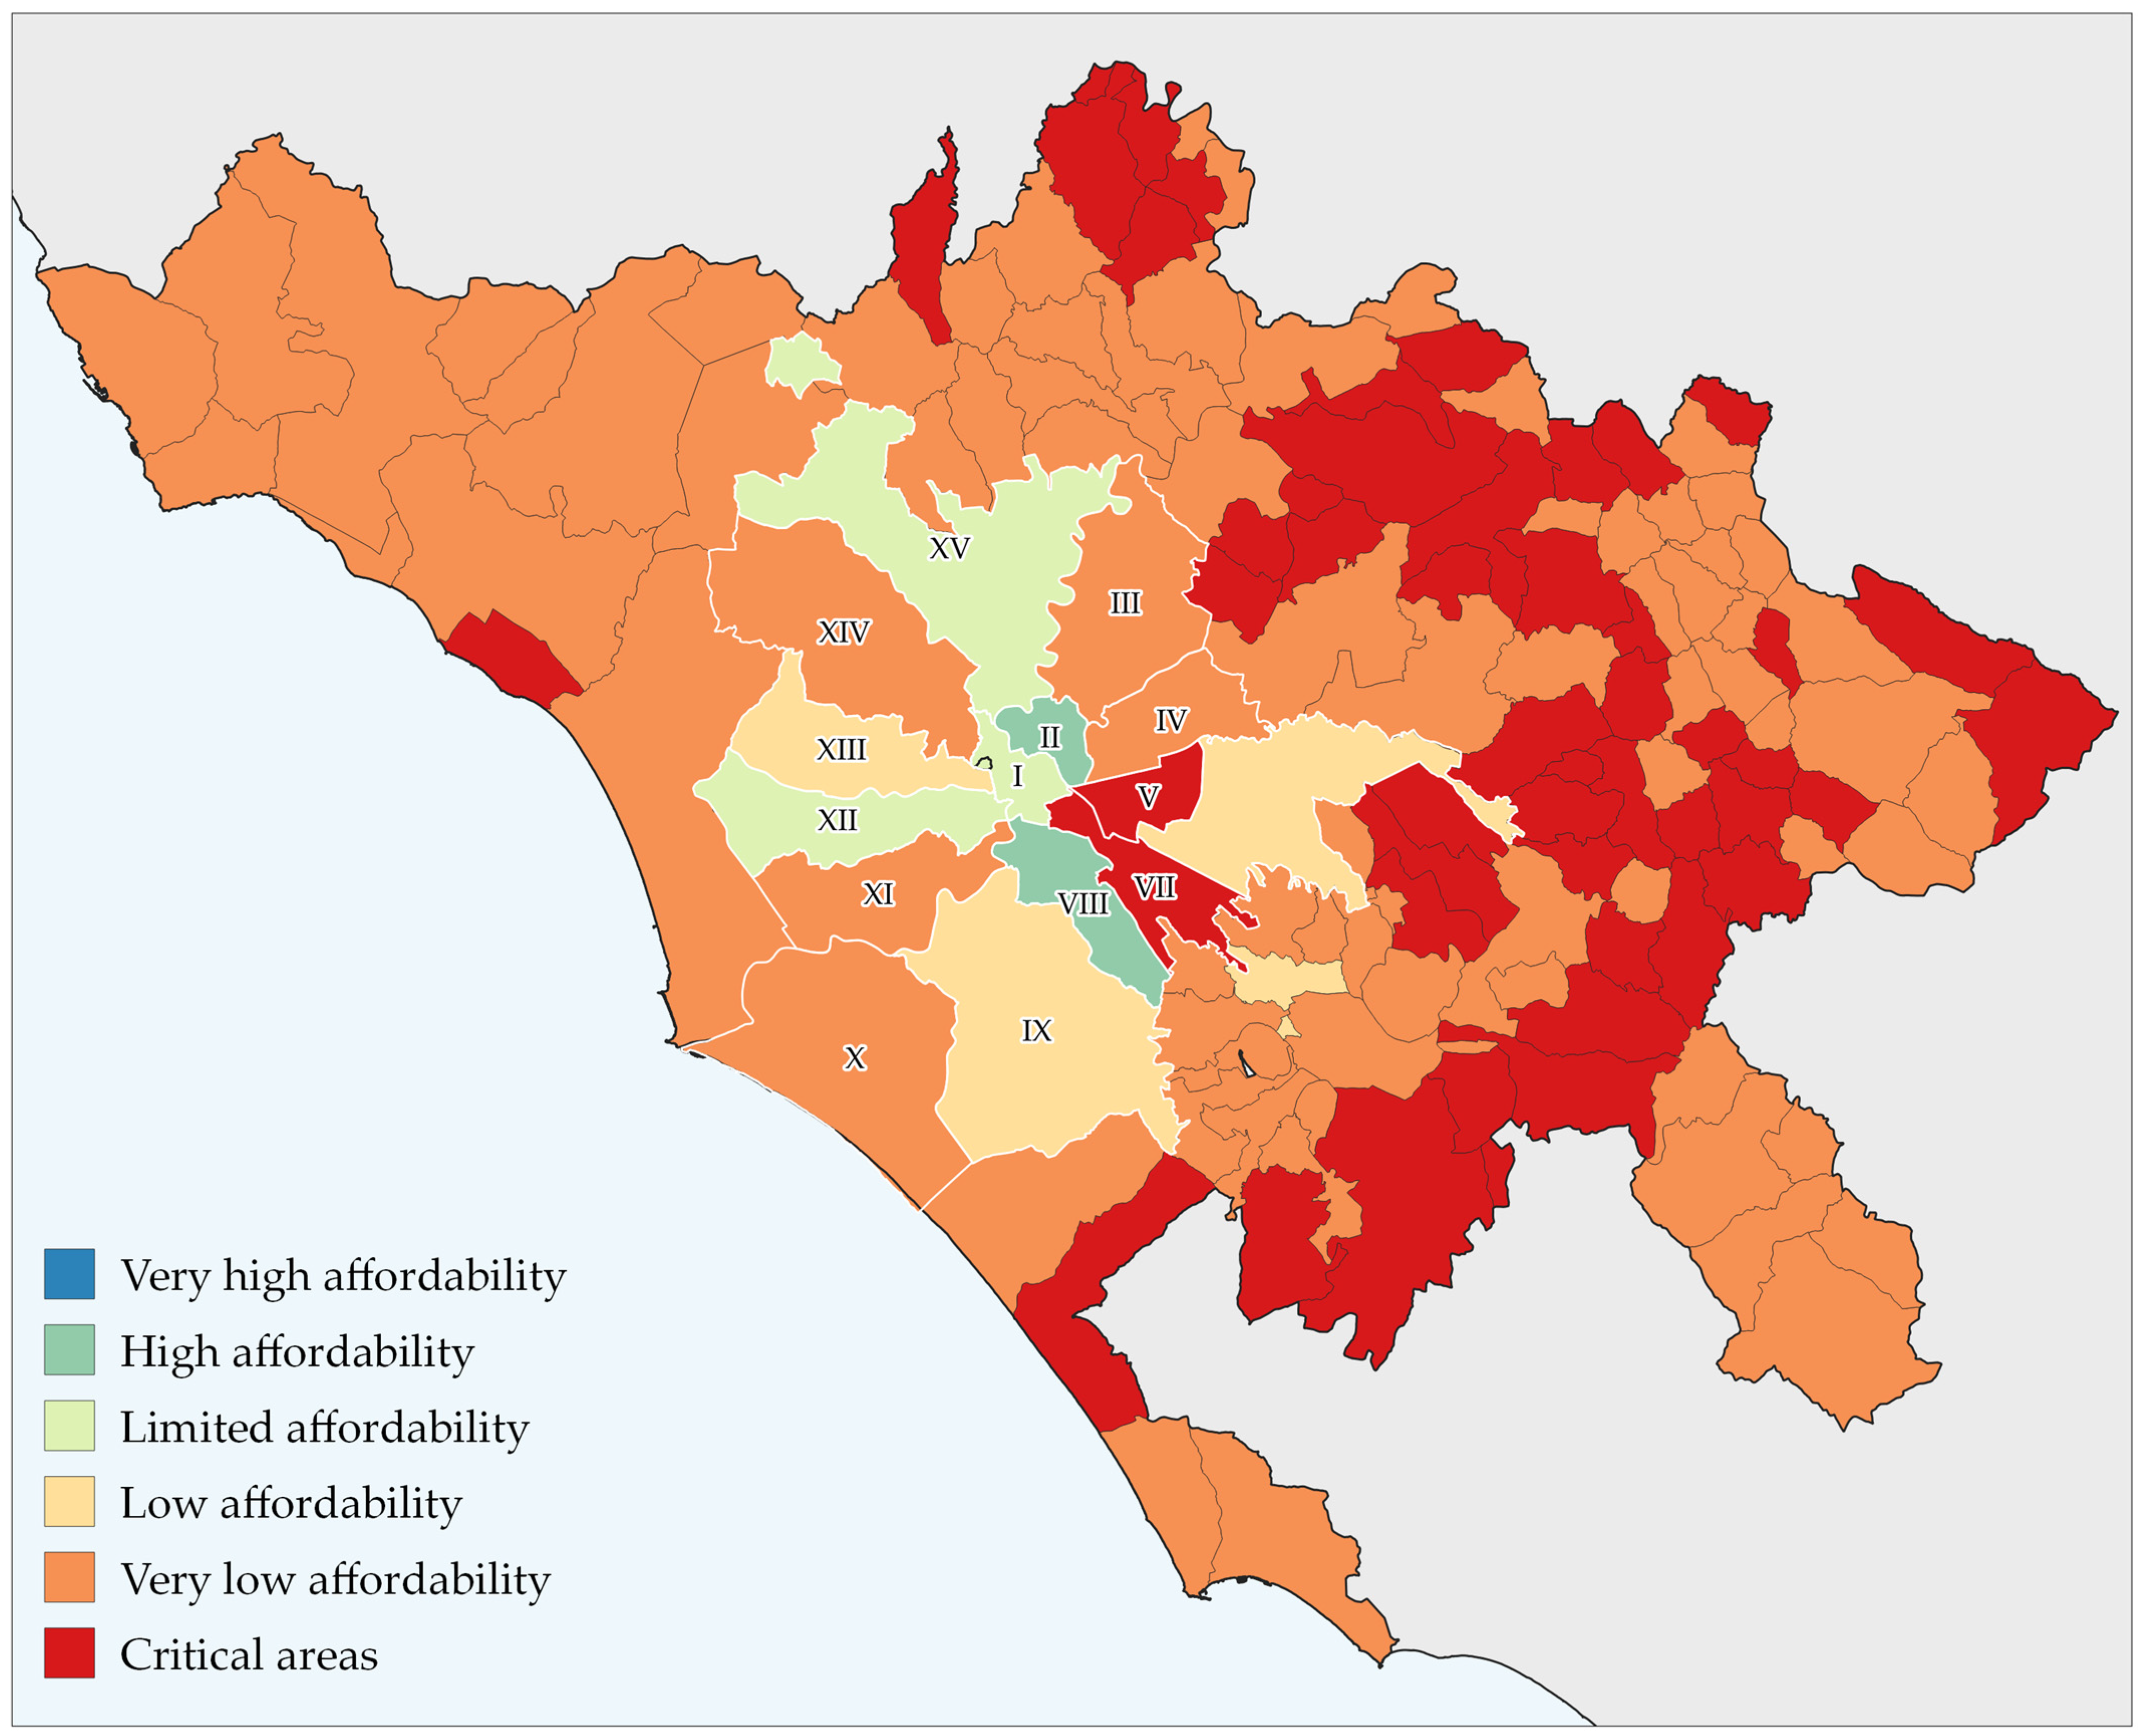
Figure 4, Figure 5, Figure 6, Figure 7, Figure 8 and Figure 9 shows the analysis of the variation in the AI, according to the type of retail shop. AI improves markedly in discount shops and worsens in specialized organic shops.
The study of the affordability index -based on different distribution channels- shows that the discount channel provides safer access to healthy and sustainable diet. Conversely, shopping for “MMR labels” and “branded product in MMRs” is associated with a higher average monthly cost, resulting in major difficulties in accessing healthy and sustainable food. Although the ‘discount’ channel’ is associated with a low average monthly cost compared to the other two channels, there are areas characterized by very low affordability, i.e., districts V, VI and VII. In addition, maps of “MMR labels” and “branded products in MMRs” show the same municipalities (Capranica Prenestina and Vallepietra) and the same districts (V, VI and VII) with a very low AI scores; the inhabitants would integrate between +45% and +115% their incomes to be able to afford a healthy and sustainable diet. The analytical framework becomes more detailed, considering the organic shopping at large-scale retail shops, specialized shops, and discount shops (Figure 7, Figure 8 and Figure 9). In all three sales channels, affordability is compromised by the higher average cost of shopping compared to ‘non-organic’ food. Critical areas occur in higher concentrations where shopping is done at specialized shops and at the discount channels. In these areas, people would need to increase their income by +115% to afford a healthy and sustainable diet. Organic shopping at the large-scale retail trade, is ‘relatively’ more accessible than at the ‘bio discount’ and at the ‘specialized organic’ outlets; the areas with ‘high’ and ‘partial’ affordability are concentrated in the municipality of Rome.
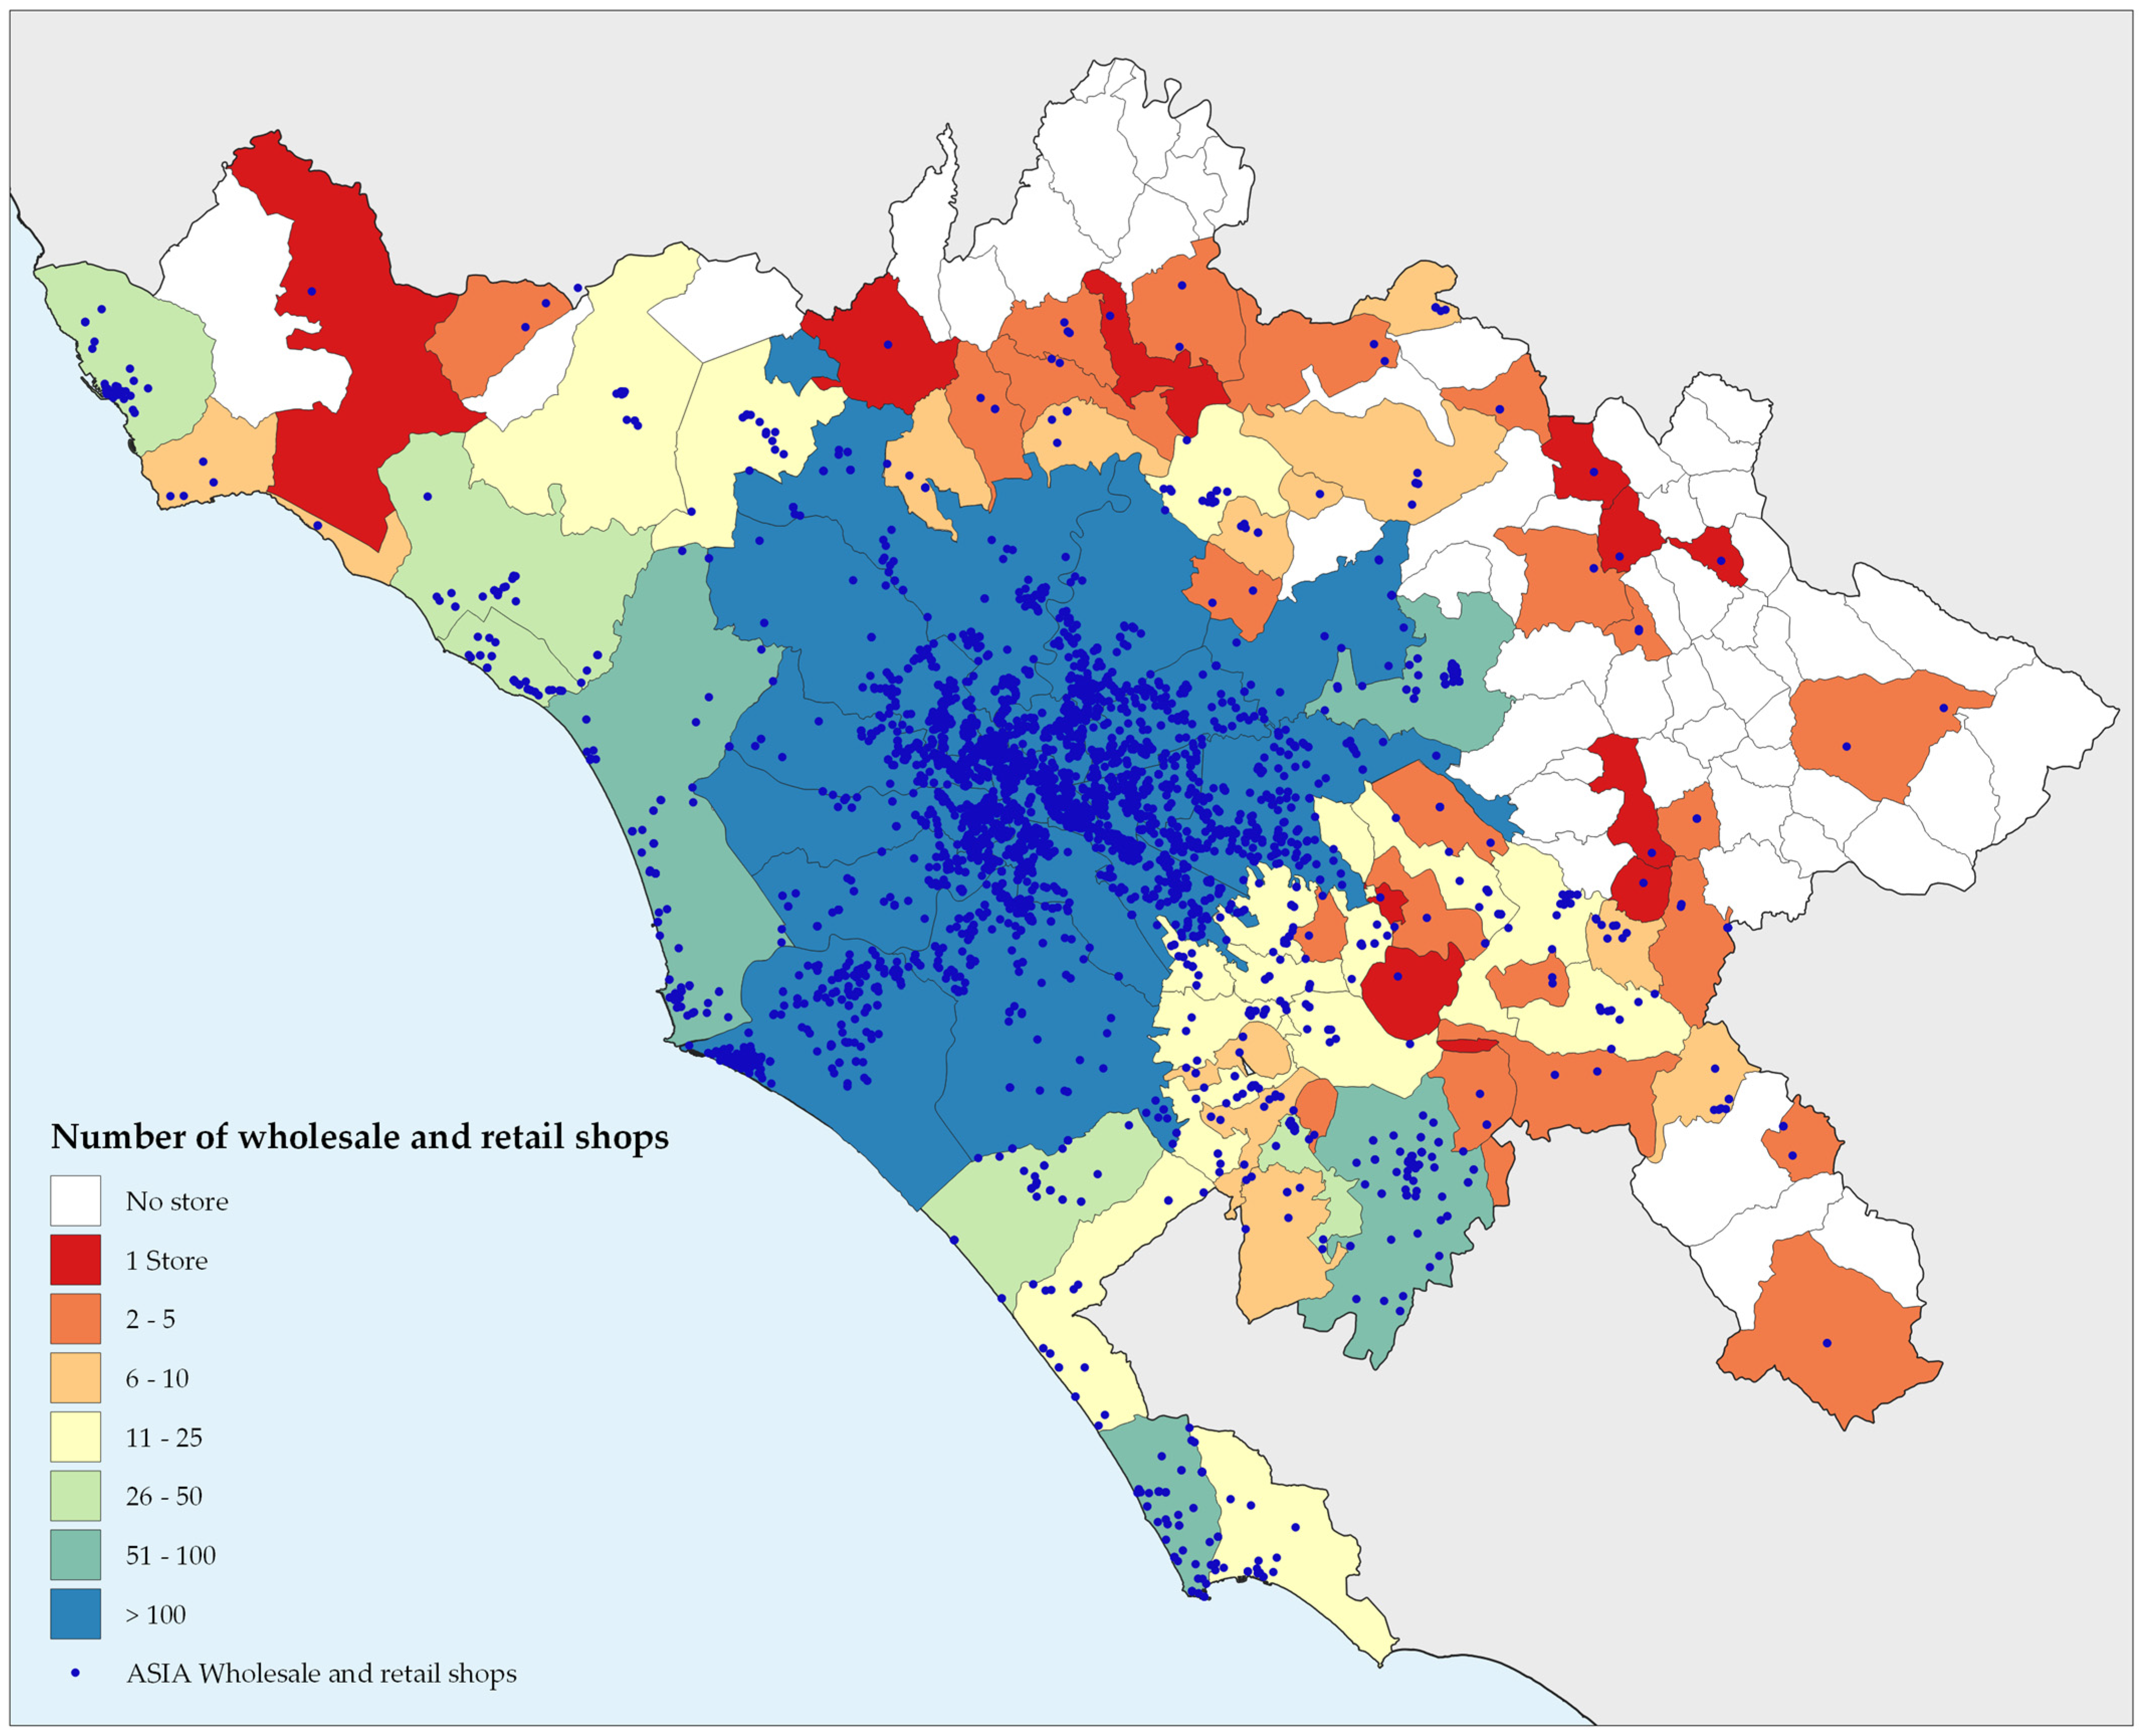
In addition to the affordability of food, this work investigates the presence of food retail outlets, addressing the issue of physical access to food. Figure 10 shows the preponderance of retail outlets in the Municipality of Rome and the presence of some districts in the MCRC with zero or one retail outlet (the white and red areas, respectively) according to ASIA database (statistical register of the number of working enterprises). In general, the map shows a very centralized and complex metropolitan city.
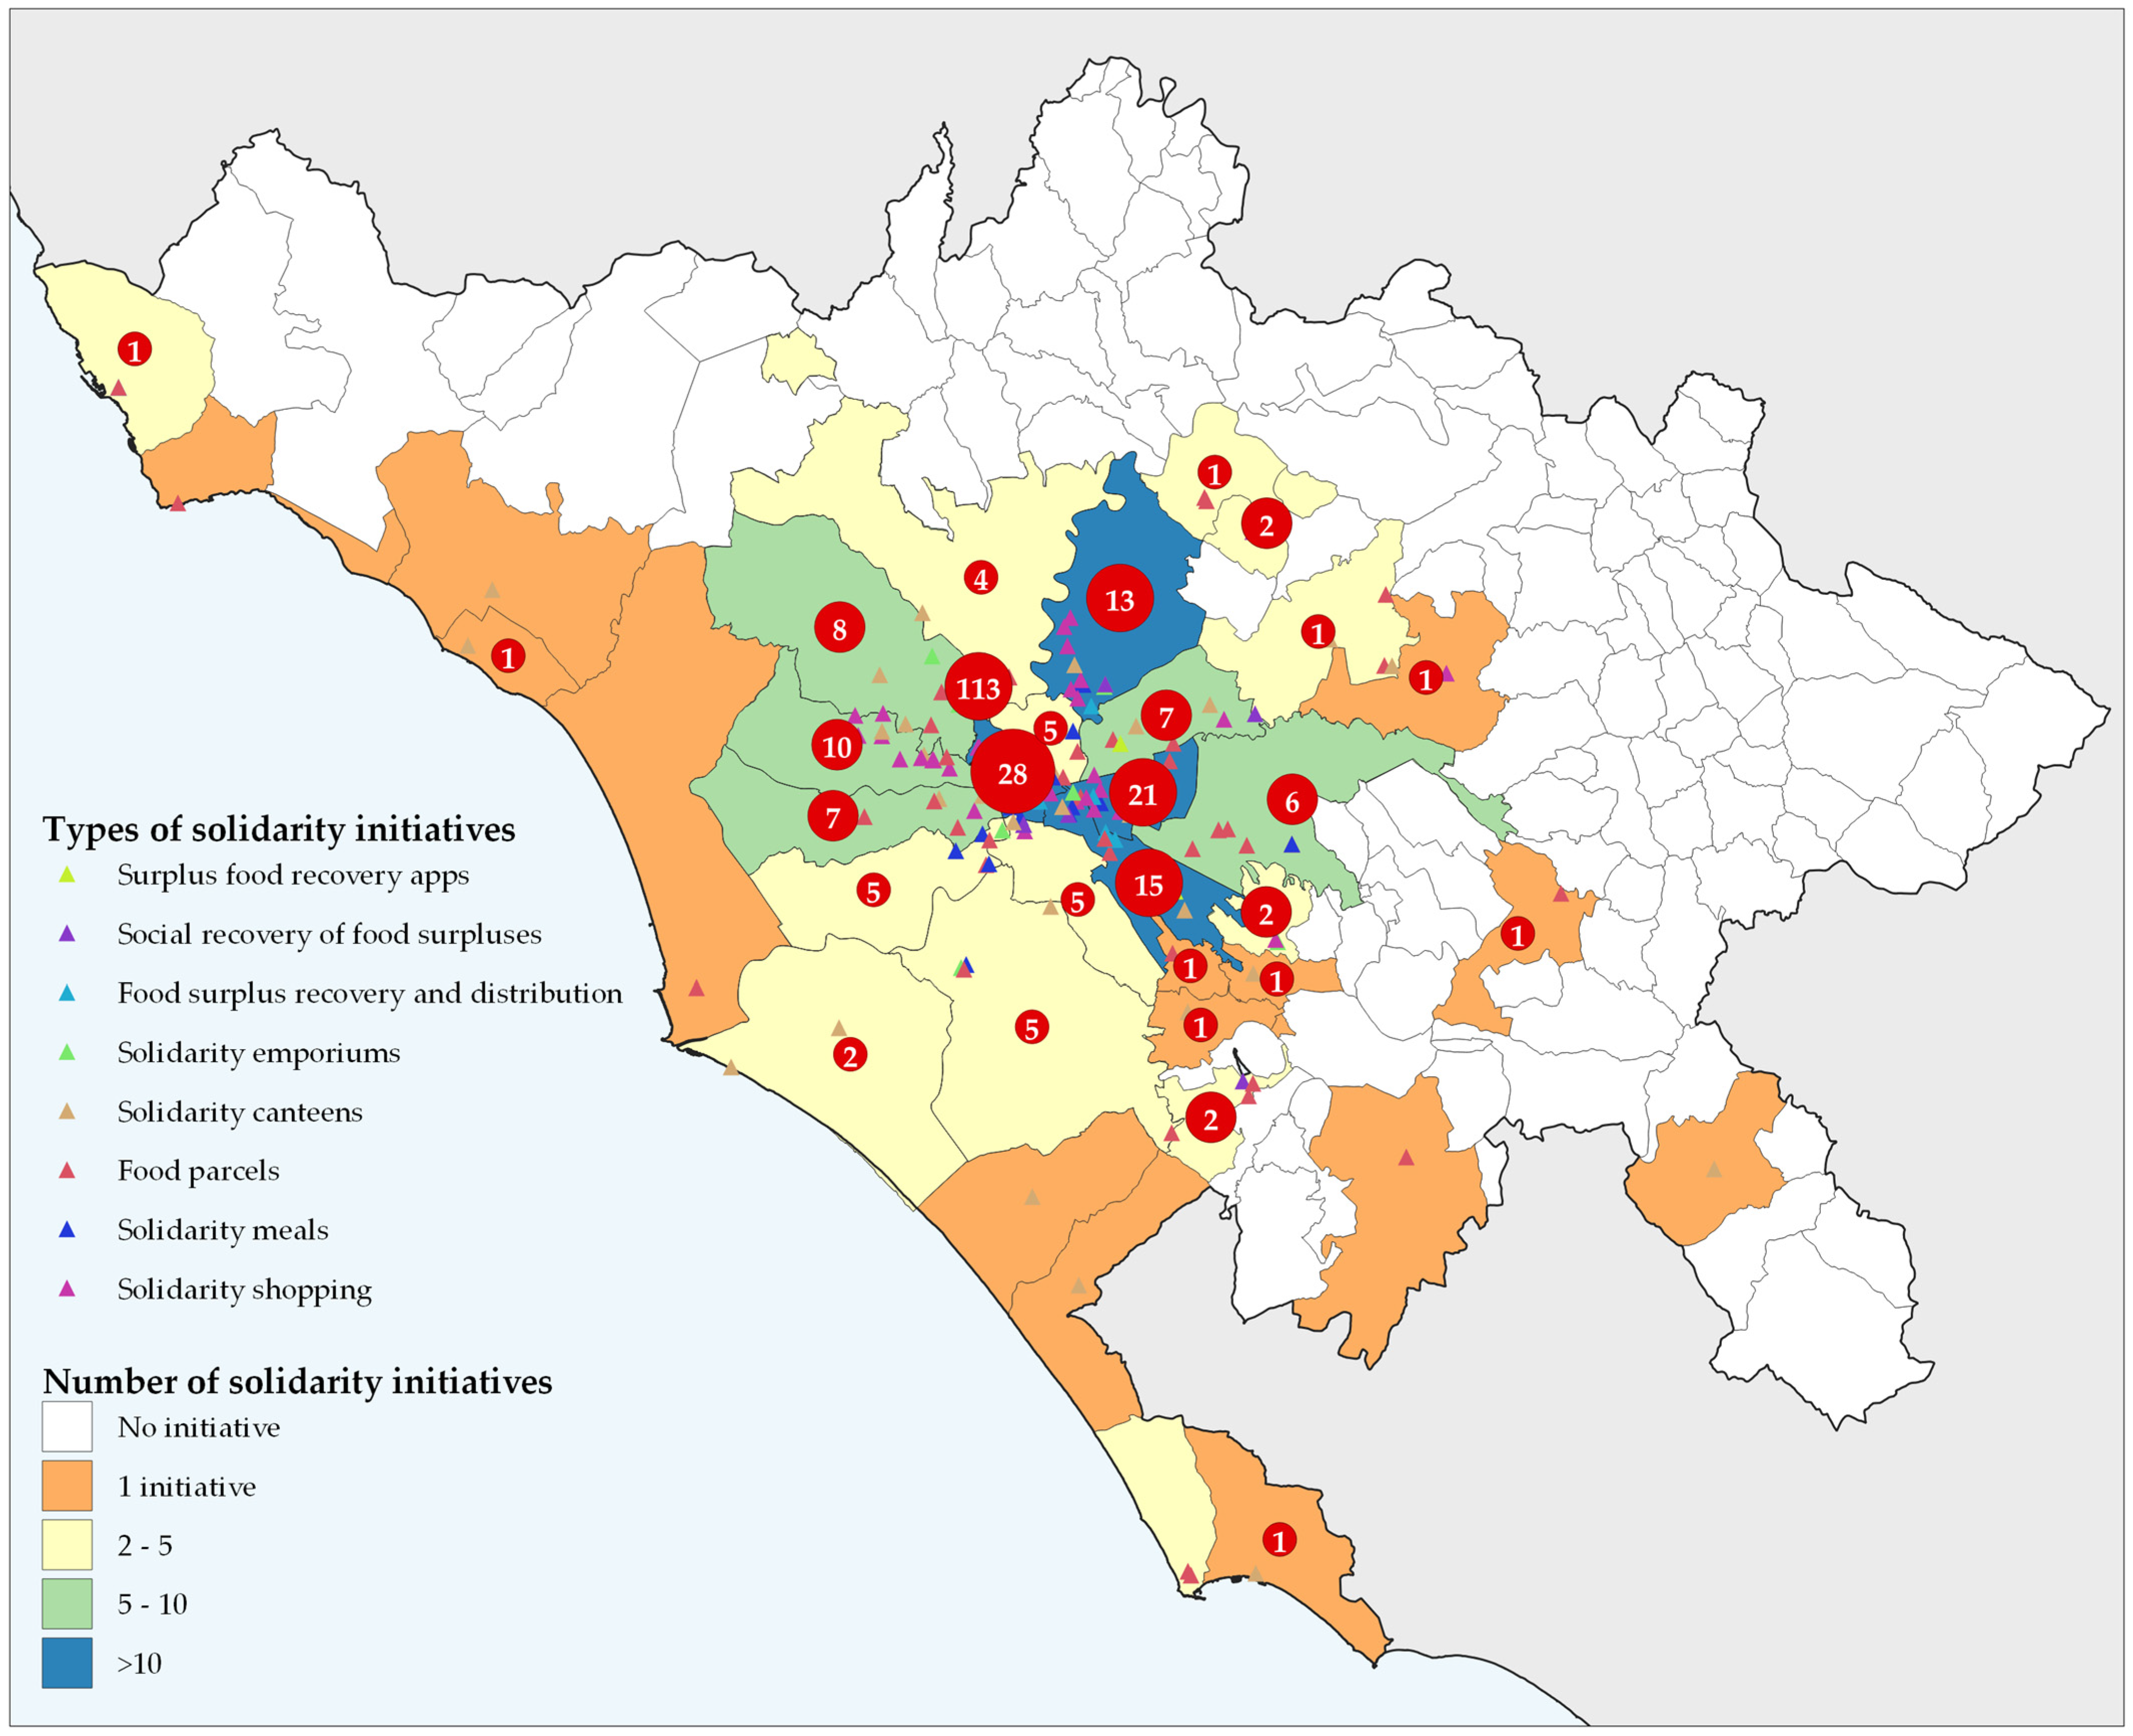
In addition to the economic and physical dimensions of food access, this work explores the presence of solidarity support networks that can act as a buffer to ensure people’s access to food. Figure 11 refers to the distribution of solidarity initiatives involved in tackling food insecurity. Such initiatives include:
- ▪
- Food surplus recovery and distribution.
- ▪
- Surplus food recovery apps.
- ▪
- Food parcels.
- ▪
- Solidarity canteens.
- ▪
- Solidarity emporiums.
- ▪
- Solidarity shopping.
- ▪
- Solidarity meals.
Figure 11 shows the areas where there are no initiatives (white), where there is only 1 initiative (orange), where there are between 2 and 5 initiatives (yellow); where there are between 5 and 10 initiatives (green) and where there are more than 10 initiatives (blue).
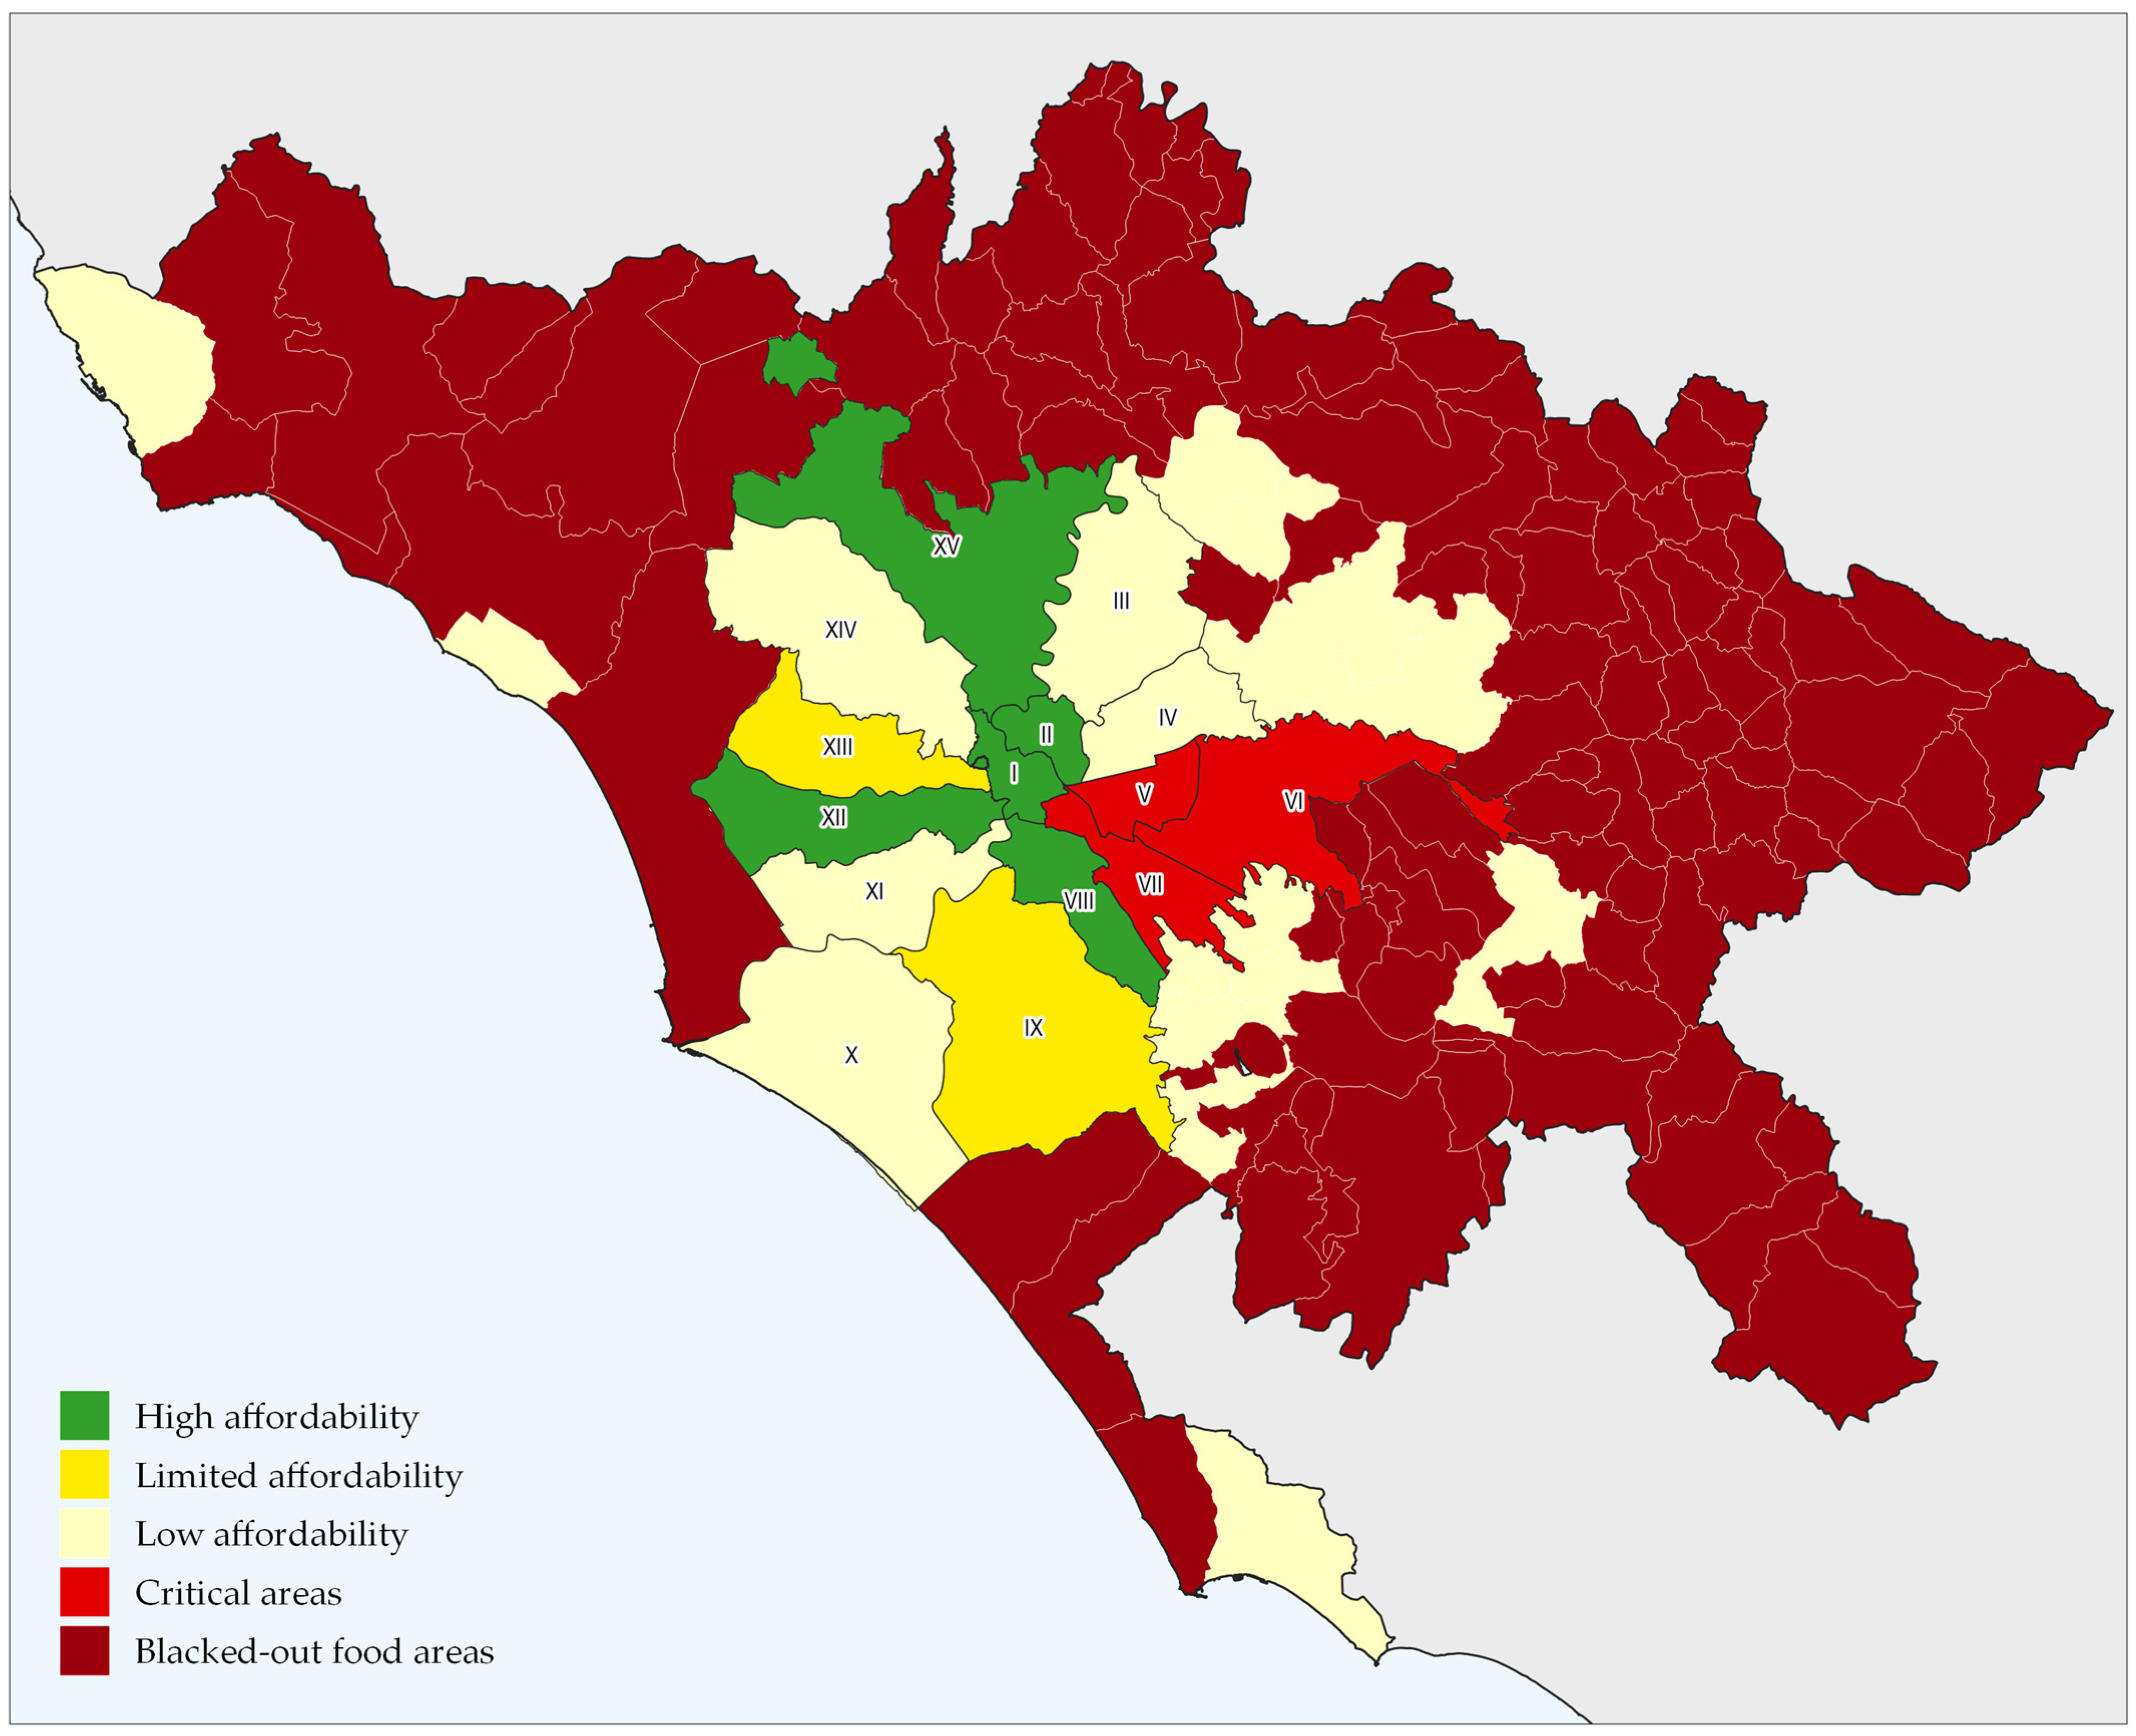
Therefore, in order to highlight the multidimensional nature of food security, not dwelling on single and isolated failures of the food system, this work cross-references the affordability maps with the maps concerning the presence of food retail outlets, with those on the presence of solidarity initiatives, highlighting the presence of the blacked-out food areas. As showed in Figure 12, the Metropolitan City is characterized by a preponderance of blacked-out food areas (dark red), whereas the situation improves only in the districts of the Municipality of Rome, especially in the city center (e.g., I and II).
7. Concluding Remarks
In this article, an attempt was made to emphasize the multidimensionality of food insecurity [66,67,68] encompassing the concept of food poverty and social exclusion, highlighting the affordability of food (from an economic point of view), as well as other elements, such as nutritional and sustainability aspects (i.e., a healthy and sustainable diet), physical access to food (the presence of retail outlets) and solidarity access (conveyed through food aid). Furthermore, we proposed a methodology for calculating an affordability index that be replicated in other territorial contexts with some possible adjustments regarding the nature of the data considered in the calculation factors.
Combining the economic elements with the elements related to the localization of the food system (assessed in terms of production–distribution and as a food aid system to deprived people), allowed for a new concept to come into focus, namely blacked-out food areas. This type of approach can help in developing a suitable metric to evaluate and monitor the UN 2030 Agenda Sustainable Development Goals, especially at the local and national level. For example, in Italy, food security issues have been scarcely explored in terms of indicators due to the lack of suitable data that would make it possible to calculate valid indicators (comparable in time and space) on which to properly ground place-based social and economic policies. In this sense, an approach not only based on people but also on territories is particularly crucial.
The data presented in this work were used to test an innovative method for measuring food security (i.e., the affordability index) and to explore the capacity of spatialization of data to implement a mix of policies that, through an adaptive approach, would be appropriate and effective according to territorial differences and inequalities. Indeed, identifying socially fragile areas at the local level plays a crucial role in terms of planning and implementing targeted policies aimed at tackling poverty and social exclusion.
In this paper, most of our efforts were focused on calculating the affordability index based on the collection of data on expenditures for a healthy and sustainable diet at nineteen points of sales and through different distribution channels. Furthermore, the identification of blacked-out food areas contributes significantly to the activities we recently launched within the framework of the Observatory on Food Insecurity in the Metropolitan City of Rome. The goal is to monitor the phenomenon of food poverty and access to food in the metropolitan area, in addition to working with associations that provide food assistance. In line with the objectives of the Observatory and in order to provide sound and effective policy indications, future research should concern the analysis of the factors that hinder food security in the city. The results reported here offer particularly critical evidence in some districts of the city of Rome and in some municipalities of the Metropolitan City. Therefore, it would be interesting to understand why, in certain areas, the lack of availability of fresh and healthy food is not compensated for by initiatives of food solidarity organizations. Such phenomena could be triggered by socioeconomic, political, social or collective factors, in the sense of a greater or lesser propensity for the development of bottom-up initiatives promoted by the charitable sector.
Author Contributions
Conceptualization, D.B. and D.M.; methodology, D.B. and D.M.; software, A.C.; validation, D.B. and D.M.; formal analysis, D.B.; investigation, D.B.; resources, D.B.; data curation, D.B. and A.C.; writing—original draft preparation, D.B.; writing—review and editing, D.B., D.M. and G.M.; visualization, D.B., D.M. and G.M.; supervision, D.M. All authors have read and agreed to the published version of the manuscript.
Funding
This work was supported by research-action project “Construction of the Food Atlas of the Metropolitan City of Rome Capital” followed by the CURSA working group under a Collaboration Agreement with the Metropolitan City of Rome Capital.
Informed Consent Statement
Not Applicable.
Data Availability Statement
Not Applicable.
Conflicts of Interest
The authors declare no conflict of interest.
References
- Di Marco, M.; Baker, M.L.; Daszak, P.; De Barro, P.; Eskew, E.A.; Godde, C.M.; Harwood, T.D.; Herrero, M.; Hoskins, A.J.; Johnson, E.; et al. Opinion: Sustainable development must account for pandemic risk. PNAS 2020, 117, 3888–3892. [Google Scholar] [CrossRef] [PubMed]
- Herrero, M.; Thornton, P.K. Livestock and global change: Emerging issues for sustainable food systems. Proc. Natl. Acad. Sci. USA 2013, 110, 20878–20881. [Google Scholar] [CrossRef] [PubMed]
- Sen, A.K. Poverty and Famines: An Essay on Entitlement and Deprivation; Clarendon Press: Oxford, UK, 1981. [Google Scholar]
- Marino, D.; Antonelli, M.; Fattibene, D.; Mazzocchi, G.; Tarra, S. Cibo, Città, Sostenibilità. Un Tema Strategico per l’Agenda 2030; ASVIS: Roma, Italy, 2020. [Google Scholar]
- Bernaschi, D.; Crisci, G. Towards a more democratic and sustainable food system: The reflexive nature of solidarity purchase groups and the migrants’ social cooperative ‘Barikamà’ in Rome. In Sustainable Agriculture and Food Security; Springer: Berlin, Germany, 2018. [Google Scholar]
- Bernaschi, D.; Leonardi, L. Food insecurity and changes in social citizenship. A comparative study of Rome, Barcelona and Athens. Eur. Soc. 2022. [Google Scholar] [CrossRef]
- Mazzocchi, G.; Marino, D. Rome, a policy without politics: The participatory process for a metropolitan scale food policy. Int. J. Environ. Res. Public Health 2020, 17, 479. [Google Scholar] [CrossRef]
- Mazzocchi, G.; Minotti, B.; Marino, D. Governance Scenarios on the Co-design of the Food Policy in Rome. Riv. Ital. Di Politiche Pubbliche 2022, 17, 451–477. [Google Scholar]
- Shaw, D.J. World Food Summit, 1996. In World Food Security; Palgrave Macmillan: London, UK, 2007; pp. 347–360. [Google Scholar]
- Pinstrup-Andersen, P. Food security: Definition and measurement. Food Secur. 2009, 1, 5–7. [Google Scholar] [CrossRef]
- Candel, J.J. Food security governance: A systematic literature review. Food Secur. 2014, 6, 585–601. [Google Scholar] [CrossRef]
- Saint Ville, A.; Po, J.Y.T.; Sen, A.; Bui, A.; Melgar-Quiñonez, H. Food security and the Food Insecurity Experience Scale (FIES): Ensuring progress by 2030. Food Secur. 2019, 11, 483–491. [Google Scholar] [CrossRef]
- Rittel, H.W.J.; Webber, M.M. Dilemmas in a general theory of planning. Policy Sci. 1972, 4, 155–169. [Google Scholar] [CrossRef]
- Levin, K.; Cashore, B.; Bernstein, S.; Auld, G. Overcoming the tragedy of super wicked problems: Constraining our future selves to ameliorate global climate change. Policy Sci. 2012, 45, 123–152. [Google Scholar] [CrossRef]
- Rockström, J.; Steffen, W.; Noone, K.; Persson, Å.; Chapin III, F.S.; Lambin, E.; Foley, J. Planetary boundaries: Exploring the safe operating space for humanity. Ecol. Soc. 2009, 14, 32. [Google Scholar] [CrossRef]
- Fitoussi, J.P.; Malik, K. Choices, Capabilities and Sustainability; Occasional Paper; Human Development Report Office: New York, NY, USA, 2013. [Google Scholar]
- Peters, B.G.; Tarpey, M. Are wicked problems really so wicked? Perceptions of policy problems. Policy Soc. 2019, 38, 218–236. [Google Scholar] [CrossRef]
- Sonnino, R.; Torres, C.L.; Schneider, S. Reflexive governance for food security: The example of school feeding in Brazil. J. Rural. Stud. 2014, 36, 1–12. [Google Scholar] [CrossRef]
- Williams, D.R. The role of Place-based Social Learning. In New Strategies for Wicked Problems: Science and Solutions in the 21st Century; Weber, E.P., Lach, D., Steel, B.S., Eds.; Oregon State University Press: Corvallis, OR, USA, 2017. [Google Scholar]
- Marino, D.; Bernaschi, D.; Cimini, A.; D’Amico, G.; Gallo, G.; Giovanelli, G.; Kollamparambil, A.; Lirosi, L.; Mazzocchi, G.; Minotti, B.; et al. Atlante del cibo. In Uno Strumento per le Politiche Locali del Cibo, Città Metropolitana di Roma Capitale; CURSA: Rome, Italy, 2022; ISBN 9788894227239. [Google Scholar]
- Osorio, A.E.; Corradini, M.G.; Williams, J.D. Remediating food deserts, food swamps, and food brownfields: Helping the poor access nutritious, safe, and affordable food. AMS Rev. 2013, 3, 217–231. [Google Scholar] [CrossRef]
- Food and Agriculture Organization (FAO). Food Balance Sheets; Statistics Division. FAO: Rome, Italy, 2020. Available online: http://www.fao.org/faostat/en/#data/FBS/visualize (accessed on 11 December 2022).
- Coleman-Jensen, A.; Nord, M.; Andrews, M.; Carlson, S. Annual Report Household Food Security in the United States in 2010. Administrative publication number 057; Department of Agriculture: Washington, DC, USA, 2011.
- Reutlinger, S. Poverty and Hunger: Issues and Options for Food Security in Developing Countries. In A World Bank Policy Study; The World Bank: Washington, DC, USA, 1986. [Google Scholar]
- Sen, A.K. Poverty and Famines: An Essay on Entitlement and Deprivation, 2nd ed.; Oxford University Press: Oxford, UK, 1982. [Google Scholar]
- Drèze, J.; Sen, A. Hunger and Public Action; Clarendon Press: Oxford, UK, 1990. [Google Scholar]
- Sen, A.K. From income inequality to economic inequality. South. Econ. J. 1997, 64, 384–401. [Google Scholar] [CrossRef]
- Sen, A. The living standard. Oxf. Econ. Pap. 1984, 36, 74–90. [Google Scholar] [CrossRef]
- Maino, F.; Lodi Rizzini, C.; e Bandera, L. Povertà Alimentare in Italia: Le Risposte del Secondo Welfare; Il Mulino: Bologna, Italia, 2016. [Google Scholar]
- Sen, A.K. A decade of human development. J. Hum. Dev. 2000, 1, 17–23. [Google Scholar] [CrossRef]
- Kent, G. Freedom from Want: The Human Right to Adequate Food; Georgetown University Press: Georgetown, DC, USA, 2005; p. 46. [Google Scholar]
- McPherson, M.; Smith-Lovin, L.; Brashears, M.E. Social isolation in America: Changes in core discussion networks over two decades. Am. Sociol. Rev. 2006, 71, 353–375. [Google Scholar] [CrossRef]
- Goffman, E. The Presentation of Self in Everyday Life; Doubleday/Anchor Books: Garden City, NY, USA, 1959. [Google Scholar]
- Bernaschi, D. Collective Actions of Solidarity against Food Insecurity in Rome, Barcellona and Athens: The Impact in Terms of Capabilities; Springer: Berlin, Germany, 2020. [Google Scholar]
- Pettenati, G.; Toldo, A. Cibo tra Azione Locale e Sistemi Globali; FrancoAngeli: Milano, Italy, 2018. [Google Scholar]
- Eurostat. People at Risk of Poverty or Social Exclusion; Eurostat: Kirchberg, Luxembourg, 2019. [Google Scholar]
- Eurostat. People at Risk of Poverty or Social Exclusion, 2nd ed.; Eurostat: Kirchberg, Luxembourg, 2021. [Google Scholar]
- Food and Agriculture Organization (FAO). The State of Food Security and Nutrition in the World; FAO: Rome, Italy, 2020. [Google Scholar]
- CREA. Linee Guida per Una Sana Alimentazione; CREA: Rome, Italy, 2018. [Google Scholar]
- Willett, W.; Rockström, J.; Loken, B.; Springmann, M.; Lang, T.; Vermeulen, S.; Murray, C.J. Food in the Anthropocene: The EAT–Lancet Commission on healthy diets from sustainable food systems. Lancet 2019, 393, 447–492. [Google Scholar] [CrossRef]
- Sonnino, R.; Tegoni, C.L.; De Cunto, A. The challenge of systemic food change: Insights from cities. Cities 2019, 85, 110–116. [Google Scholar] [CrossRef]
- Minotti, B.; Antonelli, M.; Dembska, K.; Marino, D.; Riccardi, G.; Vitale, M.; Calabrese, I.; Recanati, F.; Giosuè, A. True Cost Accounting of a healthy and sustainable diet in Italy. Front. Nutr. 2022, 9, 974768. [Google Scholar] [CrossRef] [PubMed]
- Barilla Center for Food & Nutrition. A one Health Approach to Food. In The Double Pyramid Connecting Food Culture, Health and Climate; Barilla Center for Food & Nutrition: Parma, Italy, 2021. [Google Scholar]
- Morgan, K.; Sonnino, R. The urban foodscape: World cities and the new food equation. Camb. J. Reg. Econ. Soc. 2010, 3, 209–224. [Google Scholar] [CrossRef]
- Armstrong, K.; Chapin, E.; Chastain, A.; Person, J.; VanRheen, S.; White, S. Foodability: Visioning for Healthful Food Access in Portland. Portland State Univ. Master Urban Reg. Plan. 2009, 55, 195–207. [Google Scholar]
- Borrelli, N.; Corti, G. Investigare l'accessibilità economica al cibo. Definizione di uno studio metodologico e applicazione nella città di Milano. Sociol. Urbana E Rural 2019, 119, 135–155. [Google Scholar] [CrossRef]
- Bader, M.D.; Ailshire, J.A.; Morenoff, J.D.; House, J.S. Measurement of the local food environment: A comparison of existing data sources. Am. J. Epidemiol. 2010, 171, 609–617. [Google Scholar] [CrossRef] [PubMed]
- Sharkey, J.R.; Johnson, C.M.; Dean, W.R. Food access and perceptions of the community and household food environment as correlates of fruit and vegetable intake among rural seniors. BMC Geriatr. 2010, 10, 1–12. [Google Scholar] [CrossRef]
- Branham, L. Food Deserts: The Issue and Possible Solutions. Sr. Honor. Theses. 2016. Available online: https://digitalcommons.liberty.edu/honors/594 (accessed on 11 December 2022).
- Beaumont, J.; Lang, T.; Leather, S.; Mucklow, C. Report from the Policy Sub-Group to the Nutrition Task Force Low Income Project Team of the Department of Health; Institute of Grocery Distribution: Radlett, UK, 1995. [Google Scholar]
- Zimmerman, M.M. The supermarket and the changing retail structure. J. Mark. 1941, 5, 402–409. [Google Scholar] [CrossRef]
- Guy, C.M.; David, G. Measuring physical access to ‘healthy foods’ in areas of social deprivation: A case study in Cardiff. Int. J. Consum. Stud. 2004, 28, 222–234. [Google Scholar] [CrossRef]
- Neumeier, S.; Kokorsch, M. Supermarket and discounter accessibility in rural Germany–identifying food deserts using a GIS accessibility model. J. Rural. Stud. 2021, 86, 247–261. [Google Scholar] [CrossRef]
- Furey, S.; Strugnell, C.; McIlveen, M. An investigation of the potential existence of food deserts in rural and urban areas of Northern Ireland. Agric. Hum. Values 2001, 18, 447–457. [Google Scholar] [CrossRef]
- Thomas, B.J. Food deserts and the sociology of space: Distance to food retailers and food insecurity in an urban American neighborhood. Int. J. Humanit. Soc. Sci. 2010, 4, 1545–1554. [Google Scholar]
- Clifton, K.J. Mobility strategies and food shopping for low-income families: A case study. J. Plan. Educ. Res. 2004, 23, 402–413. [Google Scholar] [CrossRef]
- O’Connell, R.; Brannen, J. Families and Food in Hard Times: European Comparative Research; UCL Press: London, UK, 2021. [Google Scholar]
- Caplan, P. Win-win? Food poverty, food aid and food surplus in the UK today. Anthropol. Today 2017, 33, 17–22. [Google Scholar] [CrossRef]
- ISTAT. Le statistiche dell’Istat sulla povertà; ISTAT: Rome, Italy, 2022. [Google Scholar]
- CMRC. Rapporto statistico sull’area metropolitana romana 2019. In Reddito Città metropolitana di Roma Capitale; Ufficio metropolitano di Statistica Roma Capitale, Ufficio di Statistica: Rome, Italy, 2019. [Google Scholar]
- Lelo, K.; Monni, S.; Tomassi, F. Le Mappe Della Disuguaglianza; Donzelli Editori: Rome, Italy, 2021. [Google Scholar]
- Caritas Roma. Povertà a Roma: Un Punto di Vista; Caritas: Rome, Italy, 2019. [Google Scholar]
- ISTAT. Rapporto BES 2020: Il Benessere Equo e Sostenibile in Italia; ISTAT: Rome, Italy, 2020. [Google Scholar]
- Caritas Roma. La povertà a Roma: Un punto di vista. Nessuno si salva da solo; Caritas: Rome, Italy, 2020. [Google Scholar]
- Felici, F.B.; Bernaschi, D.; Marino, D. La Poverta’alimentare a Roma: Una Prima Analisi Dell’impatto dei Prezzi; Cursa: Rome, Italy, 2022. [Google Scholar]
- Barkouti, A.; Melki, M.N.; Beyaz, A. Bibliometric study on food security and climate change research from 2000 to 2020. Afr. J. Adv. Pure Appl. Sci. (AJAPAS) 2022, 47, 139–146. [Google Scholar]
- Sweileh, W.M. Bibliometric analysis of peer reviewed literature on food security in the context of climate change from 1980 to 2019. Agric. Food Secur. 2020, 9, 1–15. [Google Scholar] [CrossRef]
- Xie, H.; Wen, Y.; Choi, Y.; Zhang, X. Global trends on food security research: A bibliometric analysis. Land 2021, 10, 119. [Google Scholar] [CrossRef]
Figure 1.
The dynamic flow of food security.

Figure 2.
Food security dimensions and blacked-out food areas.

Figure 3.
Affordability index in the MCRC: average values.

Figure 4.
AI: discount in the MCRC.

Figure 5.
AI: branded products in MMR in the MCRC.

Figure 6.
AI: MMR labels in the MCRC.

Figure 7.
AI: bio discount in the MCRC.

Figure 8.
AI: bio-MMR in the MCRC.

Figure 9.
AI: bio specialized shops in the MCRC.

Figure 10.
Distribution of wholesale and retail shops in the MCRC.

Figure 11.
Distribution of solidarity initiatives in the MCRC.

Figure 12.
Distribution of blacked-out food areas in the MCRC.


Table 1.
Affordability index in terms of a healthy and sustainable diet.
| Municipalities | Discount | Discount% | Mass-Market Retailer (MMR) Labels | Mass-Market Retailer (MMR) Labels% |
|---|---|---|---|---|
| Affile | 1.17 | −17 | 1.25 | 25 |
| Agosta | 1.11 | −11 | 1.19 | 19 |
| Albano Laziale | 0.98 | 2 | 1 | 0 |
Disclaimer/Publisher’s Note: The statements, opinions and data contained in all publications are solely those of the individual author(s) and contributor(s) and not of MDPI and/or the editor(s). MDPI and/or the editor(s) disclaim responsibility for any injury to people or property resulting from any ideas, methods, instructions or products referred to in the content. |
© 2023 by the authors. Licensee MDPI, Basel, Switzerland. This article is an open access article distributed under the terms and conditions of the Creative Commons Attribution (CC BY) license (https://creativecommons.org/licenses/by/4.0/).
Share and Cite
MDPI and ACS Style
Bernaschi, D.; Marino, D.; Cimini, A.; Mazzocchi, G. The Social Exclusion Perspective of Food Insecurity: The Case of Blacked-Out Food Areas. Sustainability 2023, 15, 2974. https://doi.org/10.3390/su15042974
AMA Style
Bernaschi D, Marino D, Cimini A, Mazzocchi G. The Social Exclusion Perspective of Food Insecurity: The Case of Blacked-Out Food Areas. Sustainability. 2023; 15(4):2974. https://doi.org/10.3390/su15042974
Chicago/Turabian StyleBernaschi, Daniela, Davide Marino, Angela Cimini, and Giampiero Mazzocchi. 2023. "The Social Exclusion Perspective of Food Insecurity: The Case of Blacked-Out Food Areas" Sustainability 15, no. 4: 2974. https://doi.org/10.3390/su15042974
Note that from the first issue of 2016, this journal uses article numbers instead of page numbers. See further details here.