Article

Spatiotemporal Accessibility of COVID-19 Healthcare Facilities in Jakarta, Indonesia

1
Faculty of Geography, Universitas Muhammadiyah Surakarta, Surakarta 57162, Indonesia
2
Department of Public Health, Faculty of Health, Universitas Muhammadiyah Surakarta, Surakarta 57162, Indonesia
3
Centre for Spatial Analysis & Policy, School of Geography, University of Leeds, Leeds LS2 9JT, UK
4
Geomatic Engineering, Institut Teknologi Sumatera, Kabupaten Lampung Selatan 35365, Indonesia
5
Department of Geography, Chicago State University, Chicago, IL 60628, USA
*
Author to whom correspondence should be addressed.
Sustainability 2022, 14(21), 14478; https://doi.org/10.3390/su142114478
Submission received: 5 September 2022 / Revised: 31 October 2022 / Accepted: 2 November 2022 / Published: 4 November 2022
(This article belongs to the Special Issue Application of GIS and Spatial Data Analytics in Studies of COVID-19)

Abstract

:
During the first year of the COVID-19 pandemic in Jakarta, Indonesia, the government designated some hospitals as specific COVID-19 healthcare centers to meet demand and ensure accessibility. However, the policy demand evaluation was based on a purely spatial approach. Studies on accessibility to healthcare are widely available, but those that consider temporal as well as spatial dynamics are lacking. This study aims to analyze the spatiotemporal dynamics of healthcare accessibility against COVID-19 cases within the first year of the COVID-19 pandemic, and the overall pattern of spatiotemporal accessibility. A two-step floating catchment area (2SFCA) was used to analyze the accessibility of COVID-19 healthcare against the monthly data of the COVID-19 infected population, as the demand. Such a spatiotemporal approach to 2SFCA has never been used in previous studies. Furthermore, rather than the traditional buffer commonly used to define catchments, the 2SFCA in this study was improved with automated delineation based on the road network using ArcGIS Service Areas Analysis tools. The accessibility tends to follow the distance decay principle, which is relatively high in the city’s center and low in the outskirts. This contrasts with the city’s population distribution, which is higher on the outskirts and lower in the center. This research is a step toward optimizing the spatial distribution of hospital locations to correspond with the severity of the pandemic condition. One method to stop the transmission of disease during a pandemic that requires localizing the infected patient is to designate specific healthcare facilities to manage the sick individuals. ‘What-if’ scenarios may be used to experiment with the locations of these healthcare facilities, which are then assessed using the methodology described in this work to obtain the distribution that is most optimal.

1. Introduction

COVID-19 was initially identified in late December 2019 in Wuhan City, Hubei Province, China [1,2,3,4]. Within a few weeks, the disease had spread to 20 countries worldwide [5,6]. On 30 January 2020, the WHO declared the COVID-19 outbreak as a Public Health Emergency of International Concern (PHEIC) [6]. Various interventions have been put in place to restrict the geographic spread of the disease, including local to national level lockdowns [7,8,9,10], vaccination [11,12], social distancing [13,14,15], personal protection [14], and sociocultural protection [16]. However, the spread of the disease reached 215 countries in early May 2020 [17].
The pandemic in Indonesia started in early March 2020 and reached 56,385 confirmed cases, with 2876 deaths by the end of June 2021 [18,19,20]. Jakarta, as the country’s most populace city in Indonesia (15,907 people per km2 by 2020, based on [21]), has suffered from the highest number of confirmed cases during the first year of the pandemic period (see Figure 1). Figure 1 shows an increasing trend during the observation window (March 2020–March 2021) in COVID-19 cases in Jakarta. From early to mid-2020 (March–July), the case numbers were still below 50,000 but then started going up continuously until reaching 50,000 cases in September. The number then doubled in November and became 150,000 at the end of 2020. The positive cases remained high the following year and hit nearly 350,000 in March 2021.
This pattern has raised concerns about the responsiveness of the healthcare systems throughout the city, while the accessibility to healthcare centers is an important component in controlling the disease and mortality dynamics [23,24,25]. Several hospitals have been appointed COVID-19 designated hospitals in Jakarta to fulfill the demand [26]. The government of Jakarta amended the number of COVID-19 designated hospitals several times to deal with the rise of the COVID-19 incident. However, how the policy affects the spatial accessibility of COVID-19 healthcare facilities from infected populations has not been evaluated. Silalahi et al. [27] analyzed spatial accessibility in the early pandemic period, but the study did not consider the evolution of the policy.
Studies on the spatial accessibility of COVID-19 healthcare facilities have been conducted worldwide with various focuses, such as identifying potential healthcare shortage areas in Florida (USA) [28,29], proposing a rapid accessibility measurement using CyberGIS in Illinois (USA) [30], measuring transport accessibility in Brazil [31], introducing new method on travel distance measurement using Baidu Map API in Wuhan (China) [32], and delineating the spatial scope of services of COVID-19 medical facilities in Yunnan (China) [33]. These studies make use of a single source of demand, which is the population size, as well as a fixed supply (number of hospitals). The accessibility approach demonstrated in this paper, which takes into account the spatiotemporal dynamics of demand (cases) and supply (COVID-19 designated hospital), is novel.
This paper aims to analyze the spatiotemporal patterns of healthcare (COVID-19 designated hospitals) accessibility against the COVID-19 cases within the first year of the COVID-19 pandemic. The 2SFCA method [34], which has been widely used in recent years [35,36,37,38], is used to measure the spatial accessibility of COVID-19 designated hospitals. The method is chosen because studies [34,35,36] confirmed that the 2SFCA technique is more precise in measuring accessibility than other standard measures, such as density measure [25]. The 2SFCA was based on the spatial interaction between supply and demand [39]. In this study, supply (number of beds in hospital) and demand (number of COVID-19 infected population) are studied spatiotemporally. Moreover, we demonstrate the use of automated catchment delineation based on the road network for the 2SFCA analysis using the Service Area toolkit in ArcGIS Pro. The rest of this paper is organized as follows: Section 2 describes the material and methods used in this study, followed by Section 3 with the results. Section 4 presents the discussion, followed by the concluding remarks.

2. Materials and Methods
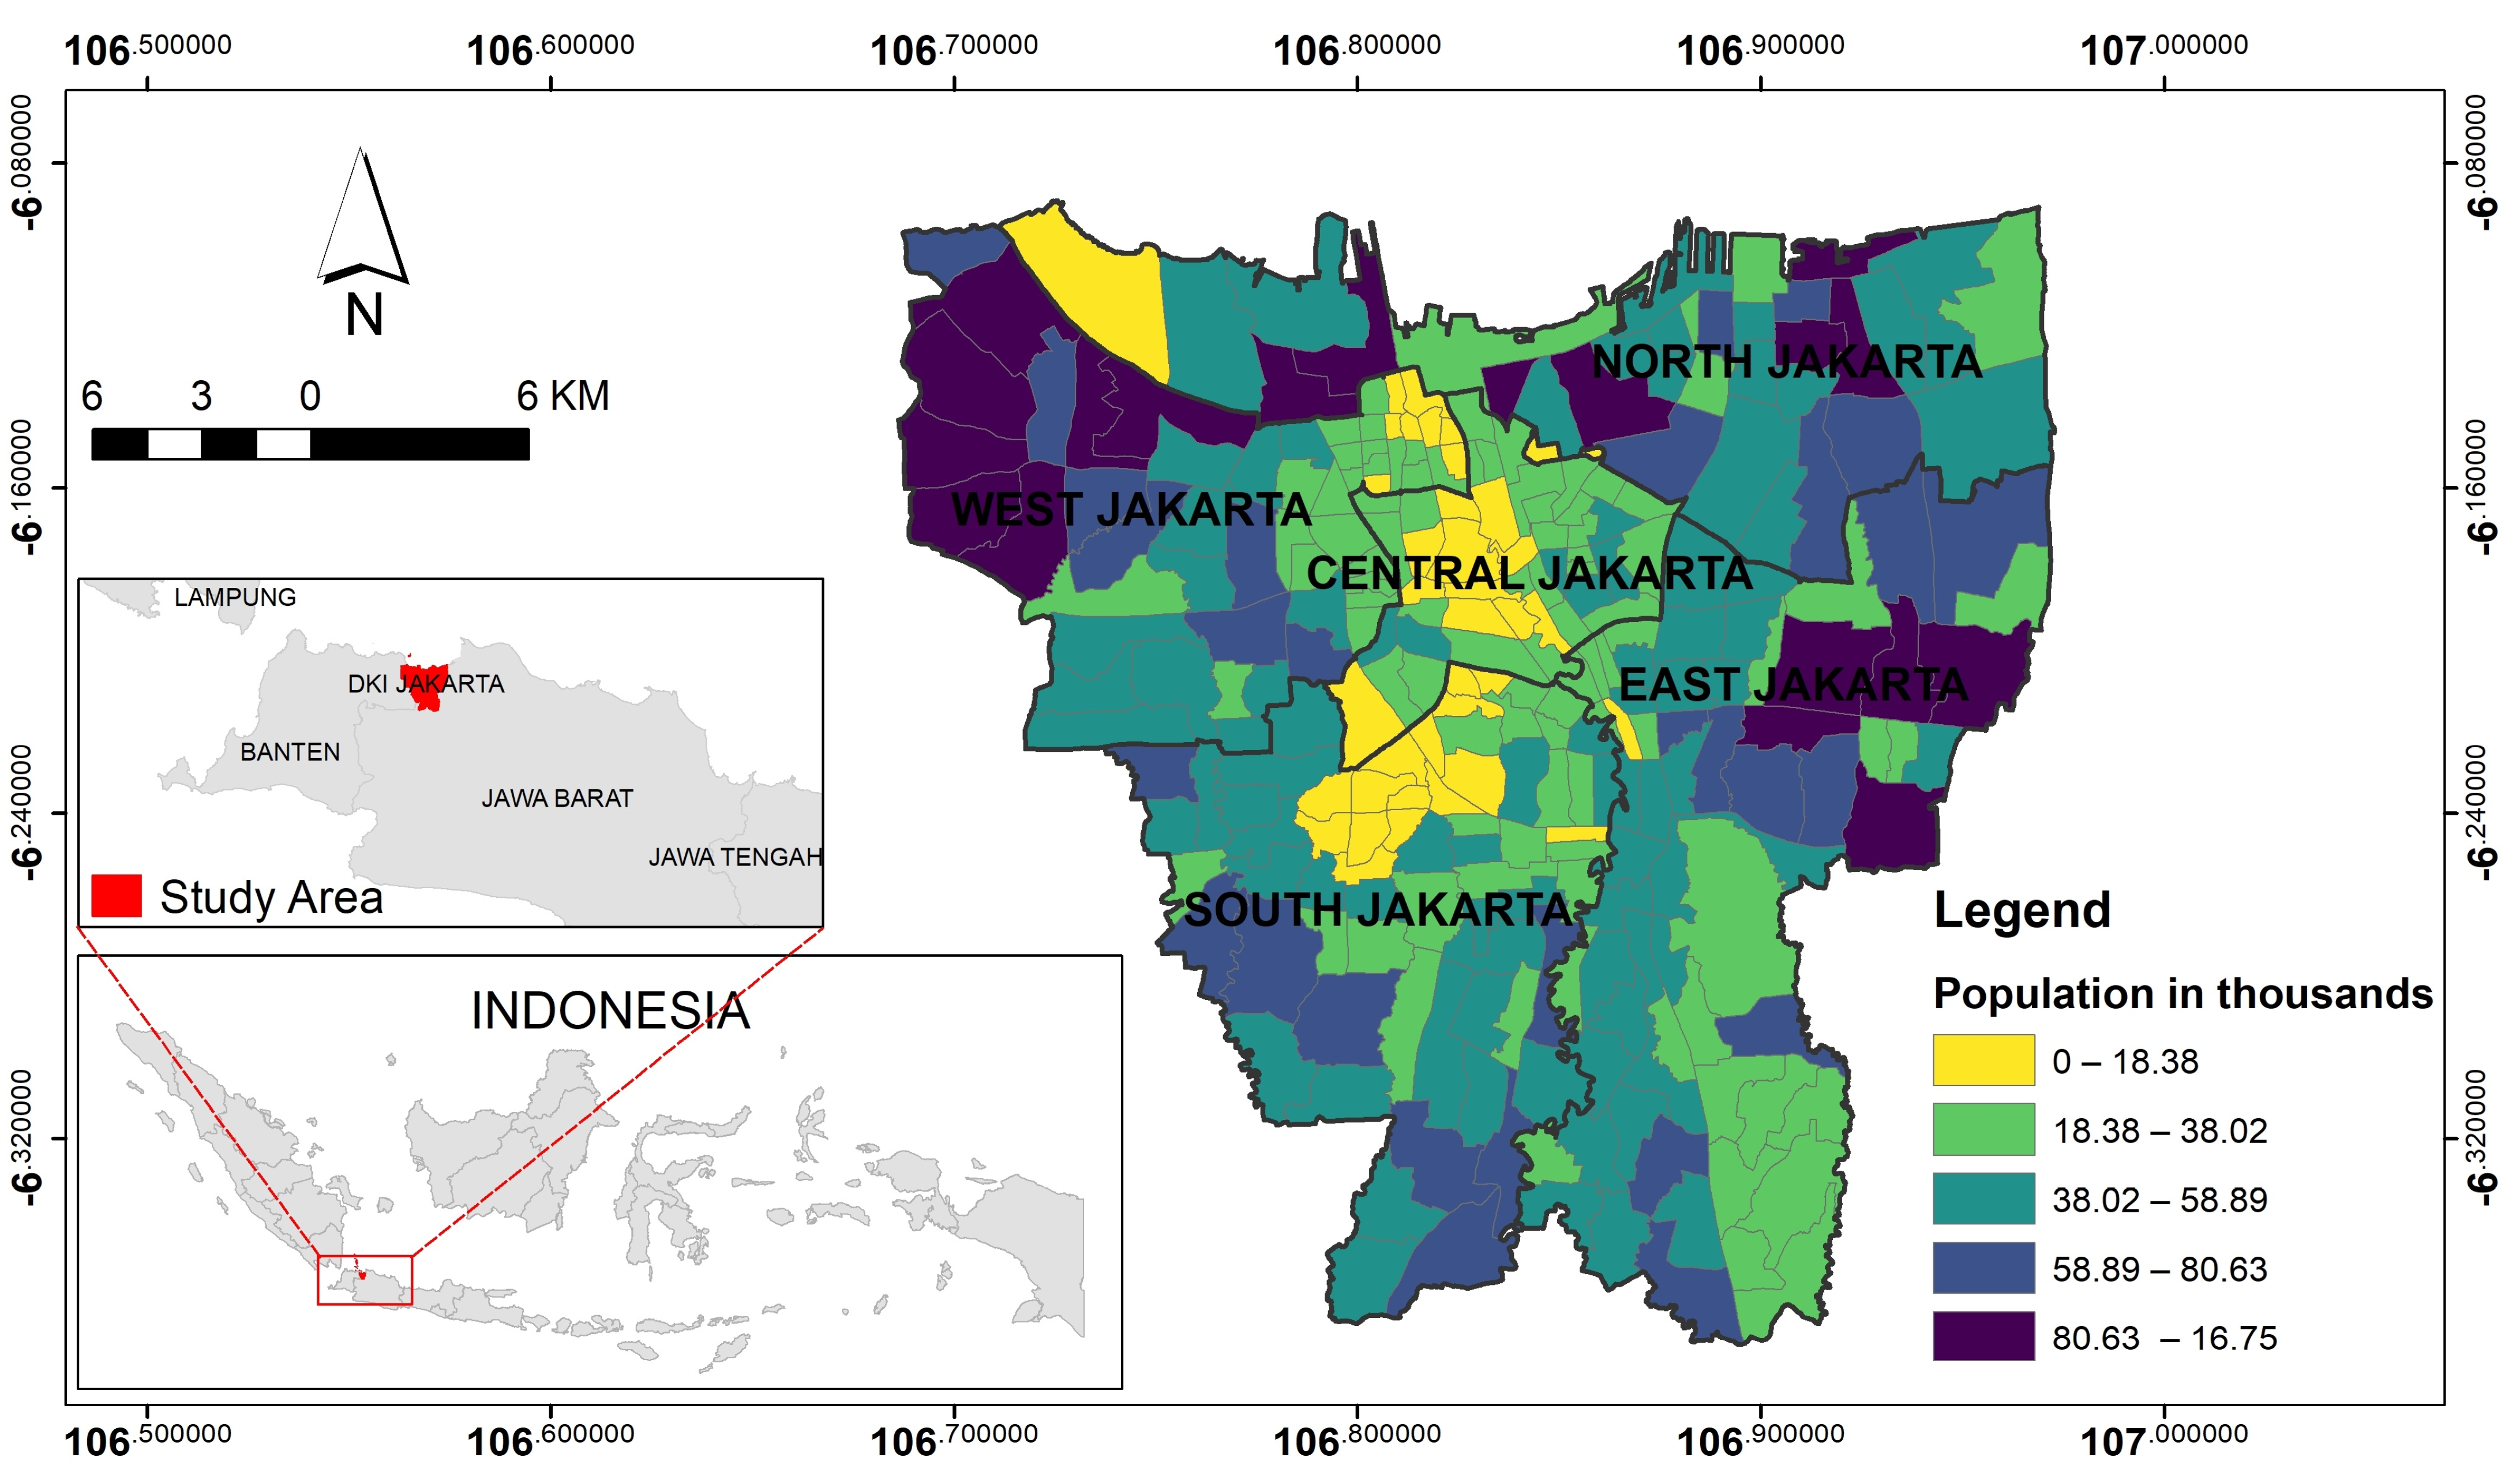
2.1. Study Area

The Special Capital Region of Jakarta (DKI Jakarta), the capital of Indonesia, has been selected as the study area because of its population density. Jakarta covers a total area of 664.01 km2, and in 2020 its population was 10,562,088, which gives a population density of 14,555 people per km2 [21], making it the most populous province in Indonesia. It is located in the western part of the island of Java between 6°12′ South latitude and 106°48′ East longitude (Figure 2). This province consists of five municipalities (north, south, east, west, and central Jakarta) and one regency (Seribu Island). However, in this study, we only focused on regions in Java and dismissed analysis in Seribu Islands.

2.2. Research Framework

This study is divided into three main parts (Figure 3). The first part is data preparation (see Section 2.2.1). The second part is spatiotemporal accessibility analysis, and for this purpose, the 2SFCA method was implemented. The detail of the 2SFCA analysis is elaborated in Section 2.2.2. The third part is analysing the spatial variation of accessibility based on the spatiotemporal data (see Section 2.2.3). The research process begins with gathering administrative data, monthly COVID-19 data, and the hospital’s location. Administrative boundary data are combined with monthly COVID-19 data to produce spatiotemporal data on COVID-19 cases. The accessibility of healthcare services is then analyzed using 2SFCA by incorporating spatiotemporal hospital data. Figure 3 shows details about the research flow chart.

2.2.1. Data Preparation

In this part, spatial data of census tract (administrative boundary) in the lowest level and monthly COVID-19 data were used to prepare the spatiotemporal data of COVID-19 cases on a monthly basis. The data sources are (1) daily reports of COVID-19 data [40], and (2) designated hospitals for COVID-19 data [41]. Data on confirmed infections and deaths from daily reports were merged to get the total monthly number. The spatiotemporal data of COVID-19 assigned hospitals are also prepared in this part. Four periods are involved in the analysis based on the governor act of hospitals assignment as COVID-19 referral hospital [39,40,41,42,43].

2.2.2. SFCA Analysis

A two-step floating catchment area (2SFCA) [34] was used to analyze the accessibility of COVID-19 healthcare (see Figure 3) to the monthly data from the COVID-19 infected population. The 2SFCA method [34] measures the spatial accessibility of COVID-19 designated hospitals based on the spatial interaction between supply and demand. Initially, this method evaluates physical accessibility to health care services based on a gravity model and spatial decomposition method [39,42].
The 2SFCA method uses a two-step search procedure [43], as indicated in Equation (1). There are two kinds of catchment involved in the calculation. The first catchment expresses the service area of each hospital. The second catchment indicates the possible travel area from the center of the area. Lee [44] suggested that the maximum service distance is 30 min travel. In this study, we applied automated catchment delineation based on the road network using Service Area toolkit in ArcGIS Pro, limiting the catchment areas to 30 min of travel time [44]. The supply-to-demand ratio Rj is calculated by dividing the capacity (the number of beds) of a COVID-19 referral hospital Sj (the supply) by the total of the COVID-19 infected population Pk (the demand) within a catchment area (first catchment). This step assesses the supply’s ability to meet the needs of the COVID-19 infected population within its service area. The accessibility index Ai for demand point i is calculated in the second stage as a sum of the Rj calculated in the first step, as indicated in Equation (2). The total is based on all service providers within the catchment (second catchment), which conceptualizes the population’s activity space at site i.
R j = S j k   { d k j d 0 }   P k
A i = j   { d i j d 0 }               R j = j   { d i j d 0 }     S j k   { d k j d 0 }   P k

2.2.3. Zonation of Accessibility and Spatial Disparity Analysis

We use multivariate clustering in ArcGIS [45] to regionalize areas with similar characteristics. The Multivariate Clustering tool uses unsupervised machine learning techniques. These clustering techniques do not depend on a collection of features that have already been pre-classified to direct or train the approach in order to identify clusters in the spatiotemporal accessibility data [46]. On the other hand, we conducted a multi-ring buffer analysis with a radius from 2 to 22 km with an interval 2 km from the city center and covering whole areas of the city. The multi-ring buffer and the clustering results are then overlayed. The cluster value and the distance attributes are examined by Pearson correlation to find out whether the accessibility follows a certain pattern.

3. Results

3.1. The First Year Period of COVID-19 Pandemic in Jakarta

COVID-19 cases in Jakarta continued to increase from March 2020 to February 2021. Nearly 350,000 cases were confirmed by February 2021 (Figure 4). However, this was followed by a high recovery rate in COVID-19 patients. Based on data from January 2021, DKI Jakarta became one of the provinces with a >80% recovery rate out of the 16 provinces in Indonesia [47]. Meanwhile, the death rate due to COVID-19 has also increased from time to time. Based on the graph, the number of cases, recovery, and death rates due to COVID-19 have parallel increasing trends.
Figure 5 depicts the spatial distribution of the monthly increase in COVID-19 cases in DKI Jakarta across all areas. COVID cases began in September 2020, as shown in Figure 5, and spread throughout DKI Jakarta over the next five months. The case’s high velocity could be attributed to areas with high mobility. COVID-19 cases peaked in almost every region in January 2021.

3.2. COVID-19 Healthcare Services Dynamic

As shown in Figure 6, different hospitals have been assigned to serve COVID-19 patients at different times. Between April 2020 and March 2021, the number of hospitals assigned grew. Figure 6a depicts six hospitals at the start of the pandemic, 30 in May 2020, and 45 from September to December 2020. The 59 hospitals assigned in January 2021 are shown in Figure 6d. Figure 6’s addition of hospitals does not match Figure 5’s distribution of cases since the added facilities are all in Central Jakarta. East Jakarta’s hospitals, the most densely populated area, clearly have limited capacity.

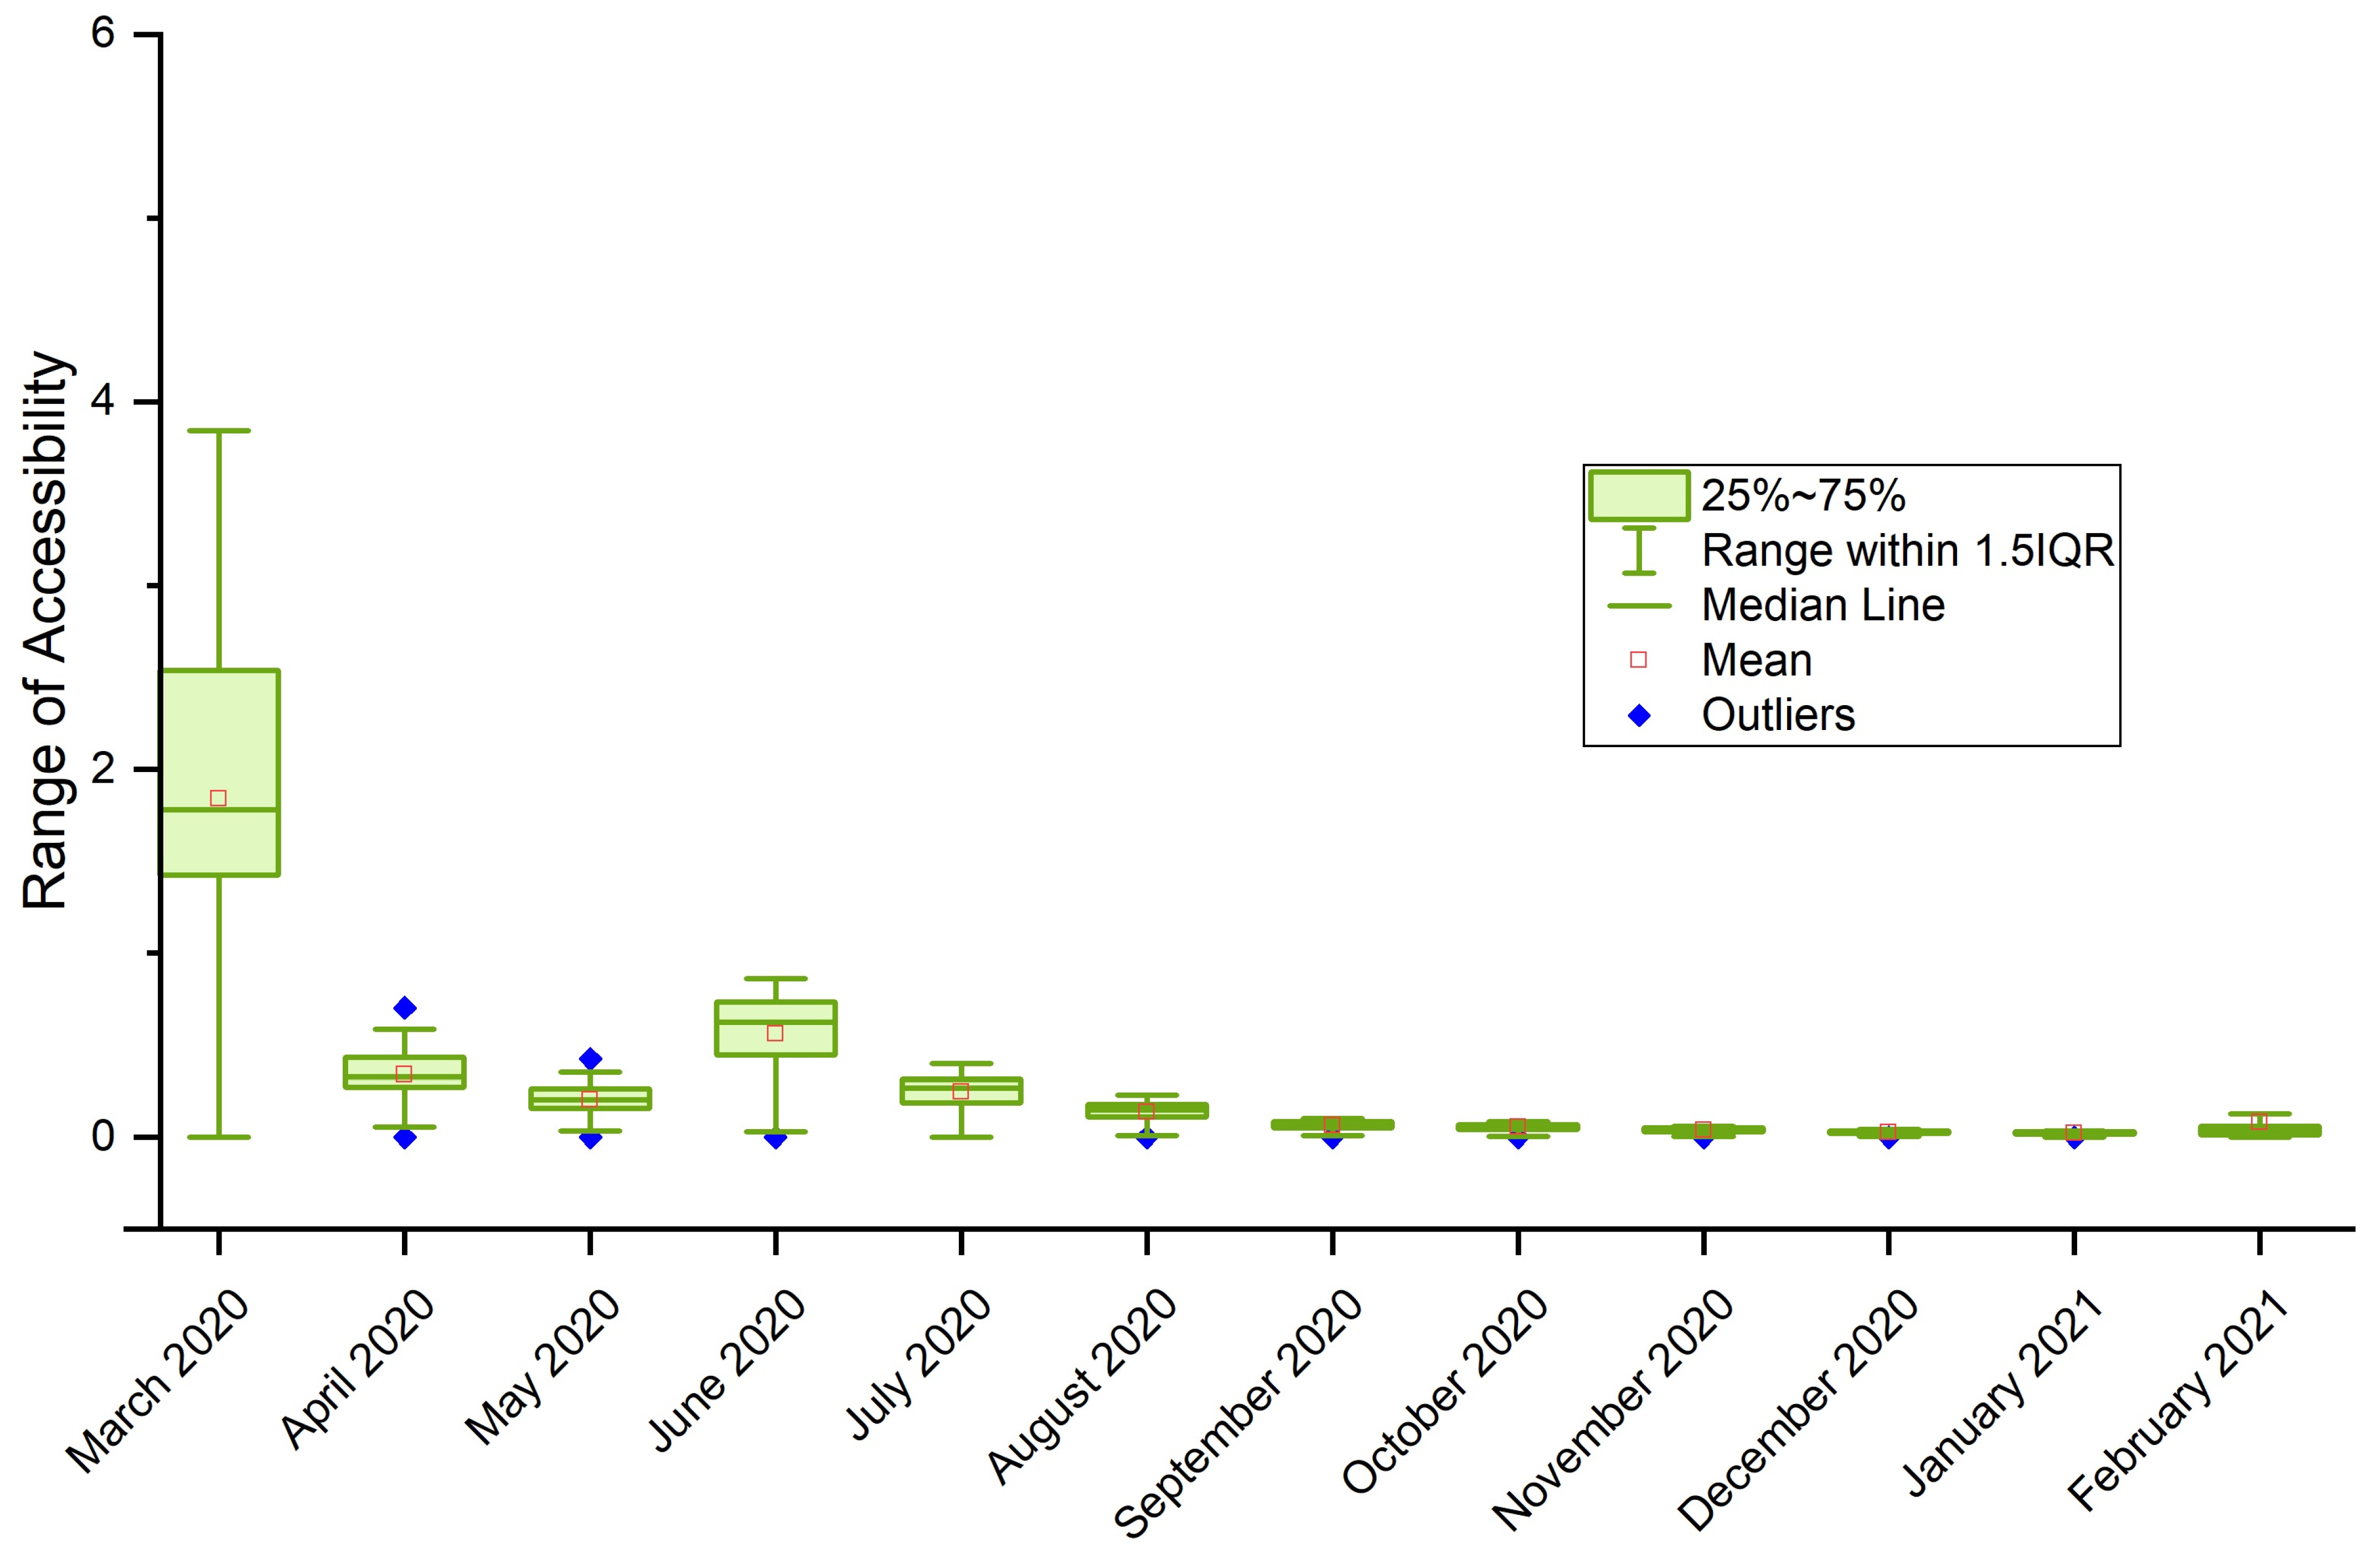
Spatiotemporal Dynamics of COVID-19 Healthcare Service Accessibility

When the pandemic began in March 2020, the level of healthcare accessibility for the COVID-19-infected population in Jakarta was reported to be high (Figure 7). Between April and May of 2020, accessibility was reduced. Some areas have less access to healthcare facilities due to increased COVID-19 cases. Although adding new hospitals in June helped improve accessibility, accessibility slightly decreased from July 2020 to February 2021.
Some areas had persistently poor accessibility. They are in the Penjaringan, Kembangan, Cilincing, and Ciracas sub-districts. Figure 7 shows that people living on the outskirts of cities are far from hospitals. People who live in the inner-city of Jakarta, where a few large hospitals are located, have better access. Figure 7c shows that there was a significant decline in access in Jakarta’s eastern area before it improved, as shown in Figure 7d, due to the addition of a number of hospitals in June. However, healthcare accessibility declined again on the following month, despite the fact. This indicates that the condition of COVID-19 in DKI Jakarta is almost evenly distributed, implying that people living far from the hospital will have difficulty accessing health care.
Figure 8 illustrates the temporal distribution of accessibility. By the end of the period, average accessibility had decreased while the number of infected people had also increased. The worst condition was reached in January 2021, when the total number of confirmed cases increased by 71% at the national level [52] that was started from two cases in March [53]. The figure also shows that increasing the number of hospitals from 6 to 30 by June 2020 significantly affected healthcare accessibility. However, adding 15 hospitals in September did not significantly improve conditions compared to August 2020. This was because the rules were stricter from April to June 2020, known as Large-Scale Social Restrictions (PSBB) [54], whereas from June to September, the policy used was the Transitional PSBB, which allowed workers to enter offline (WFO) with 50% capacity.
The transitional lockdown regulation was extended from October to January 2021, after which it was replaced with the Enforcement of Community Activity Restrictions (PPKM) for the Java and Bali regions. The difference between PPKM and PSBB is that PPKM only applies to seven provinces on Java and Bali. WFO capacity has also increased to 75% occupancy, with a maximum capacity of 50% for teaching and learning activities. Due to an increase in COVID-19 positive cases and the leniency being used, the degree of community access to hospitals is minimal during this lockdown time. Because the government believes that cases can be controlled, and the COVID-19 vaccine has been distributed since December 2020, then the new normal period was applied.

3.3. Accessibility Clusters

Figure 9a shows the results of the multivariate clusters of accessibility based on twelve-month spatial data of accessibility. There are 60 sub-districts categorized in low accessibility (cluster 1), and each of 100 sub-districts for moderate (cluster 2) and high accessibility (cluster 3). During the research time, certain areas outside of Jakarta are less accessible to healthcare compared to the inner city. On the contrary, the inner city is less populated compared to the outskirt as illustrated in Figure 9b. The accessibility is strongly correlated with the distance from the center of the city of Jakarta (Figure 9c). The farther from the inner city, the lower the accessibility (R = −0.78, ρ < 2.2 × 10⁻¹⁶).

4. Discussion and Future Works

One strategy to reduce the spread of diseases such as COVID-19 is to localise infected patients to particular healthcare institutions. This strategy has been employed in cities in China [33] and India [54], as well as in our case study area of Jakarta, Indonesia [27]. This study has evaluated the spatiotemporal accessibility to such healthcare services (those that have been designated to treat COVID-19 patients specifically) during the pandemic period. This is an important step toward better matching the geographic distribution of hospital locations to the number of patients and the severity of the pandemic. Accessibility to healthcare services strongly correlates with the population’s health [55], making it is essential to evaluate policies in the context of healthcare facilities’ capacities and accessibility [56]. We used a two-step floating catchment area (2SFCA) approach to evaluate the spatiotemporal accessibility over the first year of the pandemic. The study shows that: (1) some areas on the outskirts of Jakarta experience low accessibility for the entire period, and (2) the accessibility tends to follow the distance decay principle where it is high in the inner city and low in the outer city.
Spatial disparities in health services are a common problem in urban areas that have been examined in other big cities such as Beijing and Seoul [57,58]. One of the reasons for this is the centralization of healthcare services, where large hospitals have developed in the inner city [59]. This is not the case in Jakarta, however, as hospitals are quite widely distributed. That said, only a portion of all hospitals were appointed as COVID-19 designated hospitals, which has significant implications for accessibility to COVID-19 services specifically. In addition, the government may change the designation of healthcare institutions if the pandemic situation worsens and the number of patients rises, so accessibility must be regularly re-evaluated. In order to ensure that infected populations have sufficient access to healthcare facilities, the distribution of infected persons should be taken into account when choosing which healthcare facilities should be designated to treat COVID-19. In our study, we found that these choices may not have been ideal as patients in the outer areas of the city appear to have lower levels of accessibility when compared to those in the inner areas. One of the potential future benefits of this work is that we can select the most optimal healthcare accessibility for each period of the pandemic by applying ‘what-if’ scenarios, designing different types of healthcare facility distribution using the approach employed in this paper.
Despite its effectiveness and potential for use in maximizing hospital appointments during a pandemic, the spatiotemporal accessibility analysis used here could be improved by addressing a number of issues. The first relates to data accuracy. Due to limitations on testing capacity and residents’ willingness to be tested, the number of cases used in this study will not be precise [40]. Indonesia’s testing rate varies [60,61,62], and it was ranked fourth among the world’s worst testing rates at the start of the pandemic period [63]. Fortunately, however, Jakarta has a better COVID-19 test rate than the rest of Indonesia [47]. Second, it was preferable to take the hospitalization rate into account when calculating hospital demand. The 2SFCA method, as previously stated, was developed to assess physical accessibility to health care services, with the number of infected people representing demand. Hospitals are not located or designed in such a way that they can accommodate the entire infected population, so alternative locations for COVID-19 treatment should emerge. To reduce the burden on hospitals, the Indonesian government and other countries introduced the term self-isolation at home for asymptomatic and symptomatic patients. This information should be considered to measure accessibility.

5. Conclusions

This study examines the spatiotemporal dynamics of healthcare accessibility in Jakarta during Indonesia’s first year of the COVID-19 pandemic. The study shows that some locations on the outskirts of Jakarta had low accessibility during the study duration. The accessibility pattern complies with the distance decay principle, where accessibility tends to follow the same pattern inside the city. It contrasts the population distribution, which is higher in the city’s outskirts and lowers in the center. Spatial accessibility evaluation should be conducted when planning the distribution of healthcare since accessibility to healthcare is an important aspect for combating the pandemic. This study is a step toward better matching the geographic distribution of hospital locations to the number of patients and the severity of the pandemic condition. Appointing particular healthcare institutions to manage sick people during such a pandemic scenario is one strategy to reduce the spread of illness. ‘What-if’ scenario analysis can be applied to design multiple configurations of healthcare facilities, then evaluated by the approach presented in this paper to explore optimum distributions.

Author Contributions

Conceptualization, J.J. and V.N.F.; methodology, J.J., V.N.F. and H.Z.H.; data collection, J.J. and V.N.F.; data analysis, J.J., V.N.F., H.Z.H. and A.R.; writing—original draft preparation, J.J., V.N.F., H.Z.H., M.I.T.S., K.D.P., S.J.C., P.D.N. and A.R; writing—review and editing, J.J., V.N.F., H.Z.H., M.I.T.S., K.D.P., N.A.S., S.J.C., P.D.N., N.S.M., A.R. and A.L.; visualization, J.J., V.N.F., H.Z.H., S.J.C., P.D.N. and A.R.; funding acquisition, J.J. All authors have read and agreed to the published version of the manuscript.

Funding

This research was funded by HIT Program of Universitas Muhammadiyah Surakarta, Indonesia.

Data Availability Statement

All datasets used in this research are available in the link https://dx.doi.org/10.17605/OSF.IO/CZS74, accessed on 4 September 2022.

Acknowledgments

The authors would like to acknowledge the anonymous reviewers for useful comments in improving this paper. Additionally, for Khusna Furoida and Darin T. Madani who helped on the data collection.

Conflicts of Interest

The authors declare no conflict of interest.

References

  1. Ciotti, M.; Angeletti, S.; Minieri, M.; Giovannetti, M.; Benvenuto, D.; Pascarella, S.; Sagnelli, C.; Bianchi, M.; Bernardini, S.; Ciccozzi, M. COVID-19 Outbreak: An Overview. CHE 2019, 64, 215–223. [Google Scholar] [CrossRef] [PubMed]
  2. Zhu, N.; Zhang, D.; Wang, W.; Li, X.; Yang, B.; Song, J.; Zhao, X.; Huang, B.; Shi, W.; Lu, R.; et al. A Novel Coronavirus from Patients with Pneumonia in China, 2019. N. Engl. J. Med. 2020, 382, 727–733. [Google Scholar] [CrossRef] [PubMed]
  3. Hadibasyir, H.Z.; Rijal, S.S.; Sari, D.R. Comparison of Land Surface Temperature During and Before the Emergence of COVID-19 Using Modis Imagery in Wuhan City, China. Forum Geogr. 2020, 34, 1–15. [Google Scholar] [CrossRef]
  4. Permatasari, A.L.; Suherningtyas, I.A.; Febriarta, E.; Wiguna, P.P.K. Analysis of Vulnerability to Transmission of the COVID-19 Based on Building Function at Padukuhan Mancasan Kleben, Pandowoharjo, Sleman, Yogyakarta. Forum Geogr. 2022, 35, 169–178. [Google Scholar] [CrossRef]
  5. Hamzah, F.B.; Lau, C.; Nazri, H.; Ligot, D.V.; Lee, G.; Tan, C.L.; Shaib, M.; Zaidon, U.H.B.; Abdullah, A.B.; Chung, M.H. CoronaTracker: Worldwide COVID-19 Outbreak Data Analysis and Prediction. Bull. World Health Organ. 2020, 1, 1–32. [Google Scholar]
  6. WHO. COVID 19 Public Health Emergency of International Concern (PHEIC). Global Research and Innovation Forum: Towards a Research Roadmap; WHO: Geneva, Switzerland, 2020. [Google Scholar]
  7. Lau, H.; Khosrawipour, V.; Kocbach, P.; Mikolajczyk, A.; Schubert, J.; Bania, J.; Khosrawipour, T. The Positive Impact of Lockdown in Wuhan on Containing the COVID-19 Outbreak in China. J. Travel Med. 2020, 27, taaa037. [Google Scholar] [CrossRef] [Green Version]
  8. The Lancet. India under COVID-19 Lockdown. Lancet 2020, 395, 1315. [Google Scholar] [CrossRef]
  9. Pepe, E.; Bajardi, P.; Gauvin, L.; Privitera, F.; Lake, B.; Cattuto, C.; Tizzoni, M. COVID-19 Outbreak Response, a Dataset to Assess Mobility Changes in Italy Following National Lockdown. Sci. Data 2020, 7, 230. [Google Scholar] [CrossRef]
  10. Ghazali, M.F.; Tridawati, A.; Sugandi, M.; Anesta, A.F.; Wikantika, K. Spatial Analysis to Mitigate the Spread of COVID-19 Based on Regional Demographic Characteristics. Forum Geogr. 2021, 35, 57–73. [Google Scholar] [CrossRef]
  11. Grauer, J.; Löwen, H.; Liebchen, B. Strategic Spatiotemporal Vaccine Distribution Increases the Survival Rate in an Infectious Disease like COVID-19. Sci. Rep. 2020, 10, 21594. [Google Scholar] [CrossRef]
  12. Haque, A.; Pant, A.B. Efforts at COVID-19 Vaccine Development: Challenges and Successes. Vaccines 2020, 8, 739. [Google Scholar] [CrossRef] [PubMed]
  13. Qian, M.; Jiang, J. COVID-19 and Social Distancing. J. Public Health 2022, 30, 259–261. [Google Scholar] [CrossRef] [PubMed]
  14. Wu, J.; Tang, B.; Bragazzi, N.L.; Nah, K.; McCarthy, Z. Quantifying the Role of Social Distancing, Personal Protection and Case Detection in Mitigating COVID-19 Outbreak in Ontario, Canada. J. Math. Ind. 2020, 10, 15. [Google Scholar] [CrossRef] [PubMed]
  15. Amin, C.; Priyono, P.; Umrotun, U.; Fatkhiyah, M.; Sufahani, S.F. Exploring the Prevalence of Protective Measure Adoption in Mosques during the COVID-19 Pandemic in Indonesia. Sustainability 2021, 13, 13927. [Google Scholar] [CrossRef]
  16. Bahagia, B.; Hudayana, B.; Wibowo, R.; Anna, Z. Local Wisdom to Overcome COVID-19 Pandemic of Urug and Cipatat Kolot Societies in Bogor, West Java, Indonesia. Forum Geogr. 2020, 34, 146–160. [Google Scholar] [CrossRef]
  17. Nzediegwu, C.; Chang, S.X. Improper Solid Waste Management Increases Potential for COVID-19 Spread in Developing Countries. Resour. Conserv. Recycl. 2020, 161, 104947. [Google Scholar] [CrossRef]
  18. Purwanto, P.; Utaya, S.; Handoyo, B.; Bachri, S.; Astuti, I.S.; Utomo, K.S.B.; Aldianto, Y.E. Spatiotemporal Analysis of COVID-19 Spread with Emerging Hotspot Analysis and Space–Time Cube Models in East Java, Indonesia. ISPRS Int. J. Geo-Inf. 2021, 10, 133. [Google Scholar] [CrossRef]
  19. Saputra, A.; Setiawan, W.; Arif, M.; Sriyono; Nurmalasari, I.R.; Dijaya, R.; Ulinuha, A.; Hermawan, S. Non-Medical risk assessment of COVID-19 in parts of Central and East Java, Indonesia. Quaest. Geogr. 2022, 41, 147–169. [Google Scholar] [CrossRef]
  20. Jumadi, J.; Fikriyah, V.; Hadibasyir, H.; Priyono, K.; Musiyam, M.; Mardiah, A.; Rohman, A.; Hasyim, H. A Year Spatiotemporal Clusters of Covid-19 in Indonesia. Quaest. Geogr. 2022, 41, 139–151. [Google Scholar] [CrossRef]
  21. BPS Provinsi DKI Jakarta Dalam Angka 2021. Available online: https://jakarta.bps.go.id/publication/2021/02/26/bb7fa6dd5e90b534e3fa6984/provinsi-dki-jakarta-dalam-angka-2021.html (accessed on 30 March 2020).
  22. Ministry of Health Republic of Indonesia Media Informasi Resmi Terkini Penyakit Infeksi Emerging. Available online: https://infeksiemerging.kemkes.go.id/document/download/cover (accessed on 30 March 2020).
  23. Hierink, F.; Okiro, E.A.; Flahault, A.; Ray, N. The Winding Road to Health: A Systematic Scoping Review on the Effect of Geographical Accessibility to Health Care on Infectious Diseases in Low- and Middle-Income Countries. PLoS ONE 2021, 16, e0244921. [Google Scholar] [CrossRef]
  24. Ji, Y.; Ma, Z.; Peppelenbosch, M.P.; Pan, Q. Potential Association between COVID-19 Mortality and Health-Care Resource Availability. Lancet Glob. Health 2020, 8, e480. [Google Scholar] [CrossRef]
  25. Sun, Y.; Hu, X.; Xie, J. Spatial Inequalities of COVID-19 Mortality Rate in Relation to Socioeconomic and Environmental Factors across England. Sci. Total Environ. 2021, 758, 143595. [Google Scholar] [CrossRef] [PubMed]
  26. Nugraha, B.; Wahyuni, L.K.; Laswati, H.; Kusumastuti, P.; Tulaar, A.B.; Gutenbrunner, C. COVID-19 Pandemic in Indonesia: Situation and Challenges of Rehabilitation Medicine in Indonesia. Acta Med. Indones. 2020, 52, 299–305. [Google Scholar] [PubMed]
  27. Silalahi, F.E.S.; Hidayat, F.; Dewi, R.S.; Purwono, N.; Oktaviani, N. GIS-Based Approaches on the Accessibility of Referral Hospital Using Network Analysis and the Spatial Distribution Model of the Spreading Case of COVID-19 in Jakarta, Indonesia. BMC Health Serv. Res. 2020, 20, 1053. [Google Scholar] [CrossRef]
  28. Ghorbanzadeh, M.; Kim, K.; Erman Ozguven, E.; Horner, M.W. Spatial Accessibility Assessment of COVID-19 Patients to Healthcare Facilities: A Case Study of Florida. Travel Behav. Soc. 2021, 24, 95–101. [Google Scholar] [CrossRef]
  29. Kim, K.; Ghorbanzadeh, M.; Horner, M.W.; Ozguven, E.E. Identifying Areas of Potential Critical Healthcare Shortages: A Case Study of Spatial Accessibility to ICU Beds during the COVID-19 Pandemic in Florida. Transp. Policy 2021, 110, 478–486. [Google Scholar] [CrossRef]
  30. Kang, J.-Y.; Michels, A.; Lyu, F.; Wang, S.; Agbodo, N.; Freeman, V.L.; Wang, S. Rapidly Measuring Spatial Accessibility of COVID-19 Healthcare Resources: A Case Study of Illinois, USA. Int. J. Health Geogr. 2020, 19, 36. [Google Scholar] [CrossRef]
  31. Pereira, R.H.M.; Braga, C.K.V.; Servo, L.M.; Serra, B.; Amaral, P.; Gouveia, N.; Paez, A. Geographic Access to COVID-19 Healthcare in Brazil Using a Balanced Float Catchment Area Approach. Soc. Sci. Med. 2021, 273, 113773. [Google Scholar] [CrossRef]
  32. Zhou, Z.; Xu, Z.; Liu, A.; Zhou, S.; Mu, L.; Zhang, X. Mapping the Accessibility of Medical Facilities of Wuhan during the COVID-19 Pandemic. ISPRS Int. J. Geo-Inf. 2021, 10, 318. [Google Scholar] [CrossRef]
  33. Zheng, L.; Li, J.; Hu, W.; Duan, P. Analysis of the Spatial Range of Service and Accessibility of Hospitals Designated for Coronavirus Disease 2019 in Yunnan Province, China. Geocarto Int. 2022, 37, 6519–6537. [Google Scholar] [CrossRef]
  34. Luo, W.; Wang, F. Measures of Spatial Accessibility to Health Care in a GIS Environment: Synthesis and a Case Study in the Chicago Region. Environ. Plan. B Plan. Des. 2003, 30, 865–884. [Google Scholar] [CrossRef] [PubMed]
  35. Zhang, S.; Yu, P.; Chen, Y.; Jing, Y.; Zeng, F. Accessibility of Park Green Space in Wuhan, China: Implications for Spatial Equity in the Post-COVID-19 Era. Int. J. Environ. Res. Public Health 2022, 19, 5440. [Google Scholar] [CrossRef] [PubMed]
  36. Shao, Y.; Luo, W. Supply-Demand Adjusted Two-Steps Floating Catchment Area (SDA-2SFCA) Model for Measuring Spatial Access to Health Care. Soc. Sci. Med. 2022, 296, 114727. [Google Scholar] [CrossRef] [PubMed]
  37. Wu, J.; Fu, J.; Wang, H.; Zhao, Y.; Yi, T. Identifying Spatial Matching between the Supply and Demand of Medical Resource and Accessing Carrying Capacity: A Case Study of Shenzhen, China. Int. J. Environ. Res. Public Health 2022, 19, 2354. [Google Scholar] [CrossRef]
  38. Lotfata, A.; Tao, R.; Su, Y. Evaluating the Walking Accessibility of Cook County’s Public Schools to Use as Open Space. Int. J. Urban Sci. 2022, 1–18. [Google Scholar] [CrossRef]
  39. Radke, J.; Mu, L. Spatial Decompositions, Modeling and Mapping Service Regions to Predict Access to Social Programs. Geogr. Inf. Sci. 2000, 6, 105–112. [Google Scholar] [CrossRef]
  40. Pemerintah Provinsi DKI Jakarta. Open Data COVID-19 Provinsi DKI Jakarta. Available online: https://riwayat-file-covid-19-dki-jakarta-jakartagis.hub.arcgis.com (accessed on 30 March 2020).
  41. Daftar Rumah Sakit Rujukan. Available online: https://covid19.go.id/daftar-rumah-sakit-rujukan (accessed on 30 March 2020).
  42. Joseph, A.E.; Bantock, P.R. Measuring Potential Physical Accessibility to General Practitioners in Rural Areas: A Method and Case Study. Soc. Sci. Med. 1982, 16, 85–90. [Google Scholar] [CrossRef]
  43. Chen, X.; Jia, P. A Comparative Analysis of Accessibility Measures by the Two-Step Floating Catchment Area (2SFCA) Method. Int. J. Geogr. Inf. Sci. 2019, 33, 1739–1758. [Google Scholar] [CrossRef]
  44. Lee, R.C. Current Approaches to Shortage Area Designation. J. Rural. Health 1991, 7, 437–450. [Google Scholar]
  45. Multivariate Clustering (Spatial Statistics)—ArcGIS Pro | Documentation. Available online: https://pro.arcgis.com/en/pro-app/2.8/tool-reference/spatial-statistics/multivariate-clustering.htm (accessed on 2 September 2022).
  46. How Multivariate Clustering Works—ArcGIS Pro | Documentation. Available online: https://pro.arcgis.com/en/pro-app/2.8/tool-reference/spatial-statistics/how-multivariate-clustering-works.htm (accessed on 2 September 2022).
  47. STP COVID-19. Analisis Data COVID-19 Indonesia Update Per 3 Januari 2021. 2021. Available online: https://covid19.go.id/v/analisis-data-covid-19-indonesia-update-3-januari-2021 (accessed on 2 September 2022).
  48. KEPGUB NO. 1421/2021 PENETAPAN RUMAH SAKIT RUJUKAN PENANGGULANGAN PENYAKIT CORONAVIRUS DISEASE (COVID-19). Available online: https://jdih.jakarta.go.id/himpunan/produkhukum_detail/11255 (accessed on 29 May 2022).
  49. KEPGUB NO. 987/2021 PENETAPAN RUMAH SAKIT RUJUKAN PENANGGULANGAN PENYAKIT CORONAVIRUS DISEASE (COVID-19). Available online: https://jdih.jakarta.go.id/himpunan/produkhukum_detail/11070 (accessed on 29 May 2022).
  50. KEPGUB NO. 494/2020 PENETAPAN RUMAH SAKIT RUJUKAN PENANGGULANGAN PENYAKIT CORONAVIRUS DISEASE (COVID-19). Available online: https://jdih.jakarta.go.id/himpunan/produkhukum_detail/10199 (accessed on 29 May 2022).
  51. KEPGUB NO. 378/2020 PENETAPAN RUMAH SAKIT RUJUKAN PENANGGULANGAN PENYAKIT CORONAVIRUS DISEASE (COVID-19). Available online: https://jdih.jakarta.go.id/himpunan/produkhukum_detail/10200 (accessed on 29 May 2022).
  52. Sirkeci, I.; Yucesahin, M.M. Coronavirus and Migration: Analysis of Human Mobility and the Spread of COVID-19. Migr. Lett. 2020, 17, 379–398. [Google Scholar] [CrossRef] [Green Version]
  53. Gorbiano, M. BREAKING: Jokowi Announces Indonesia’s First Two Confirmed COVID-19 Cases—National—The Jakarta Post. Available online: https://www.thejakartapost.com/news/2020/03/02/breaking-jokowi-announces-indonesias-first-two-confirmed-covid-19-cases.html (accessed on 31 July 2021).
  54. Singh, L.K.; Tikka, S.K. Nondisrupted, Safety Ensured, Opioid Substitution Clinic in a COVID-19 Designated Hospital of a Resource-Limited State in India. Asia-Pac. Psychiatry 2021, 13, e12428. [Google Scholar] [CrossRef] [PubMed]
  55. Xia, Y.; Chen, H.; Zuo, C.; Zhang, N. The Impact of Traffic on Equality of Urban Healthcare Service Accessibility: A Case Study in Wuhan, China. Sustain. Cities Soc. 2022, 86, 104130. [Google Scholar] [CrossRef]
  56. Ni, J.; Liang, M.; Lin, Y.; Wu, Y.; Wang, C. Multi-Mode Two-Step Floating Catchment Area (2SFCA) Method to Measure the Potential Spatial Accessibility of Healthcare Services. ISPRS Int. J. Geo-Inf. 2019, 8, 236. [Google Scholar] [CrossRef] [Green Version]
  57. Gong, S.; Gao, Y.; Zhang, F.; Mu, L.; Kang, C.; Liu, Y. Evaluating Healthcare Resource Inequality in Beijing, China Based on an Improved Spatial Accessibility Measurement. Trans. GIS 2021, 25, 1504–1521. [Google Scholar] [CrossRef]
  58. Kim, Y.; Byon, Y.-J.; Yeo, H. Enhancing Healthcare Accessibility Measurements Using GIS: A Case Study in Seoul, Korea. PLoS ONE 2018, 13, e0193013. [Google Scholar] [CrossRef]
  59. Giarchi, G.G. Distance Decay and Information Deprivation: Health Implications for People in Rural Isolation. In New Directions in the Sociology of Health; Routledge: London, UK, 1990; ISBN 978-1-351-14172-7. [Google Scholar]
  60. Angka Testing Indonesia Per Juli 2021 Sudah 4 Kali Melampaui Standar WHO—Berita Terkini. Available online: https://covid19.go.id/p/berita/angka-testing-indonesia-juli-2021-sudah-4-kali-melampaui-standar-who (accessed on 4 September 2022).
  61. Sandi, F. Testing COVID-19 Turun & Tak Capai Target, Ini Kata Airlangga. Available online: https://www.cnbcindonesia.com/news/20210721203728-4-262616/testing-covid-19-turun-tak-capai-target-ini-kata-airlangga (accessed on 4 September 2022).
  62. Sehat Negeriku. Lonjakan Kasus COVID di Indonesia, Disebabkan Peningkatan Testing dan Tracing. 2022. Available online: https://sehatnegeriku.kemkes.go.id/baca/rilis-media/20220131/0639241/lonjakan-kasus-covid-di-indonesia-disebabkan-peningkatan-testing-dan-tracing/ (accessed on 4 September 2022).
  63. The Jakarta Post. Indonesia Ranks among World’s Worst in Coronavirus Testing Rate. Available online: https://www.thejakartapost.com/news/2020/04/07/indonesia-ranks-among-worlds-worst-in-coronavirus-testing-rate.html (accessed on 4 September 2022).
Figure 1. Cumulative number of confirmed cases of each province in Indonesia March 2020–March 2021 ([22]).
Sustainability 14 14478 g001
Figure 2. Location of study area showing the population distribution. The population number is in thousands of people (analyzed from gis.dukcapil.kemendagri.go.id, accessed on 23 January 2022).
Sustainability 14 14478 g002
Figure 3. Research Framework.
Sustainability 14 14478 g003
Figure 4. Cumulative figure of COVID-19 data in Jakarta ([40]).
Sustainability 14 14478 g004
Figure 5. Spatiotemporal dynamic of COVID-19 confirmed cases ((a) March 2020, (b) April 2020, (c) May 2020, (d) June 2020, (e) July 2020, (f) August 2020, (g) September 2020, (h) October 2020, (i) November 2020, (j) December 2020, (k) January 2021, (l) February 2021). (Source: analyzed from [40]).
Sustainability 14 14478 g005
Figure 6. The dynamics of COVID-19 hospital. (a) Six hospitals are assigned from March and April 2020, (b) 30 hospitals are assigned from May to August, (c) 45 hospitals are assigned from September to December, (d) 59 hospitals are assigned from January to March 2021. (Source: [41,48,49,50,51]).
Sustainability 14 14478 g006
Figure 7. Spatiotemporal accessibility of healthcare from the infected population ((a) March 2020, (b) April 2020, (c) May 2020, (d) June 2020, (e) July 2020, (f) August 2020, (g) September 2020, (h) October 2020, (i) November 2020, (j) December 2020, (k) January 2021, (l) February 2021).
Sustainability 14 14478 g007
Figure 8. Temporal dynamics of accessibility of healthcare services from the infected population.
Sustainability 14 14478 g008
Figure 9. Distance decay model of accessibility and the clusters of population density. (a) Clusters of accessibility. (b) Clusters of population distribution. Note: 3: high, 2: moderate, 1: low. (c) Distance decay model of spatiotemporal accessibility.
Sustainability 14 14478 g009
Publisher’s Note: MDPI stays neutral with regard to jurisdictional claims in published maps and institutional affiliations.

