

Assessment of Environmental Impact of Aquaculture Ponds in the Western Delta Region of Andhra Pradesh


1
Department of Civil Engineering, National Institute of Technology Karnataka, Surathkal, Mangaluru 575025, India
2
Department of Civil Engineering, SRKR Engineering College, Bhimavaram 534204, India
3
Department of Civil Engineering, SR University, Warangal 506371, India
*
Authors to whom correspondence should be addressed.
Sustainability 2022, 14(20), 13035; https://doi.org/10.3390/su142013035
Submission received: 16 September 2022
/
Revised: 8 October 2022
/
Accepted: 8 October 2022
/
Published: 12 October 2022
(This article belongs to the Special Issue Technology for Sustainable Development of Aquaculture)
Abstract
:Aquaculture is persistent and well-established in the delta region of Andhra Pradesh. In recent years, the expansion of aquaculture has conferred positive economic growth in the newly formed state. However, the enormous development of aqua ponds increases the effluents from aquaculture which contain various chemical compounds that can cause negative impacts when released into the environment. This paper presents the effect of unengineered aquaculture on the environment in the delta region of Andhra Pradesh. The expansion rate of aquaculture practice in the delta region has been carried out using remote sensing and a geospatial information system. An experimental investigation was carried out on soil and water samples collected from the aquaculture ponds to evaluate the water quality parameters and soil characterization. Analysis of the geotechnical properties and microstructure was carried out to determine the interaction between the soil and the aquaculture contaminants. Based on the geospatial data and field survey, the aquaculture practice in the delta region of Andhra Pradesh was intensive and extended towards the northeast from the southwest. Between 2016 and 2020, aquaculture practice significantly increased by 6.08%. Moreover, the water quality parameters and pond bottom soil showed a higher concentration of ammonia and nitrates. Further, aquaculture leachate may interact with the subsoil and have a negative impact on soil mineralogy and hydraulic conductivity. The extensive experimental data and field surveys reveal that adequate guidelines are needed to control the pollution load on the ecosystem.
1. Introduction
Since the 1990s, there has been significant concern about environmental aspects, particularly in the landfills of both municipal solid waste and hazardous waste, mine tailings, slurry ponds, ash ponds, oil spills, radioactive wastes, chlorinated pesticide waste dumps, agriculture, and aquaculture contaminants [1,2,3]. The revolution of engineered landfills took place in the 2000s in every city with improved designs. However, there are no regulations or environmental strategies with regards to the chemical wastes or residues generated from aquaculture and agriculture practices in the delta region of Andhra Pradesh [4,5].
There has been a significant increase in the demand for food products with the rise in population in many countries, especially in India. Further, to meet these requirements, agriculture and aquaculture practices dramatically increase production and culture expansion [6]. However, the rapid growth of aquaculture in developing countries impacts the environment due to poor quality control during and after the construction of aquaculture ponds [7]. The subject of aquaculture is an interdisciplinary platform to deal with; it involves biology, chemistry, environmental engineering, and soil mechanics [8,9]. The main problems associated with the intensive aquaculture ponds in the Godavari Delta were the seepage of contaminated water from the pond embankment to adjacent agricultural fields, the leaching of polluted water from the subsoil to groundwater bodies, and improper or untreated aquaculture effluents in nearby irrigation and drinking canals due to the lack of drains [10,11].
Geotechnical engineers have a lot of aspects to deal with when developing a sustainable aquaculture pond. Geoenvironmental aspects of aquaculture to be taken care of, such as its revolutionary development, have recently been taking place in engineered landfills. In aquaculture practice, the regular feed of shrimp includes zinc, phosphorous, calcium, sodium, potassium, and magnesium, as well as probiotics [12,13]. The encroachment of contaminated aquaculture ponds at the end of a crop releases both organic matter and diluted minerals and chemicals [14]. The primary water contamination takes place due to the excess feed and effluents generated by the aquatic shrimp [15].
Further, it increases the nitrate and ammonia concentration in the pond. The intensity of aquaculture practice discharges large quantities of untreated wastewater containing organic matter, a high concentration of chemicals, planktons, antimicrobial agents, minerals, and antibiotics [16]. These aquaculture effluents which are discharged to the irrigation canals and freshwater bodies affect the yield and quality of the adjacent agriculture fields. In addition, freshwater bodies such as irrigation canals and drinking water ponds are polluted. Unmanaged or unengineered culture practices have ecological impacts such as:
- (i)
- Oxygen deficiency due to dissolved organic matters.
- (ii)
- The formation of algae blooms is due to the accumulation of organic nutrients, such as nitrogen and phosphorus, creating high biomass in the surface water.
- (iii)
- The unmanaged handling of residues from aquaculture causes severe problems for human health, flora and fauna, ecosystems, and economic development.
In this regard, some research has been undertaken based on the effect of intensive aquaculture on the environment, and a brief account of the results is presented below.
Jayanthi et al. [4] reported that the intensive aquaculture practices in India cause a reduction in the mangroves, a threat to the environment, and a change in land use patterns. The report results conclude that aquaculture practices should be monitored, and strict environmental regulations must be implemented for a better sustainable environment. Jayanthi et al. [17] undertook a case study on the effect of aquaculture practices on the Kolleru Lake, which is one of the major freshwater lakes in India. From 1967 to 2004, before the state bifurcation of Andhra Pradesh, aquaculture practices (the increased aquaculture area was 99.74 square kilometers) in that region caused a severe environmental impact on the lake ecosystem. Moreover, there were no regulations on farming, and as a result of the invasion of the watershed region by thousands of unlicensed aquaculture farms, open water regions are now difficult to recognize in satellite pictures. The following sections detail the conditions before and after the commencement of the development of sustainable systems, which is known domestically as “Operation Kolleru”. In order to conserve the ecosystem capabilities and services provided by the Kolleru, “Operation Kolleru” was launched in 2006 to demolish the fishponds located throughout this area as part of the “repair of the lake” [18]. In recent years, many parts of the lake ecosystem were still under the burden of illegal intensive aquaculture farms. The data analysis suggests that in the present scenario globally, protecting freshwater bodies is much needed for future generations.
Jana and Jana Santana [19] reported that intensive aquaculture practices reduce the yield of the crops adjacent to the aquaculture bodies due to the effluents and the salinity of the water. The wastewater should not be directly allowed into irrigation canals because there is a need for a recirculating aquaculture system (RAS) to treat aquaculture effluents. In addition, using antibiotics in aquaculture is hazardous to humans because their presence in the water will last for up to six months. Aquaculture practice can generate varieties of chemicals and minerals, which negatively impact the environment. Therefore, proper guidelines are needed before assessing the impact of aquaculture practices on the environment [20]. This rapid phase expansion of aquaculture and its environmental implications has grabbed attention worldwide in recent years [21,22,23]. Globally, many countries such as Bangladesh, Thailand, China, Mexico, Vietnam, and India face environmental issues with unengineered aquaculture [24,25]. Moreover, in Thailand, the Thai government banned inland shrimp culture due to concerns about the environment [21,26]. Aquaculture practices significantly influence the environment; many present aquatic species are migrating and disappearing. In addition, freshwater bodies are being polluted with the contaminants from the aquaculture [15]. In some cases, a high concentration of chemicals causes severe deterioration in irrigation or drinking water quality, further affecting human health. However, to date, only a few research works have been published in India regarding the environmental aspects of aquaculture ponds.
This study presents the questionnaire and topographic survey undertaken in the western delta region of Andhra Pradesh to understand the rate of expansion of aquaculture ponds and the intensity of farming. This paper also explores the water quality, soil characteristics in aquaculture ponds, and soil–aquaculture effluent interaction to understand the severity and influence of aquaculture effluents on water and soil.
2. Site Description and Data Collection
2.1. Study Area
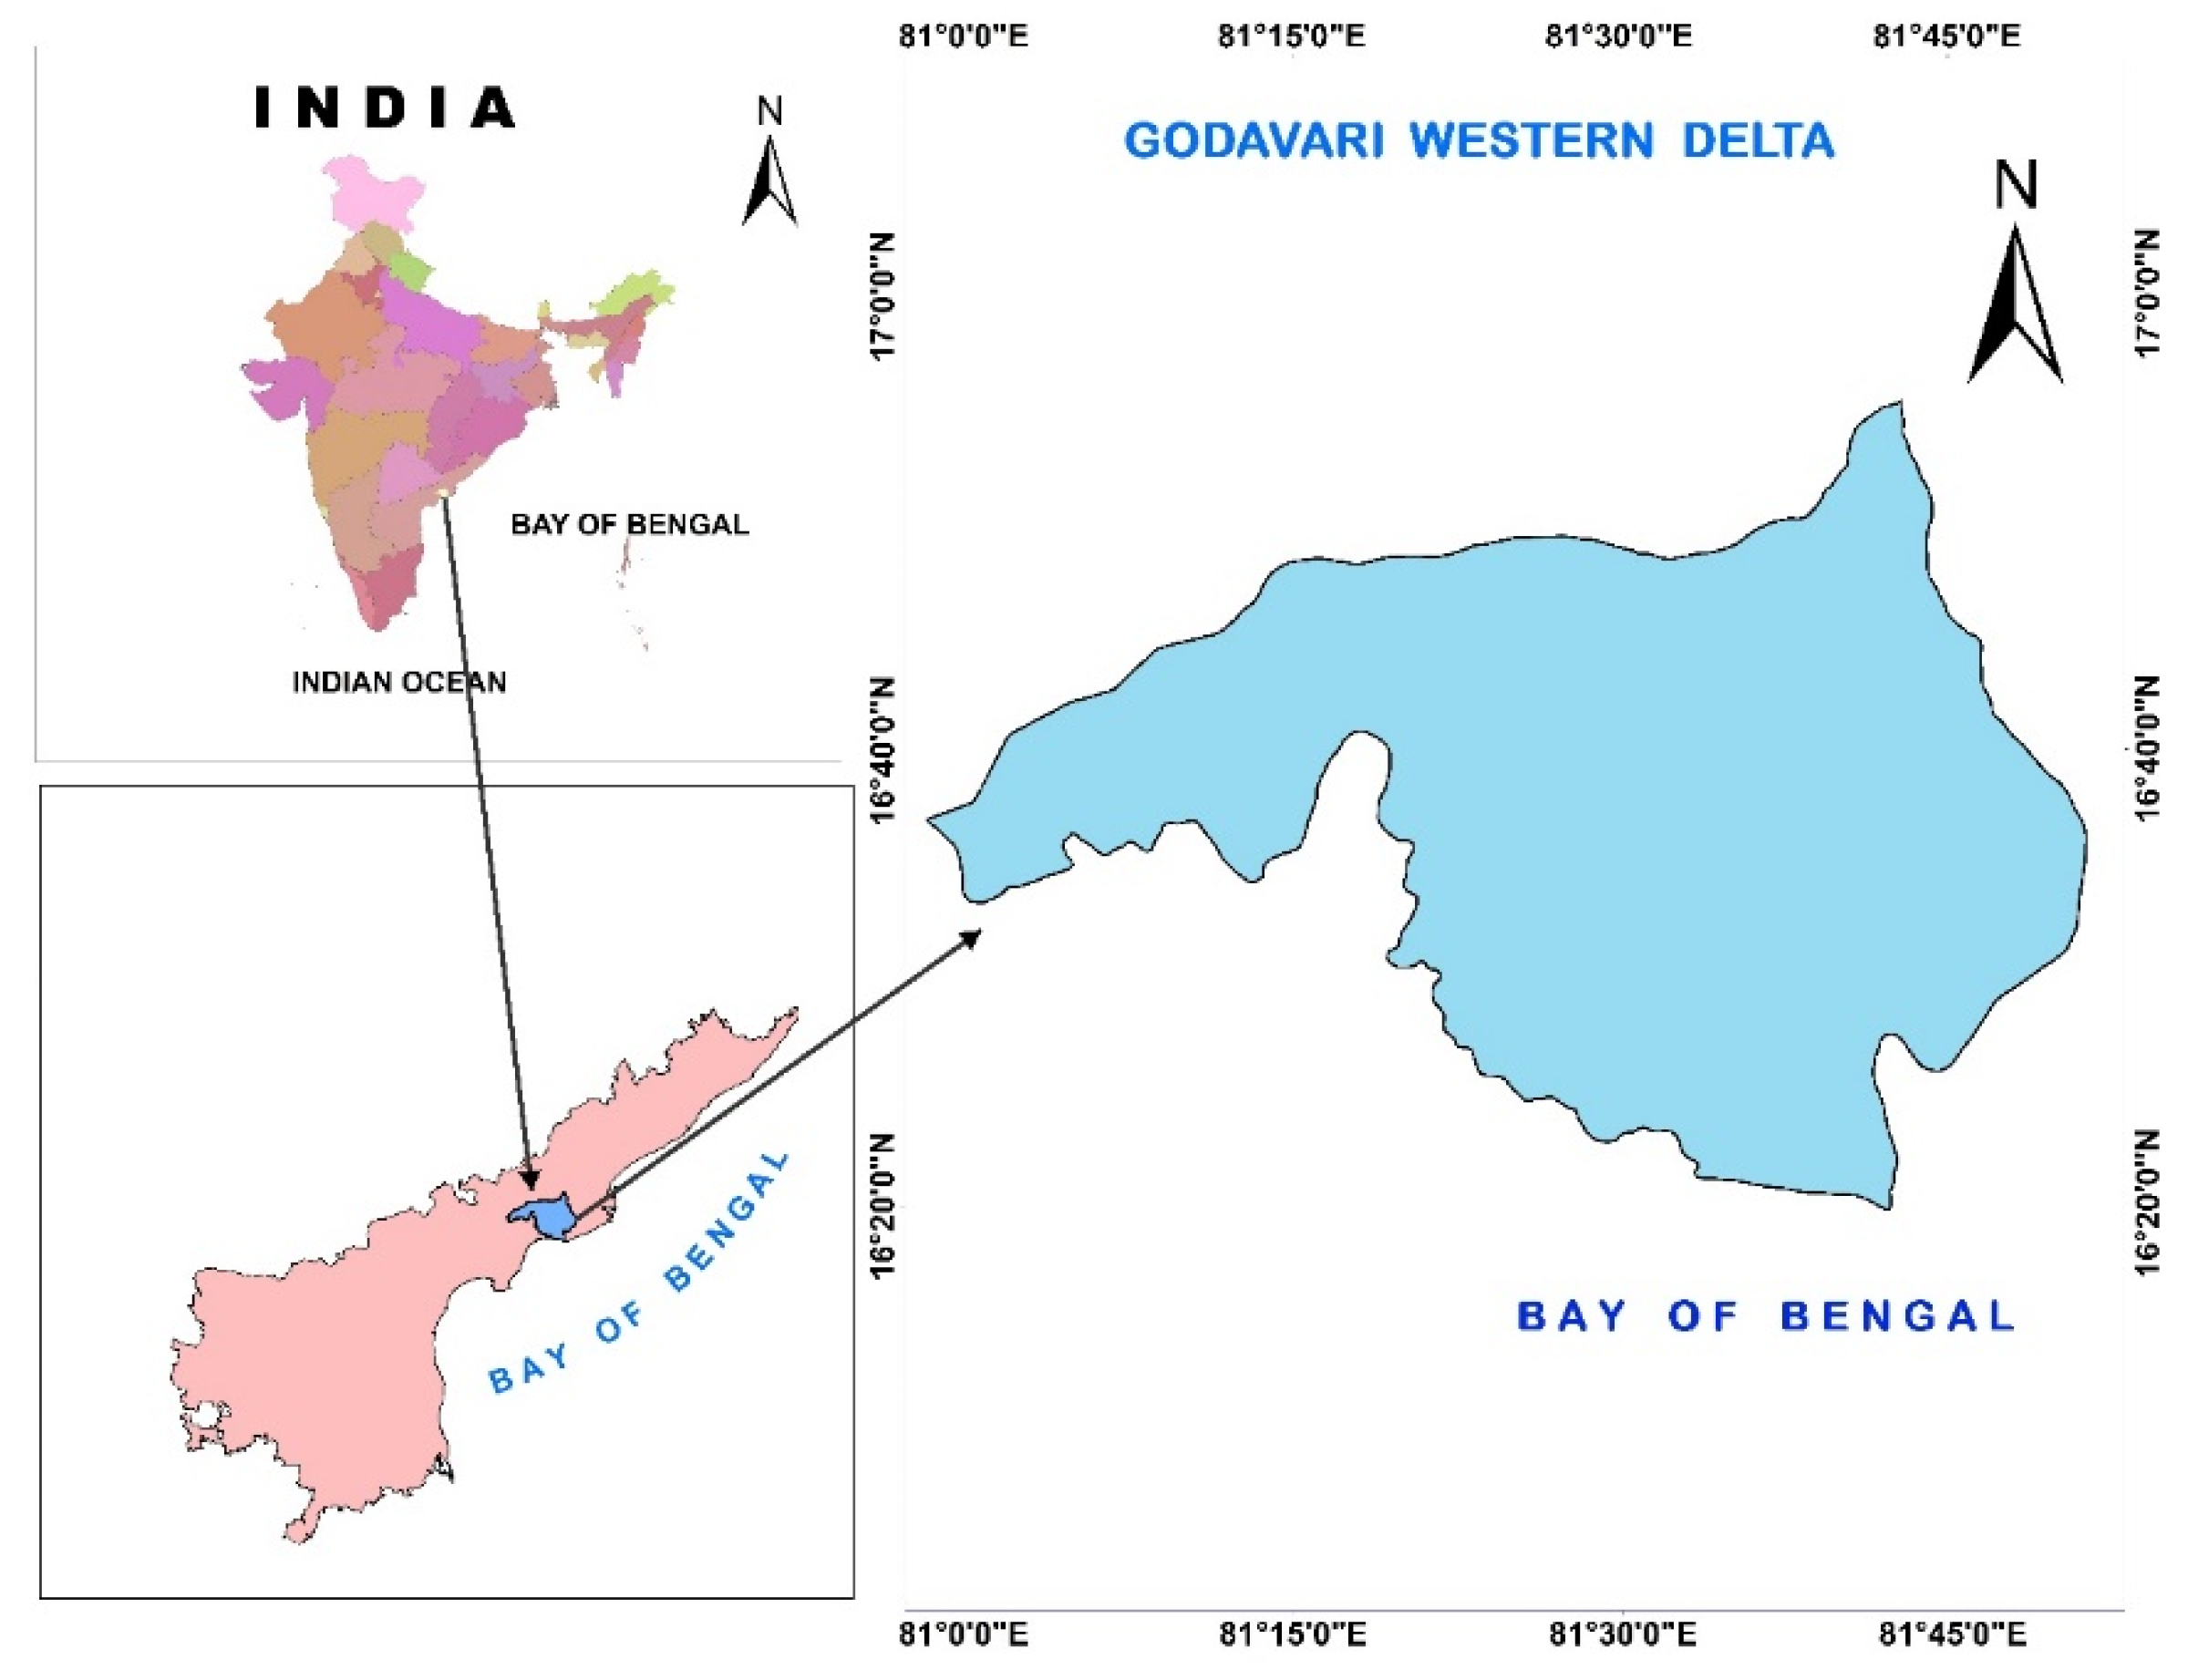
The west and east Godavari districts (delta region) of Andhra Pradesh are located along the seacoast bound by longitudes of 81°38′32′′ to 82°24′75′′ and latitudes of 16°71′07′′ to 16°98′91′′ (geographic lat/lon WGS 84 projection). They cover an area of about 20,547 square kilometers, and a vital river, the Godavari, passes from these districts and merges into the Bay of Bengal. The formation of the delta region is based on the erosion and transportation of sediments from the Godavari River over thousands of years. The west Godavari district has large water bodies and drains connected to Kolleru Lake, Yerracalva, Thammileru, and Ramileru. The Bondada-Rudrayyakodu Drain and Gonteru Drain are significant drains adequate for aquaculture catchment, with an area of 262 and 157 square kilometers, respectively. The soil profile of the delta region mainly covers layers of black cotton soil and sands; the sand aquifer in this region varies from 10 to 15 m below the ground level. The groundwater levels range from 0 to 3 m, 3 to 8 m, and more than 8 m, which are 15%, 27%, and 58% of the district area, respectively. In the early 2000s, agriculture, especially paddy fields, was the major crop in Andhra Pradesh which was ranked first in the country for the highest production of rice [27]. After the state bifurcation of the state of Andhra Pradesh in 2014, the replacement of agriculture by aquaculture was pervasive and entrenched in most of the delta region. These new ponds had a good network of canals and lakes, facilitating the water source and diverting crop-end contaminated water into the adjacent irrigation canals due to lack of drain networks; however, the extent of the environmental impact was unknown [4]. The western delta region is bound by the Godavari and Upputeru Rivers and the Bay of Bengal (Figure 1). It covers an area of 3042 square kilometers and has a potential canal and drain network of 16.82 square kilometers.
2.2. Aquaculture Scenario in Western Delta Region
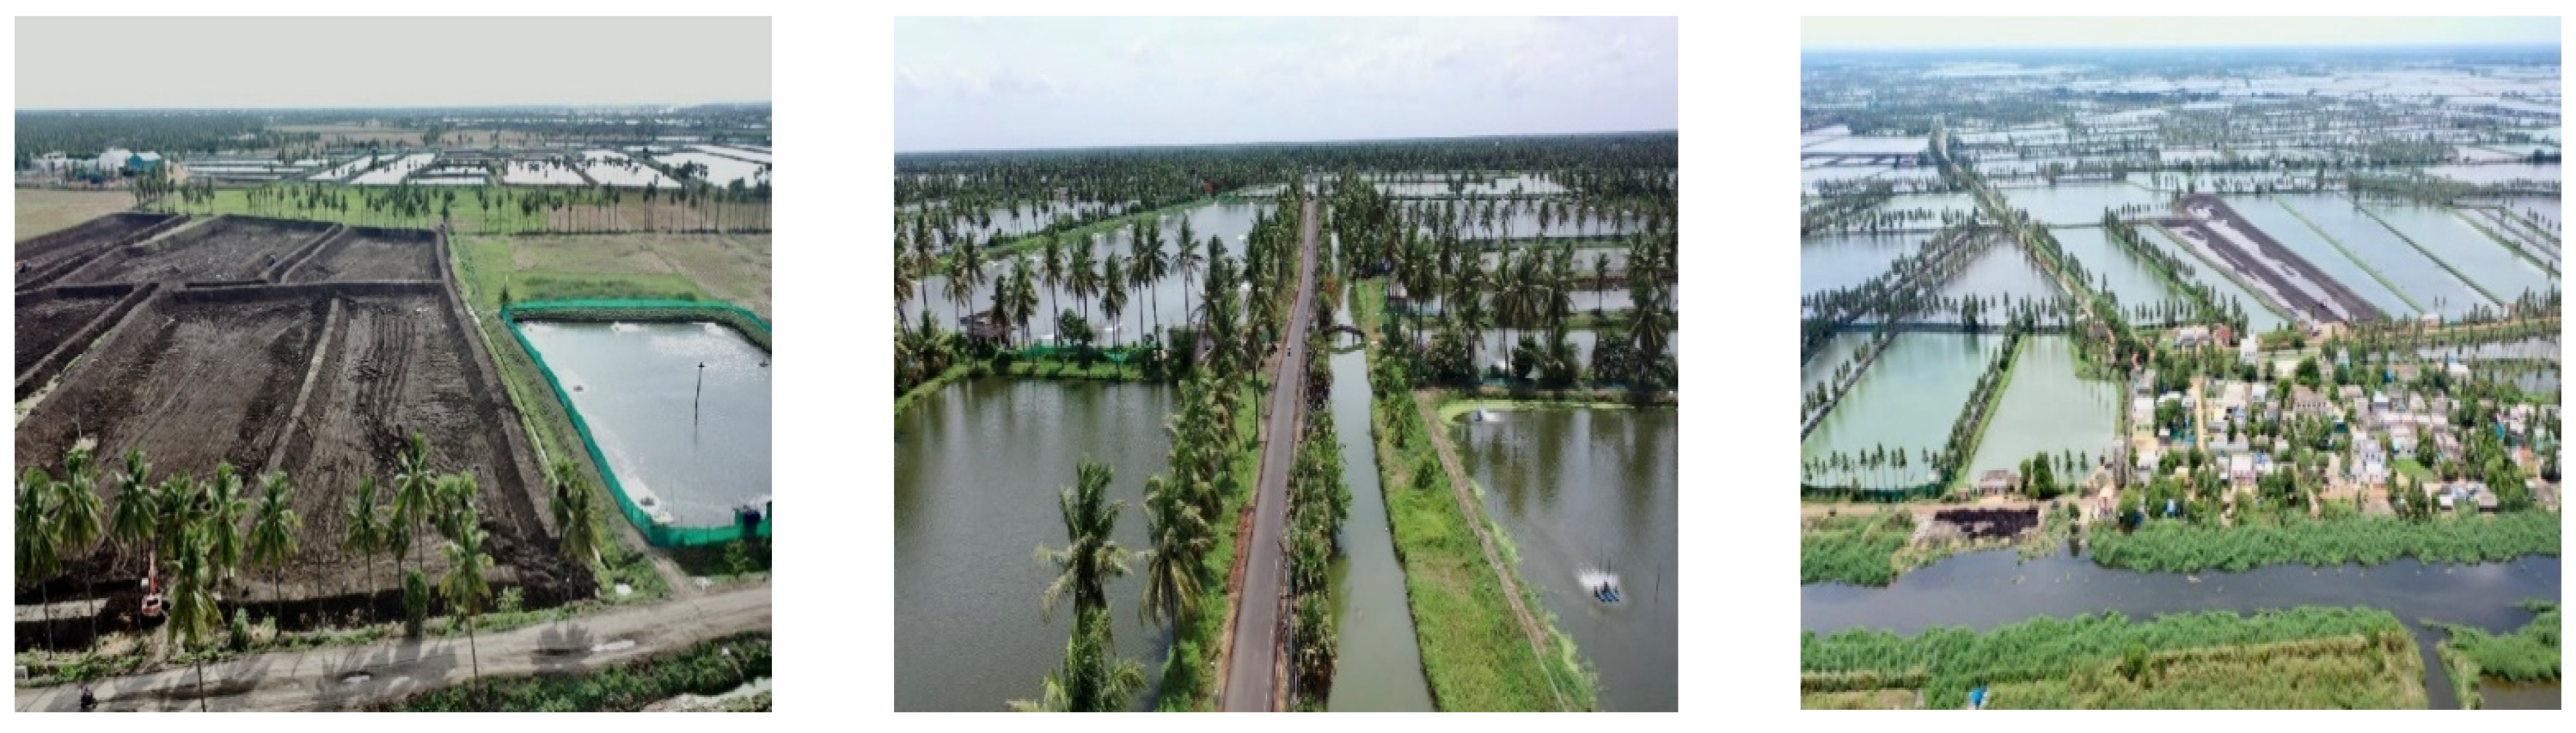
The development of the newly formed state Andhra Pradesh after state bifurcation had many urgent needs, such as the use of natural resources, earnings from exports, more employment, and a better living environment. In the 1990s, in Andhra Pradesh, aquaculture was one of the sources of livelihoods along with many other cultures. Mainly fishponds were common, and only a few shrimp ponds (tiger shrimp) were in practice during the 1990s and early 2000s. Recently, the Penaeus vannamei shrimp culture has emerged with a low disease rate and high production. After state bifurcation in the 2014, the Andhra Pradesh Government relaxed the laws to construct new aquaculture ponds for state economic growth, which led to the large expansion of aquaculture ponds in the western delta region. Both fish and shrimp species production increased, and inland aquaculture was targeted as a major source for state development. Many lake-based sediments and agricultural fields were converted into aquaculture ponds through the construction of embankments [18]. In recent years, the western delta region of Andhra Pradesh has emerged as a heartland of shrimp and fish production with 1.15 million metric tons in 2019 [28]. Aerial views of aquaculture ponds are shown in Figure 2 to better understand the field scenario of aquaculture ponds in the study area.
2.3. Questionnaire and Quantitative Survey
A structured and field survey was conducted in 40 villages (see Table A1 in Appendix A) among the aquaculture farmers, feed distributors, laboratory technicians, and aquaculture processing industrialists to understand and assess the intensity of farming and its consequences. The questionnaires included the area or size of the pond, depth of the pond, the density of seed per acre, feed usage per acre, chemicals usage per acre, number of aerations per acre, lime usage, probiotics usage, disinfectants usage, number of times of water change per acre, environmental impact, and sustainability concern. Based on the questionnaire survey, the intensity of the aquaculture practice was categorized into three zones: traditional farming (zone-I), semi-intensive farming (zone-II), and intensive farming (zone-III), as shown in Table 1. In the delta region of Andhra Pradesh, aquaculture mainly involves shrimp and fishponds. The individual fish tanks in the study ranged from 10 acres to 150 acres. Although the ponds were huge, the effluents were low because of the lower usage of chemicals, probiotics, chemicals, and disinfectants. The shrimp ponds were the major contributors of effluents because of the severe or intensive cultural practices. The shrimp ponds were continuously operated without the exchange of water for a minimum of two crops (six months). Every year, the sedimented water was discharged before winter and summer. According to the quantitative analysis, it can be stated that intensive aquaculture practices can confer a negative impact on the ecosystem. Most of the locations were situated in the severe or intensive zone. Agriculture or paddy fields were converted into shrimp ponds due to higher income generation through aquaculture and low paddy yield due to the salinity of the adjacent aquaculture ponds. It was anticipated that collecting questionnaires from the authorities would not be easy without the support of farmers.
The questionnaire results reveal that no guidelines or measures were considered to make a new aquaculture pond. The survey results also reflect the lack of proper communication between the aquaculture farmers and environmental engineers to implement sustainable ecological advancements in the aquaculture ponds. Similar trends were witnessed in other regions in India [4]. Moreover, nowadays, the intensive usage of chemicals, minerals, antibiotics, and probiotics with no mentioned ingredients on the bags gives alarming negative signs to the environment. Based on the visual examination of the bottom surface soil of the pond, one witnesses grey and orange color due to the anaerobic sediment (ferrous iron). In most of the ponds in the delta region of Andhra Pradesh, before starting a new crop, large amounts of urea and lime are widely used. Lime reduces the ammonia concentration and decomposes organic matter in the pond bottom soil. Lime increases the alkalinity and hardness and neutralizes the acidity of the bottom soil. Moreover, aquaculture ponds are often classified based on the intensity of farming. The reported literature mentioned that pond bottoms with less load of ammonia and chemicals in the bottom are being classified as younger ponds [29]. To better understand the soil profile, the physical, chemical, and biological parameters of soils should be tested. In general, shrimp (P. vannamei) culture needs a brackish water environment for better yield [30]. However, higher salinity levels in the aquaculture ponds significantly affect the production of the adjacent agriculture fields.
2.4. Land Use and Land Cover
The topography survey was carried out in the western delta region of Andhra Pradesh using the cloud-free data collected from the freely available USGS Earth Explorer (sentinel 2). The data were considered for July 2016, July 2017, Jan 2019, and July 2020. The classification was performed based on ArcGIS 10.6 with the help of satellite data collected from the source.
The area of each pixel was computed using the unique data values of the raster. In classification, changes in the pixels were evaluated using the change detection matrix. To ensure better accuracy of the classification, field examination was performed in 64 sites to understand the field scenario. The overall classification accuracy was more than 94.5%. The maps of 2016, 2017, 2019, and 2020 were used to quantify the changing land use patterns. Few studies have been undertaken to know the landscape transformation in Andhra Pradesh, especially in the Kolleru basin and Nellore region [17,29].
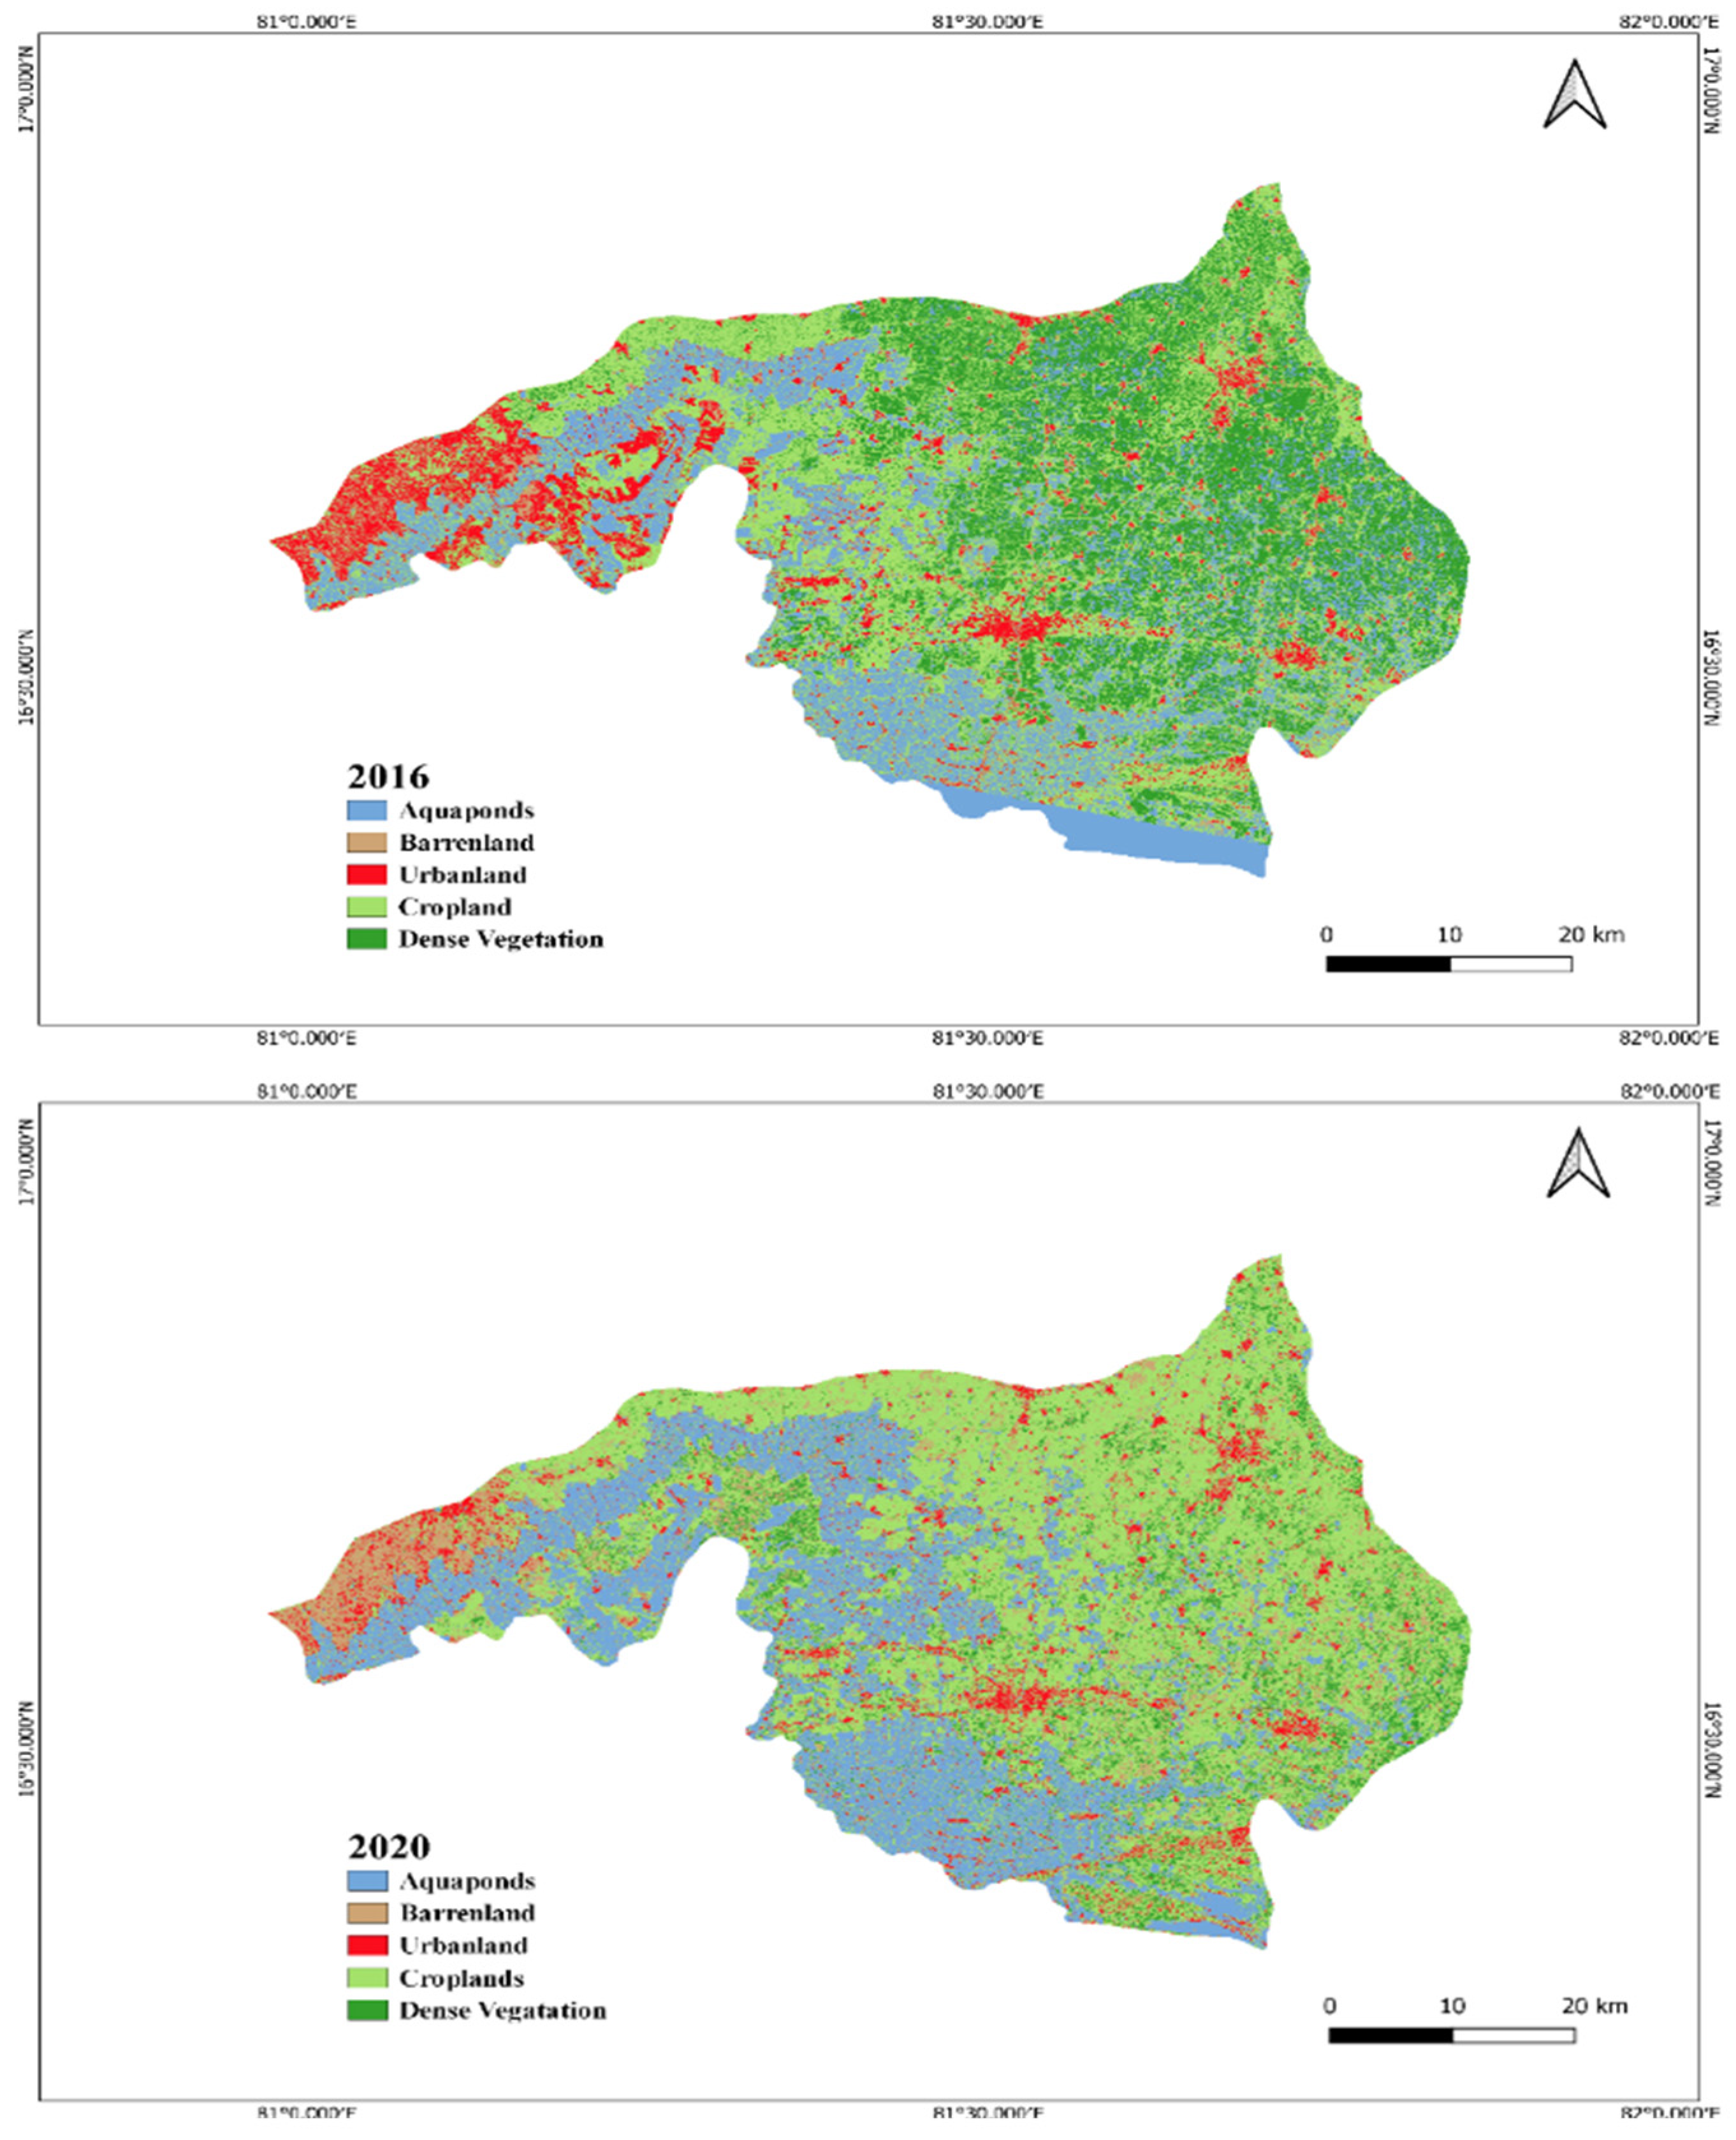
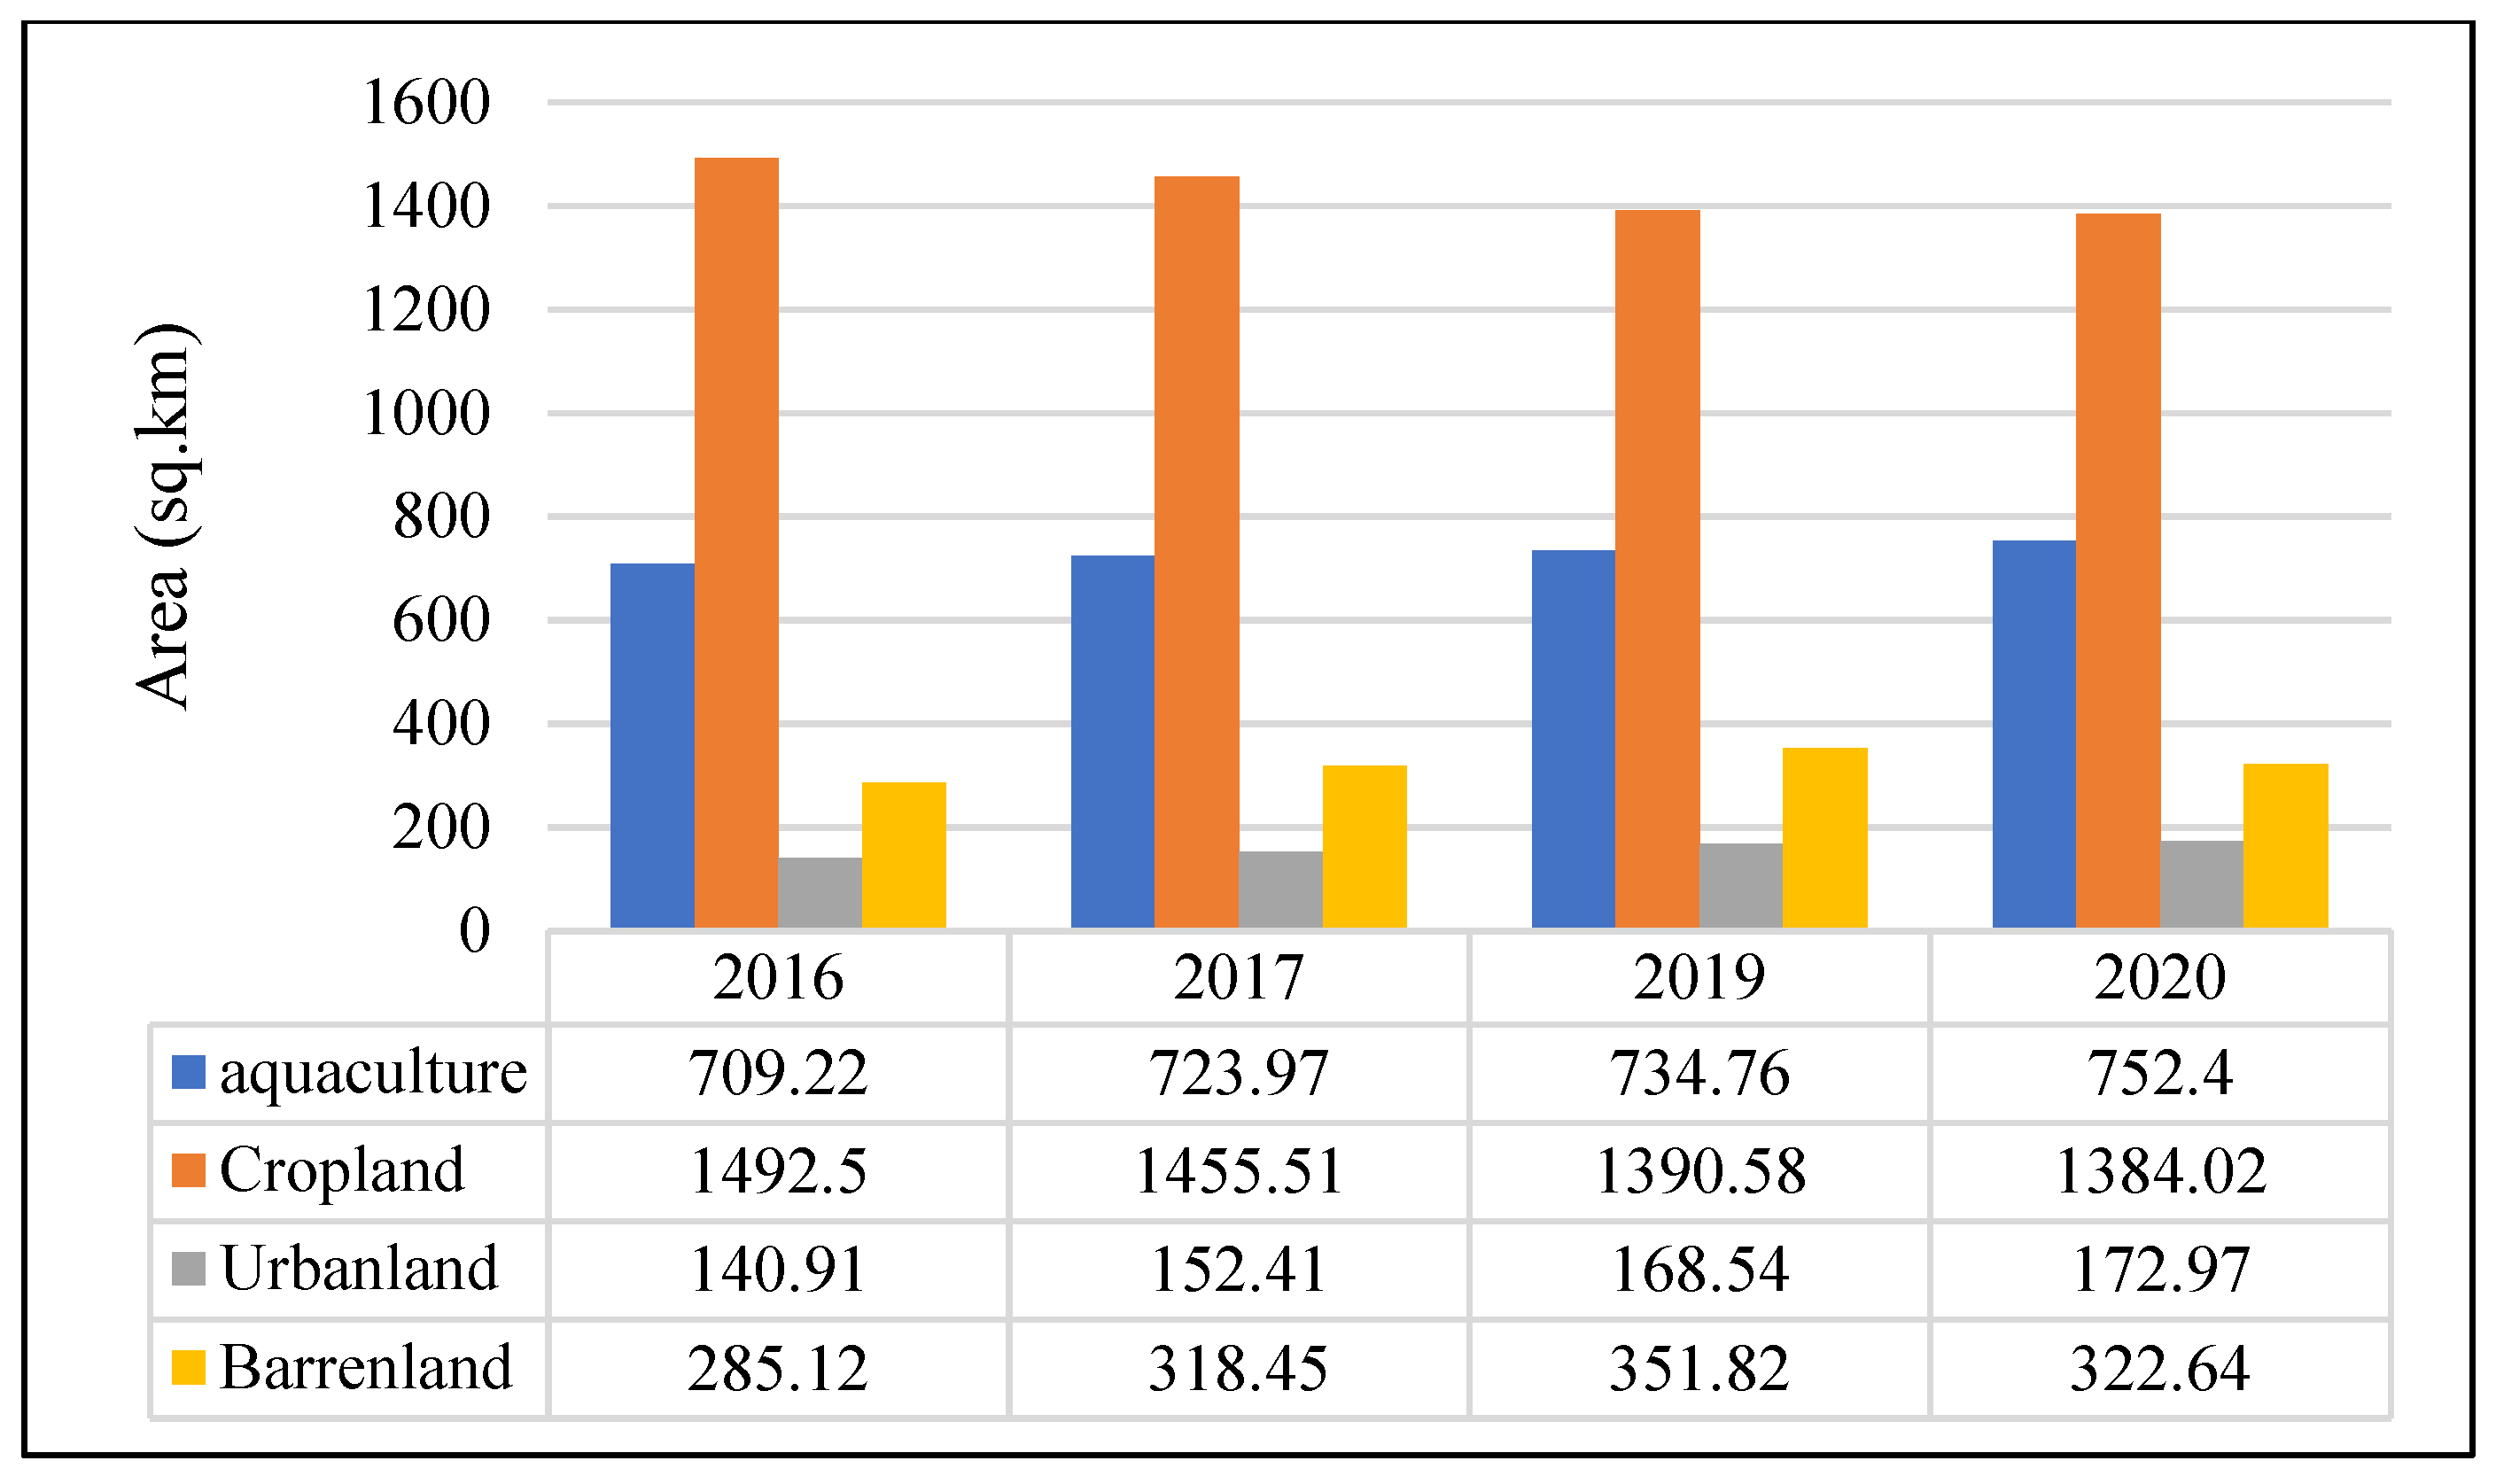
In this study, the land use and land cover classification consisted of aquaculture ponds, croplands, barren lands, and urban lands with a total western delta area of 3012.45 sq. km. The land use and land cover classification maps are shown in Figure 3. The land use patterns were dominated by aquaculture throughout this study. Aquaculture ponds (including shrimp and fishponds) were practiced in this region. They occupied an area of 702.22 sq. km in 2016 and increased by 6.08% from 2016 to 2020 (see Figure 4). Moreover, most of the aquaculture area was under the catchments of the Undi Canal, Venkayya Canal, Narsapur Canal, and Gostani Canal, with 32.4%, 26.6%, 18.3%, and 13.6%, respectively, in 2020. A peer glance at the past study reveals that, before the state bifurcation of Andhra Pradesh, from 1988 to 2013, the land converted to aquaculture ponds was 13,524 hectares [4]. In the current study, after state bifurcation, from 2016 to 2020, the land converted to aquaculture ponds was 3988 hectares (nearly one third of the aquaculture pond conversion from 1988 to 2013). The aquaculture intensity was expanding towards the northeast from the southwest. Clear rapid urbanization was also apparent in the delta region due to the increase in the aquaculture processing industries, feed stores, and laboratories. The covered area of drains and their sediments did not show any considerable area changes with a loss rate of 0.2% to 0.3% each year because of the erosion of canals or ponds embankments. This is due to the absence of stringent regulations for converting agricultural lands into aquaculture ponds. So, an increase in the aquaculture practices in the delta region led to a negative impact on the vegetation and croplands. This comparative analysis shows that future aquaculture practices face severe conflict with irrigation waterbodies and habitations. Therefore, adherence to sustainable regulations is much needed for a sustainable environment and to avoid water conflicts.
2.5. Climate Change
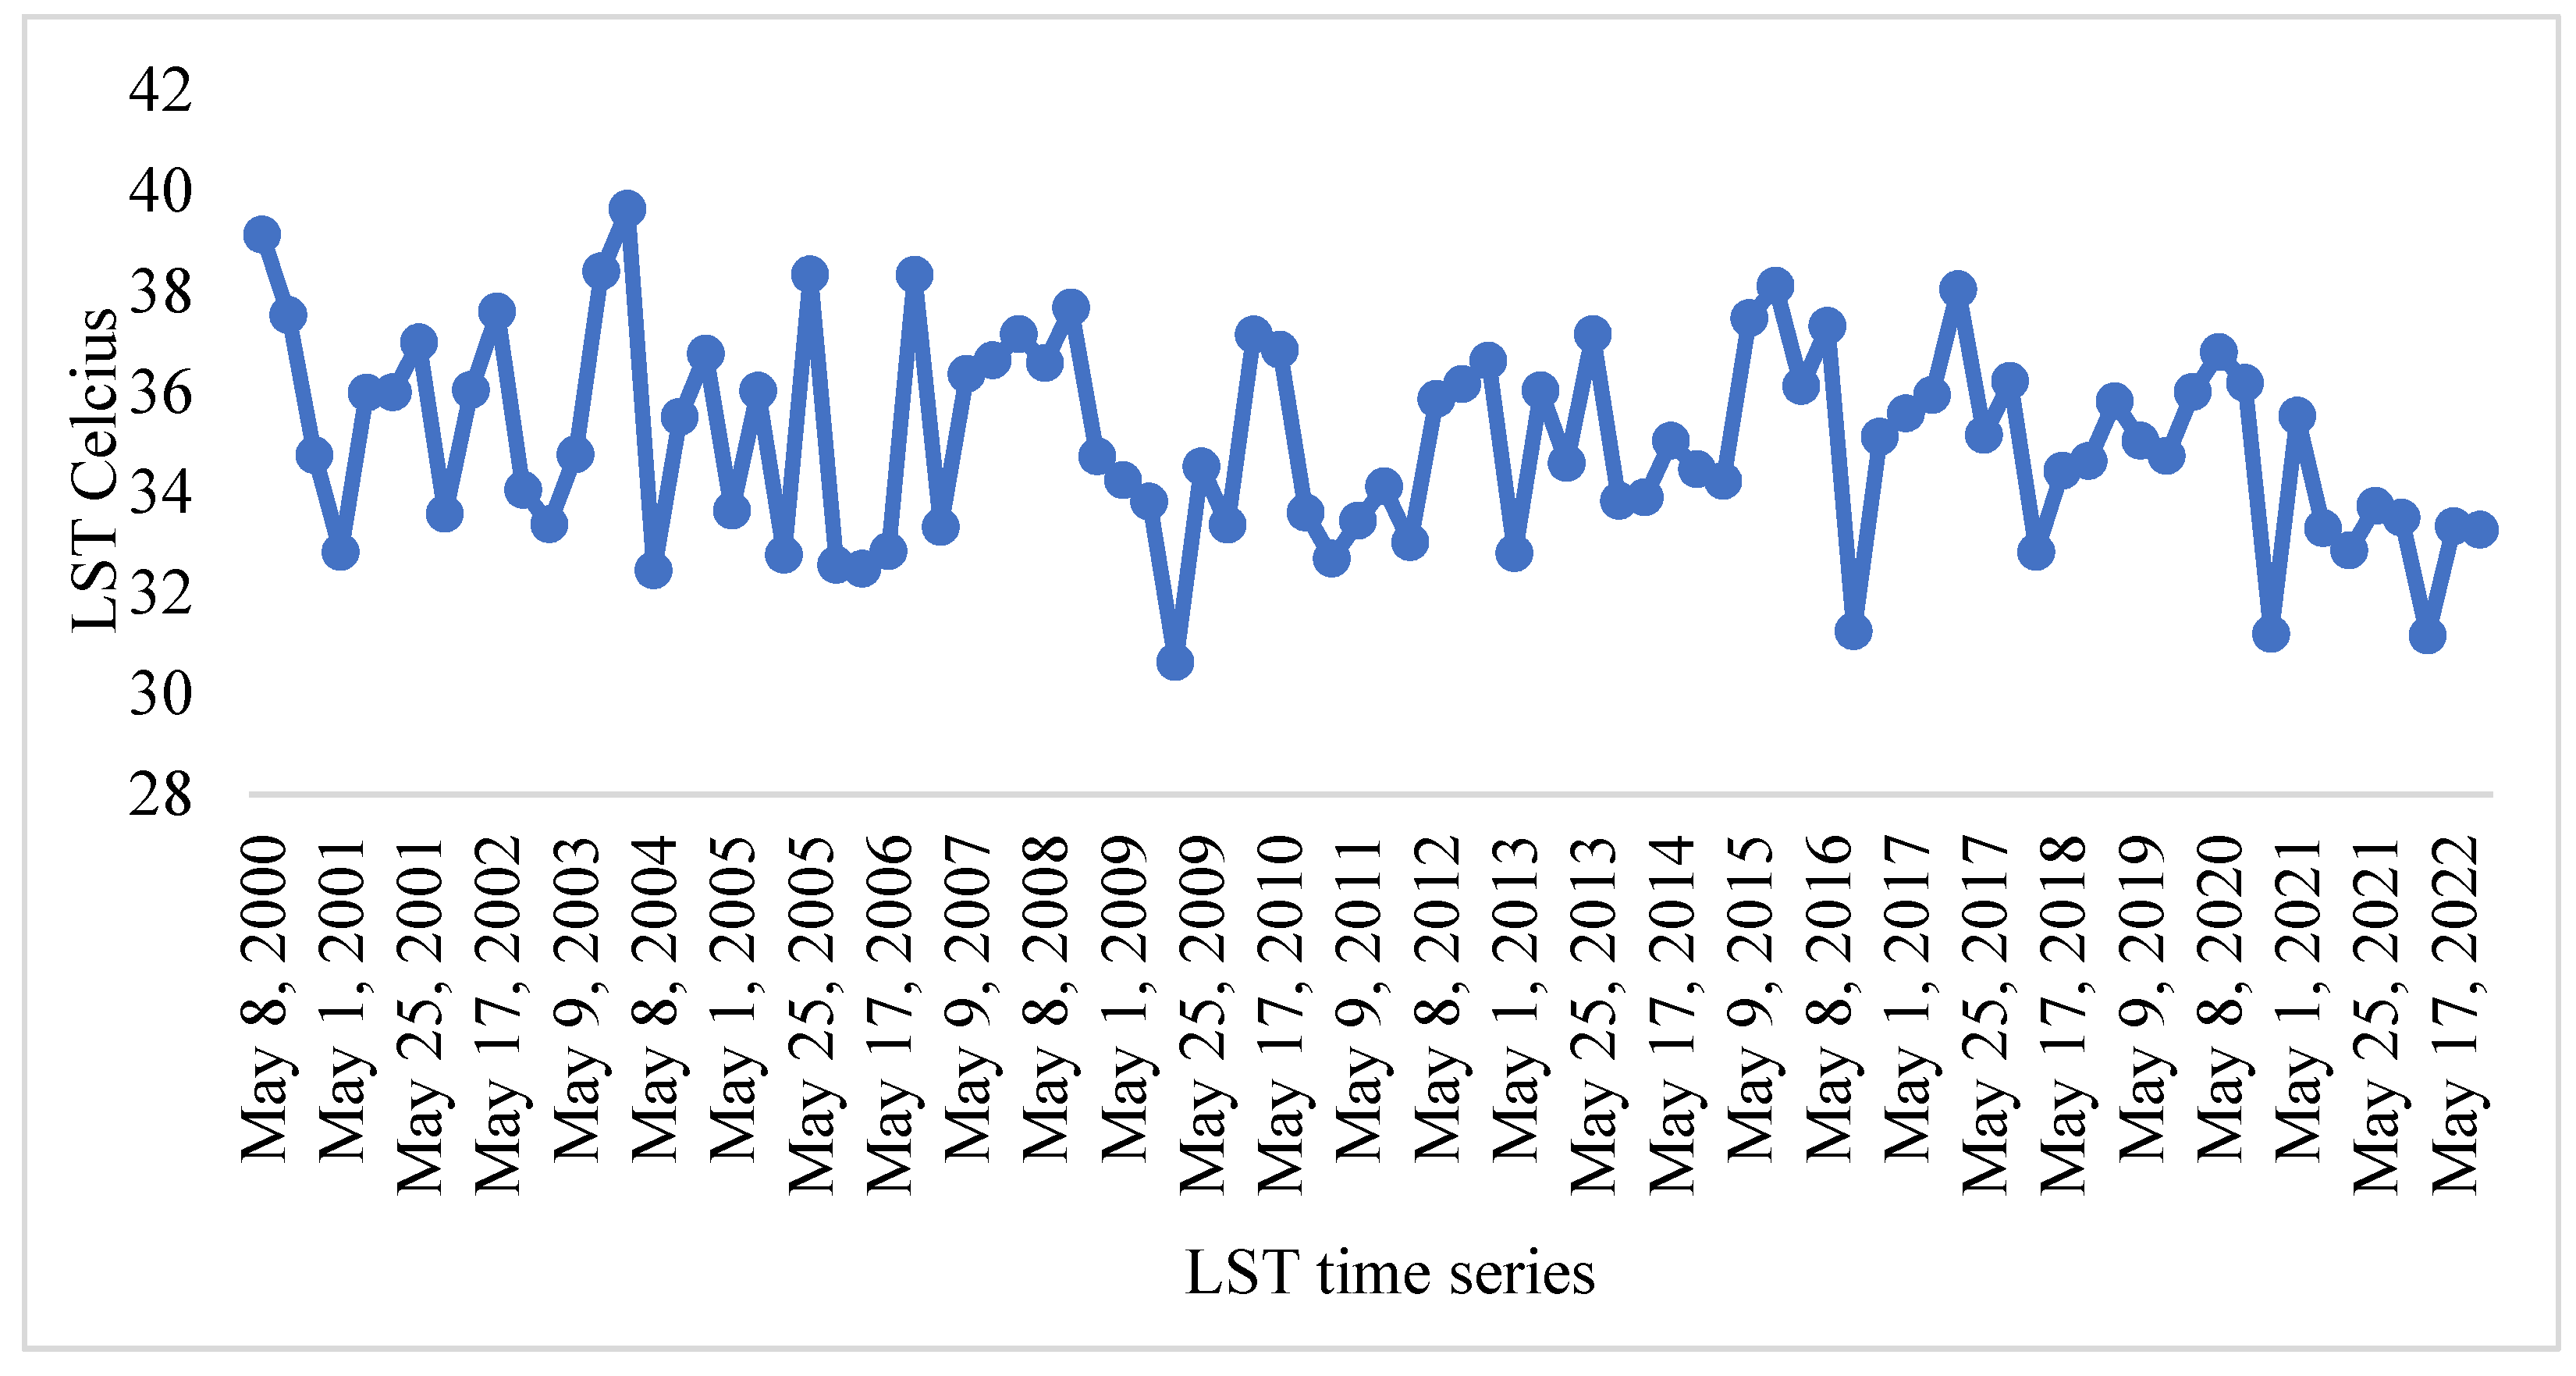
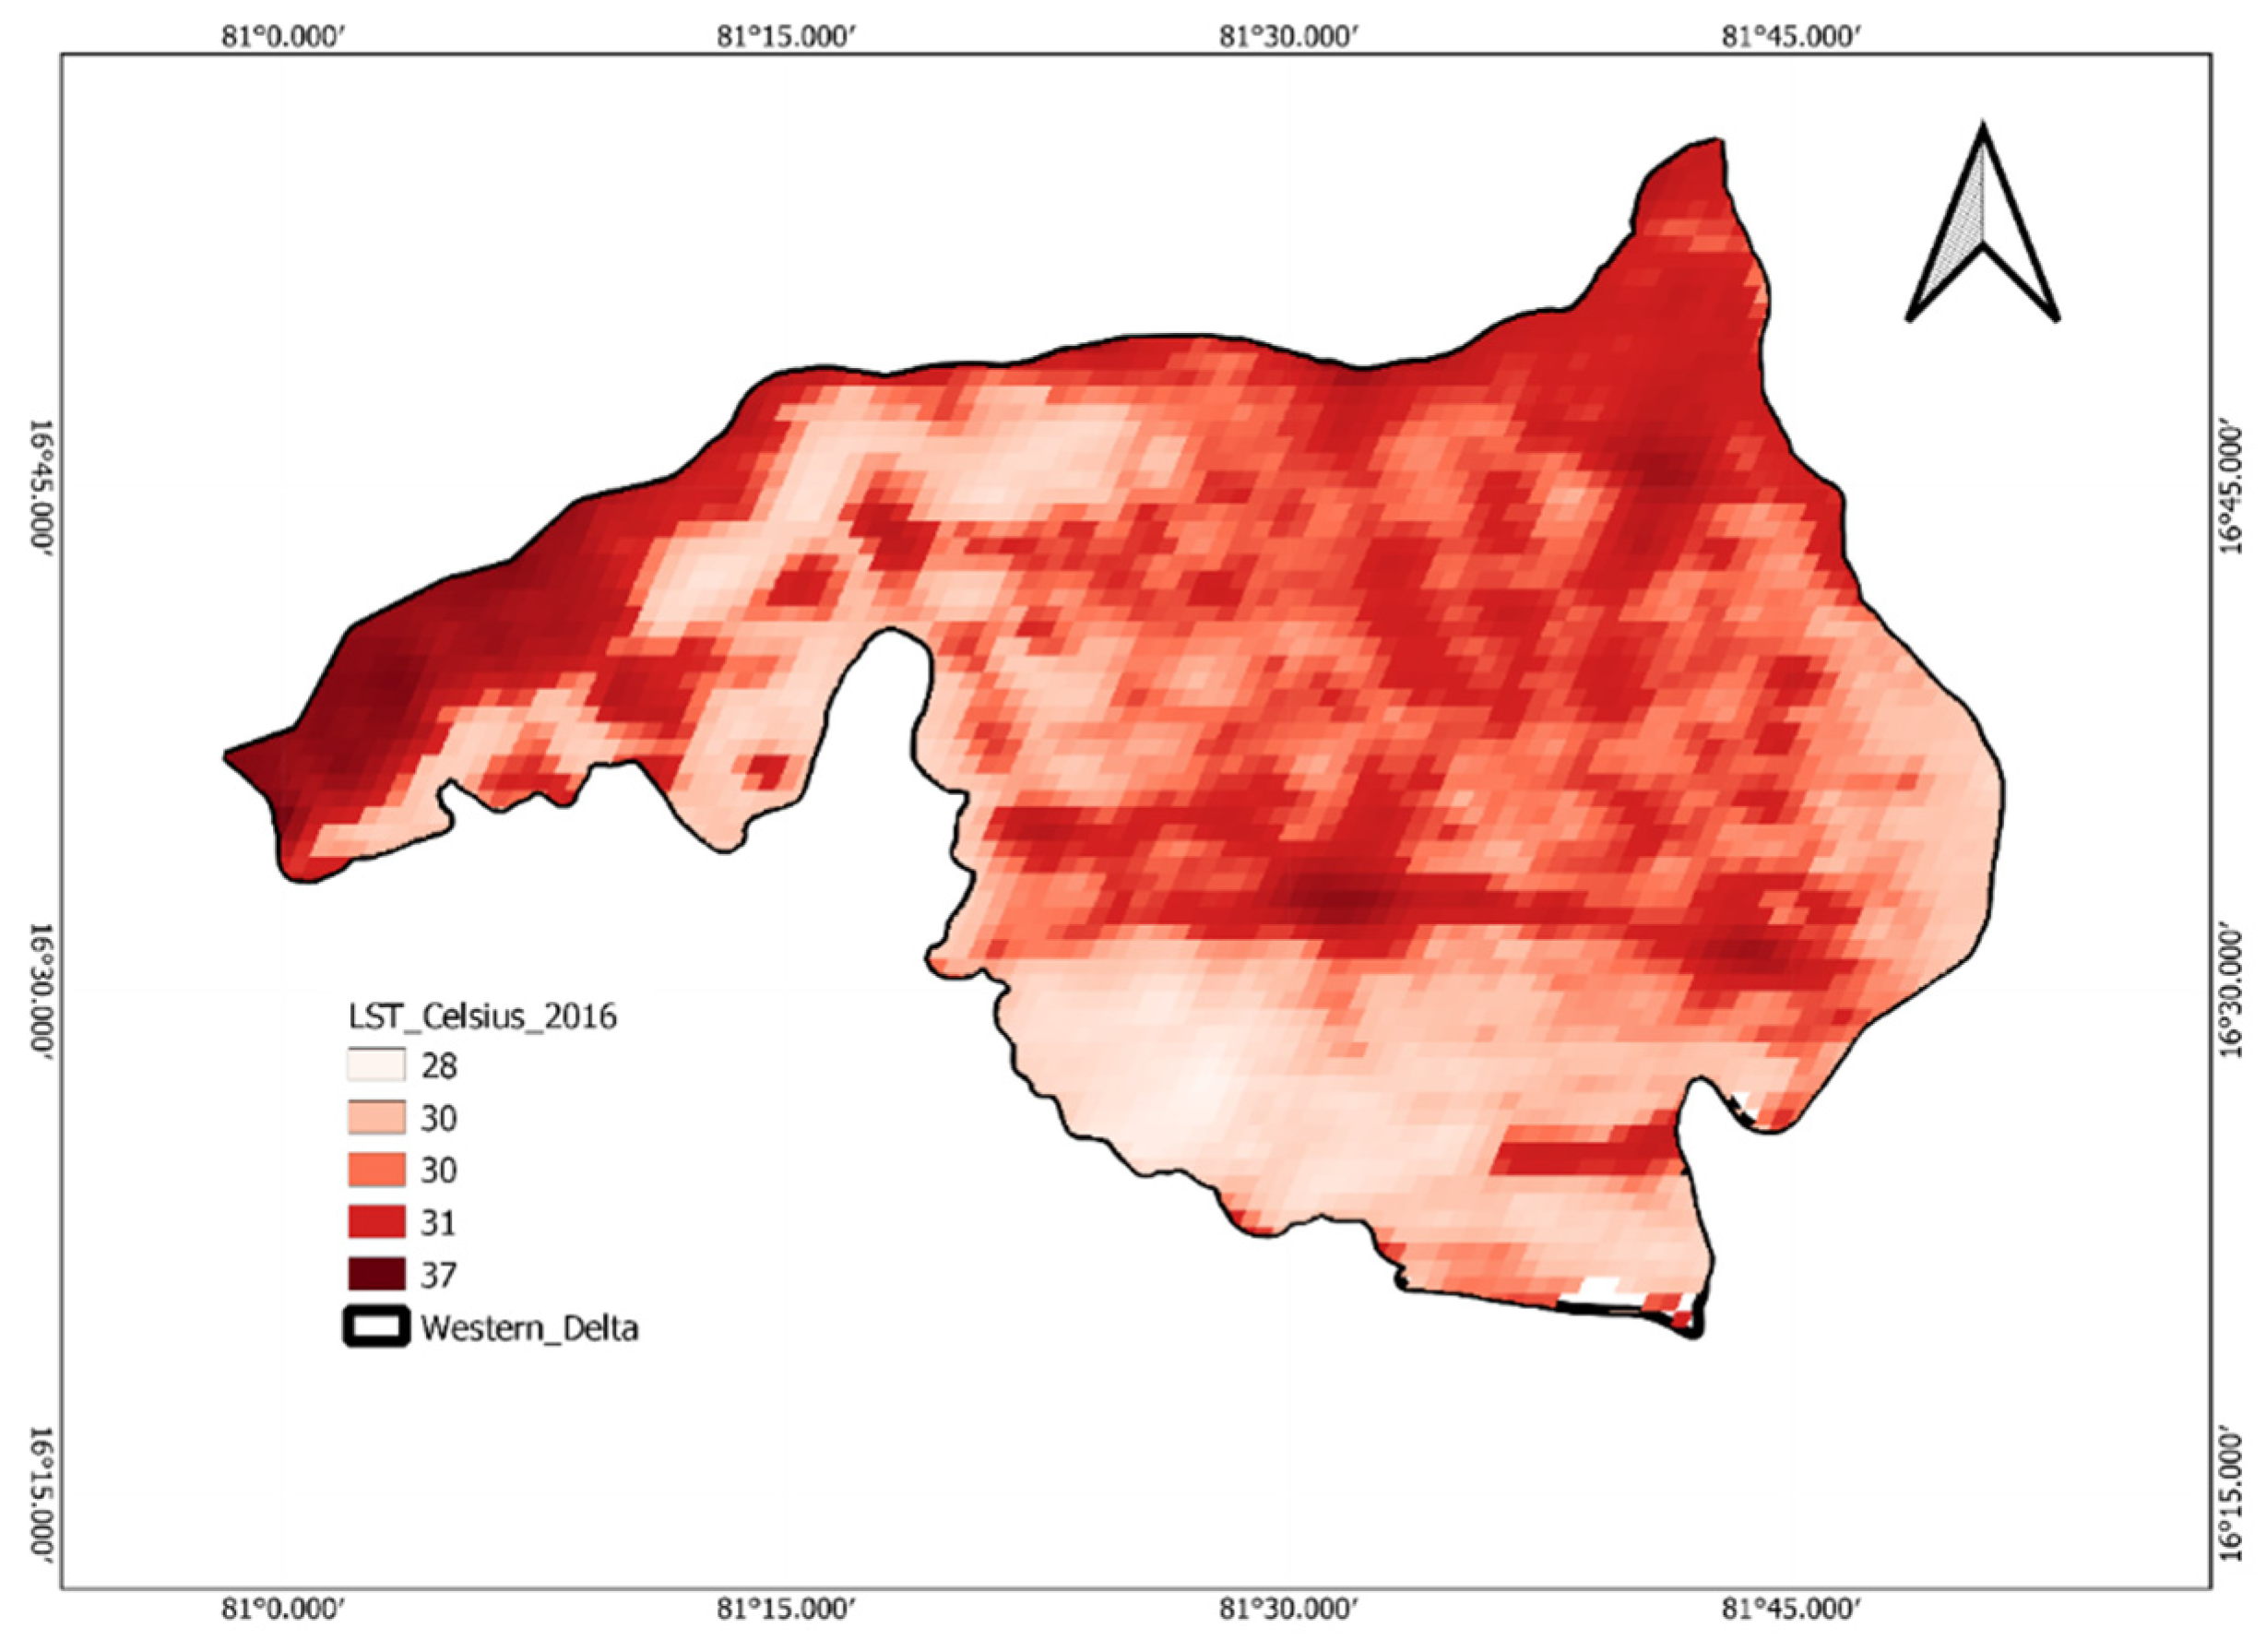
Climate change is a significant concern globally, particularly in India; the highest temperatures are witnessed before the monsoon starts (i.e., from March to May). In the study area, it was observed that there was a decreasing trend in the land surface temperatures (LST) in recent years (see Figure 5). The temperature map was generated based on the India Water Resources Information System (India-WRIS) data. The map shows that lower temperatures were witnessed in the southwestern region where aquaculture is dominant (see Figure 6). The humidity data collected from the India-WRIS of the western delta region indicates 100% humidity during the summer and 80 to 100% humidity during other seasons. Generally, a decrease in the areas of water bodies such as ponds and lakes increase the temperature, and vice-versa. The pond area increased, and temperatures decreased in the current study area. Moreover, in the shrimp farms, four to five aerator sets per acre were used to improve the dissolved oxygen in the ponds, which also decreased the surface temperatures. However, the higher humidity of the region allows heat waves.
Brackish water with salinity of more than 7 ppt is desirable to obtain the best shrimp yield in inland aquaculture ponds. However, continuous saltwater pumping from the ground aquifers throughout the crop period (3 to 4 months) causes groundwater depletion and surface water pollution. Saltwater intrusion in the delta region of Andhra Pradesh has already extended up to 50 km from the Bay of Bengal, which leads to pollution [31].
As per Robb et al. [32], in aquaculture waters, 1 kg weight of live carp emits 2.12 kg CO2e. So, in the current study area, as per the production statistics of the live carp, there were 0.77 million metric tons in the year 2019, representing an effective emission of 1.63 million metric tons of CO2e [32]. Intensive aquaculture production significantly contributes to greenhouse gas emissions (GHE). Therefore, there is a need for proper guidelines to take care of aquaculture practices to reduce the negative impact on the environment and to confront climate change due to anthropogenic activities.
3. Impact of Intensive Aquaculture on Environment
3.1. Water Quality Characteristics
The physicochemical characteristics of the water samples in the study area such as pH, total dissolved solids (TDS), electrical conductivity (EC), salinity, total ammonia (TA), dissolved oxygen (DO), biological oxygen demand (BOD5), phosphate (PO4), ammonia (NH3), nitrite (NO2), and nitrate (NO3) were determined according to the standard Indian procedures, and the entire test results are shown in Table 2 [33]. The collected water samples were designated with sample identity based on the village number (Vn) and collected in each village (a and b). The pH of the water samples ranged from 7.4 to 9.4, indicating that the environment was more alkaline and not ideal for drinking. The EC values were not within the maximum permissible limit. The TDS values did not meet the standard limits (500 mg/L), and only 5% of the tested samples were within the desirable limits. The TDS generally comprised particulate organic matter and inorganic salts, and high values of TDS were seen in the intensive farming zone. This can be attributed to the particulate matter from the uneaten feed and shrimp effluents. The BOD5 represents the organic pollutants in the water; the average values in this study ranged from 0.6 to 14.2 ppm and were reportedly higher in the intensive zone practice.
The seasonal changes (postmonsoon and premonsoon) in water characteristics are reflected in the study area. The total ammonia and BOD5 concentrations were not within the Indian standard limits postmonsoon [33]. This could be because the higher temperatures in summer allow more chemical and biological reactions. Moreover, there was no significant change in the TDS values during postmonsoon and premonsoon. This is due to the excess particulate matter such as uneaten feed, shrimp waste, and poultry manure generated from the aquaculture ponds. Ammonia is the primary concern with higher concentrations in the ponds situated in zone-III. Further, the higher load of ammonia leads to reduced dissolved oxygen.
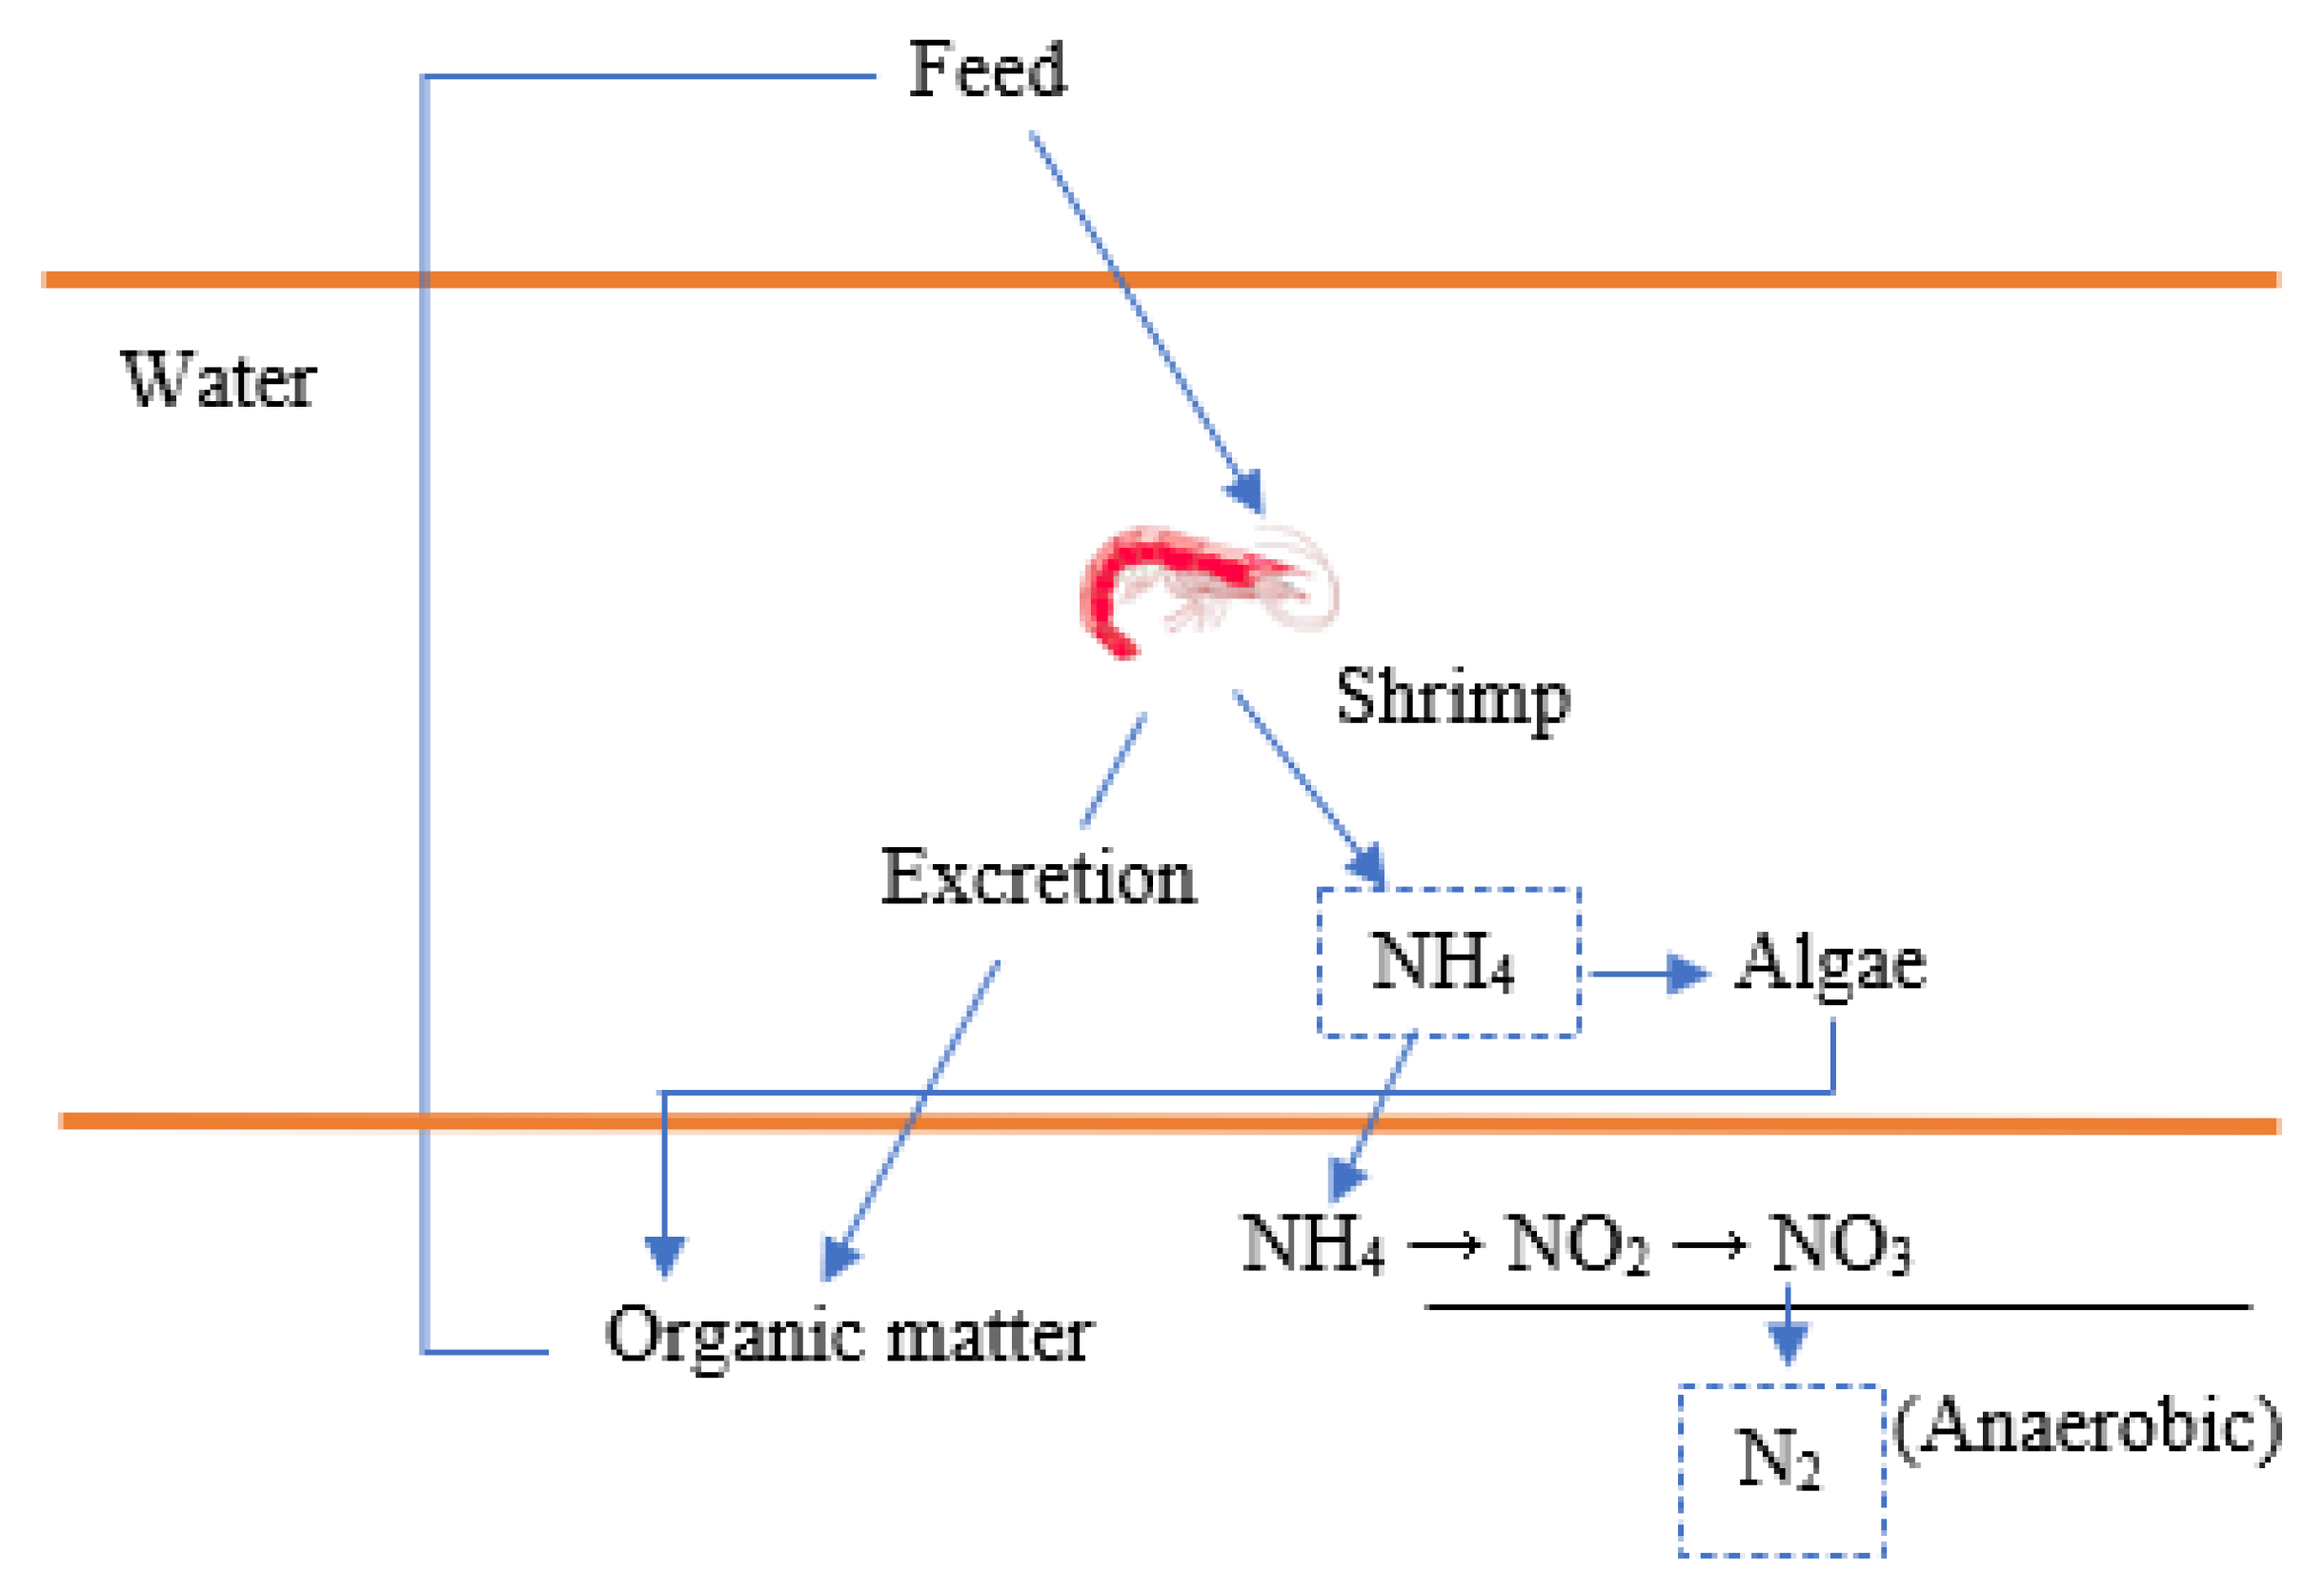
To understand the severity of the aquaculture scenario in the delta region of Andhra Pradesh, a peer glance at the nutrient levels in the aquaculture waters and their intensity are mentioned in Table 3, in particular ammonia, nitrate, and nitrite. The formation of ammonia and nitrate transformation in shrimp ponds is shown in Figure 7. The nutrient levels in the current study area show higher concentrations of nutrient levels compared to the previous published studies [34,35]. Few authors have reported that aquaculture wastewater can be utilized for shrimp rearing and adjacent farming [36,37]. However, in the real-world scenario, the viruses present in aquaculture wastewater affect adjacent aquaculture farms, and in the case of paddy fields, this is due to salinity. Strengthening this statement, Yuan et al. [38] reported that inland aquaculture ponds have a considerable influence on agriculture and maybe lead to greenhouse gases and global warming.
3.2. Aquaculture Pond Subsoil Characteristics
In general, the construction of new ponds involves the excavation of surface soil which is used as a fill material for earthen embankments. Most aquaculture ponds are usually on clayey deposits with a low amount of organic matter and nutrients at the initial stage of the crop. After two or more crops in the new pond, the surface soil exposed to the aquaculture effluents may increase the nutrients, organic matter, particulate matter, and phytoplankton blooms. This may further influence the physicochemical characteristics and geotechnical characteristics of the surface and subsoil. This is also reflected in the behavior and interaction of the aquaculture sludge leachate and clays. In this study, in dried aquaculture ponds after crops, soil samples were collected with the help of a PVC pipe with a diameter of 15 cm and length of 1.8 m which penetrated and collected undisturbed soil samples. The samples were tested for physicochemical characteristics, geotechnical properties, and aquaculture leachate and clay interactions.
3.2.1. Physicochemical Characteristics
Table 4 shows the physicochemical test results of the soil samples collected from the soils exposed to various intensities of aquaculture sediments.
In this study, the following physicochemical characteristics such as pH, electrical conductivity (EC), total organic carbon (TOC), total nitrogen (TC), phosphorus (P), potassium (K), sulfur (S), and sodium (Na) levels in the aquaculture pond soil was evaluated. From Table 4, by comparison, it was clear that the zone-III soils exhibited higher potassium and phosphorus content. This is due to the fact that uneaten feed (phosphorus) strongly adsorbs into the clay. Moreover, aquaculture pond soil-adsorbed phosphorus will not release into the water due to the highly insoluble behavior of phosphorus. In the study area, the test results exhibited cations trend was Ca2+ > Na+ > Mg2 + > K+. This could be due to the excessive lime, potassium, and magnesium usage in the ponds. The discharged effluents from the aquaculture ponds had a higher concentration of nutrients, leading to eutrophication, higher salinity contents reducing vegetation growth, and higher concentrations of chemicals leading to an ecological imbalance.
3.2.2. Geotechnical Properties
Table 5 shows the entire test data of the plasticity characteristics and hydraulic behavior of the soil samples collected in the aquaculture ponds. All the tested samples were expansive clays possessing intermediate to high compressibility. The free swell index (FSI) of the samples ranged from 55 to 145%, and zone-I samples exhibited higher free swell index values compared with zone-II and zone-III. This could be due to the lime content in the aquaculture water that reacts with the clayey soil. Further, due to the flocculation of particles and ion exchange, hydraulic conductivity also improved.
In comparison, in zone-III and zone-I, the plasticity behavior of the zone-III pond bottom clays exhibited low plasticity behavior due to the cation exchange of the clays and aquaculture sludge. The observed trends are in agreement with Khodary et al. [39]; the leachate concentration of the industrial solid waste landfill interaction with subsoil shows that the reduction in the plasticity behavior of the clays is due to free ions, such as K+, NH4+, Ca+2, and Na+, which replace the cations of the clay surface (double diffusion layer) and further improve the pores between the particles. Moreover, the monovalent cations contribute to the reduction in the double diffusion layer of the clays and adsorbed water. The hydraulic conductivity is high in zone-III because of the flocculation and agglomeration of particles and the ion exchange of clay particles and lime content.
3.2.3. Aquaculture Sludge Leachate and Clay Interaction
The cation exchange capacity (CEC) values of the clays were vital in selecting clays as a water barrier material. In this study, the CEC values were determined using the test procedure [40]. The results are shown in Table 6.
The CEC values of the clays blended with the aquaculture leachate significantly decreased due to the exchange of ions. The CEC values of the pure clays and clays combined with the aquaculture sludge leachate are shown in Table 6.
On the other hand, there is a relationship between the CEC values and the swelling behavior of the clays; it is safer to select clays with lower CEC values (<20 mEq/100 gm) for the foundation material, pavement subgrade material, and backfill material [41]. The clays and aquaculture sludge leachate interaction contributes to the exchange of NH4+, K+, Ca+2, and Na+ ions in the clays. So, clays exposed to aquaculture leachate significantly affect the clay mineralogy. This can further influence the double diffusion layer and surface forces or attractions of the clays. The ions of NH4+, K+, Ca+2, and Na+ significantly increased with the increasing aquaculture sludge leachate concentration. Apart from the effect of the aquaculture leachate and CEC, understanding the combined impact of the CEC and the swelling behaviour of clays is advantageous for construction activities. Moreover, due to the proportionality between the cation exchange and permeability of the clays, it is required to understand or monitor the groundwater quality for a sustainable environment.
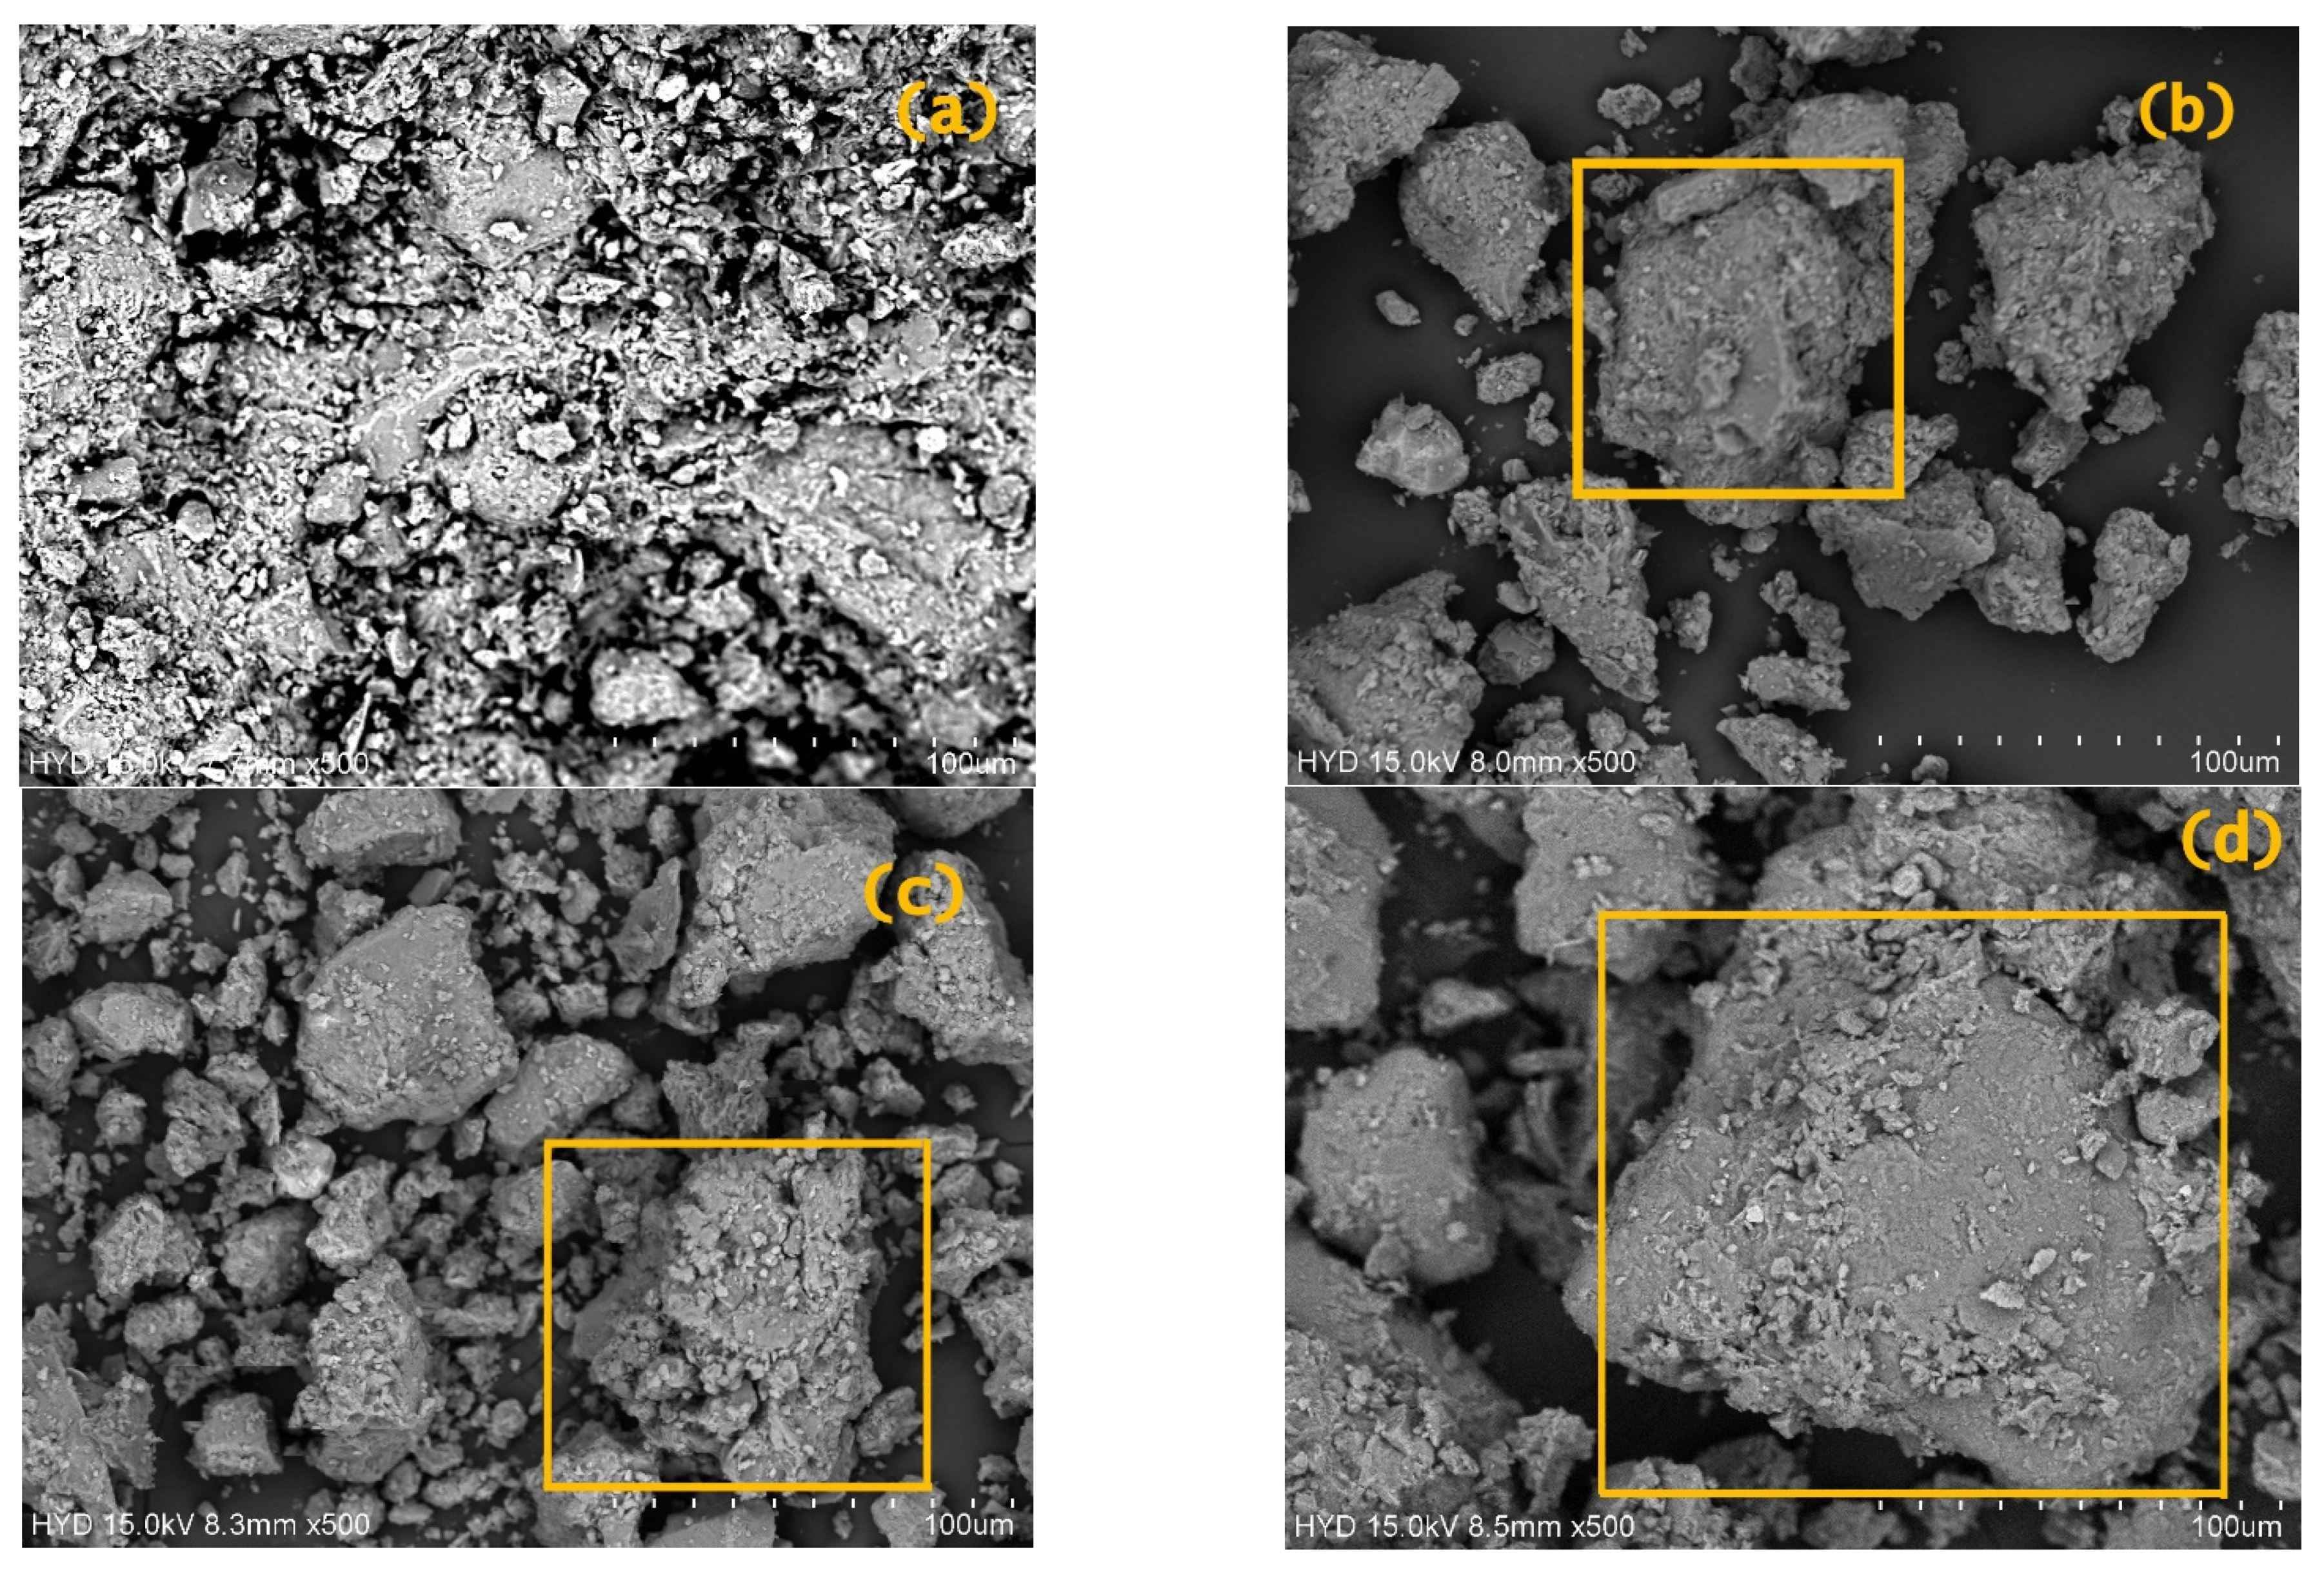
The scanning electron microscopy (SEM) analysis was carried out with the help of the FESEM Gemini 300. The SEM snaps of the clays exposed to different aquaculture effluent concentrations indicate the significant effect on the texture and shape of the particles. Figure 8 shows the SEM results of the clays with different aquaculture exposure conditions. The clay without aquaculture effluents exhibits a laminar-turbulent surface texture with numerous discontinuous surfaces. This is due to the surface and electrostatic force attraction between the clays. At the same time, the clays exposed to aquaculture effluents possess a dense matrix microstructure. Moreover, some particles of the blends are observed as silt-sized grains. So, silt-sized grains improve the hydraulic conductivity of the clays [42,43].
4. Future Thrust Area and Sustainable Development
The assessment of inland aquaculture ponds in three-dimensional aspects such as the ecological, environmental, and economic reduces the number of contaminant levels and the negative impact on human health. Still, it is also helpful to balance the ecosystem and energy conservation by developing sustainable practices and developments in aquaculture ponds. As discussed in Section 3.1, the NH3 and NO3 levels were up to 6.14 mg/L and 11.6 mg/L, respectively. Moreover, to make sustainable developments in aquaculture, managing aquaculture waste concentration, aquaculture waste and subsoil interaction, and the management of aquaculture waste is a significant concern. Based on the concentration of the pollutants and quantity herein, aquaculture waste has been divided into organic waste matter and highly polluted minerals. For traditional aquaculture zones, wastewater treatment with a recirculating aquaculture system is much needed to reduce the load of the pollutants in the outflow of water from ponds. On the other hand, intensive aquaculture practices regions should consider geosynthetic materials as a barrier system within the pond to reduce groundwater and adjacent field pollution and for geosynthetic tubes to be installed to transfer aquaculture wastewater to nearby drains. The proposed engineered aquaculture practice could decrease the environmental impact, climate change, salinity intrusion, greenhouse gas emissions, and pollution.
4.1. Ideal Engineered Aquaculture Pond
Engineered aquaculture is an effective practice aiming for a sustainable environmental, ecological, and economic approach. Engineered aquaculture systems need to be in practice for sustainable future development. The conceptual framework and strategies of the engineered aquaculture system are tabulated in Table 7. Engineered aquaculture has major components such as geosynthetic water barriers, geosynthetic drain tubes, sensor-based systems to monitor contaminant load, and recirculating aquaculture systems.
Geosynthetic materials such as geomembranes and geotubes play a vital role in inland aquaculture ponds. Geomembranes act as an efficient way to control the seepage of aquaculture waters into the subsoil and adjacent fields. Geotubes are helpful in draining aquaculture contaminants to nearby drainage canals. With regard to geosynthetic application in aquaculture to address sustainability and environmental concerns, geosynthetics are the only economical option to replace traditional methods. Sensor-based tools using the Internet of things (IoT) are emerging in many fields, including the monitoring of water quality and contaminant load in aquaculture ponds [44]. IoT-based aquaculture is urgently needed for sustainable aquaculture practice [45]. IoT-based tools could help monitor the water quality parameters in real-time without being time-consuming. Moreover, the regular monitoring of the water quality of ponds is a way to reduce the aquaculture pollutant load on nearby canals and groundwater bodies [46].
Recirculating the aquaculture system (RAS) was a successful system in the inland aquacultures to minimize the effluent load [47,48]. The RAS system was first used in Denmark in 1980, and later, it was expanded to China and European countries from 1980 to 2000. In recent years, the RAS system gained importance in Australia, North America, and other countries [49]. However, in India, only a few research articles were flagged, and no research work mentioned the installation of RAS systems in the field [50]. The present study is intended to convey that engineered aquaculture is an eco-friendly and cost-effective alternative to traditional practice to reduce aquaculture waste, climate change, saltwater intrusion, and groundwater contamination.
4.2. Cost Analysis of an Ideal Engineered Aquaculture Pond
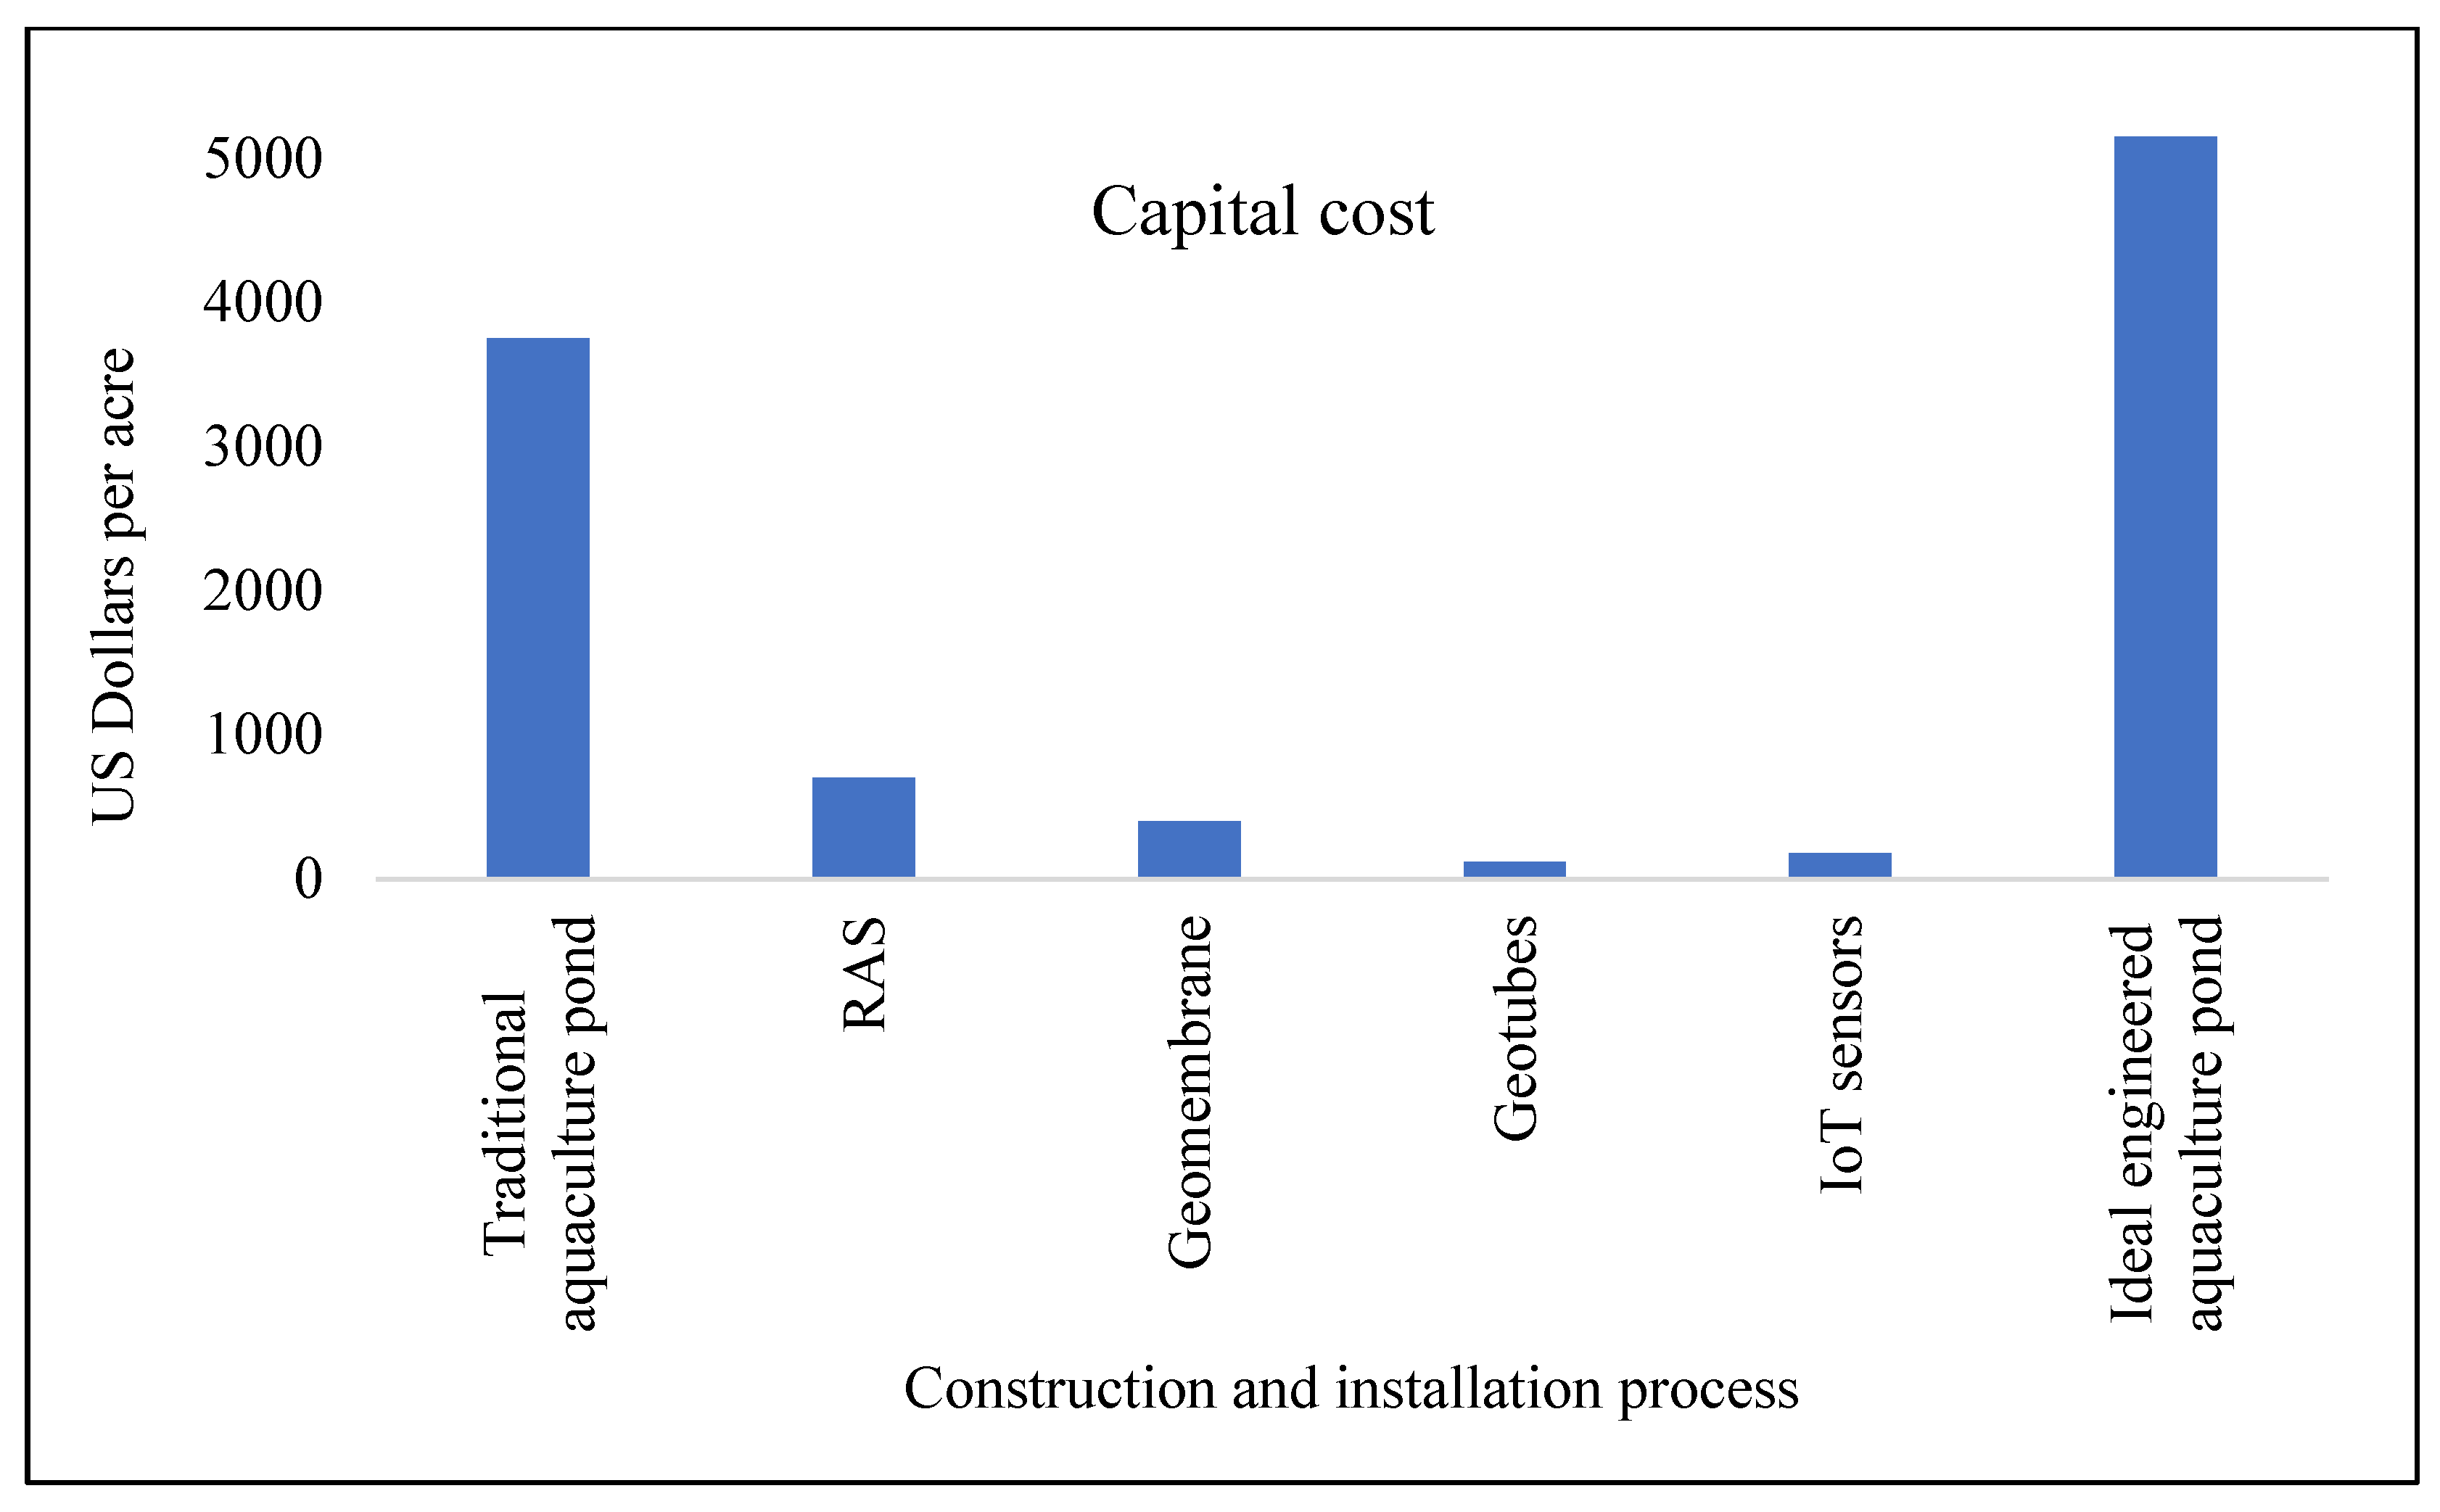
From the field survey and questionnaire data in the delta region of Andhra Pradesh, shrimp cultivation in ponds of one acre requires an investment of about USD 5000 to USD 7500, depending on the intensity of the practice. The significant aquaculture crop investment includes shrimp seed, feed, aeration power, chemicals, disinfectants, and labor wages. Moreover, the production of 2 to 4 tons of shrimp may be expected from a 1-acre pond for four months, which gives a profit of USD 5000 to USD 11,250. The costs incurred during the construction of the aquaculture pond include the excavation and transportation of soil, embankment construction, labor, and equipment required for the excavation and installation of pipelines and aerators. All data regarding traditional pond construction (see Figure 2) and brief details of the construction cost of the traditional ponds were collected in the field and are presented in Figure 9.
From the cost analysis results, an additional amount of USD 1400 needs to be invested to provide sustainable engineered components for traditional aquaculture ponds. Moreover, the engineered components investment is only for a one-time installation and can be used for 5 years with minor maintenance. The affluent nutrient effluent collected from the one-acre aquaculture pond is nearly about 1.4 tons for each crop (i.e., four months). This can be used as a fertilizer for nearby paddy crops. So, from each crop, using engineered components in a one-acre aquaculture pond, nutrients worth USD 100 to USD 150 can be generated.
From the foregoing discussion, it is advisable to consider engineered aquaculture ponds rather than traditional aquaculture practices to create a sustainable environment and implications for the water–energy nexus.
5. Conclusions
In this comprehensive study, aquaculture practices in the western delta region of Andhra Pradesh are demonstrated, and efforts are made to assess the aquaculture practices and their impact on the environment. To better understand the problems associated with intensive farming, a questionnaire survey in the field, a topography survey using GIS, extensive experimentation on water and soil samples, and soil and aquaculture leachate interactions were studied. The following conclusions were drawn.
The questionnaire survey results show that most of the locations in the western delta region fall in the severe or intensive farming zone. The growing extent of aquaculture ponds continuously operated without water exchange for a minimum of two crops with a higher concentration of chemicals and minerals is of concern, and there is a need for proper guidelines or attention to make a sustainable ecosystem.
The land use and land cover results during 2016 and 2020 reveal that dynamic changes were witnessed in aquaculture ponds that have significantly increased by 6.08% (43.18 sq. km). Croplands decreased by 7.83% (108.48 sq. km) due to the rapid increase in aquaculture ponds and urban land. Croplands were converted to aquaculture ponds despite poor laws and state economic growth concerns.
The physicochemical characteristics of aquaculture pond waters reflect converging trends for each zone. TDS, ammonia, DO, BOD5, COD, PO4, NH3, NO2, and NO3 showed higher concentrations in the aquaculture ponds and exceeded the Indian standard limits for irrigated water. Moreover, the COD and BOD5 values indicated excess particulate matter, ammonia, and nutritious compounds with intensive aquaculture farming. Finally, the excess chemical usage in the aquaculture pond water reflected higher potassium and phosphorus. This is due to the fact that uneaten feed (phosphorus) strongly adsorbs into the clay.
The rapid increase in intensive aquaculture farming is inevitable and generates higher concentrations of NH4+, K+, Ca+2, and Na+ ions. Further, these ions replaced the double diffusion layer of clays and reduced the surface forces and plasticity of the clays. The CEC values of the blended clays significantly decreased with the increase in the aquaculture leachate concentration. This is due to the exchangeable cations between the aquaculture leachate and clay surfaces. Therefore, efficient water barriers (geosynthetic membranes) and effluent purification systems are needed to reduce the contaminant load on the environment. The SEM analysis revealed that the presence of aquaculture effluents rich in NH4+, K+, Ca+2, and Na+ causes the flocculation of clay particles and improves clay particle size. Further, the hydraulic conductivity of the clays increased and acted as a semipervious material.
Engineered aquaculture components are much needed in the present intensive inland aquaculture scenario to reduce the pollutant load. Treated effluent with rich nutrients can be used as a fertilizer for agricultural purposes.
Finally, this comprehensive study presents the assessment of the unengineered aquaculture practices in the western delta region of Andhra Pradesh from a three-dimensional perspective. Further, it may draw attention and act as advice to practicing engineers, government officials, and researchers to develop sustainable engineered aquaculture ponds in the future.
Author Contributions
Conceptualization, T.V.N.; methodology, T.V.N.; investigation, T.V.N.; writing—original draft preparation, T.V.N.; writing—review and editing, S.B.M. and B.C.; supervision, S.B.M., B.C. and G.R. All authors have read and agreed to the published version of the manuscript.
Funding
This research received no external funding.
Institutional Review Board Statement
Not applicable.
Informed Consent Statement
Not applicable.
Data Availability Statement
The data presented in this study are available on request from the corresponding author.
Conflicts of Interest
The authors declare no conflict of interest.
Appendix A

Table A1.
Details of the sample collection locations in the study area and their designation.
| S. No. | Location | Latitude (N) | Longitude (E) | Designation/ Sample Id |
|---|---|---|---|---|
| 1 | Kalla | 16.5283° | 81.4087° | V1 |
| 2 | Kallakuru | 16.5283° | 81.3832° | V2 |
| 3 | Kallavapudi | 16.4620° | 81.3881° | V3 |
| 4 | Dodanapudi | 16.5245° | 81.3870° | V4 |
| 5 | Elurupadu | 16.5187° | 81.3468° | V5 |
| 6 | Juvalapalem | 16.5190° | 81.3695° | V6 |
| 7 | Sessali | 16.5296° | 81.4334° | V7 |
| 8 | Pedhaamiram | 16.5443° | 81.4903° | V8 |
| 9 | Chinnaamiram | 16.5291° | 81.4911° | V9 |
| 10 | Bhimavaram | 16.4851° | 81.4883° | V10 |
| 11 | Annakoderu | 16.4840° | 81.4825° | V11 |
| 12 | Vempa | 16.4421° | 81.5750° | V12 |
| 13 | Chilukuru | 16.6232° | 80.4354° | V13 |
| 14 | Kolamuru | 16.6329° | 81.4589° | V14 |
| 15 | Undi | 16.5864° | 81.4636° | V15 |
| 16 | Yendagandi | 16.6433° | 81.5336° | V16 |
| 17 | Akividu | 16.5823° | 81.3784° | V17 |
| 18 | Cherkumilli | 17.0711° | 81.6109° | V18 |
| 19 | Kolleru | 16.6629° | 81.3372° | V19 |
| 20 | Pedakapavaram | 16.6434° | 81.4306° | V20 |
| 21 | Chinakapavaram | 16.6348° | 81.4162° | V21 |
| 22 | Palakoderu | 16.5862° | 81.5480° | V22 |
| 23 | Mogallu | 16.6036° | 81.5638° | V23 |
| 24 | Vissakoderu | 16.5511° | 81.5665° | V24 |
| 25 | Attili | 16.6885° | 81.6037° | V25 |
| 26 | Manchili | 16.6565° | 81.6062° | V26 |
| 27 | Aravalli | 16.6316° | 81.6049° | V27 |
| 28 | Eduru | 16.6458° | 81.5689° | V28 |
| 29 | Ganapavaram | 16.6994° | 81.4635° | V29 |
| 30 | Kesavaram | 16.6810° | 81.5439° | V30 |
| 31 | Pippara | 16.7109° | 81.5418° | V31 |
| 32 | Kasipadu | 16.7361° | 81.5514° | V32 |
| 33 | Ardhavaram | 16.6889° | 81.5061° | V33 |
| 34 | Eluru | 16.7107° | 81.0952° | V34 |
| 35 | Kokkirailanka | 16.6382° | 81.2354° | V35 |
| 36 | Komadavole | 16.7117° | 81.1258° | V36 |
| 37 | Chataparru | 16.6966° | 81.1665° | V37 |
| 38 | Chebrolu | 16.8289° | 81.3922° | V38 |
| 39 | Unguturu | 16.8230° | 81.4238° | V39 |
| 40 | Denduluru | 16.7609° | 81.1665° | V40 |
References
- Chofqi, A.; Younsi, A.; Mania, J.; Mudry, J.; Veron, A. Environmental impact of an urban landfill on a coastal aquifer (El Jadida, Morocco). J. Afr. Earth Sci. 2004, 39, 509–516. [Google Scholar] [CrossRef]
- Sunil, B.M.; Shrihari, S.; Nayak, S. Soil-leachate interaction and their effects on hydraulic conductivity and compaction characteristics. In Proceedings of the 12th International Conference on Computer Methods and Advances in Geomechanics, Goa, India, 1–6 October 2008; Volume 3, pp. 2380–2386. [Google Scholar]
- Datta, M. Geotechnology for environmental control at waste disposal sites. Indian Geotech. J. 2012, 42, 1–36. [Google Scholar] [CrossRef]
- Jayanthi, M.; Thirumurthy, S.; Muralidhar, M.; Ravichandran, P. Impact of shrimp aquaculture development on important ecosystems in India. Glob. Environ. Chang. 2018, 52, 10–21. [Google Scholar] [CrossRef]
- Jayanthi, M.; Thirumurthy, S.; Samynathan, M.; Manimaran, K.; Duraisamy, M.; Muralidhar, M. Assessment of land and water ecosystems capability to support aquaculture expansion in climate-vulnerable regions using analytical hierarchy process based geospatial analysis. J. Environ. Manag. 2020, 270, 110952. [Google Scholar] [CrossRef]
- FAO. The State of World Fisheries and Aquaculture: Meeting the Sustainable Development Goals; IGO: Perth, Australia, 2018; p. 210. ISBN 978-92-5-130562-1. [Google Scholar]
- Ahmed, M.; Lorica, M.H. Improving developing country food security through aquaculture development—Lessons from Asia. Food Policy 2002, 27, 125–141. [Google Scholar] [CrossRef]
- Edwards, P. Aquaculture environment interactions: Past, present and likely future trends. Aquaculture 2015, 447, 2–14. [Google Scholar] [CrossRef]
- Wu, Y.; Song, K. Source, Treatment, and Disposal of Aquaculture Solid Waste: A Review. J. Environ. Eng. 2021, 147, 03120012. [Google Scholar] [CrossRef]
- Cao, L.; Wang, W.; Yang, Y.; Yang, C.; Yuan, Z.; Xiong, S.; Diana, J. Environmental impact of aquaculture and countermeasures to aquaculture pollution in China. Environ. Sci. Pollut. Res.-Int. 2007, 14, 452–462. [Google Scholar]
- Islam, M.; Yasmin, R. Impact of aquaculture and contemporary environmental issues in Bangladesh. Int. J. Fish. Aquat. Stud. 2017, 5, 100–107. [Google Scholar]
- Phillips, M. The Use of Chemicals in Carp and Shrimp Aquaculture in Bangladesh, Cambodia, Lao PDR, Nepal, Pakistan, Sri Lanka and Viet Nam; Southeast Asian Fisheries Development Center: Bangkok, Thailand, 2000. [Google Scholar]
- Paez-Osuna, F. The environmental impact of shrimp aquaculture: A global perspective. Environ. Pollut. 2001, 112, 229–231. [Google Scholar] [CrossRef]
- Lai, W.W.P.; Lin, Y.C.; Wang, Y.H.; Guo, Y.L.; Lin, A.Y.C. Occurrence of emerging contaminants in aquaculture waters: Cross-contamination between aquaculture systems and surrounding waters. Water Air Soil Pollut. 2018, 229, 249. [Google Scholar] [CrossRef]
- Islam, M.S.; Khan, S.; Tanaka, M. Waste loading in shrimp and fish processing effluents: Potential source of hazards to the coastal and nearshore environments. Mar. Pollut. Bull. 2004, 49, 103–110. [Google Scholar] [CrossRef]
- Rico, A.; Satapornvanit, K.; Haque, M.M.; Min, J.; Nguyen, P.T.; Telfer, T.C.; Van Den Brink, P.J. Use of chemicals and biological products in Asian aquaculture and their potential environmental risks: A critical review. Rev. Aquac. 2012, 4, 75–93. [Google Scholar] [CrossRef]
- Jayanthi, M.; Nila Rekha, P.; Kavitha, N.; Ravichandran, P. Assessment of impact of aquaculture on Kolleru Lake (India) using remote sensing and Geographical Information System. Aquac. Res. 2006, 37, 1617–1626. [Google Scholar] [CrossRef]
- Kolli, M.K.; Opp, C.; Karthe, D.; Groll, M. Mapping of major land-use changes in the Kolleru Lake freshwater ecosystem by using landsat satellite images in google earth engine. Water 2020, 12, 2493. [Google Scholar] [CrossRef]
- Jana, B.B.; Jana, S. The potential and sustainability of aquaculture in India. J. Appl. Aquac. 2003, 13, 283–316. [Google Scholar] [CrossRef]
- Piedrahita, R.H. Reducing the potential environmental impact of tank aquaculture effluents through intensification and recirculation. Aquaculture 2003, 226, 35–44. [Google Scholar] [CrossRef]
- Eng, C.T.; Paw, J.N.; Guarin, F.Y. The environmental impact of aquaculture and the effects of pollution on coastal aquaculture development in Southeast Asia. Mar. Pollut. Bull. 1989, 20, 335–343. [Google Scholar]
- Nhu, T.T.; Schaubroeck, T.; Henriksson, P.J.; Bosma, R.; Sorgeloos, P.; Dewulf, J. Environmental impact of non-certified versus certified (ASC) intensive Pangasius aquaculture in Vietnam, a comparison based on a statistically supported LCA. Environ. Pollut. 2016, 219, 156–165. [Google Scholar] [CrossRef]
- Bhavsar, D.O.; Pandya, H.A.; Jasrai, Y.T. Aquaculture and Environmental Pollution: A Review Work. Int. J. Sci. Res. Sci. Eng. Technol. 2016, 2, 40–45. [Google Scholar]
- Páez-Osuna, F.; Guerrero-Galván, S.R.; Ruiz-Fernández, A.C. The environmental impact of shrimp aquaculture and the coastal pollution in Mexico. Mar. Pollut. Bull. 1998, 36, 65–75. [Google Scholar] [CrossRef]
- Abdullah, A.N.; Myers, B.; Stacey, N.; Zander, K.K.; Garnett, S.T. The impact of the expansion of shrimp aquaculture on livelihoods in coastal Bangladesh. Environ. Dev. Sustain. 2017, 19, 2093–2114. [Google Scholar] [CrossRef]
- Szuster, B.W. A review of shrimp farming in central Thailand and its environmental implications. In Shrimp Culture: Economics and Trade; Leung, P.S., Engle, C., Eds.; John Wiley & Sons: Oxford, UK, 2006; pp. 155–164. [Google Scholar]
- Adusumilli, R.; Laxmi, S.B. Potential of the system of rice intensification for systemic improvement in rice production and water use: The case of Andhra Pradesh, India. Paddy Water Environ. 2011, 9, 89–97. [Google Scholar] [CrossRef] [Green Version]
- Government of Andhra Pradesh report on “Fish and prawn production in Andhra Pradesh”. Available online: https://westgodavari.ap.gov.in/fisheries (accessed on 1 January 2021).
- Jayanthi, M.; Ravisankar, T.; Nagaraj, G.; Thirumurthy, S.; Muralidhar, M.; Saraswathy, R. Is aquaculture abandonment a threat to sustainable coastal resource use?—A case study of Andhra Pradesh, India, with options for reuse. Land Use Policy 2019, 86, 54–66. [Google Scholar]
- Chuphal, N.; Sardar, P.; Sahu, N.P.; Shamna, N.; Harikrishna, V.; Maiti, M.K.; Mannur, V.S.; Jana, P.; Paul, M.; Krishna, G. Effects of graded dietary lipid levels on growth, feed utilization, body composition and metabolism in juvenile white leg shrimp, Penaeus vannamei (Boone, 1931) reared in inland saline water of 10 g/L salinity. Aquac. Nutr. 2021, 27, 1811–1824. [Google Scholar] [CrossRef]
- Kolli, M.K.; Opp, C.; Karthe, D.; Pradhan, B. Automatic extraction of large-scale aquaculture encroachment areas using Canny Edge Otsu algorithm in Google Earth Engine—The case study of Kolleru Lake, South India. Geocarto Int. 2022, 1–17. [Google Scholar] [CrossRef]
- Robb, D.H.; MacLeod, M.; Hasan, M.R.; Soto, D. Greenhouse Gas Emissions from Aquaculture: A Life Cycle Assessment of Three Asian Systems; FAO Fisheries and Aquaculture Technical Paper No. 609; FAO: Rome, Italy, 2017. [Google Scholar]
- IS 10500:2012; Specifications for Drinking Water. Bureau of Indian Standards: New Delhi, India, 2012.
- Alfiansah, Y.R.; Hassenrück, C.; Kunzmann, A.; Taslihan, A.; Harder, J.; Gärdes, A. Bacterial abundance and community composition in pond water from shrimp aquaculture systems with different stocking densities. Front. Microbiol. 2018, 9, 2457. [Google Scholar] [CrossRef] [Green Version]
- Azis, H.Y.; Tresnati, J.; Tuwo, A. Seaweed Gracilaria changii as a bioremediator agent for ammonia, nitrite and nitrate in controlled tanks of Whiteleg Shrimp Litopenaeus vannamei. In IOP Conference Series Earth and Environmental Science; IOP Publishing: Bristol, UK, 2020; Volume 564, p. 012059. [Google Scholar]
- Chatla, D.; Padmavathi, P.; Srinu, G. Wastewater treatment techniques for sustainable aquaculture. In Waste Management as Economic Industry towards Circular Economy; Springer: Singapore, 2020; pp. 159–166. [Google Scholar]
- Iber, B.T.; Kasan, N.A. Recent advances in Shrimp aquaculture wastewater management. Heliyon 2021, 7, e08283. [Google Scholar] [CrossRef]
- Yuan, J.; Xiang, J.; Liu, D.; Kang, H.; He, T.; Kim, S.; Ding, W. Rapid growth in greenhouse gas emissions from the adoption of industrial-scale aquaculture. Nat. Clim. Chang. 2019, 9, 318–322. [Google Scholar] [CrossRef] [Green Version]
- Khodary, S.M.; Elwakil, A.Z.; Fujii, M.; Tawfik, A. Effect of hazardous industrial solid waste landfill leachate on the geotechnical properties of clay. Arab. J. Geosci. 2020, 13, 706. [Google Scholar] [CrossRef]
- Rhoades, J.D. Cation exchange capacity. In Methods of Soil Analysis: Part 2 Chemical and Microbiological Properties; Wiley: Hoboken, NJ, USA, 1983; Volume 9, pp. 149–157. [Google Scholar]
- Yu, H.; Huang, X.; Ning, J.; Zhu, B.; Cheng, Y. Effect of cation exchange capacity of soil on stabilized soil strength. Soils Found. 2014, 54, 1236–1240. [Google Scholar] [CrossRef] [Green Version]
- Lilly, A.; Nemes, A.; Rawls, W.J.; Pachepsky, Y.A. Probabilistic approach to the identification of input variables to estimate hydraulic conductivity. Soil Sci. Soc. Am. J. 2008, 72, 16–24. [Google Scholar] [CrossRef] [Green Version]
- García-Gutiérrez, C.; Pachepsky, Y.; Martín, M.Á. Saturated hydraulic conductivity and textural heterogeneity of soils. Hydrol. Earth Syst. Sci. 2018, 22, 3923–3932. [Google Scholar] [CrossRef] [Green Version]
- Hsieh, C.W. Geotextiles in agriculture and aquaculture. In Geotextiles; Woodhead Publishing: Sawston, UK, 2016; pp. 511–530. [Google Scholar]
- Antonucci, F.; Costa, C. Precision aquaculture: A short review on engineering innovations. Aquac. Int. 2020, 28, 41–57. [Google Scholar] [CrossRef]
- Prapti, D.R.; Mohamed Shariff, A.R.; Che Man, H.; Ramli, N.M.; Perumal, T.; Shariff, M. Internet of Things (IoT)-based aquaculture: An overview of IoT application on water quality monitoring. Rev. Aquac. 2022, 14, 979–992. [Google Scholar] [CrossRef]
- Xiao, R.; Wei, Y.; An, D.; Li, D.; Ta, X.; Wu, Y.; Ren, Q. A review on the research status and development trend of equipment in water treatment processes of recirculating aquaculture systems. Rev. Aquac. 2019, 11, 863–895. [Google Scholar] [CrossRef]
- Yogev, U.; Vogler, M.; Nir, O.; Londong, J.; Gross, A. Phosphorous recovery from a novel recirculating aquaculture system followed by its sustainable reuse as a fertilizer. Sci. Total Environ. 2020, 722, 137949. [Google Scholar] [CrossRef]
- Ahmed, N.; Turchini, G.M. Recirculating aquaculture systems (RAS): Environmental solution and climate change adaptation. J. Clean. Prod. 2021, 297, 126604. [Google Scholar] [CrossRef]
- Das, R.R.; Sarkar, S.; Saranya, C.; Esakkiraj, P.; Aravind, R.; Saraswathy, R.; Panigrahi, A. Co-culture of Indian white shrimp, Penaeus indicus and seaweed, Gracilaria tenuistipitata in amended biofloc and recirculating aquaculture system (RAS). Aquaculture 2022, 548, 737432. [Google Scholar] [CrossRef]
Figure 1.
Western delta region of Andhra Pradesh.

Figure 2.
Aerial view of aquaculture ponds in the study area.

Figure 3.
Land use and land cover maps in the study area during 2016 and 2020.

Figure 4.
Land use and land cover classification.

Figure 5.
Temperature of western delta region of Andhra Pradesh from 2000 to 2022.

Figure 6.
Spatial distribution of temperatures in premonsoon (April to May) 2016.

Figure 7.
Formation of ammonia and nitrate transformation in shrimp ponds.

Figure 8.
SEM images of (a) clay, (b) clay exposed to zone-I aquaculture leachate, (c) clay exposed to zone-II aquaculture leachate, and (d) clay exposed to zone-III aquaculture leachate.
Figure 8.
SEM images of (a) clay, (b) clay exposed to zone-I aquaculture leachate, (c) clay exposed to zone-II aquaculture leachate, and (d) clay exposed to zone-III aquaculture leachate.

Figure 9.
Comparison of capital cost of various constructions and installation process.

Table 1.
Classification of aquaculture practices in the delta region of Andhra Pradesh.
| Description | Intensity of Aquaculture Practice (Penaeus Vannamei) | ||
|---|---|---|---|
| Traditional | Moderate or Semi-Intensive | Severe or Intensive | |
| Area of pond (acre) | 2–5 or < | 5–10 | 10–20 or < |
| Depth of water level in the pond (m) | 1–1.5 | 1–3 | 1.5–4 |
| Seed density (no./acre) | 10,000–20,000 or < | 20,000–60,000 or < | 40,000–100,000 or < |
| Feed per acre (kgs) | 600–850 | 1600–1700 | 2100–2200 |
| Survival rate (months) | 2–3 or < | 1–3 or < | 1–3 or < |
| No. of crops per year | 4 or < | 3–4 or < | 3–4 or < |
| Aeration sets per acre | 1–2 or < | 2–4 or < | 4–5 |
| Production per acre per crop (tons) | 1–2 or < | 1–5 or < | 4–8 or < |
| Lime used per acre per crop (kgs) | 5–10 or < | 5–25 or < | 10–50 or < |
| Potassium/magnesium/calcium chlorides used per acre per crop (kgs) | 1–5 or < | 5–10 or < | 5–25 or < |
| No. of times chemicals used per crop | 2–4 or < | 2–6 or < | 4–8 or < |
| No. of times probiotics used per crop | 1–3 or < | 2–8 or < | 4–12 or < |
| No. of times disinfectants used per crop | 1–2 or < | 1–4 or < | 2–6 or < |
| Salinity range (ppm) | 0–4 | 4–6 or < | 5–9 or < |
| Water exchange per year | 3–5 or < | 3–5 or < | 2–3 |
| Environmental impact | Moderate | High | Relative |
| Sustainability concerns | Moderate | Low | Relatively low |
Table 2.
Physicochemical characteristics of aquaculture pond water.
| Sample Id | pH | TDS (ppm) | EC (µs/cm) | Salinity (ppt) | T.A. (ppm) | PO4 (ppm) | DO (ppm) | BOD5 (ppm) | NH3 (ppm) | NO2 (ppm) | NO3 (ppm) |
|---|---|---|---|---|---|---|---|---|---|---|---|
| V1 (a) | 8.2 | 360 | 320 | 5 | 84 | Nil | 4.0 | 12.6 | 6.14 | 0.04 | 61.21 |
| V1 (b) | 8.7 | 850 | 1055 | 14 | 215 | Nil | 4.0 | 12.6 | 2.20 | 0.04 | 61.21 |
| V2 (a) | 8.5 | 6200 | 8900 | 8 | 180 | Nil | 5.9 | 10.6 | 1.48 | 2.18 | 79.07 |
| V2 (b) | 8.2 | 180 | 230 | 10 | 84 | Nil | 5.3 | 12.6 | 2.20 | 0.04 | 91.21 |
| V3 (a) | 9.4 | 3240 | 4500 | 8 | 140 | Nil | 3.5 | 14.2 | 4.15 | 0.85 | 68.08 |
| V3 (b) | 8.1 | 540 | 1400 | 7 | 320 | Nil | 5.5 | 13.6 | 5.30 | 1.20 | 64.62 |
| V4 (a) | 8.8 | 420 | 451 | 4 | 160 | Nil | 4.6 | 12.8 | 1.5 | 0.03 | 42.38 |
| V4 (b) | 8.4 | 2340 | 5675 | 2 | 180 | Nil | 3.5 | 11.4 | 0.60 | 0.48 | 66.60 |
| V5 (a) | 7.8 | 180 | 465 | 0 | 160 | 0.30 | 5.0 | 3.6 | 1.24 | 0.05 | 51.4 |
| V5 (b) | 7.4 | 320 | 580 | 0 | 180 | 0.1 | 4.6 | 2.8 | 1.50 | 0.33 | 44.38 |
| V7 (a) | 8.3 | 2400 | 8350 | 2 | 260 | Nil | 4.5 | 11 | 2.55 | 1.26 | 24.48 |
| V7 (b) | 8.7 | 4200 | 58,000 | 8 | 430 | Nil | 5.5 | 12.4 | 3.15 | 0.17 | 14.16 |
| V8 (a) | 8.2 | 7240 | 11,200 | 6 | 232 | 0.1 | 5.8 | 10.6 | 3.47 | 0.92 | 28.84 |
| V8 (b) | 9.4 | 760 | 1154 | 5 | 400 | Nil | 5.0 | 12.4 | 5.02 | 1.24 | 35.15 |
| V9 (a) | 8.6 | 530 | 890 | 4 | 310 | 0.15 | 6.0 | 11 | 1.15 | 0.88 | 10.6 |
| V9 (b) | 7.6 | 8700 | 53,000 | 4 | 132 | 0.3 | 9.2 | 11.3 | 4.4 | 0.06 | 12.51 |
| V10 (a) | 8.5 | 4140 | 760 | 4 | 210 | 0.15 | 2.0 | 15 | 2.62 | 0.08 | 12.51 |
| V10 (b) | 8.5 | 1200 | 8000 | 11 | 245 | Nil | 4.5 | 3.4 | 2.4 | 0.45 | 21.6 |
| V19 (a) | 8.4 | 250 | 460 | 7 | 195 | Nil | 5.5 | 12.6 | 0.48 | 0.07 | 20.2 |
| V19 (b) | 7.4 | 520 | 850 | 2 | 170 | Nil | 4.9 | 0.6 | 0.97 | 0.04 | 5.75 |
| V27 (a) | 8.2 | 1100 | 2180 | 11 | 300 | Nil | 5.3 | 2.8 | 5.09 | 1.29 | 6.15 |
| V27 (b) | 7.8 | 1500 | 2200 | 2 | 170 | 0.4 | 5.5 | 2.8 | 1.08 | 0.05 | 13.1 |
| V28 (a) | 8.4 | 450 | 780 | 4 | 170 | Nil | 4.0 | 15 | 0.18 | 1.24 | 4.66 |
| V28 (b) | 8.4 | 3200 | 6500 | 8 | 170 | Nil | 5.5 | 4.5 | 1.66 | 2.16 | 5.45 |
| V34 (a) | 8.3 | 2300 | 3400 | 4 | 160 | 0.3 | 7.3 | 5.3 | 1.23 | 0.33 | 4.53 |
| V34 (b) | 8.4 | 3400 | 5450 | 0 | 315 | Nil | 5.5 | 11.6 | 1.85 | 1.44 | 11.6 |
| V35 (a) | 8.2 | 8000 | 12,000 | 8 | 280 | Nil | 3.3 | 10.4 | 1.24 | 0.05 | 7.15 |
| V35 (b) | 7.8 | 3600 | 52,000 | 13 | 170 | Nil | 5.0 | 5.3 | 0.54 | 2.18 | 19.07 |
| V39 (a) | 8.5 | 5000 | 10,080 | 9 | 185 | 0.43 | 3.0 | 14.5 | 1.23 | 0.33 | 4.53 |
| V39 (b) | 8.5 | 8200 | 11,800 | 10 | 500 | Nil | 5.3 | 2.8 | 5.59 | 2.39 | 29.32 |
Table 3.
Ammonia and nitrate levels in aquaculture water.
| Parameter | Current Study | Alfiansah et al. [34] | Azis et al. [35] |
|---|---|---|---|
| NH3 | 0.18–6.14 mg/L | 0.37–0.60 mg/L | 0.01–0.18 mg/L |
| NO2 | 0.04–2.39 mg/L | 0.20–0.33 mg/L | 0.37–0.44 mg/L |
| NO3 | 1.21–91.21 mg/L | 0.18–0.21 mg/L | 1.69–1.96 mg/L |
Table 4.
Physicochemical characteristics of aquaculture pond subsoil.
| Zone | Village | pH | EC (µs/cm) | TOC (%) | TN (kg/acre) | P (kg/acre) | K (kg/acre) | S (kg/acre) | Na (ppm) |
|---|---|---|---|---|---|---|---|---|---|
| Intensive (III) | V1 | 8.2 | 5.1 | 1.45 | 116 | 507 | 570 | 245 | 238 |
| V2 | 8.0 | 2.2 | 2.28 | 1077 | 472 | 432 | 230 | 215 | |
| V3 | 7.7 | 2.5 | 3.98 | 125 | 491 | 848 | 218 | 178 | |
| V4 | 7.5 | 5.4 | 3.72 | 32 | 484 | 564 | 156 | 165 | |
| V5 | 7.4 | 2.3 | 2.99 | 118 | 490 | 388 | 165 | 182 | |
| Semi-intensive (II) | V7 | 7.2 | 2.7 | 2.22 | 188 | 377 | 375 | 154 | 174 |
| V8 | 7.2 | 2.4 | 1.12 | 85 | 257 | 415 | 145 | 163 | |
| V9 | 7.8 | 1.8 | 1.18 | 102 | 186 | 345 | 205 | 162 | |
| V10 | 7.7 | 0.7 | 1.45 | 78 | 154 | 386 | 88 | 125 | |
| V19 | 7.6 | 1.9 | 1.85 | 84 | 132 | 243 | 106 | 128 | |
| Traditional (I) | V27 | 7.6 | 2.6 | 0.84 | 95 | 195 | 334 | 115 | 134 |
| V28 | 7.6 | 2.3 | 0.74 | 68 | 88 | 355 | 125 | 185 | |
| V34 | 7.4 | 1.8 | 0.84 | 76 | 85 | 245 | 155 | 215 | |
| V35 | 7.0 | 1.3 | 1.05 | 82 | 157 | 175 | 145 | 113 | |
| V39 | 7.4 | 1.7 | 1.16 | 82 | 165 | 235 | 165 | 151 |
Table 5.
Plasticity and hydraulic behaviour of aquaculture pond clays.
| Zone | Sample Id | Liquid Limit, LL (%) | Plastic Limit, PL (%) | Plasticity Index, PI (%) | FSI (%) | Hydraulic Conductivity (cm/sec) |
|---|---|---|---|---|---|---|
| Intensive (III) | V1 | 65 | 21 | 44 | 85 | 3.2 × 10⁻⁵ |
| V2 | 60 | 24 | 36 | 80 | 5.1 × 10⁻⁵ | |
| V3 | 68 | 20.5 | 47.5 | 75 | 6.8 × 10⁻⁶ | |
| V4 | 44 | 18 | 26 | 55 | 5.5 × 10⁻⁵ | |
| V5 | 54 | 21.5 | 32.5 | 85 | 3.6 × 10⁻⁵ | |
| Semi-intensive (II) | V7 | 62 | 32.5 | 29.5 | 75 | 2.8 × 10⁻⁶ |
| V8 | 64 | 33 | 31 | 55 | 5.6 × 10⁻⁷ | |
| V9 | 84 | 33.5 | 50.5 | 130 | 6.9 × 10⁻⁷ | |
| V10 | 64 | 19.5 | 44.5 | 80 | 4.4 × 10⁻⁶ | |
| V19 | 84 | 29 | 55 | 120 | 4.5 × 10⁻⁶ | |
| Traditional (I) | V27 | 80 | 30 | 50 | 105 | 4.2 × 10⁻⁷ |
| V28 | 89 | 31 | 58 | 130 | 4.6 × 10⁻⁶ | |
| V34 | 82 | 32 | 50 | 114 | 5.0 × 10⁻⁶ | |
| V35 | 76 | 34 | 42 | 145 | 5.5 × 10⁻⁷ | |
| V39 | 88 | 25 | 63 | 136 | 4.4 × 10⁻⁷ |
Table 6.
Effect of aquaculture leachate on clay minerology.
| Condition | Plasticity Index, % | CEC, mEq/100 g | Ammonia, mEq/100 g | Potassium, mEq/100 g | Sodium, mEq/100 g | Calcium, mEq/100 g |
|---|---|---|---|---|---|---|
| Clay with no leachate exposure | 59 | 52.55 | 0.04 | 3.27 | 0.22 | 31.35 |
| Clay with zone-III aquaculture leachate exposure | 54 | 42.67 | 18.35 | 15.44 | 7.45 | 40.18 |
| Clay with zone-II aquaculture leachate exposure | 51 | 34.82 | 39.54 | 24.17 | 32.88 | 42.15 |
| Clay with zone-I aquaculture leachate exposure | 43 | 26.44 | 52.44 | 42.87 | 51.14 | 44.27 |
Table 7.
Conceptual framework and strategies of the engineered aquaculture.
| Stage-I: Community Awareness | Stage-II: Training Program | Stage-III: Technical Support | Stage-IV: Sustainable Engineered Aquaculture Ponds |
|---|---|---|---|
| Regular awareness camps with farmers | Workshops to understand the negative impact of aquaculture on the environment | Sensor network using IoT tools to monitor pollution levels | Ecological balance |
| Interactive discussions between government agencies | Training programs to assess the water quality in ponds | Geosynthetic materials to control the seepage of contaminant waters | Environmental sustainability |
| Awareness programs to community-based organizations with technical teams | Workshops on the proper utilization of feed, chemicals, minerals, and disinfectants in aquaculture ponds | Recirculating aquaculture systems (RASs) to purify aquaculture-contaminated water before reuse | Climate change adaptation |
Publisher’s Note: MDPI stays neutral with regard to jurisdictional claims in published maps and institutional affiliations. |
© 2022 by the authors. Licensee MDPI, Basel, Switzerland. This article is an open access article distributed under the terms and conditions of the Creative Commons Attribution (CC BY) license (https://creativecommons.org/licenses/by/4.0/).
Share and Cite
MDPI and ACS Style
Nagaraju, T.V.; Malegole, S.B.; Chaudhary, B.; Ravindran, G. Assessment of Environmental Impact of Aquaculture Ponds in the Western Delta Region of Andhra Pradesh. Sustainability 2022, 14, 13035. https://doi.org/10.3390/su142013035
AMA Style
Nagaraju TV, Malegole SB, Chaudhary B, Ravindran G. Assessment of Environmental Impact of Aquaculture Ponds in the Western Delta Region of Andhra Pradesh. Sustainability. 2022; 14(20):13035. https://doi.org/10.3390/su142013035
Chicago/Turabian StyleNagaraju, T. Vamsi, Sunil B. Malegole, Babloo Chaudhary, and Gobinath Ravindran. 2022. "Assessment of Environmental Impact of Aquaculture Ponds in the Western Delta Region of Andhra Pradesh" Sustainability 14, no. 20: 13035. https://doi.org/10.3390/su142013035
Note that from the first issue of 2016, this journal uses article numbers instead of page numbers. See further details here.