Article

Highlighting the Probabilistic Behavior of Occupants’ Preferences in Energy Consumption by Integrating a Thermal Comfort Controller in a Tropical Climate

by
Alejandra Aversa
1,
Luis Ballestero
1 and
Miguel Chen Austin
1,2,3,*
1
Research Group Energy and Comfort in Bioclimatic Buildings (ECEB), Faculty of Mechanical Engineering, Universidad Tecnológica de Panamá, Panama City 0819-07289, Panama
2
Centro de Estudios Multidisciplinarios en Ciencias, Ingeniería y Tecnología (CEMCIT-AIP), Universidad Tecnológica de Panamá, Panama City 0819-07289, Panama
3
Sistema Nacional de Investigación (SNI), Clayton Panama City 0816, Panama
*
Author to whom correspondence should be addressed.
Sustainability 2022, 14(15), 9591; https://doi.org/10.3390/su14159591
Submission received: 8 June 2022 / Revised: 19 July 2022 / Accepted: 1 August 2022 / Published: 4 August 2022

Abstract

:
The thermal comfort of an individual is known as the mental satisfaction they possess in a medium. This depends on several ambient factors such as air temperature, mean radiant temperature, relative humidity, air velocity, and personal factors such as cloth and metabolic activity. In buildings, occupants interact with different systems and equipment such as air conditioning, ventilation, lighting, and other appliances to influence these factors or demonstrate adaptive tendencies with the systems to reach comfort. Within the last two decades, preference-based occupant-centered control systems have been incorporated into buildings, generally validated with comfort indexes. A frequently found challenge is the formulation of the method used to create a system that considers the stochastic characteristics of the occupant’s portrait. Here, a method that links the advantages of both probabilistic and schedule-based methods and satisfactorily integrates it with comfort indexes through a controller is proposed. It is intended to compare the controller’s effect on thermal comfort through comfort indexes and energy consumption when implementing different occupant models applied in Panama. Sensibility analysis, gray-box building modeling, and thermal indexes were used in the controller’s design. Results showed that the best controller is the probability-based model providing low power consumption and PMV levels.

1. Introduction

Energy consumed by household appliances such as air conditioning, heaters, and fans has been increasing in multiple sectors. The International Energy Agency estimates that by 2050 energy consumption may triple [1,2]. This trend is observed mostly in residential and office buildings, which is why their occupants’ behavior and systems-interaction have been of interest for international research [3,4]. In addition, there has been a growing trend towards the study of environmental [5,6,7], psychological, physiological, social [8,9], and economic [10] factors that influence the behavior of occupants. Similarly, the study of thermal comfort [11,12,13,14], a primary indicator of thermal sensations in occupants, has gained relevance in research [15,16]. Thermal comfort is formally defined as a mental state that expresses satisfaction with the thermal environment and is evaluated using subjective criteria [17]. However, over the years, several indexes and indicators have been developed to predict thermal comfort such as the Fanger predicted mean vote (PMV), PMV with some variations (ePMV) [18], and the ASHRAE 55 discomfort hours, among others. Depending on the geographical area, such indexes are applied such as (i) the adaptive mean vote, which is typically used in places characterized by high humidity and pronounced heat and (ii) the extended model of PMV, which incorporates an expectation factor that acknowledges the heat tolerance inherent of the type of habitat the occupants inhabit. It is notable that this index can be used on naturally ventilated areas whereas most indexes are intended to be used on mechanically ventilated zones [18]. These types of indexes are key when evaluating the performance of Building Energy Modeling (BEM) analysis. It is also important to consider that optimum thermal comfort is achieved with an appropriate combination of environmental and personal parameters that the occupant may or may not influence. Research such as in Refs. [19,20] indicates that constructing and applying personal models can further increase thermal comfort for a small group of occupants, since it targets individual needs and adjusts determined area conditions accordingly.
The International Energy Agency leads and coordinates two projects that are essential for any research that goes into the study of occupant comfort in buildings: Annex 66 and Annex 79. Annex 66 [21] (p. 66) focuses on presence detection or occupation [22], movements, and occupants’ interactions with the environment, as well as the study of the social [9], emotional, and physical factors that drive these interactions. Annex 79 [23,24] emerges as a continuation of the efforts of Annex 66, with the aim of implementing technologies such as artificial intelligence [25,26,27,28] and the Internet of Things (IoT) [29,30] along with occupant models in both design and construction. Another key detail that the annex will impact is the creation of methodologies for the integration of these models and buildings’ designs [31], proposing various options from simple strategies such as lighting turning on and off depending on the presence of people, to more complex strategies such as temperature control of an area or lighting level adapted to occupant profiles.
The recent growing concern for energetic consumption has actively influenced research. In the University of Torino [32], distinct patterns of occupants’ behaviors were evaluated, determining that their lifestyles and activities heavily affected the energetic performance of a residential nZEB; therefore, understanding and predicting occupant behavior is key in reducing energy consumption. D’Oca et al. [33] established that most interactions made by occupants with control systems were to keep an optimal level of personal comfort, they determined nine different behavior patterns that described the data obtained from 40 occupants, then they compared the controller’s response based on probabilistic-based patterns and deterministic-based patterns, noticing up to a 61% difference in the building’s energetic consumption. In Brazil, a study was performed at Santa Catarina University [34], where data from windows, blinds, ventilation, heating, and air conditioning usage was collected and then related to surveys performed on students and staff to identify the source of discomfort by system and the adjustments they performed on the system’s controllers. Using the data as an input, a decision tree was developed to predict occupants’ decisions. Another study performed in Singapore implemented a mobile app to book a work area within the National University of Singapore and then submit the perceived comfort of the place. The app then suggests a new work area based on previous inputs; this cycle is repeated until comfort is reached. Several occupant profiles were determined from the study by unsupervised clustering. This study seems to suggest that classifying occupants by their preferences may result in higher energetic savings [35].
The development of control systems that use thermal comfort as the main indicator requires the development of thermal and energy models of buildings and their thermal zones. These models represent the structure, systems, and elements of the buildings and the interaction of energy with the medium. They have been used to evaluate energy consumption and energy efficiency in simulations [36]. Often, the gray-box modeling technique is applied [37]. Simplified energy and heat transfer equations are used, and physical parameters of the target building are not fixed, therefore, multiple thermal models are built for the same study case [38]. This is an example that suggests that there is not just one RC configuration that could be useful in representing a study case, depending on the required detail level, sophisticated grids can be formed like Boodi’s [39] or simpler [40] if the time dedicated to parameter estimations needs to be reduced. Attoue et al. [38] concluded that the optimal dimensions for a network should be around the second or third order, but these dimensions can vary depending on the thermal conditions of the building, for example, temperature variations and the presence of heating systems. It is valuable to mention that the estimation of gray-box parameters could be supported using MATLAB functions such as fmincon and MaxFunEvals [41], Greyest [38], fminunc, pattern search, and simulated annealing [42]. Among them, greyest is highlighted because of its simplicity, it only requires a linear model, parameters to train, and the initial values of these parameters [43]. Its configuration is adjusted by the greyestOptions function that allows better predictions according to the constraints chosen.
The use of field measurements and test data help determine the fitting model, according to its prediction capability. Therefore, the present investigation deals with the task of including occupants’ preferences in a thermal comfort control system within a case study in the tropical climate of Panama City. The gray-box model technique, dynamic simulation tools, and surveys were employed. This study advances the research field by highlighting the benefits in considering occupants’ probabilistic behavior for thermal comfort-based controllers of the indoor environment, resulting in lower energy consumption estimations than survey-based or schedule-based preferences.

2. Materials and Methods

The project contemplates the dynamic simulation of a single-family residence for a period of 365 days in passive mode (no mechanical ventilation employed) and active mode (mechanical devices are integrated such as an air conditioning unit). It is proposed to represent the thermal model through mathematical modeling, optimization of the defined model so that its behavior in terms of indoor temperature is equivalent to that obtained through simulation. Once the modeling phase is finished, the presence of the occupant is integrated into the system through four occupant decision-making scenarios: (1) deterministic, (2) probabilistic, (3) combined with an emphasis on the probabilistic model, and (4) combined with an emphasis on the deterministic model. From now on, scenarios 3 and 4 are referred to as combined model #1 and #2, respectively. Finally, the creation of a proportional integrative (PI)-type controller is contemplated that changes according to the type of decision-making model of the occupant (scenarios) and considers the level of predicted mean vote (PMV) as the thermal comfort indicator. The solution procedure for this case is summarized in Table 1:

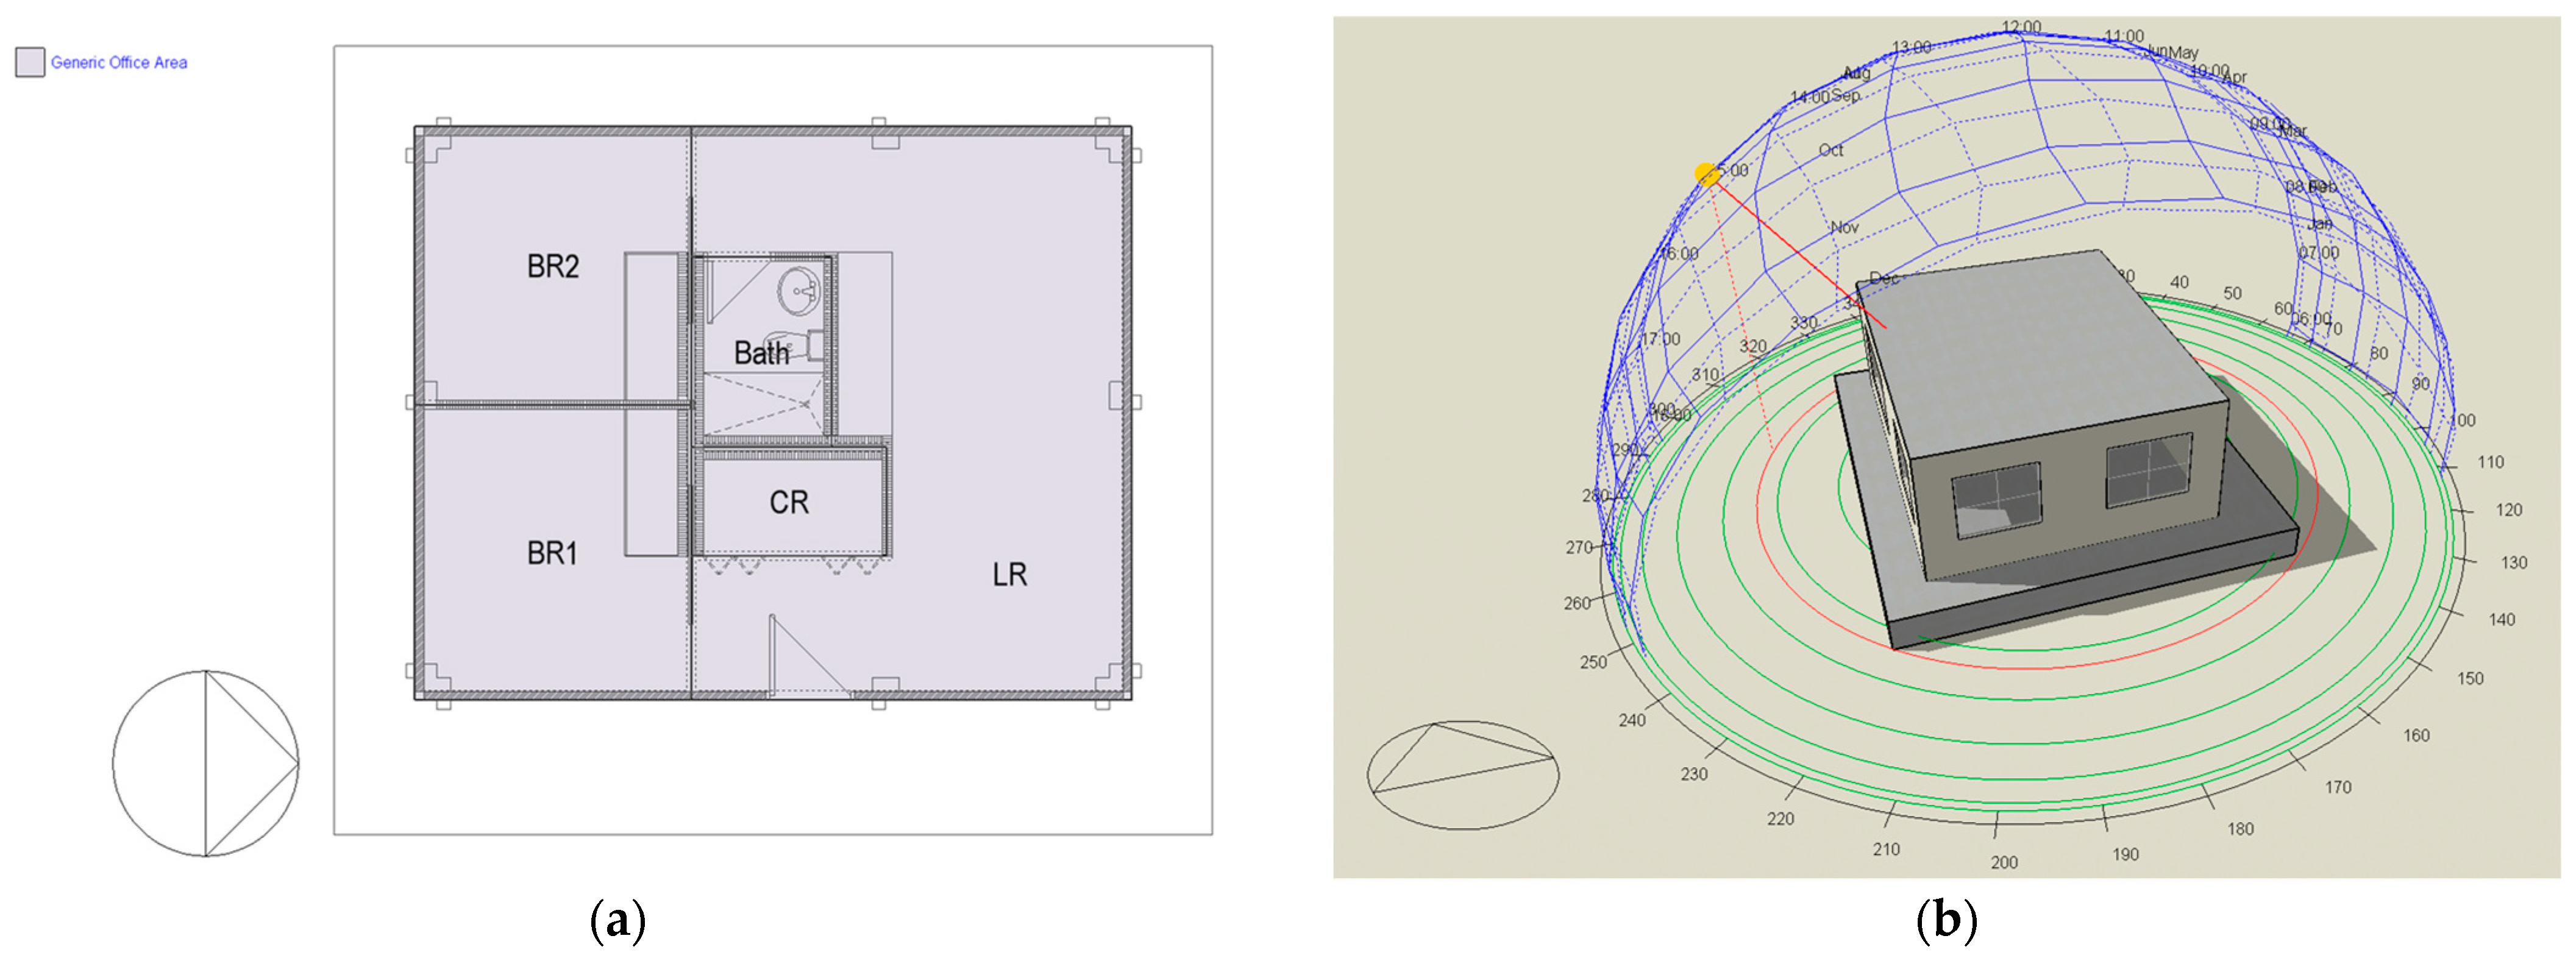
2.1. Description of the Case Study

A five-zone single-story building model was chosen as a case study in the tropical climate of Panama City, in Panama (i.e., Aw climate type in the Köppen classification). Figure 1a,b present the plan view and the axonometric view, respectively. In Figure 1a, BR1, BR2, CR, and LR refer to the Bedrooms 1 and 2, Control Room, and Living Room, respectively. The materials’ characteristics of the building envelope are shown in Table 2 and Table 3. Typical meteorological data was used for yearly simulations in Panama City, Panama, obtained from CLIMdata Solargis(R); a summary can be found in Table 4. Building Energy Simulations (BES) were carried out in the DesignBuilder software v6.1.6.011, from Designbuilder Software Limited in Gloucestershire, UK, for a period of 365 days for three different conditions:
  • Passive: Only natural ventilation through windows (either (1) open or (2) closed) was considered.
  • Active: (3) Windows closed and air conditioning equipment turned on are considered.

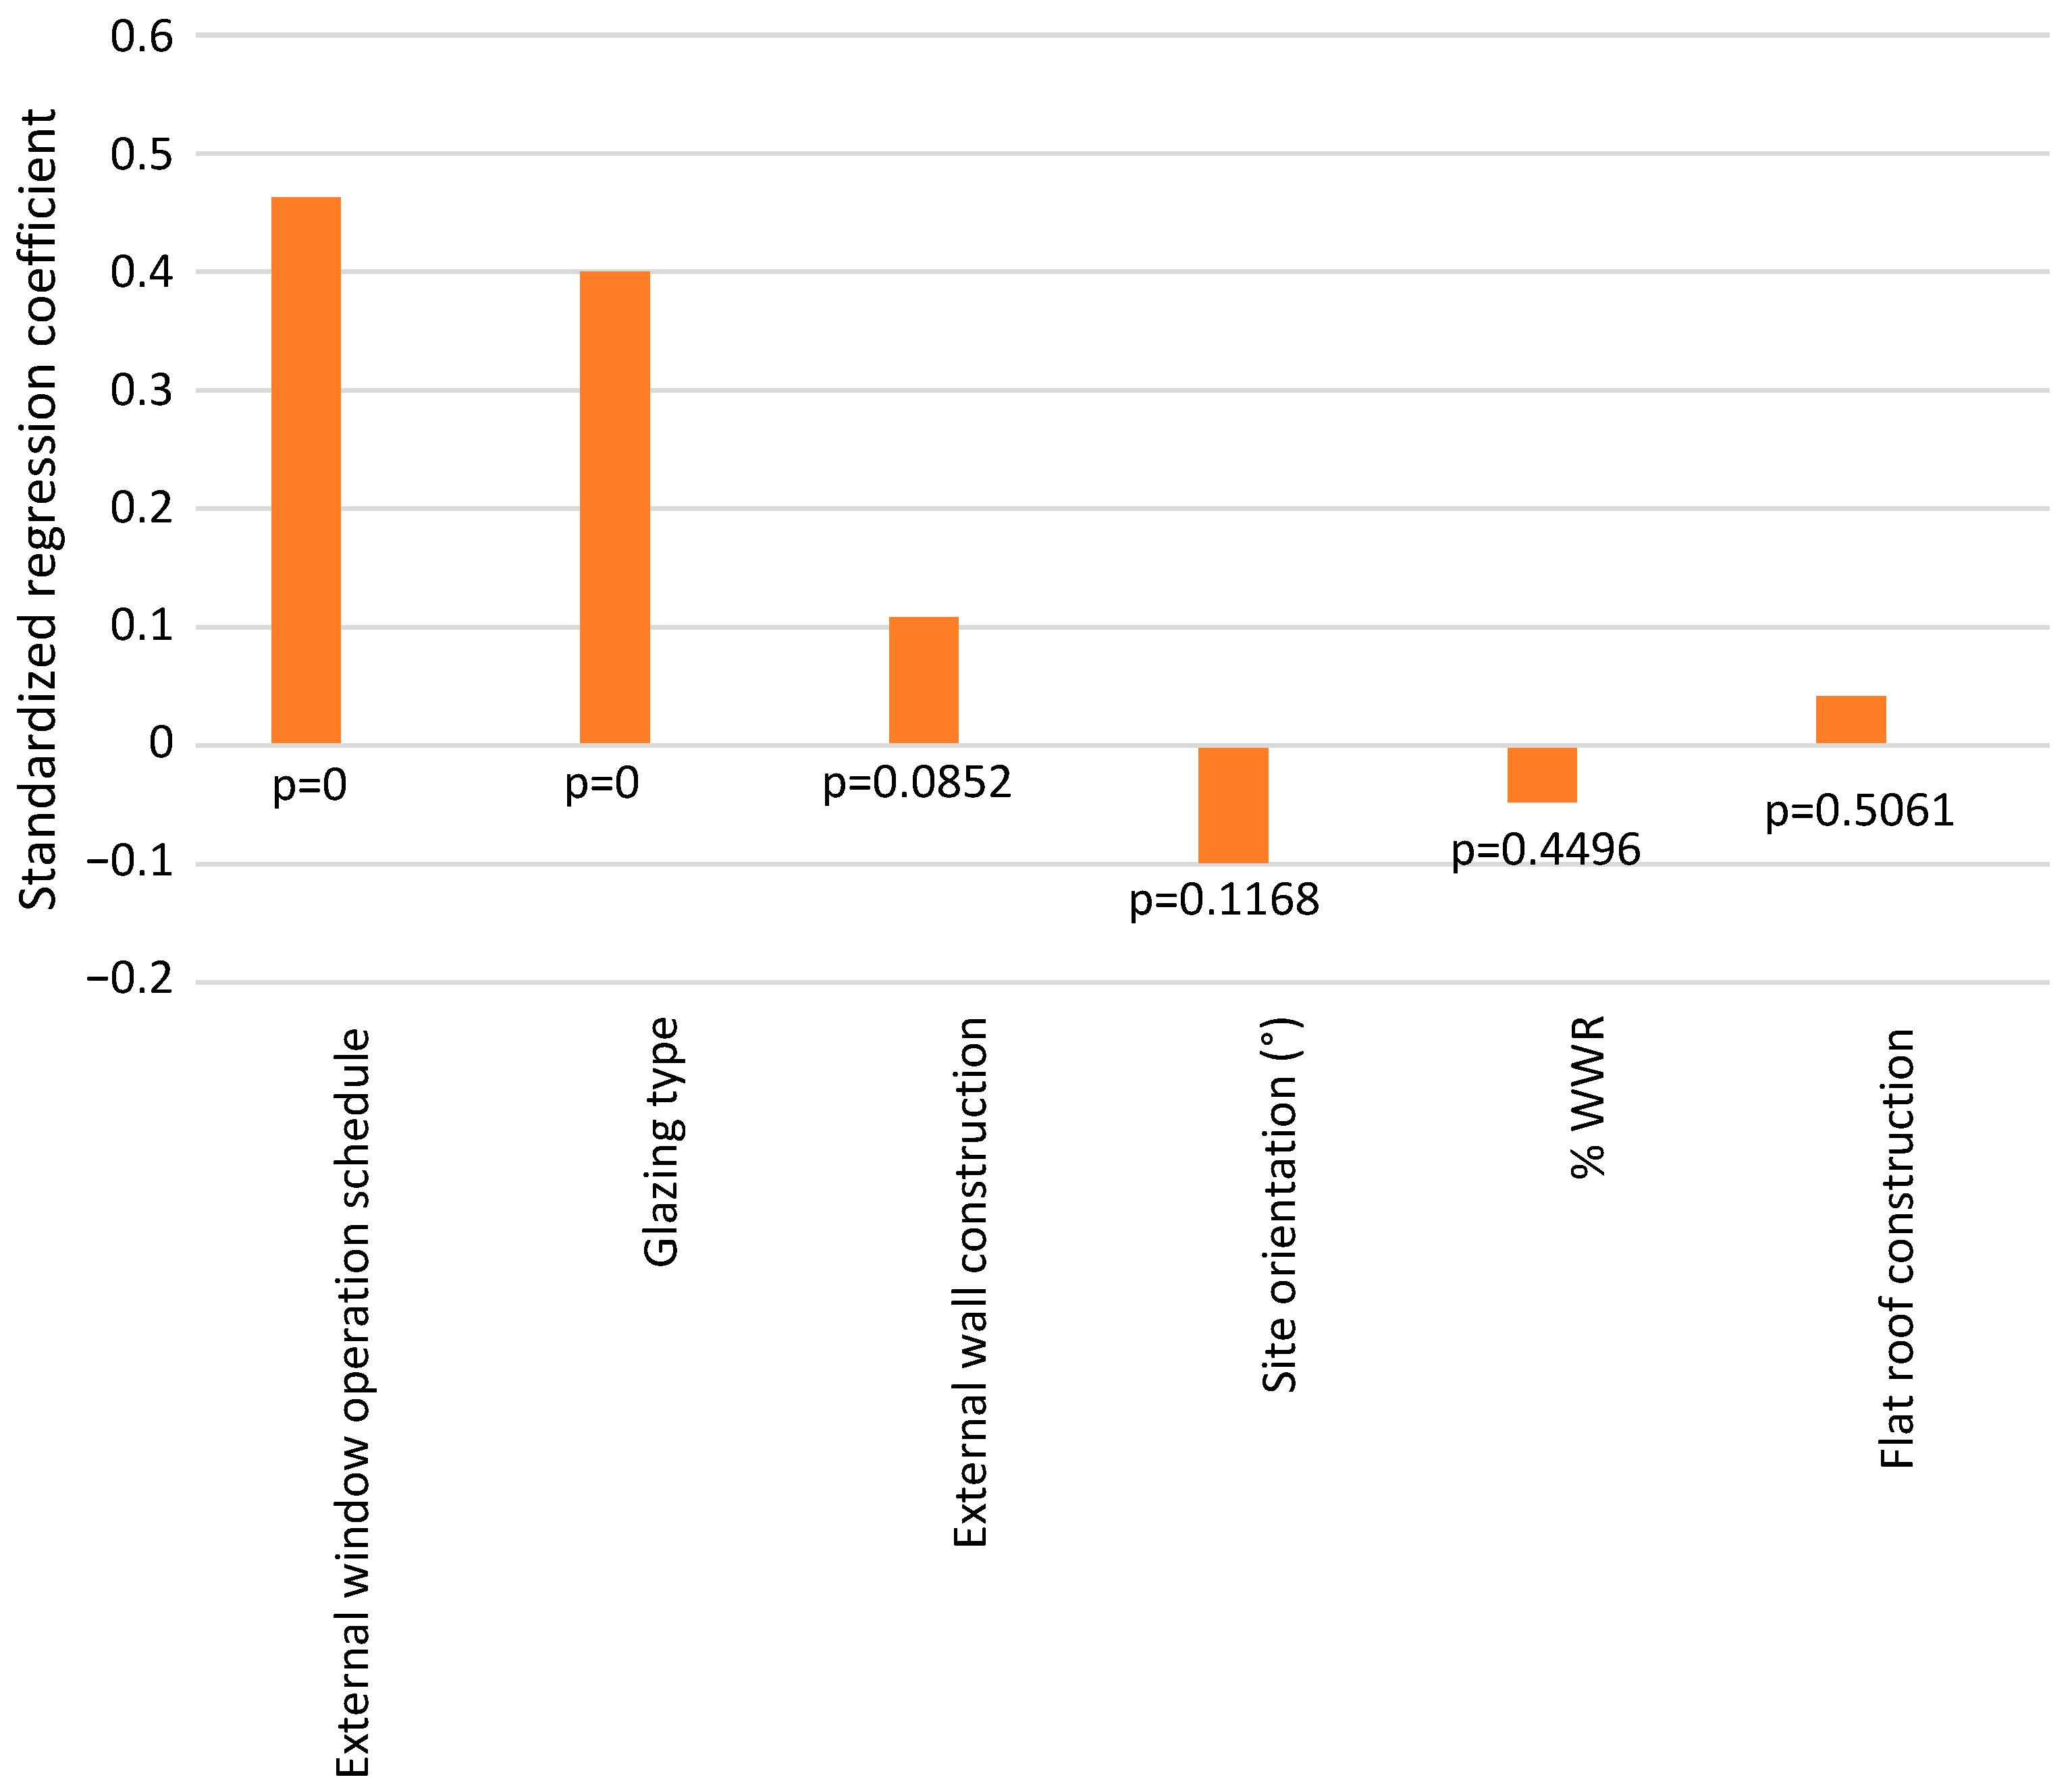
2.2. Parametric and Sensibility Analysis

The interior conditions of the building (and therefore occupant’s thermal sensation) depend on its physical parameters. The construction of walls, roofs, floors, and windows can contribute to the indoor air temperature variation. DesignBuilder’s tools, parametric analysis, and sensitivity analysis were applied to determine the most influential variables. Hours of discomfort at 80% acceptability were used according to the American Society of Heating & Refrigerating (ASHRAE) 55 standard. Once the parametric analysis was performed with variables from eight available categories, the sensitivity analysis was carried out with the most relevant variables. In Figure 2, the construction of walls, roofs, and glass are presented, in addition to the orientation of the building. As Figure 2 indicates, the hours of operation of windows and the type of window must be considered in the simplified model of the building.

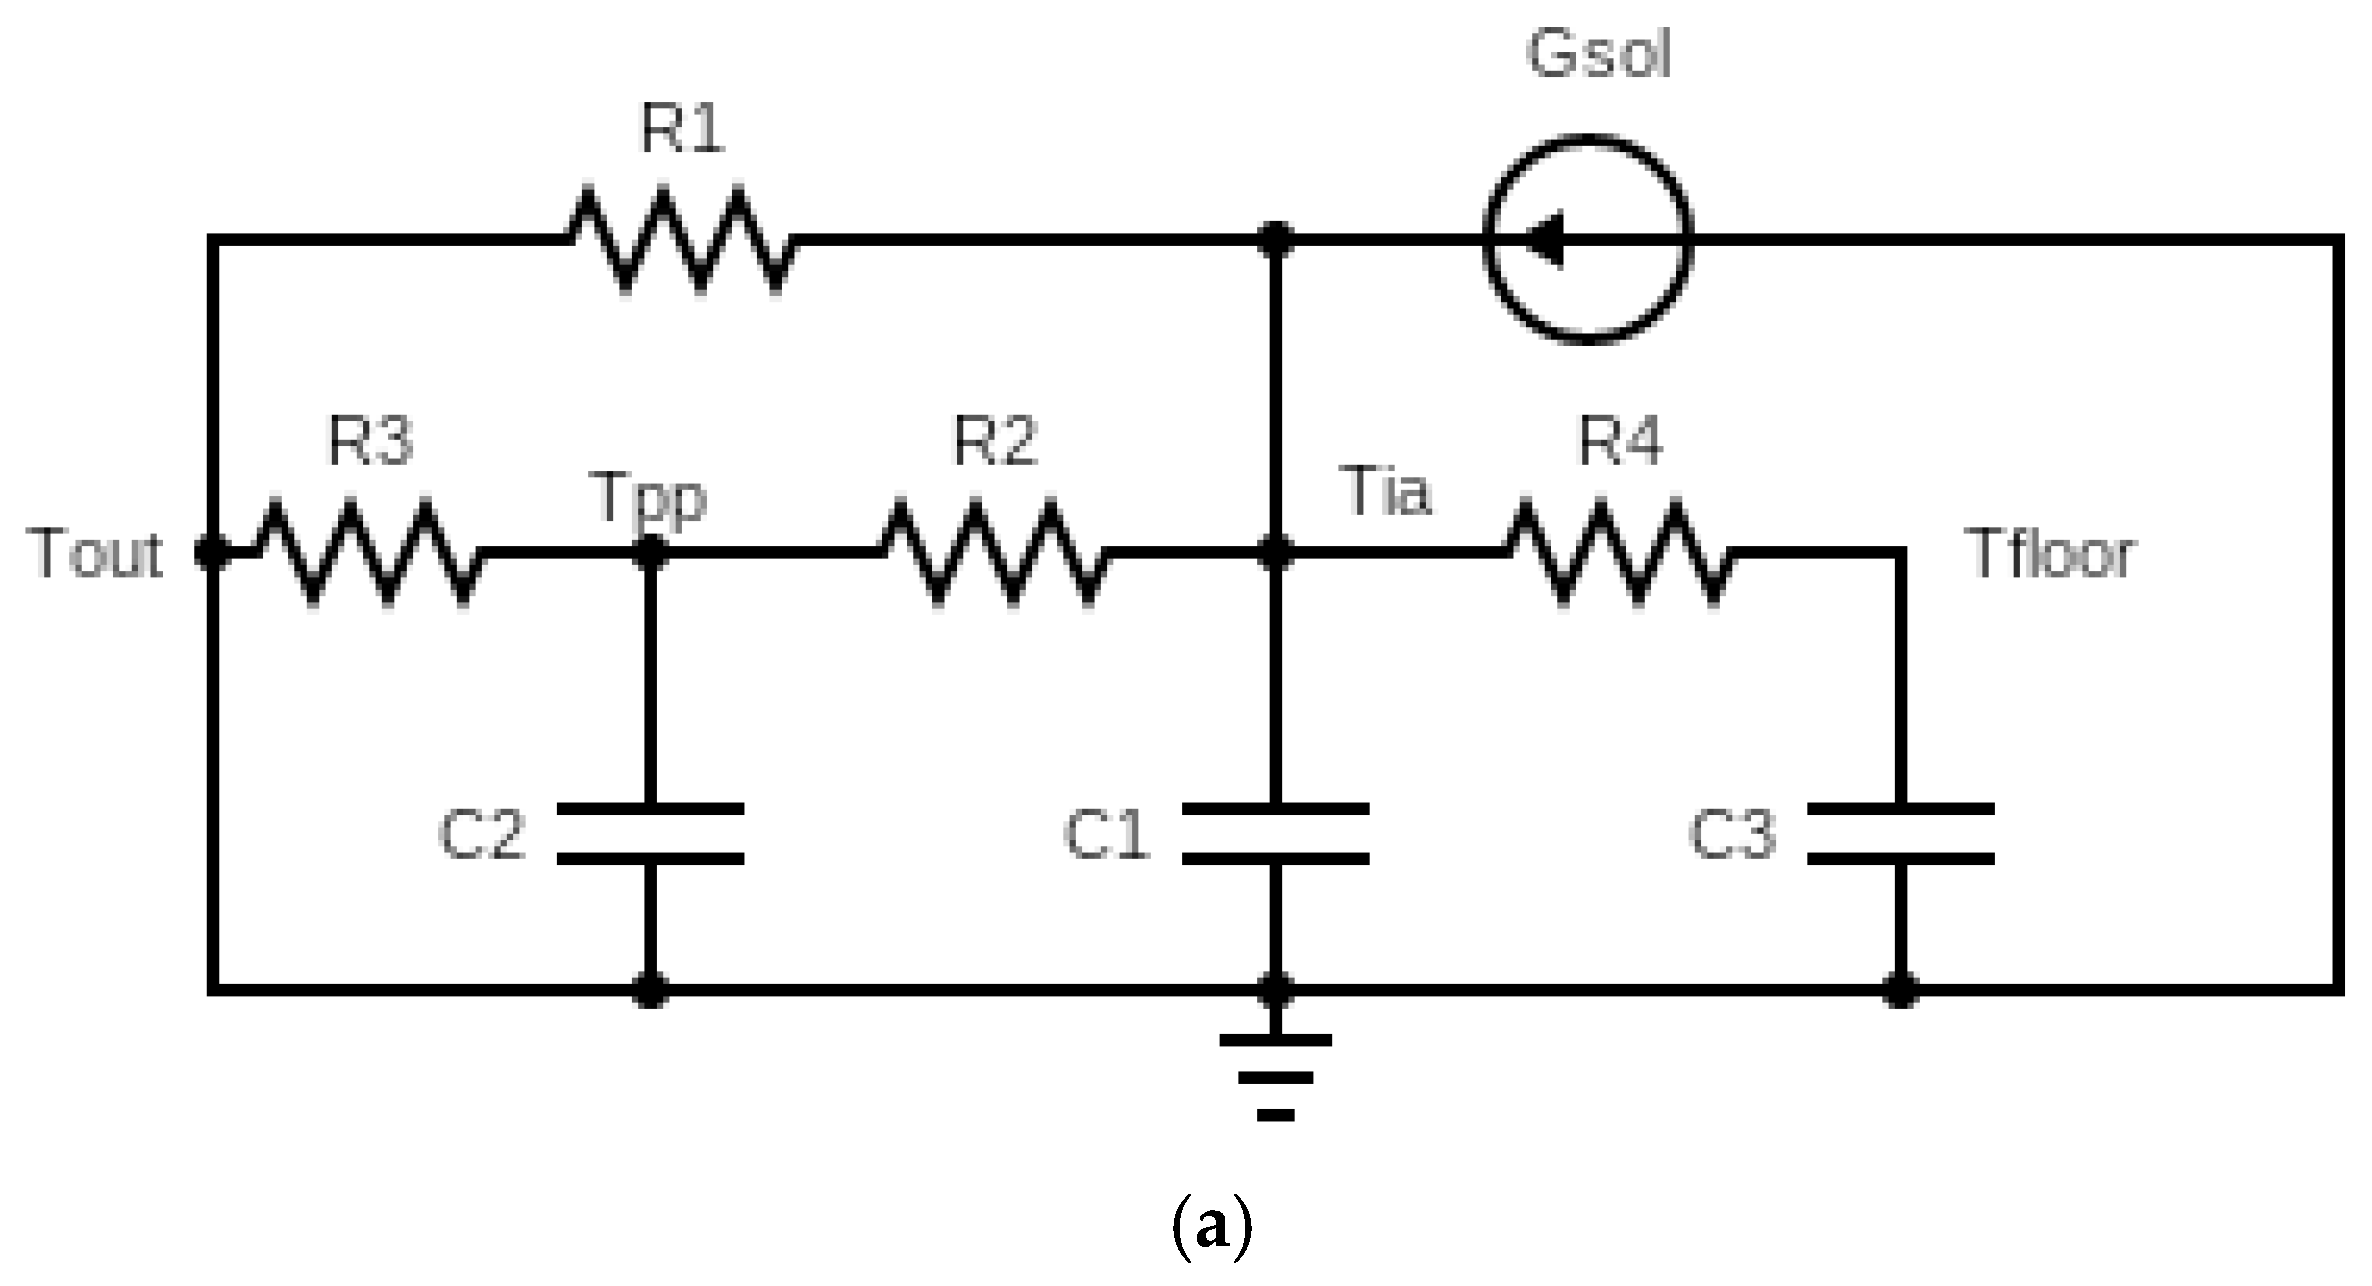
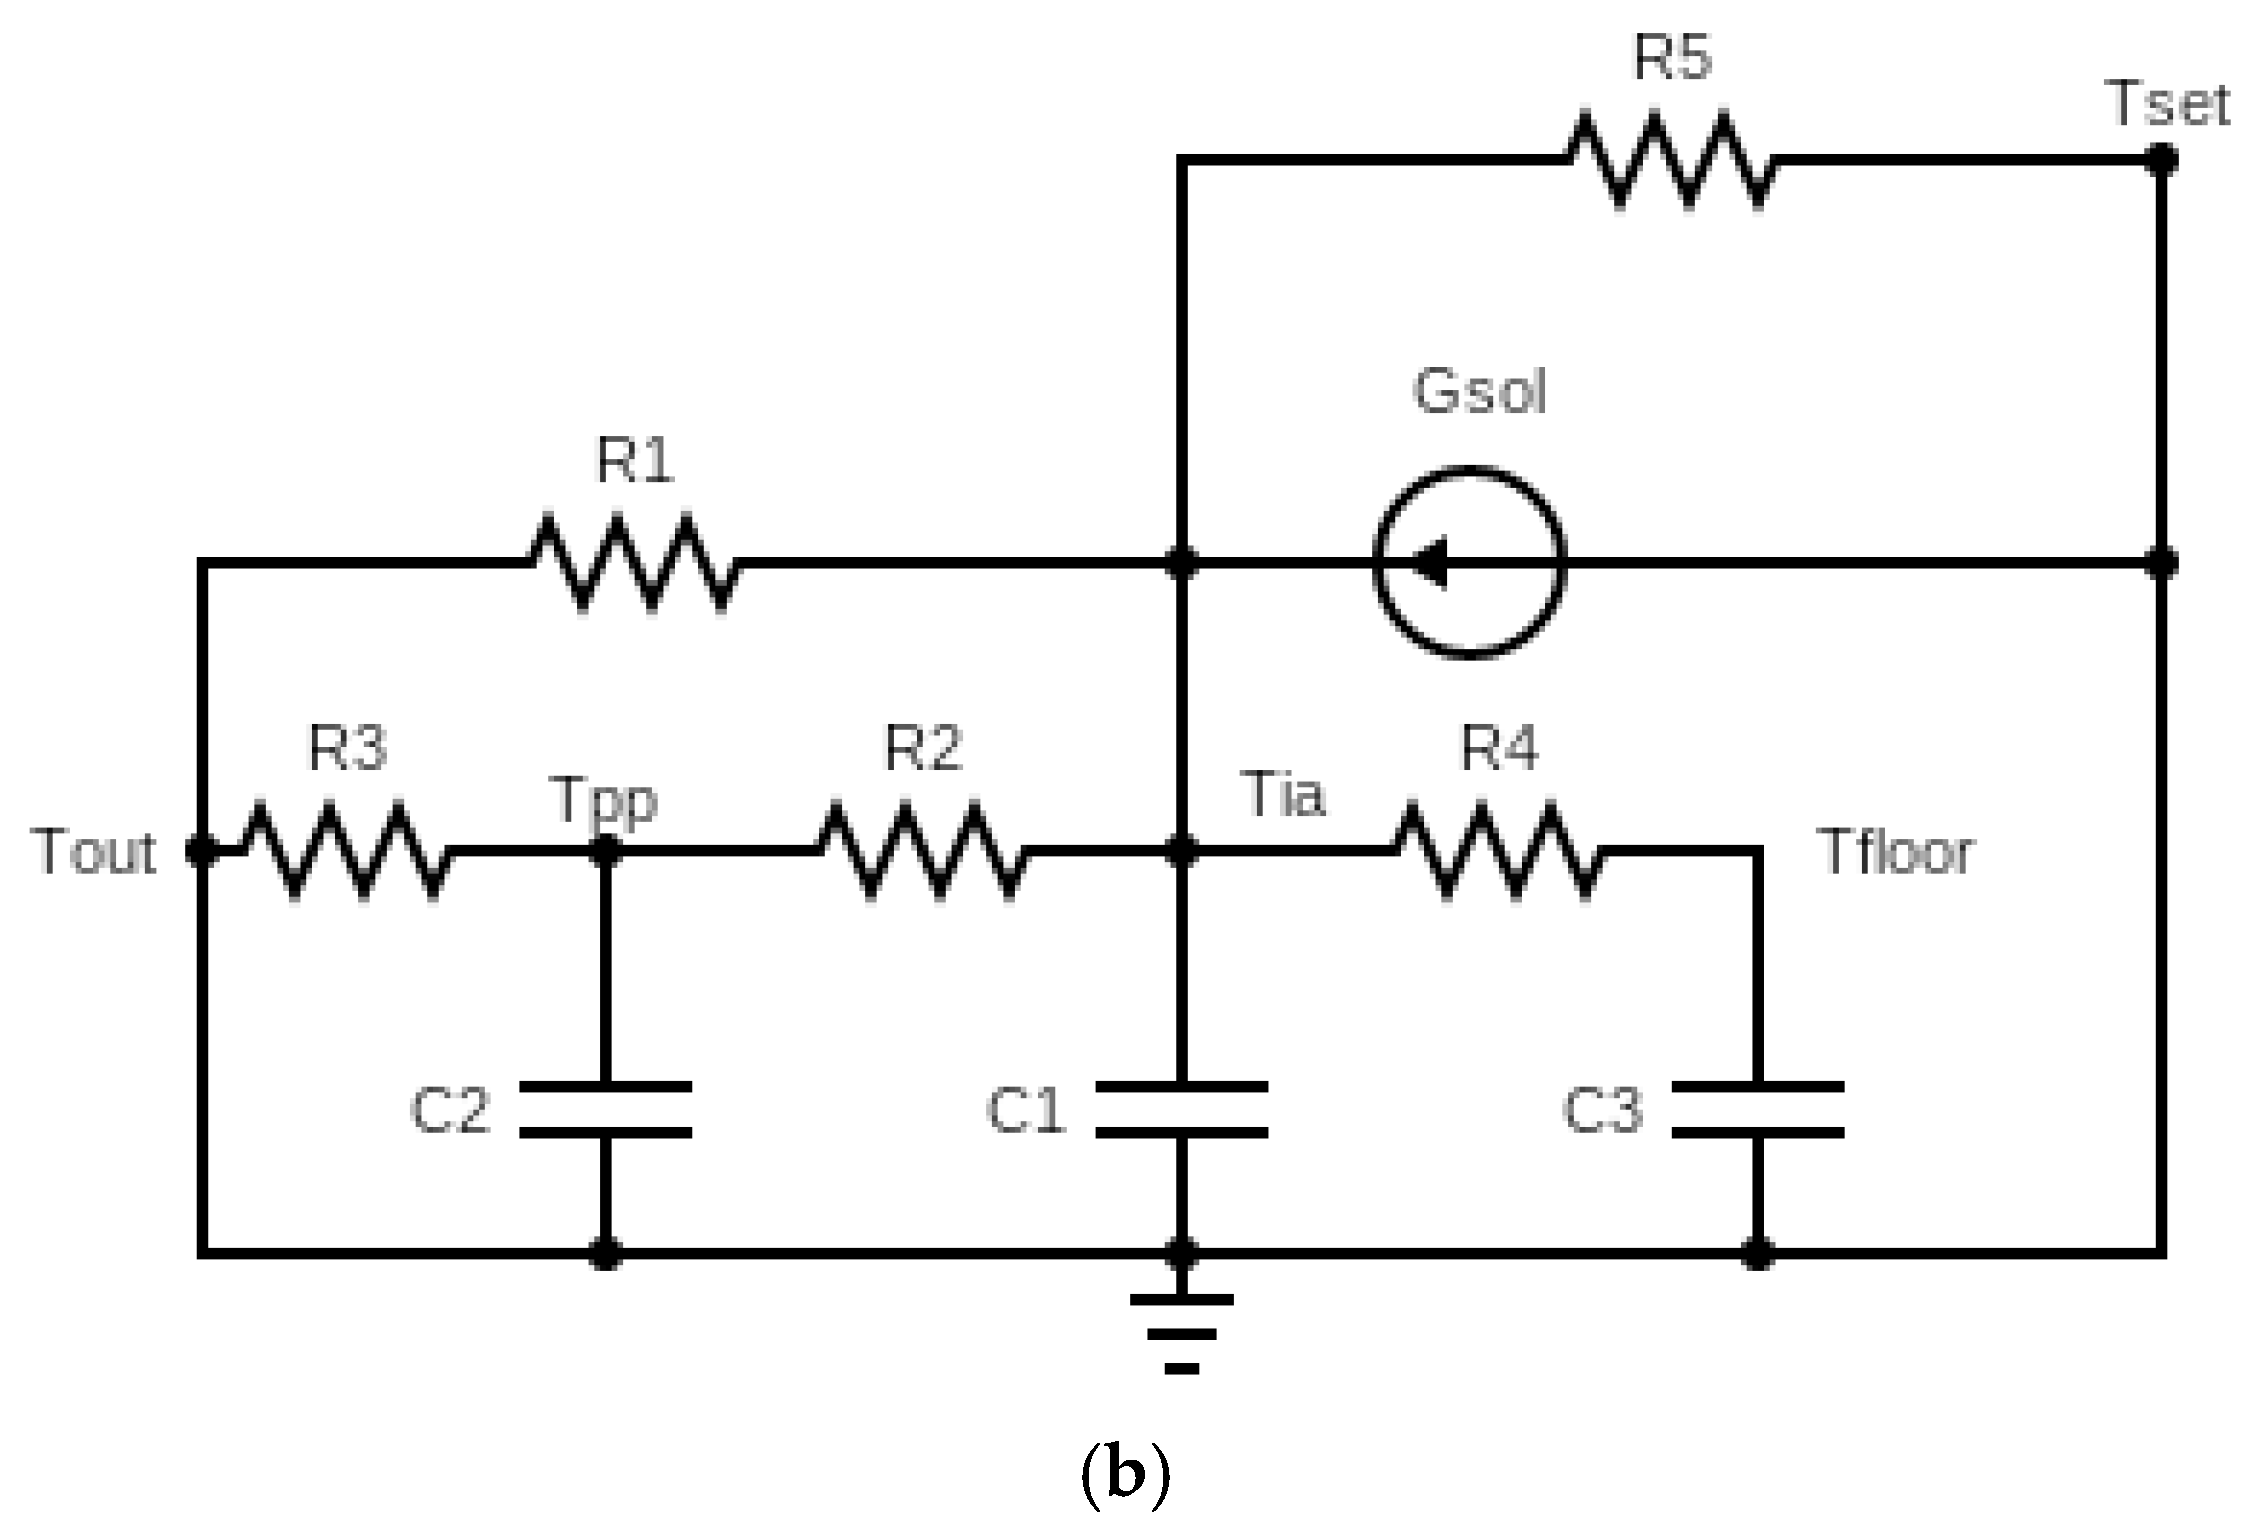
2.3. Simplified Thermal Model

Once the most important variables and the expected response of the indoor air temperature’s behavior are known, a simplified thermal model is formulated. The use of a resistance–capacitance (RC) system of 4R3C for passive mode and 5R3C for active mode is proposed. Where the passive mode only has natural ventilation, with windows opened at 50% or totally closed, and no mechanical ventilation is provided, on the contrary, the active case has all windows closed and only mechanical ventilation on. Both cases are graphically represented in Figure 3a,b.
These thermal models are expressed as equations in state space (Equations (1)–(4)) so that they can be compatible with optimization processes such as the use of the function greyest in Matlab. This function estimates a linear gray-box model, which uses Equations (1) and (2) as inputs, along with initial conditions, aiming to identify the best values for each parameter that minimizes the error (difference) between the predicted and simulated output. Equations (1) and (2) are for passive state space representation, and Equations (3) and (4) are for active state space representation.
[ T ˙ i a T ˙ p p T ˙ f l o o r ] = [ ( 1 C 1 ) ( 1 R 1 + 1 R 2 + 1 R 4 ) 1 C 1 R 2 1 C 1 R 4 1 C 2 R 2 ( 1 C 2 ) ( 1 R 2 + 1 R 3 ) 0 1 C 3 R 4 0 1 C 3 R 4 ] [ T i a T p p T f l o o r ] + [ 1 C 1 R 1 1 C 1 1 C 2 R 3 0 0 0 ] [ T o a G s o l ]
T i a = [ 1 0 0 ] [ T i a T p p T f l o o r ] + [ 0 0 ] [ T o a G s o l ]
[ T ˙ i a T ˙ p p T ˙ f l o o r ] = [ ( 1 C 1 ) ( 1 R 1 + 1 R 2 + 1 R 4 + 1 R 5 ) 1 C 1 R 2 1 C 1 R 4 1 C 2 R 2 ( 1 C 2 ) ( 1 R 2 + 1 R 3 ) 0 1 C 3 R 4 0 1 C 3 R 4 ] [ T i a T p p T f l o o r ] + [ 1 C 1 R 1 1 C 1 1 C 1 R 5 1 C 2 R 3 0 0 0 0 0 ] [ T o a G s o l T s e t ]
T i a = [ 1 0 0 ] [ T i a T p p T f l o o r ] + [ 0 0 0 ] [ T o a G s o l T s e t ]
where R 1 through R 5 represents the thermal resistance values for windows (R1), external ceilings and walls ( R 2 ), internal ceilings and walls ( R 3 ), floors ( R 4 ), and air conditioning ( R 5 ). Elements that can hold heat are represented as capacitances such as air ( C 1 ), ceilings and walls ( C 2 ), and floors ( C 3 ). All values noted as “ T ” represent mean air temperature and are identified by the subscripts i a , p p , f l o o r , s e t , and o a , that refer to indoor air, external walls, floor, setpoint for air conditioner, and outdoor air, respectively. Lastly, G s o l represents the Windows Total Transmitted Solar Radiation Rate.

2.4. Parametric Optimization

To approximate the system response to DesignBuilder’s indoor temperature results, it was necessary to optimize resistance and capacitance parameters for each case presented. For the passive case, the simulated data was divided into three sections of four months each: January to April, May to August, and September to December and each set was used as training data to identify the best resistance and capacitance values. Once the variants of combinations of possible resistances and capacitances were identified, the percentage of goodness of “Fit” was calculated for the complete simulated data (January to December) as validation data. Table 5 shows in green color the two sets of resistances and capacitances selected as the results based on higher fit to all the data.
In Table 6, the results of training and validation of the RC model are shown. R 1 (Windows) was recalculated for the passive case with windows open at 50%, keeping all other values of resistances and capacitances as determined in the previous table.
For the active case simulation, a period of action of the air conditioning of approximately two hours was considered, using the zone of the trend where temperature stabilization is present, just after turning on the air conditioning. Table 7 shows the optimization process of the system. In this case, the parameters obtained in the passive case with closed windows were used as fixed values and the resistance R 5 (representing air conditioning) was the value being calibrated.
Finally, the set of parameters selected was determined based on higher fit to the data and is summarized in Table 8.

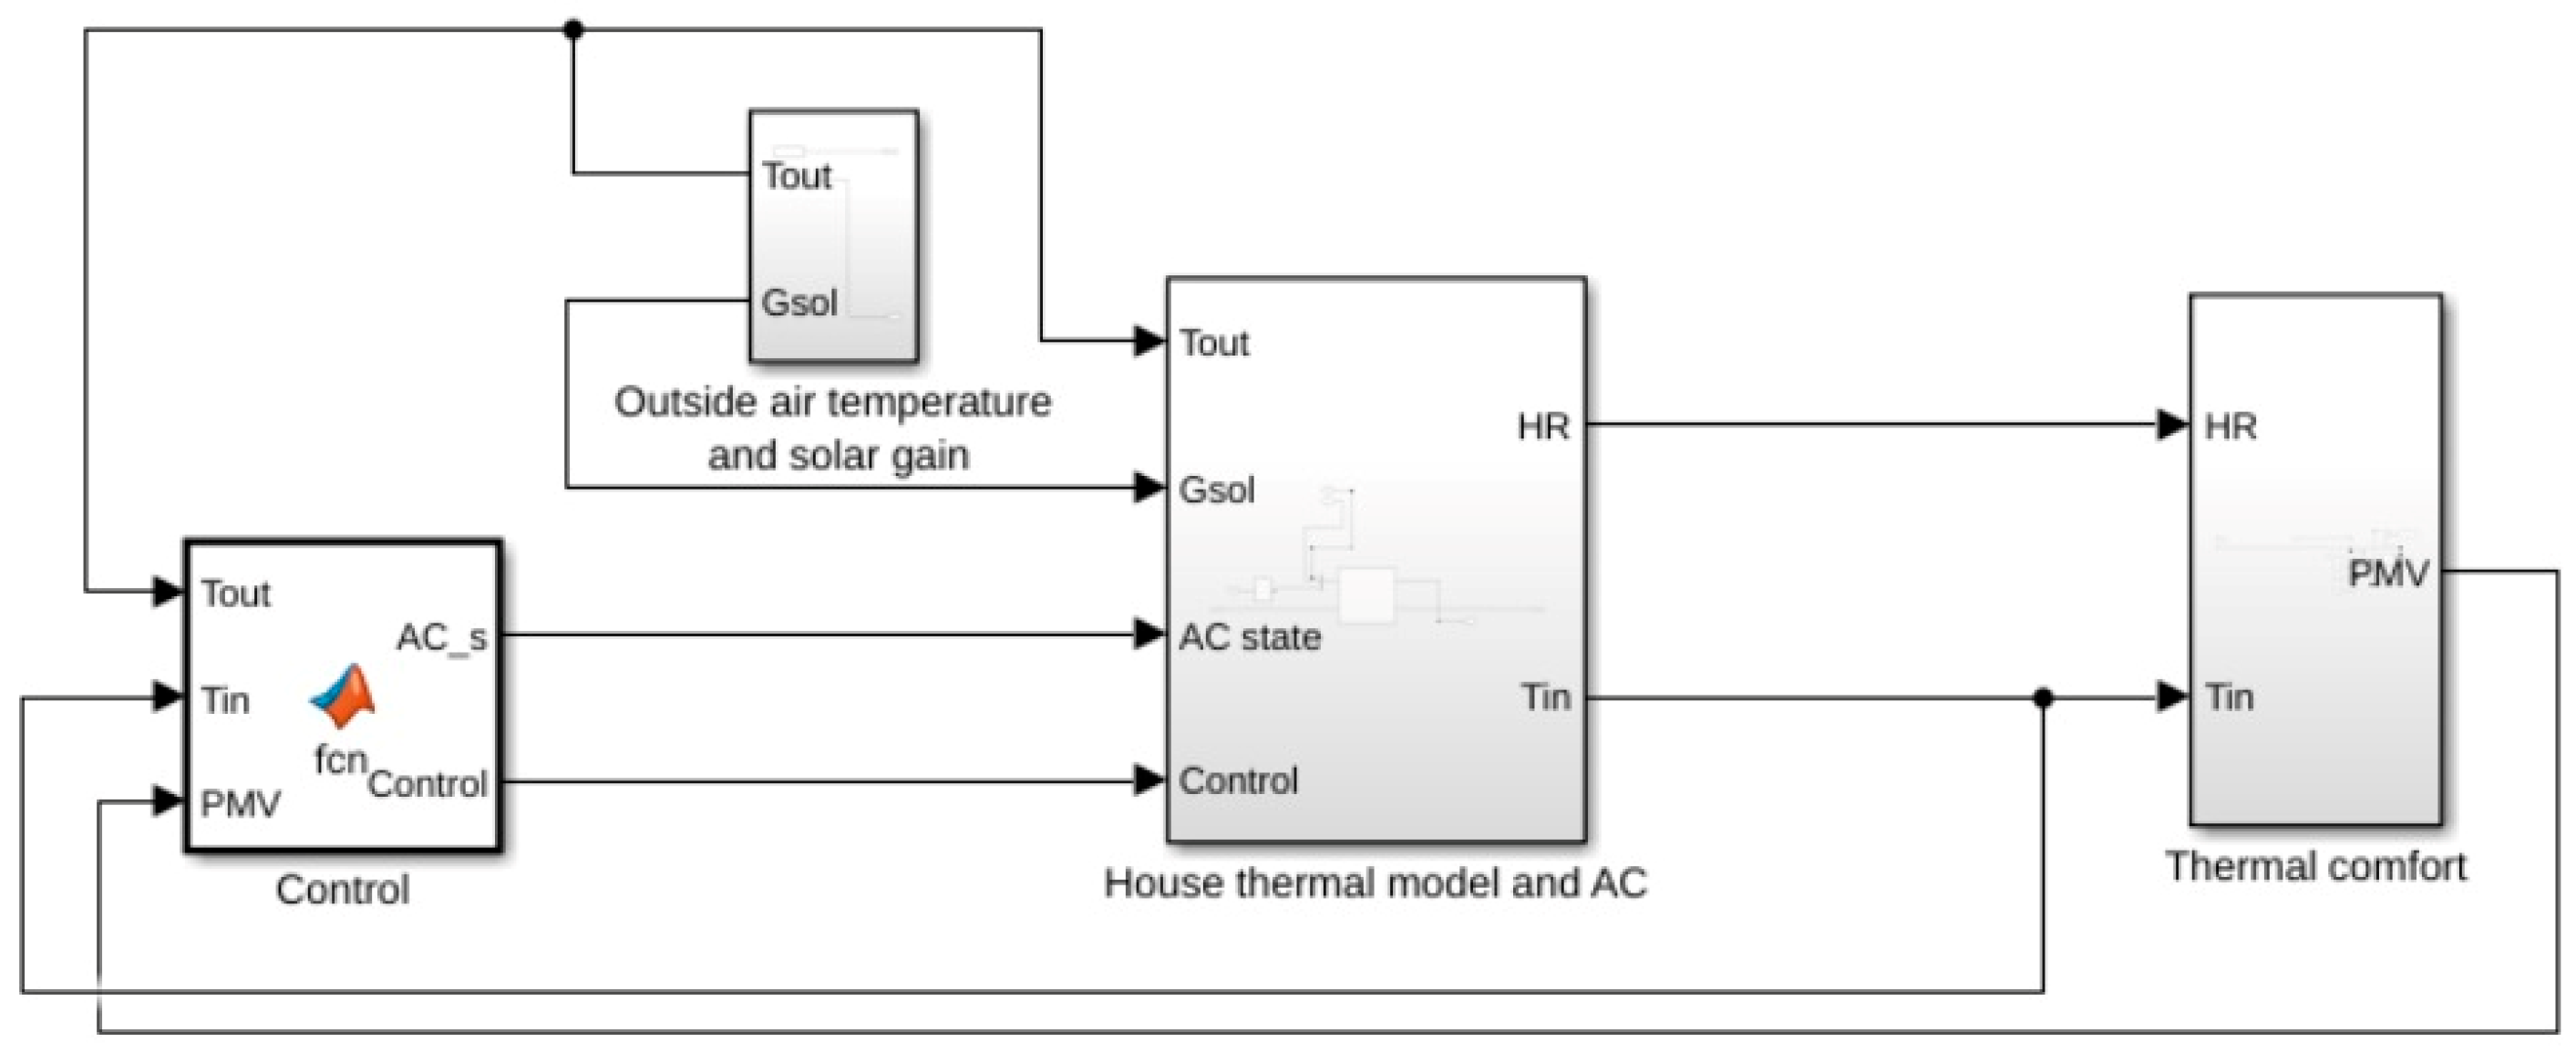
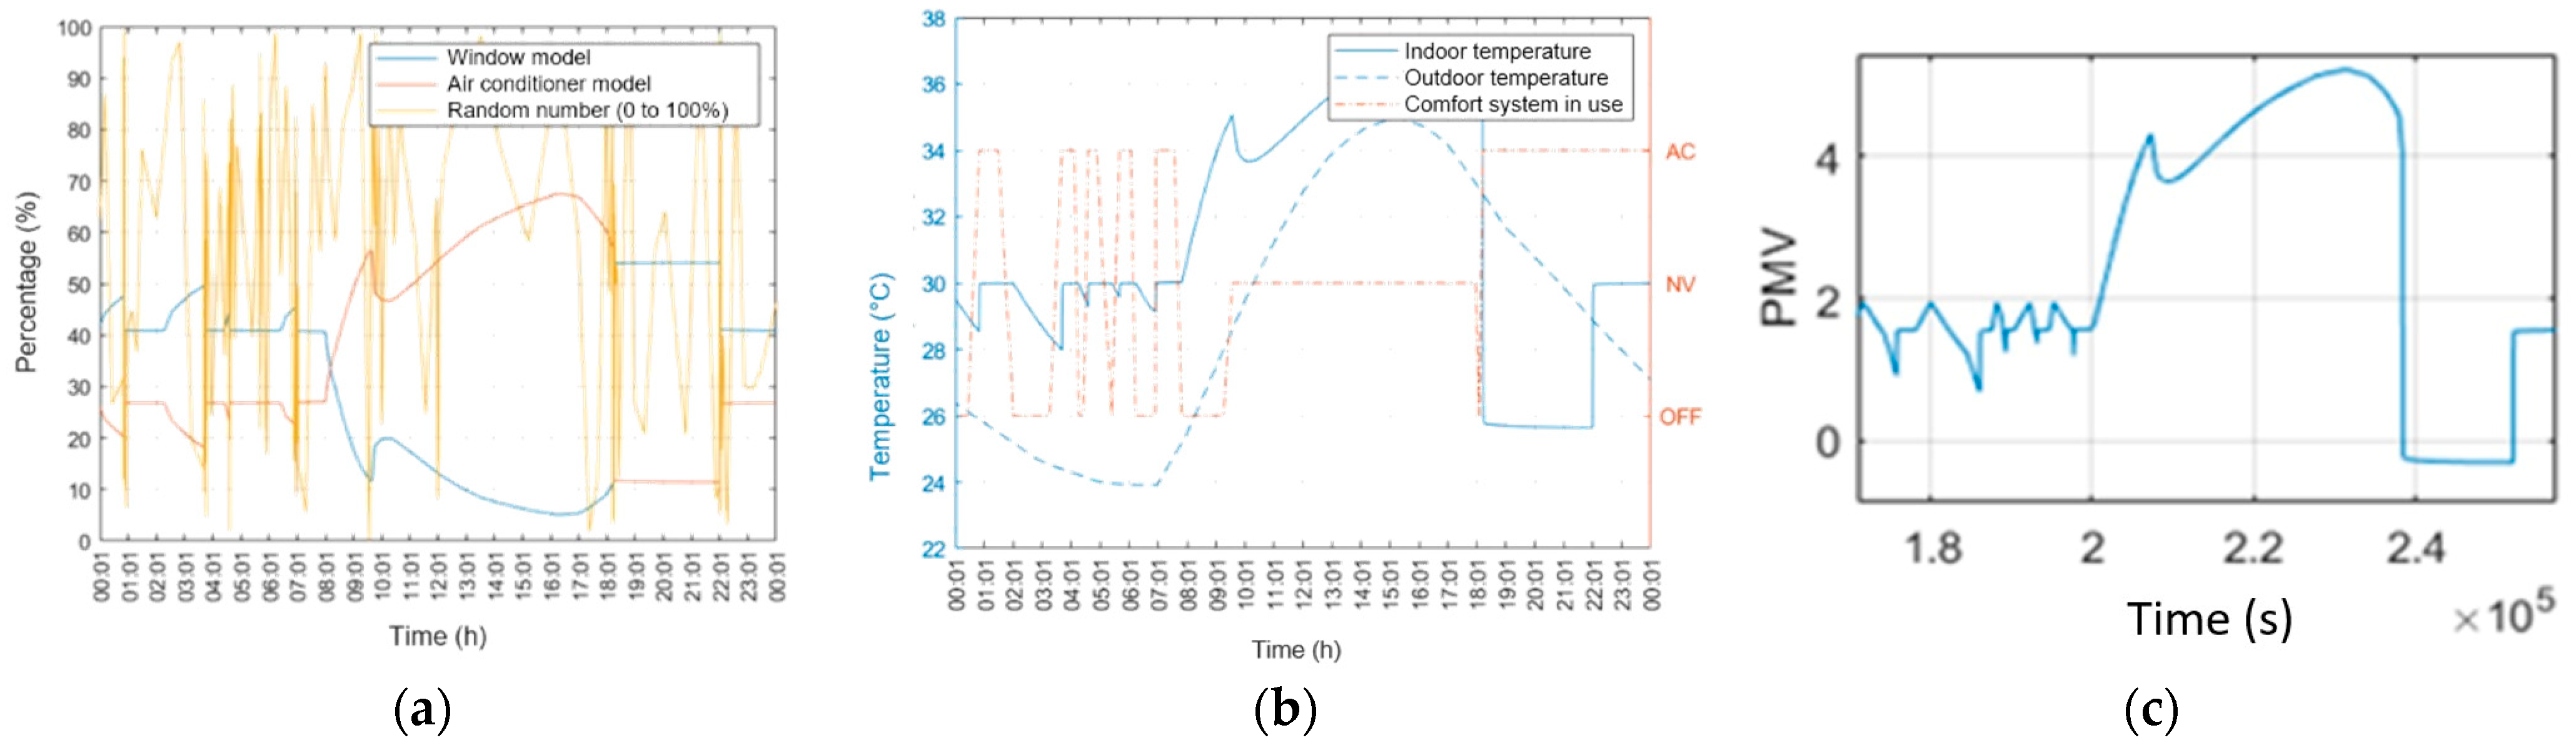
2.5. Simulation Case Selection and Controller Implementation

To reflect the decision making of the occupants of a building, four possible scenarios are considered:
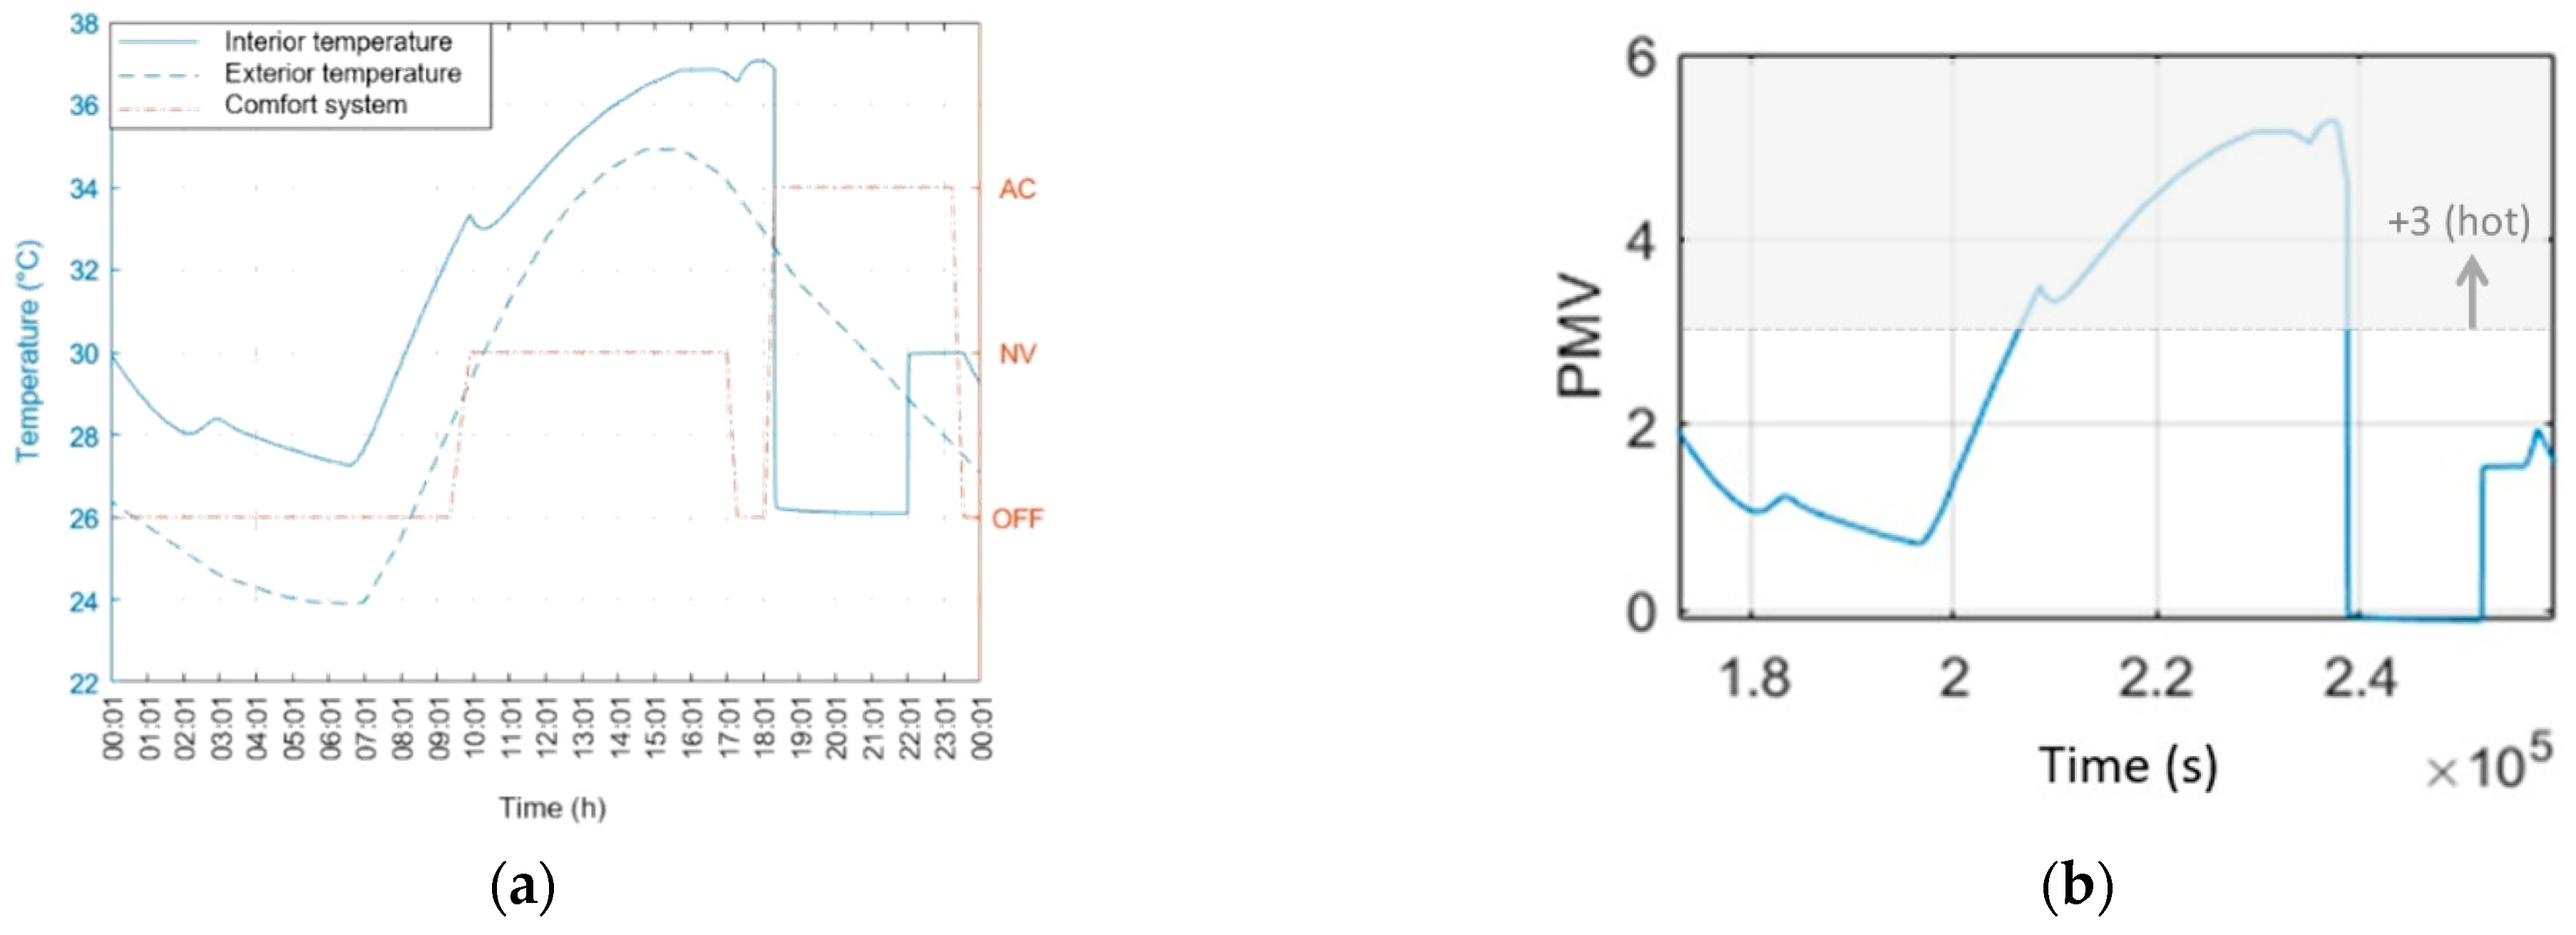
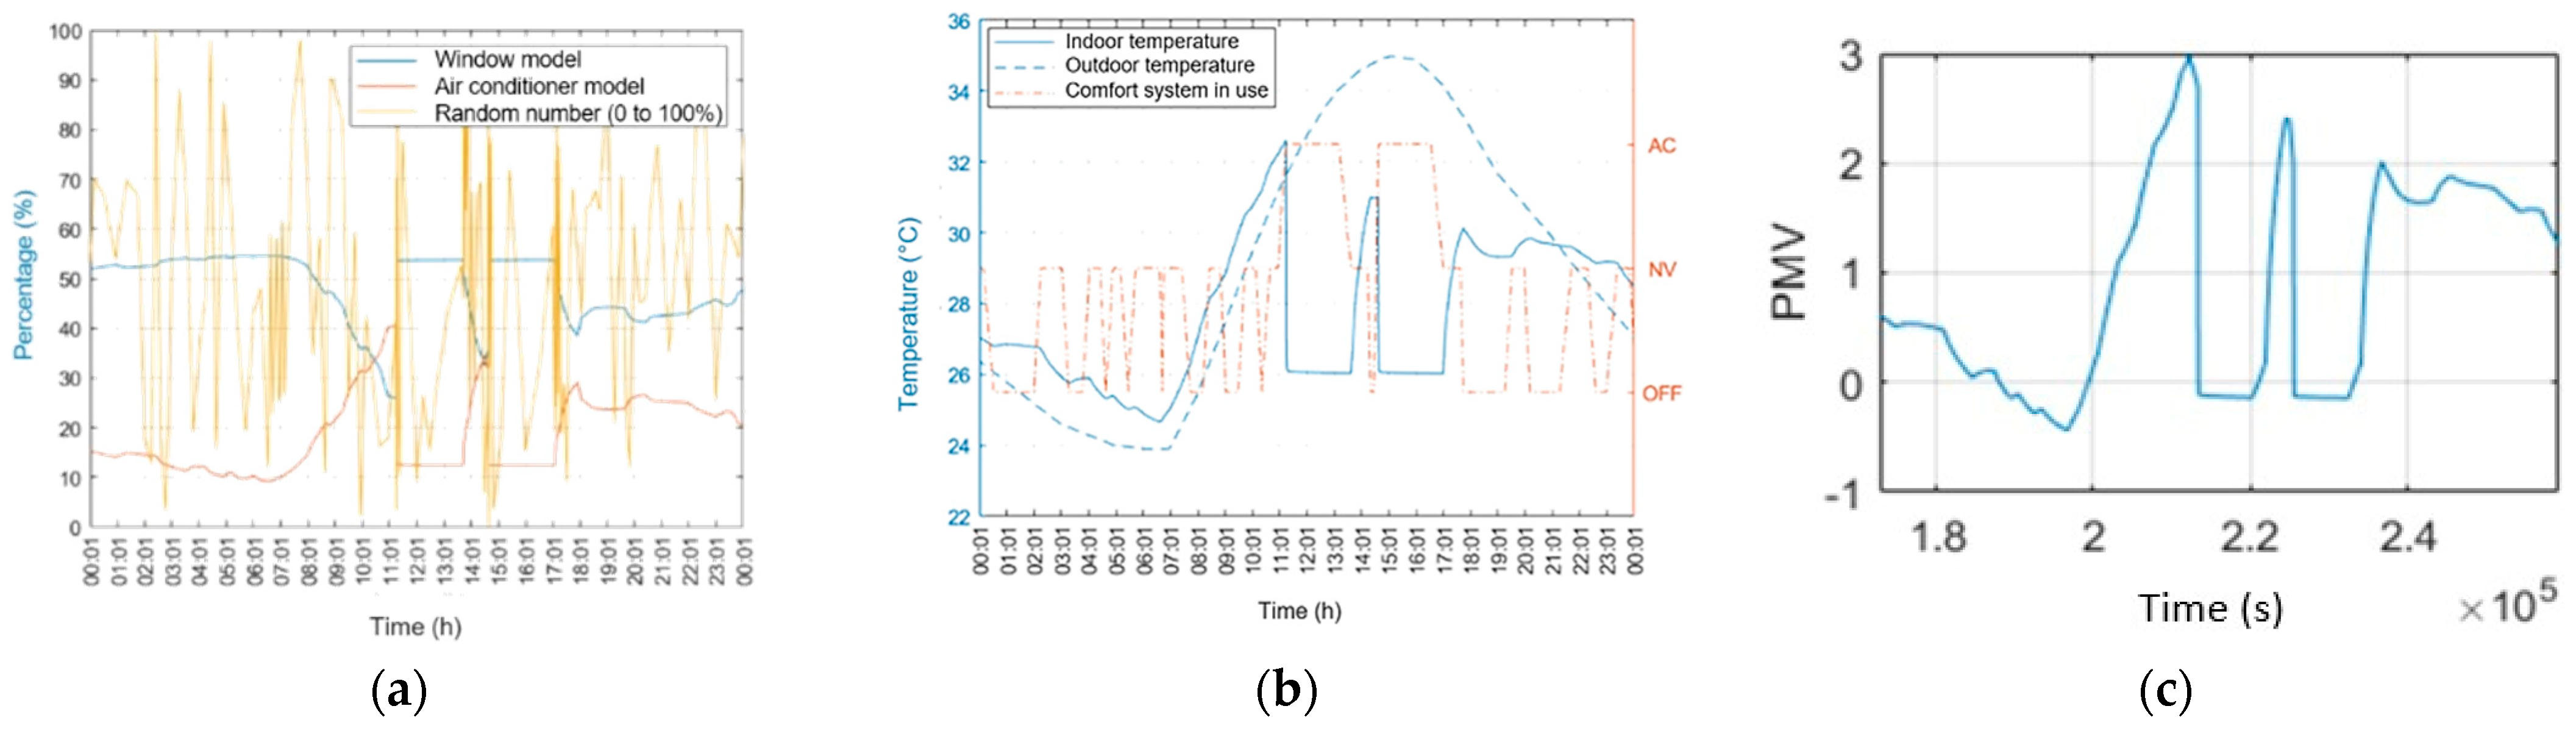
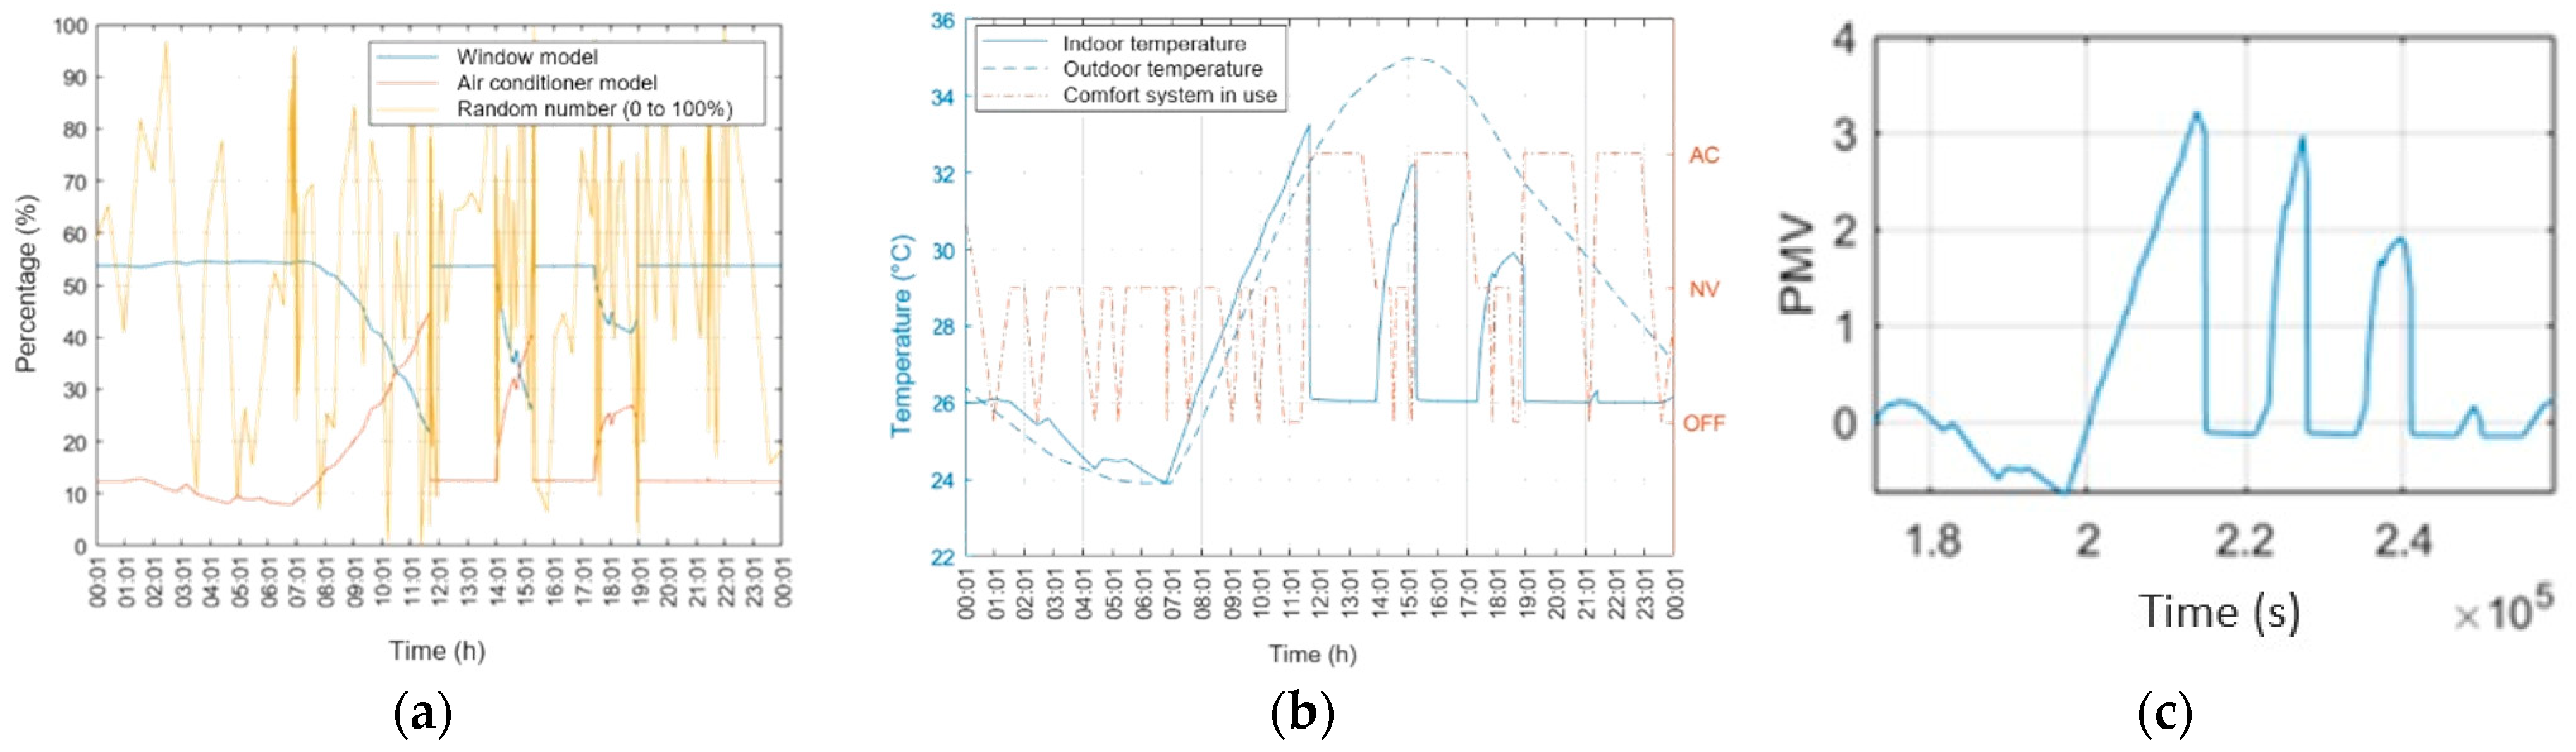
  • Probabilistic scenario, developed by Kim et al. [44] in a study carried out in Australia, where the probability of executing an action with respect to a random number is evaluated, using Equations (5) and (6):
    P ( O p e n   W i n d o w s ) = 100 ( 100 1 + e x p ( 0.33 T 6.58 ) + 100 1 + e x p ( 0.17 T + 5.13 ) )
    P ( O n   A A ) = ( 100 1 + e x p ( 0.24 T 8.20 ) + )
    where P represents the probability, T is the indoor temperature.
  • Deterministic scenario: It considers a window opening and air conditioning hours obtained from a survey conducted by De León [45] in 33 Panamanian residences.
  • Combined model #1: Deterministic and probabilistic scenarios are integrated, giving priority to the probabilistic method.
  • Combined model #2: Deterministic and probabilistic scenarios are integrated, giving priority to the deterministic method.
These scenarios determine the actions of the controller. Figure 4 shows the system plant model used. Finally, different values of the proportional and integrative components of the PI (proportional and integrative) controller were determined depending on the scenario used, the values obtained are shown in Table 9.
The controller presented is intended to be used with the occupant decision scenarios, giving priority to the occupant decision prediction, therefore the controller will turn the AC on or off as indicated by the selected scenario and will modify the set point for the air conditioning unit only when the occupant has previously decided to turn it on. The controller will modify said set point in a range from 22 °C to 26 °C (this range was selected based on typical Panamanian occupant AC set point ranges observed in [45] to keep the PMV in a 0 range). This is attained using the feedback loop between the calculated PMV value and the controller. The controller performs a revision of the windows’ state (open or closed) every 30 min and the AC’s state every two hours.
It is relevant to mention that relative humidity, an input for the PMV calculation, is determined by the controller from the value with more incidences according to the year simulations for opened windows (70%), closed windows (70%), or AC on (60%).

3. Results

A thermal comfort control system was built with the previously proposed criteria and methodology. It was validated through simulations in Simulink for a period of 12 months. Comfort variables such as indoor air temperature, predicted mean vote, and energy consumption were used for the analysis. Simulations were performed under the four different control scenarios listed before to qualify the effect of occupant preferences.
Figure 5 shows the graphs obtained using a deterministic control scenario: inside and outside temperature and the ventilation system used (Figure 5a). A temperature could be found hovering between 26 °C and 37 °C, staying at 26 ° C with the air conditioning on and between 27 °C and 37 °C with the windows open between 9:00 a.m. and 5:00 p.m. The PMV value varied between +5 and 0 when the windows were kept open, however, during the use of the air conditioning it remained at 0 (Figure 5b). Note here that, although the PMV index varies from −3 to +3, Figure 6b shows that the PMV value reached values beyond +3, since the PMV mathematical model was used in the numerical solution. Thus, this should be interpreted as +3 (hot).
For the simulation carried out by applying the probability method, a relationship between the figures presented is shown, Figure 6a shows the response of the probability equations (AC and windows), based on that response, Figure 6c presents the response of the controller maintaining the temperature between 26 °C and 33 °C and during the activation of the AC at 26 °C. The PMV values were kept between −0.5 and 3, with the PMV during air conditioning on at 0.
Similarly, Figure 7a uses the probability as the decision-making tool for the calculation of the displayed internal temperature using combined model #1. In Figure 7c, a temperature range between 24 °C and 33 °C was obtained and during the period of AC ignition it was 26 °C. PMV values between −1 and 3 were obtained, remaining at 0 during the turning on of the air conditioning.
For combined model #2, the control logic is based on the probability obtained in Figure 8a with which the internal temperature shown in Figure 8b is calculated, obtaining a temperature range between 26 °C and 36 °C and during the AC-on period at 26 °C. The PMV value obtained ranges between 0 and 6, being the PMV obtained during the air conditioning start-up equal to 0.
The scenarios were also evaluated according to the annual electric consumption in kWh as shown in Table 10. The probabilistic and deterministic methods show a lower consumption (2185.15 kWh and 1774.74 kWh, respectively) compared to the combined models #1 and #2 (3446.8 kWh and 2330.6 kWh).

4. Discussion

The use of the PMV comfort indicator of the ASHRAE 55 standard was justified by its wide use in other comfort indicators that demonstrates its versatility and application as required, for example, having Fangers PMV, an expectancy factor could be applied to determine the ePMV, applicable in naturally ventilated buildings [18]. It was verified through the DesignBuilder model that it is possible to evaluate the effect of interior thermal conditions in buildings on the occupants of the building.
The most relevant variables of the model were identified by parametric analysis and sensitivity analysis.
It was possible to represent the interior conditions of the building of the study case with a gray-box-type model, combining the major advantages from white- and black-box methods, obtaining percentages of “goodness of fit” of 87.78%, 81.27%, and 87.99% for air conditioning on, open windows, and closed windows, respectively.
It was possible to integrate a controller that considered the PMV in conjunction with occupant decision-making models in four different scenarios and electrical consumption was implemented together with thermal comfort to select the most appropriate ones.
Based on the ideal PMV range (−0.5 to 0.5), the methods that are based around probability, probabilistic method and combined model #1, have the best results in keeping a lower PMV, however, considering the annual consumption when selecting the best model, the probabilistic and deterministic models have the lower consumption records. Therefore, when evaluating the best performance overall, the probabilistic method is the scenario that keeps an acceptable PMV range and a lower consumption.
The formulation of the controller and modeling for the case study follows structure and procedures prevalent in the present day’s research, as can be attested in reviews such as [46].
It is important to note that adding environmental and personal factors could modify the results shown, a continuous measure of occupants is out of the scope of this project but should be the topic of future research. Also, in order to obtain more conclusive results, a vaster population is needed to be added to the data.

5. Conclusions

It was possible to develop an occupant model capable of anticipating or mimicking occupant decision making. Four different models were proposed for this purpose: probabilistic (based on equations extracted from research in countries with climates similar but not the same as Panama’s), deterministic (according to the results of surveys conducted in Panama, through the creation of window and air conditioning use schedules), combined #1 (application of the probability method and modifications in certain periods based on survey responses), and combined #2 (application of window and air conditioning use schedules and probability at times outside the schedule).
A controller was conceptualized that works in conjunction with the selected occupant model, of type PI, with constant values changing according to the occupant model. Based on the results, the best choice of controller-occupant model turns out to be the probability-based model, as it contains low power consumption and relatively low PMV levels. The combined method #1 proposes a system with acceptable PMV levels but a very high consumption. The hourly method represents an average consumption but a very high PMV level. Finally, the combined method #2 presented the lowest performance among all methods, obtaining very high consumption and PMV levels.
However, the present work also has certain limitations: currently, the control system and thermal model depend on weather forecasts that may not always be accurate, fixed met, clo, and air velocity values are considered, which are generally changeable over time. The values used as input for solar radiation are obtained from simulations in DesignBuilder. The PMV comfort index is usually applied for steady-state indoor conditions. However, some authors argue that air conditioning applied to residences is incompatible with these conditions. In addition, probability-based methods should be based on data from Panama.
The above limitations give rise to new works that could continue the line of research proposed here. The input data in future works should come from sensors located in residences to obtain more reliable input data and to be able to validate the models presented here physically. The occupant model can be improved by replacing the probability equations used with equations based on surveys and monitoring of occupants in residences. In the coming years, a larger amount of data obtained in Panama can be generated to conduct research similar to the one presented here on an increasingly frequent basis.

Author Contributions

Original concept, formal analysis, and editing by A.A., L.B. and M.C.A. Introduction, figures and writing of most of the manuscript by A.A. and L.B. Supervision and funding by M.C.A. All authors have read and agreed to the published version of the manuscript.

Funding

This research was funded by a Panamanian Institution Secretaría Nacional de Ciencia, Tecnología e Innovación (SENACYT) https://www.senacyt.gob.pa/, (accessed on 20 May 2022) within the projects FID18-056 and FIED19-R2-005, together with the Sistema Nacional de Investigación (SNI).

Institutional Review Board Statement

Not applicable.

Informed Consent Statement

Not applicable.

Data Availability Statement

Not applicable.

Acknowledgments

The authors would like to thank the Technological University of Panama and the Faculty of Mechanical Engineering and Faculty of Industrial Engineering for their collaboration, together with the Research Group ECEB (https://eceb.utp.ac.pa/, accessed on 20 May 2022).

Conflicts of Interest

The authors declare no conflict of interest.

Nomenclature

TTemperature%WWRWindow to Wall Ratio
PMVPredicted mean voteRCResistance–Capacitance
ePMVExtension of the PMV4R3CFour resistance three capacitance thermal model
BEMBuilding Energy Modeling5R3CFive resistance three capacitance thermal model
IoTInternet of ThingsR1Windows resistance
nZEBNearly zero energy buildingR2External Ceilings and Walls resistance
PIProportional IntegrativeR3Internal Ceilings and Walls resistance
BR1Bedroom 1R4Floor resistance
BR2Bedroom 2R5Air Conditioning resistance
CRControl RoomGSolSolar Gains
LRLiving RoomToutOutside Temperature
BESBuilding Energy SystemTppWall and Celling Temperature
UHeat Transfer coefficientTiaIndoor air Temperature
HRmaxMaximum Relative HumidityTfloorFloor Temperature
HRminMinimum Relative HumidityC1Air Capacitance
ASHRAEAmerican Society of Heating, Refrigeration and Air-Conditioning EngineersC2Ceilings and Walls capacitance
pp valueC3Floor capacitance
metMetabolic RateTsetAir conditioning set point temperature
cloClothing InsulationACAir Conditioning

References

  1. O’Brien, W.; Wagner, A.; Schweiker, M.; Mahdavi, A.; Day, J.; Kjærgaard, M.B.; Carlucci, S.; Dong, B.; Tahmasebi, F.; Yan, D.; et al. Introducing IEA EBC annex 79: Key challenges and opportunities in the field of occupant-centric building design and operation. Build. Environ. 2020, 178, 106738. [Google Scholar] [CrossRef]
  2. International Energy Agency. Energy Efficiency 2019; International Energy Agency: Paris, France, 2019; p. 110. [Google Scholar]
  3. Wagner, A.; O’Brien, W.; Dong, B. Technical Report: Studying Occupant Behavior in Buildings: Methods and Challenges; International Energy Agency: Paris, France, 2017; Available online: http://www.annex66.org/sites/default/files/2018FinalReport/Annex%2066%20Deliverable%20-%20Occupant%20behavior%20study%20guidebook.pdf (accessed on 6 August 2021).
  4. D’Oca, S.; Chen, C.; Hong, T. Technical Report: An International Survey of Occupant Behavior in Workspaces; International Energy Agency: Paris, France, 2017; Available online: https://iea-ebc.org/Data/publications/EBC_Annex%2066_Occupant_Behavior_Survey.pdf (accessed on 15 August 2021).
  5. Yao, M.; Zhao, B. Factors affecting occupants’ interactions with windows in residential buildings in Beijing, China. Procedia Eng. 2017, 205, 3428–3434. [Google Scholar] [CrossRef]
  6. Fajilla, G.; Austin, M.C.; Mora, D.; de Simone, M. Assessment of probabilistic models to estimate the occupancy state in office buildings using indoor parameters and user-related variables. Energy Build. 2021, 246, 111105. [Google Scholar] [CrossRef]
  7. Mora, D.; Fajilla, G.; Austin, M.C.; de Simone, M. Occupancy patterns obtained by heuristic approaches: Cluster analysis and logical flowcharts. A case study in a university office. Energy Build. 2019, 186, 147–168. [Google Scholar] [CrossRef]
  8. Fabi, V.; Corgnati, S.; Andersen, R.; Filippi, M.; Olesen, B.W. Effect of occupant behaviour related influencing factors on final energy end uses in buildings. Proc. Climamed. 2011, 11, 1–17. [Google Scholar]
  9. D’Oca, S.; Chen, C.-F.; Hong, T.; Belafi, Z. Synthesizing building physics with social psychology: An interdisciplinary framework for context and occupant behavior in office buildings. Energy Res. Soc. Sci. 2017, 34, 240–251. [Google Scholar] [CrossRef] [Green Version]
  10. Carpino, C.; Mora, D.; Arcuri, N.; de Simone, M. Behavioral variables and occupancy patterns in the design and modeling of Nearly Zero Energy Buildings. Build. Simul. 2017, 10, 875–888. [Google Scholar] [CrossRef]
  11. Balbis-Morejón, M.; Rey-Hernández, J.M.; Amaris-Castilla, C.; Velasco-Gómez, E.; José-Alonso, J.F.S.; Rey-Martínez, F.J. Experimental study and analysis of thermal comfort in a university campus building in tropical climate. Sustainability 2020, 12, 8886. [Google Scholar] [CrossRef]
  12. Balbis-Morejon, M.; Noya-Sambrano, A. Thermal comfort evaluation in an educational building with air conditioning located in the warm tropical climate of Colombia. In IOP Conference Series: Materials Science and Engineering; IOP Publishing: Bristol, UK, 2020; Volume 844. [Google Scholar] [CrossRef]
  13. De Dear, R.; Xiong, J.; Kim, J.; Cao, B. A review of adaptive thermal comfort research since 1998. Energy Build. 2020, 214, 109893. [Google Scholar] [CrossRef]
  14. Holopainen, R.; Tuomaala, P.; Hernandez, P.; Häkkinen, T.; Piira, K.; Piippo, J. Comfort assessment in the context of sustainable buildings: Comparison of simplified and detailed human thermal sensation methods. Build. Environ. 2014, 71, 60–70. [Google Scholar] [CrossRef]
  15. Enescu, D. A review of thermal comfort models and indicators for indoor environments. Renew. Sustain. Energy Rev. 2017, 79, 1353–1379. [Google Scholar] [CrossRef]
  16. Zhao, Q.; Lian, Z.; Lai, D. Thermal comfort models and their developments: A review. Energy Built Environ. 2021, 2, 21–33. [Google Scholar] [CrossRef]
  17. ASHRAE. ANSI/ASHRAE Standard 55-2017: Thermal Environmental Conditions for Human Occupancy; ASHRAE Inc.: Atlanta, GA, USA, 2017; Volume 2017, p. 66. [Google Scholar]
  18. Fanger, P.O.; Toftum, J. Extension of the PMV model to non-air-conditioned buildings in warm climates. Energy Build. 2002, 34, 533–536. [Google Scholar] [CrossRef]
  19. Aryal, A.; Becerik-Gerber, B. Thermal comfort modeling when personalized comfort systems are in use: Comparison of sensing and learning methods. Build. Environ. 2020, 185, 107316. [Google Scholar] [CrossRef]
  20. Lee, S.; Karava, P.; Bilionis, I. Inference of thermal preference profiles for personalized thermal environments with actual building occupants. Build. Environ. 2018, 148, 714–729. [Google Scholar] [CrossRef]
  21. Introduction|IEA-EBC Annex 66. Available online: http://www.annex66.org/ (accessed on 3 August 2022).
  22. Dong, B.; Lam, K. A real-time model predictive control for building heating and cooling systems based on the occupancy behavior pattern detection and local weather forecasting. Build. Simul. 2014, 7, 23. [Google Scholar] [CrossRef]
  23. IEA EBC Annex 79 Occupant Behaviour-Centric Building Design and Operation. Available online: https://annex79.iea-ebc.org/ (accessed on 3 August 2022).
  24. About IEA EBC Annex 79. Available online: https://annex79.iea-ebc.org/about (accessed on 18 May 2022).
  25. Bonte, M.; Perles, A.; Lartigue, B.; Thellier, F. An occupant behavior model based on artificial intelligence for energy building simulation. In Proceedings of the BS 2013: 13th Conference of the International Building Performance Simulation Association, Chambèry, France, 25–28 August 2013. [Google Scholar]
  26. Deng, Z.; Chen, Q. Artificial neural network models using thermal sensations and occupants’ behavior for predicting thermal comfort. Energy Build. 2018, 174, 587–602. [Google Scholar] [CrossRef]
  27. Irshad, K.; Khan, A.I.; Irfan, S.A.; Alam, M.M.; Almalawi, A.; Zahir, M.H. Utilizing Artificial Neural Network for Prediction of Occupants Thermal Comfort: A Case Study of a Test Room Fitted with a Thermoelectric Air-Conditioning System. IEEE Access 2020, 8, 99709–99728. [Google Scholar] [CrossRef]
  28. Zambrano, J.M.; Oberegger, U.F.; Salvalai, G. Towards integrating occupant behaviour modelling in simulation-aided building design: Reasons, challenges and solutions. Energy Build. 2021, 253, 111498. [Google Scholar] [CrossRef]
  29. Saralegui, U.; Anton, M.A.; Arbelaitz, O.; Muguerza, J. An IoT sensor network to model occupancy profiles for energy usage simulation tools. In Proceedings of the 2018 Global Internet of Things Summit (GIoTS), Bilbao, Spain, 4–7 June 2018; pp. 1–6. [Google Scholar] [CrossRef] [Green Version]
  30. Khalil, M.; Esseghir, M.; Merghem-Boulahia, L. An IoT Environment for Estimating Occupants’ Thermal Comfort. In Proceedings of the 2020 IEEE 31st Annual International Symposium on Personal, Indoor and Mobile Radio Communications, London, UK, 31 August–3 September 2020; pp. 1–6. [Google Scholar] [CrossRef]
  31. Abuimara, T. Roadmap for Occupant Modelling in Building Codes and Standards. Available online: https://www.academia.edu/36706133/Roadmap_for_Occupant_Modelling_in_Building_Codes_and_Standards (accessed on 18 May 2022).
  32. Barthelmes, V.M.; Becchio, C.; Corgnati, S.P. Occupant behavior lifestyles in a residential nearly zero energy building: Effect on energy use and thermal comfort. Sci. Technol. Built Environ. 2016, 22, 960–975. [Google Scholar] [CrossRef]
  33. D’Oca, S.; Fabi, V.; Corgnati, S.P.; Andersen, R.K. Effect of thermostat and window opening occupant behavior models on energy use in homes. Build. Simul. 2014, 7, 683–694. [Google Scholar] [CrossRef]
  34. Bavaresco, M.V.; Ghisi, E.; D’Oca, S.; Pisello, A.L. Triggering occupant behaviour for energy sustainability: Exploring subjective and comfort-related drivers in Brazilian offices. Energy Res. Soc. Sci. 2021, 74, 101959. [Google Scholar] [CrossRef]
  35. Sood, T.; Janssen, P.; Miller, C. Spacematch: Using Environmental Preferences to Match Occupants to Suitable Activity-Based Workspaces. Front. Built Environ. 2020, 6, 113. [Google Scholar] [CrossRef]
  36. Perera, D.W.U.; Skeie, N.O. Modeling and simulation of multi-room buildings. Modeling Identif. Control. 2016, 37, 99–111. [Google Scholar] [CrossRef] [Green Version]
  37. Bagheri, A.; Feldheim, V.; Ioakimidis, C.S. On the Evolution and Application of the Thermal Network Method for Energy Assessments in Buildings. Energies 2018, 11, 890. [Google Scholar] [CrossRef] [Green Version]
  38. Attoue, N.; Shahrour, I.; Mroueh, H.; Younes, R. Determination of the Optimal Order of Grey-Box Models for Short-Time Prediction of Buildings’ Thermal Behavior. Buildings 2019, 9, 198. [Google Scholar] [CrossRef] [Green Version]
  39. Boodi, A.; Beddiar, K.; Amirat, Y.; Benbouzid, M. Simplified Building Thermal Model Development and Parameters Evaluation Using a Stochastic Approach. Energies 2020, 13, 2899. [Google Scholar] [CrossRef]
  40. Dimitriou, V.; Firth, S.K.; Hassan, T.M.; Kane, T.; Coleman, M. Data-driven Simple Thermal Models: The Importance of the Parameter Estimates. Energy Procedia 2015, 78, 2614–2619. [Google Scholar] [CrossRef] [Green Version]
  41. Belic, F.; Hocenski, Z.; Sliskovic, D. Thermal modeling of buildings with RC method and parameter estimation. In Proceedings of the 2016 International Conference on Smart Systems and Technologies (SST), Osijek, Croatia, 12–14 October 2016; pp. 19–25. [Google Scholar] [CrossRef]
  42. Hietaharju, P.; Ruusunen, M.; Leiviskä, K. A Dynamic Model for Indoor Temperature Prediction in Buildings. Energies 2018, 11, 1477. [Google Scholar] [CrossRef] [Green Version]
  43. Linear Grey-Box Model Estimation—MATLAB Greyest—MathWorks América Latina. Available online: https://la.mathworks.com/help/ident/ref/iddata.greyest.html (accessed on 30 May 2021).
  44. Kim, J.; Zhou, Y.; Raftery, P.; Brager, G. Personal comfort models: Predicting individuals’ thermal preference using occupant heating and cooling behavior and machine learning. Build. Environ. 2017, 129, 96–106. [Google Scholar] [CrossRef] [Green Version]
  45. De León, L.; Austin, M.C.; Carpino, C.; Mora, D. Towards Zero Energy Districts developments base on bioclimatic strategies: A Numerical Study in a Developing Country. In E3S Web of Conferences; ATI: Rome, Italy, 2021; Volume 312, p. 02017. [Google Scholar] [CrossRef]
  46. Boodi, A.; Beddiar, K.; Amirat, Y.; Benbouzid, M. Building Thermal-Network Models: A Comparative Analysis, Recommendations, and Perspectives. Energies 2022, 15, 1328. [Google Scholar] [CrossRef]
Figure 1. Case study’s single-family building: (a) plan view and (b) axonometric view. BR1, BR2, CR, and LR refer to the Bedrooms 1 and 2, Control Room, and Living Room, respectively.
Sustainability 14 09591 g001
Figure 2. Sensitivity analysis results based on the standardized regression coefficient.
Sustainability 14 09591 g002
Figure 3. Thermal Model developed for: (a) Passive Thermal model composed of 4R3C and (b) Active Thermal Model Composed of R5C3.
Sustainability 14 09591 g003aSustainability 14 09591 g003b
Figure 4. Control System schematic in Simulink.
Sustainability 14 09591 g004
Figure 5. Deterministic model: (a) Internal temperature, external temperature, and comfort system used, (b) PMV vs. time.
Sustainability 14 09591 g005
Figure 6. Probabilistic model: (a) Random number used, (b) Internal temperature, external temperature, and comfort system used, (c) PMV vs. time.
Sustainability 14 09591 g006
Figure 7. Combined model #1: (a) Random number used, (b) Internal temperature, external temperature, and comfort system used, (c) PMV vs. time.
Sustainability 14 09591 g007
Figure 8. Combined model #2: (a) Random number used, (b) Internal temperature, external temperature, and comfort system used, (c) PMV vs. time.
Sustainability 14 09591 g008
Table 1. Case Solution Chart.
StepProcedure
1Determination of the case study
2Parametric and Sensibility Analysis to identify relevant variables
3Formulation of thermal model that describes the case study (thermal resistance/capacitance model)
4Simulation of the case performance to obtain the case’s thermal behavior
5Parametric optimization by means of gray-box tools, training, and validation of the parameters
6Determination of occupant decision-making scenarios
7Determination of proportional and integrative values for each scenario
8Integration of thermal model, occupant decision controller, and PMV calculation
Table 2. Envelope Materials.
ElementsValueU (W/m2K)
Concrete block’s Base thickness150 mm2.533
Concrete block’s wall thickness100 mm1.241
Concrete block’s roof thickness280 mm0.719
Concrete block’s ground thickness100 mm3.316
Infiltration rate0.70 ach-
Table 3. Windows’ Materials.
DescriptionValueU (W/m2K)
Wall to Window ratio30%3.779
Window Height1.50 m
Window spacing5 m
Window sill’s height0.80 m
BlindsNo blinds
Openess percentage50%
Table 4. Summary of the typical meteorological data employed in simulations.
MonthTmax (°C)
Hour
Tmin (°C)
Hour
HRmax (%)
Hour
HRmin (%)
Hour
Wind Speed
(m/s)
Wind Direction
(°)
January 335
15:00
23.9
6:00
94
5:00
44
15:00
0.43126
February 2034.6
15:00
22.2
6:00
93
6:00
40
15:00
2.7785.77
March 1735.6
15:00
24.9
6:00
73
6:00
36
16:00
2.349
April 1135.3
15:00
24.8
6:00
82
24:00
44
16:00
1.7587
May 2034.8
15:00
24.5
6:00
90
6:00
53
16:00
0.8783.3
June 2332.8
15:00
23.4
6:00
94
6:00
58
15:00
0.45108.25
July 2135.5
16:00
24.3
6:00
97
4:00
49
16:00
0.389.3
August 1934.7
15:00
24.1
6:00
95
5:00
52
15:00
3.9188
September 132.5
15:00
23
6:00
98
24:00
60
15:00
2.183
October 2032.5
15:00
23
6:00
96
6:00
62
14:00
2.3390.67
November 1132.9
15:00
23.7
6:00
94
5:00
61
13:00
2.5580
December 1634.3
15:00
24.6
6:00
94
7:00
50
16:00
4.234.5
Table 5. Optimization of an R4C3 grid in a passive case with closed windows; best choice in the color green.
Passive Case: Closed Windows
JAN TO APRILMAY TO AUGUSTSEPT TO DEC
Parameters R 1 (K/W)5.69 × 10−36.09 × 10−37.26 × 10−37.25 × 10−35.35 × 10−36.93 × 10−3
R 2 (K/W)4.47 × 10−46.67 × 10−41.27 × 10−38.69 × 10−46.76 × 10−41.68 × 10−3
R 3 (K/W)9510010010063100
R 4 (K/W)8.115.816.155.4411.126.76
C 1 (J/K)5.50 × 1051.89 × 1062.94 × 1062.34 × 1063.14 × 1063.84 × 106
C 2 (J/K)5.98 × 1064.66 × 1062.63 × 1063.82 × 1063.75 × 1062.28 × 106
C 3 (J/K)9.60 × 1052.48 × 1051.39 × 1065.37 × 1051.10 × 1066.50 × 103
TrainingFit (1/3 of the data)80.73%84.09%85.60%87.99%79.55%82.70%
Error (°C)0.440.300.260.180.500.36
365 Days ValidationFit (all data)68.09%67.84%80.12%77.34%70.87%72.73%
Error (°C)1.151.010.620.661.490.76
Table 6. Optimization of an R4C3 grid in a passive case with open windows; best choice in the color green.
Passive Case: Windows Opened at 50%
JAN TO APRILMAY TO AUGUSTSEPT TO DEC
Parameters R 1 (K/W)5.66 × 10−43.50 × 10−41.20 × 10−36.12 × 10−49.65 × 10−46.12 × 10−4
R 2 (K/W)8.69 × 10−41.27 × 10−38.69 × 10−41.27× 10−38.69 × 10−41.27× 10−3
R 3 (K/W)100100100100100100
R 4 (K/W)5.446.155.446.155.446.15
C 1 (J/K)2.34 × 1062.94 × 1062.34 × 1062.94 × 1062.34 × 1062.94 × 106
C 2 (J/K)3.82 × 1062.63 × 1063.82 × 1062.63 × 1063.82 × 1062.63 × 106
C 3 (J/K)5.37 × 1051.39 × 1065.37 × 1051.39 × 1065.37 × 1051.39 × 106
TrainingFit (1/3 of the data)85.56%85.37%81.27%82.10%82.12%82.12%
Error (°C)0.210.210.250.220.220.22
365 Days ValidationFit (all data)76.27%76.91%70.67%76.01%73.08%76.01%
Error (°C)0.690.840.590.660.560.66
Table 7. Optimization of an R5C3 grid in an active case with air conditioning on; best choice in the color green.
AIR CONDITIONING ON (ACTIVE CASE)
JANUARY 4TH 10 a.m.–12 p.m.
Parameters R 1 (K/W)7.26 × 10−37.25 × 10−3
R 2 (K/W)1.27 × 10−38.69 × 10−4
R 3 (K/W)100100
R 4 (K/W)6.155.44
R 5 (K/W)100100
C 1 (J/K)2.94 × 1062.34 × 106
C 2 (J/K)2.63 × 1063.82 × 106
C 3 (J/K)1.39 × 1065.37 × 105
TrainingFit84.22%87.78%
Cost0.15760.0945
Table 8. Optimized values for R4C3 and R5C3 grids.
ParameterR4C3: Passive, Closed WindowsR4C3: Passive, Open Windows (50%)R5C3: Active, AC ON, Closed Windows
R 1 (K/W)7.25 × 10−31.20 × 10−37.25 × 10⁻³
R 2 (K/W)8.69 × 10−48.69 × 10−48.69 × 10⁻⁴
R 3 (K/W)100100100
R 4 (K/W)5.445.445.44
R 5 (K/W)--100
C 1 (J/K)2.34 × 1062.34 × 1062.34 × 106
C 2 (J/K)3.82 × 1063.82 × 1063.82 × 106
C 3 (J/K)5.37 × 1055.37 × 1055.37 × 105
Table 9. Proportional and integrative values based on decision-making scenarios.
Controller Based on ScenarioPI
Probabilistic scenario50−1.40 × 10⁻³
Deterministic scenario50−6.88 × 10⁻⁴
Combined model #150−1.40 × 10⁻³
Combined model #250−1.05 × 10⁻⁴
Table 10. Electrical Consumption comparison according to the four control methods.
MonthProbabilistic Method’s Control SystemDeterministic Method’s Control SystemCombined Model #1′s Control SystemCombined Model #2′s Control System
AC Energy Consumption (kWh)
January219.7155.2319.4209.8
February207.8153.0330.5200.9
March259.7175.5375.3235.8
April243.3169.6356.9226.0
May190.6155.4298.4203.6
June141.8128.7222.3178.1
July176.8169.9299.7189.9
August162.0152.8285.5176.6
September142.5122.4246.3167.9
October125.5135.9221.9183.4
November121.7111.9174.2156.4
December193.5144.2316.3201.8
Annual2185.21774.73446.82330.6
Publisher’s Note: MDPI stays neutral with regard to jurisdictional claims in published maps and institutional affiliations.

