Article

Relationship between the Cost of Capital and Environmental, Social, and Governance Scores: Evidence from Latin America

by
Ana Gabriela Ramirez
1,
Julián Monsalve
1,
Juan David González-Ruiz
1,*,
Paula Almonacid
2 and
Alejandro Peña
3
1
Grupo de Investigación en Finanzas y Sostenibilidad, Departamento de Economía, Universidad Nacional de Colombia, Sede Medellín, Medellín 050034, Colombia
2
Grupo de Investigación en Finanzas y Banca, Departamento de Finanzas, Universidad EAFIT, Medellín 050022, Colombia
3
Grupo de Investigación en Información y Gestión, Escuela de Administración, Universidad EAFIT, Medellín 050022, Colombia
*
Author to whom correspondence should be addressed.
Sustainability 2022, 14(9), 5012; https://doi.org/10.3390/su14095012
Submission received: 17 February 2022 / Revised: 1 April 2022 / Accepted: 11 April 2022 / Published: 21 April 2022
(This article belongs to the Special Issue Sustainable Corporate Finance Research)

Abstract

:
Environmental, social, and governance (ESG) scores play a pivotal role in the strategic design of firms. The literature has demonstrated the importance of sustainability issues in the financial performance of firms around the world. In particular, understanding the relationship between sustainability and the cost of capital is crucial for determining financial strategy and decision making. We identify an opportunity in the literature to analyze this relationship within Latin America (LatAm) firms. Thus, this study analyzes the relationship between ESG scores with the cost of capital of firms with headquarters in LatAm using a data set that includes 606 observations corresponding to information about 202 firms from 2017 to 2019. To conduct our analysis, two fixed effects panel data models were estimated. We model this relationship by taking ESG scores and each of its ESG Pillar scores—i.e., Environmental, Social, and Governance pillar scores—as independent variables and analyzing how they affect the cost of capital. According to the results, there is an inverse effect relationship between ESG scores and the cost of capital. Additionally, we did not find a relationship between the Social Pillar score and the Environmental Pillar score with the cost of capital. By contrast, the Governance Pillar score shows a negative relationship with the cost of capital. This indicates that the increase in transparency about internal processes and governance entities can be an essential driver of value creation for firms and higher financing confidence in LatAm firms. This study represents a breakthrough in explaining the impact of ESG scores on the cost of capital in LatAm. Ultimately, the current study presents the potential for further research in this field.

1. Introduction

Due to the United Nations Development Program (UNDP), there is increasing pressure on the global community to initiate efforts to achieve the Sustainable Development Goals (SDGs) by 2030 [1], which are aligned with responsible investing. As a result, at the launching of the initiative to develop the Principles for Responsible Investment (PRI), the term “Environmental, Social, and Governance” (ESG) began to gain significant importance in investment and, therefore, in the operation of firms [2].
In this way, investors have been concerned about incorporating ESG criteria in their investment portfolios [3,4]. This has allowed firms’ behaviors and decisions toward sustainable development to become a fundamental factor in obtaining support for achieving the SDGs [5,6]. In addition to this concern, firms’ cost of capital—also known as WACC—the weighted average cost of capital—is crucial in determining financing strategy and decision-making aligned to sustainability issues [7]. Thus, firms seek to establish strategies based on sustainability to reduce their cost of capital.
According to [8], firms that promote corporate social responsibility (CSR) practices exhibit cheaper equity financing. Additionally, Ref. [9] suggested that adopting CSR measures is essential to building a good reputation. Sustainable strategies, which ESG scores can measure, benchmark CSR results derived from the best business practices and socially responsible investment [10,11].
In this way, firms are becoming interested in the effect of a sustainable strategy on the cost of capital. A study conducted by Ref. [12] has outlined some of the concerns that ESG scores consider, such as climate change, the environmental impacts of operations, respect for human rights, equality, workforce diversity, independence of the board of directors, fair treatment of shareholders, transparency, and disclosure of business information.
Some of the main findings in the extant literature refer to the relationship between sustainability and the cost of equity (a component of the cost of capital). Research conducted by Ref. [13] has found that strong sustainability concerning ESG reinforces the negative relationship between economic sustainability disclosure and the cost of equity. Conversely, Refs. [7,14] agreed that CSR disclosure in annual reports reduces the cost of equity. Similarly, Ref. [8] found that firms with better CSR performance have a lower cost of equity.
In addition, Ref. [15] found that sustainability reporting reduces both the cost of debt and equity, which means that it generally has an inverse impact on firms’ cost of capital. Regarding the relationship between ESG scores and firms’ cost of capital, certain advances have been developed that lead to various conclusions. According to Ref. [12], in a study conducted on panel data regressions such as the pooled ordinary least squares, fixed effect, and random effect, none of the ESG Pillar scores were significant in firms’ cost of capital in Malaysia. Conversely, based on the Swedish Stock Exchange’s research conducted from 2017 to 2019, Ref. [16] found no evidence that the ESG score is related to the cost of capital. Finally, a study conducted by Ref. [17], which was based on 400 US firms listed in the stock market, showed a negative correlation between ESG scores and the firms’ cost of capital.
Although empirical studies have mainly focused on the relationship between ESG issues and financial performance [6,18,19,20], to the best of our knowledge, no elements in the current literature explain the impact of ESG scores on the cost of capital in Latin America (LatAm). Therefore, to fill this gap in the literature, the present study analyzes the relationship between ESG scores and the cost of capital of firms with headquarters in LatAm using a panel model and a data set that includes 606 observations corresponding to information about 202 LatAm firms from 2017 to 2019. The current study makes a two-fold contribution to the literature. First, to better understand the ESG scores—the cost of the capital relationship, an in-depth scientometric assessment that allows the analysis of the research areas, trending topics, and the evolution in this field is performed. Second, the present study allows a better understanding of the effects of ESG scores on the cost of capital of LatAm firms, providing critical new evidence and insights on this issue, especially in the region where research on this topic has not yet been conducted. In this way, this study provides a roadmap that researchers and professionals can use to improve their understanding of the relationship between ESG scores and the cost of capital.
The remainder of the paper is organized as follows: In Section 2, we review the literature that discusses the theoretical foundations of the cost of capital, financial performance, and corporate governance while focusing on CSR practices and ESG issues. In Section 3, we explain the data and variables used in the present study; in Section 4, we discuss the empirical results; in Section 5, we discuss our empirical results; in Section 6, we conclude our study.

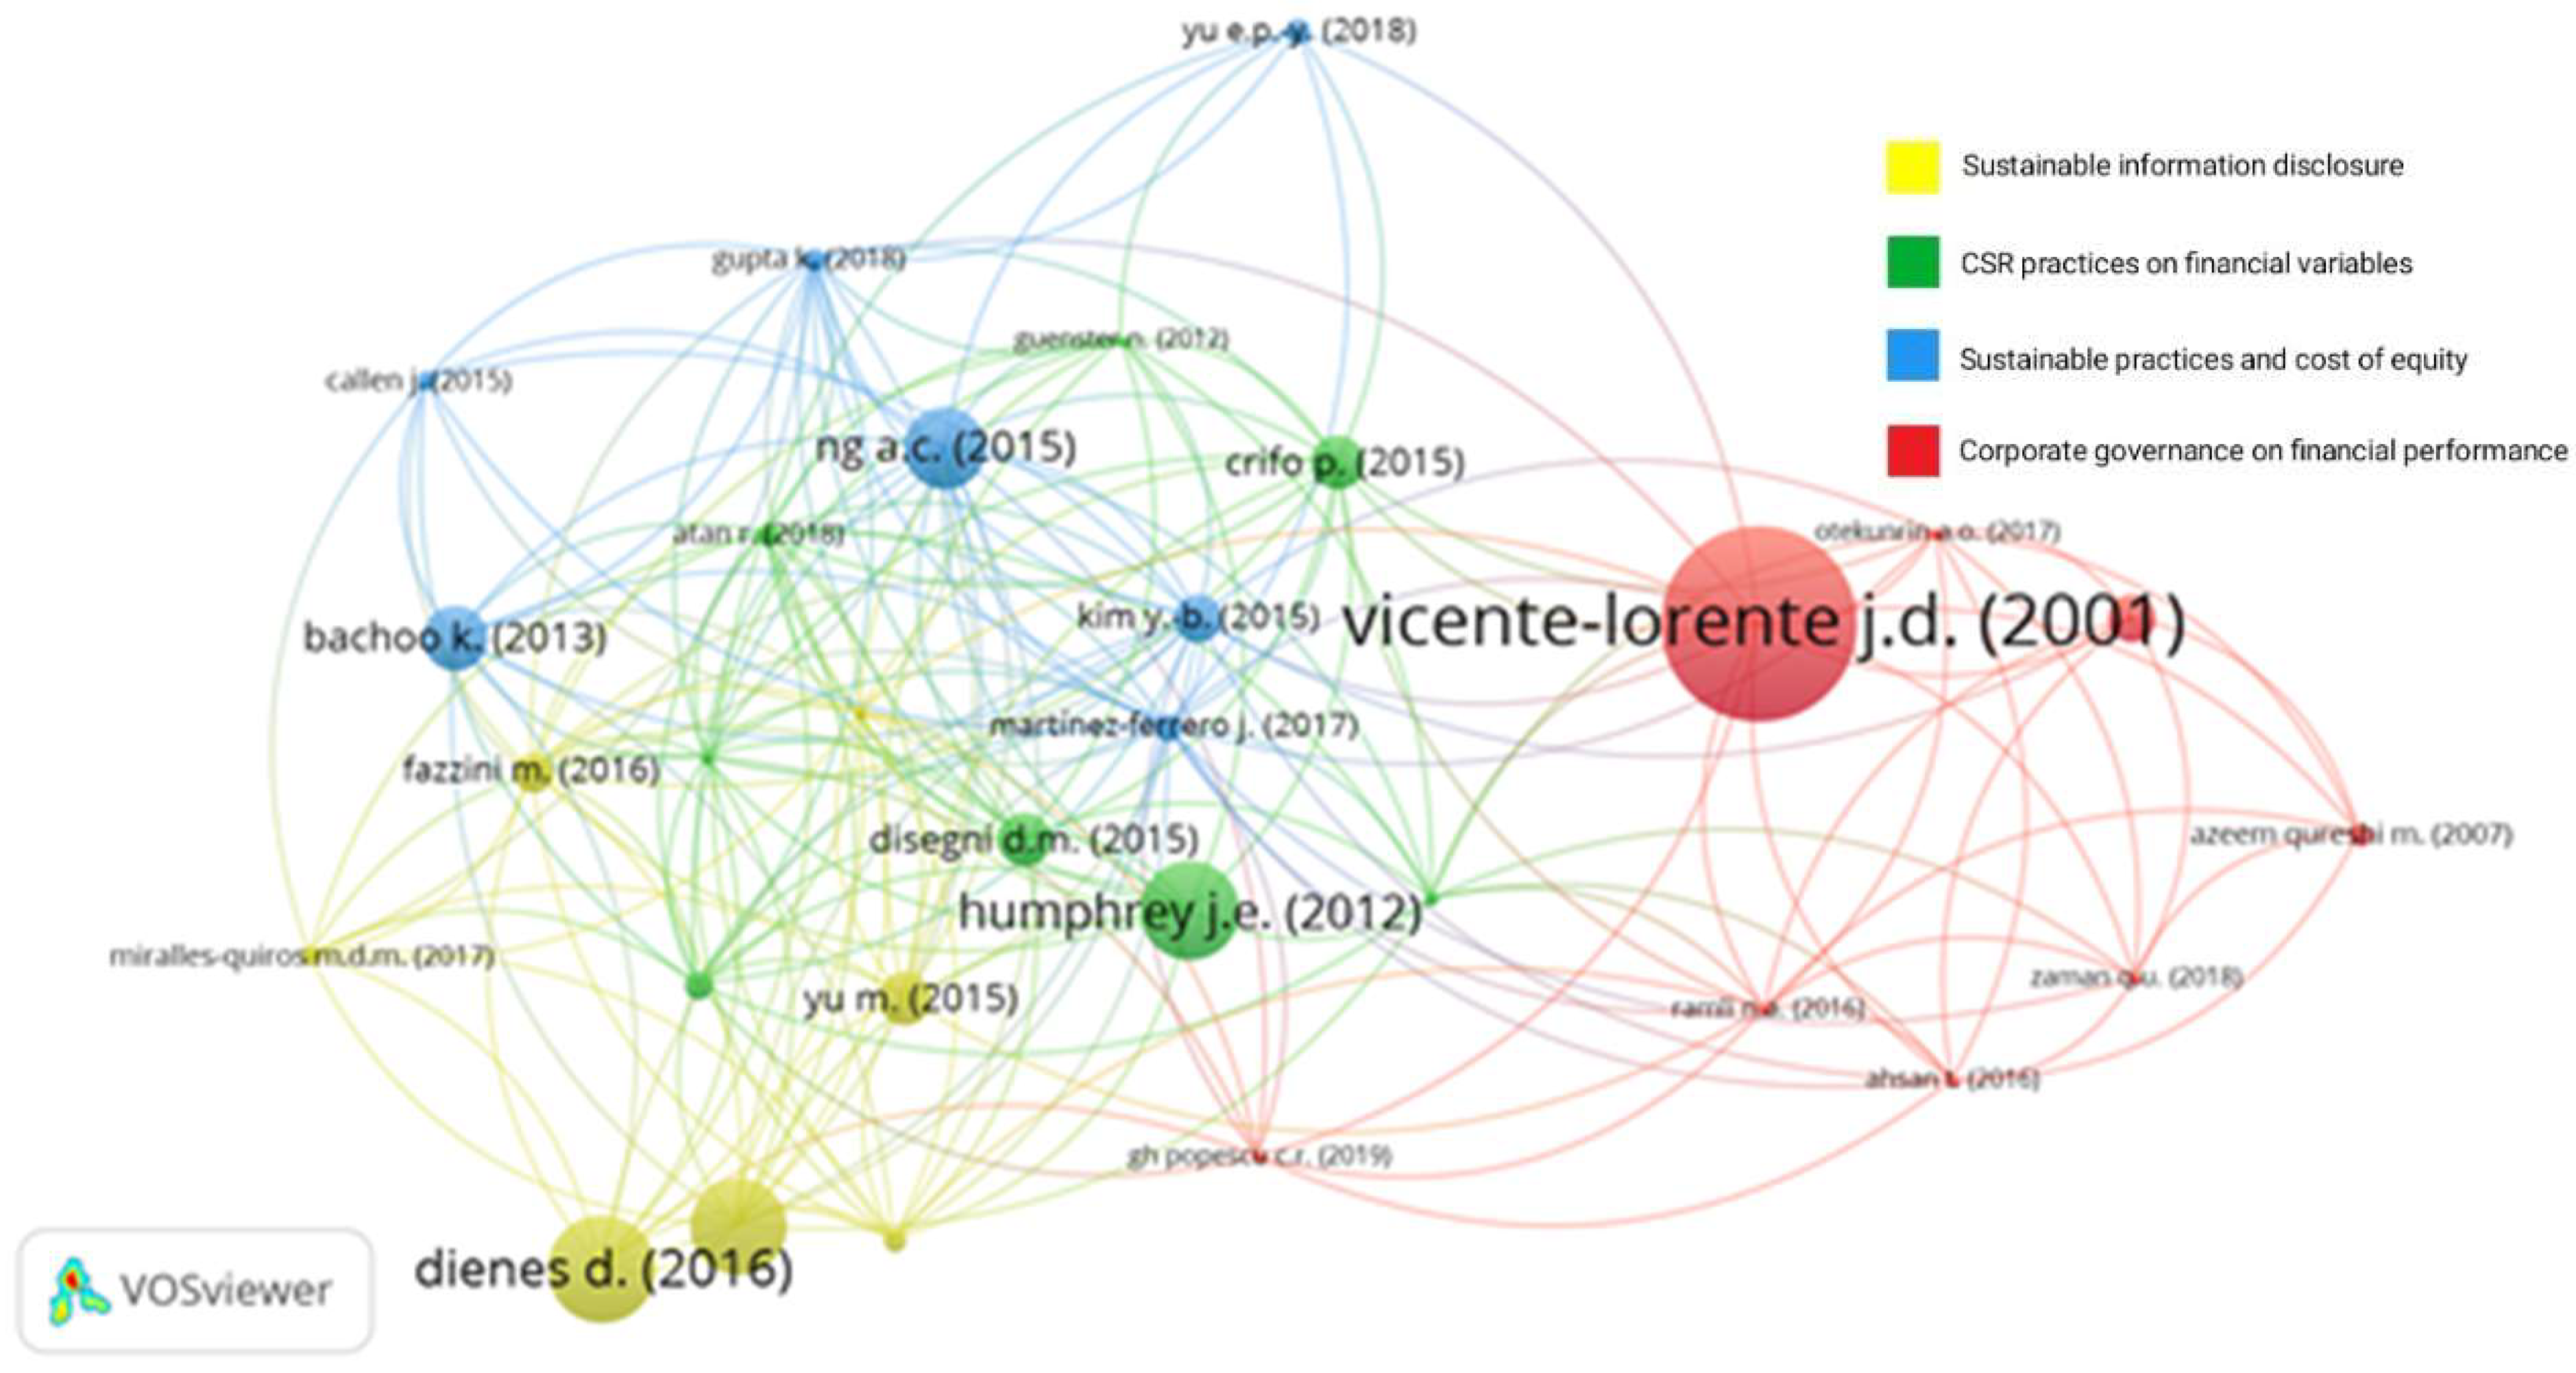
2. Literature Review

The present study shows a comprehensive, systematic, and holistic review of the literature about the relationship between sustainable practices and the cost of capital. The research papers reviewed are from the bibliographic databases of Scopus due to its excellent academic reputation in research [21]. We performed our search starting from the following search equation: TITLE-ABS-KEY (WACC OR “cost of capital” OR “firm valuation” OR “capital structure”) AND TITLE-ABS-KEY (ESG OR sustainab*) AND TITLE-ABS-KEY (firm OR compan* OR corporati*). We found 177 documents related to the topic in this database.
Afterward, we visualized and clustered the documents found using VOSviewer version 1.6.13. This tool has been used by several studies for a comprehensive picture of relevant research topics and trends (namely, [6,22,23,24,25]). The software built a bibliometric network based on bibliographic coupling for the papers obtained from this database, including information regarding journals, researchers, and individual publications. VOSviewer uses natural language processing algorithms for identifying links, connections, or relations between documents (represented by dots), and, thus, clusters are created by grouping them in a network [26]. The size of the dots represents the author’s relevance measured by cites. A cluster is a set of items included in a map, and an item may belong to only one cluster [26].
Based on the results obtained from the search equation, we aimed to choose the most relevant studies within the field to include in the literature review. In this line of thought, we selected the number of citations as a criterion to evaluate relevance; specifically, we decided to include only those papers with five or more citations. Then, those with a minimum link strength of 10 were retained, thus obtaining 30 articles distributed in 4 clusters (Figure 1).

2.1. Cluster 1: CSR Practices on Financial Variables

The first cluster mainly addresses the impact of CSR practices on the performance of variables in financial markets. Specifically, they mainly focus on how CSR affects investors’ cost of capital. There is evidence that a lack of sustainability will lead to a higher cost of capital and limited access to private equity.
One study [27] concluded that this increment in the price of capital would reduce the value of a firm. However, Ref. [12] argued that even though ESG Pillar scores have a relationship with the cost of capital, they do not have a significant relationship with profitability and enterprise value. In addition, [28] claimed that CSR practices positively and significantly affect a firm’s market value in emerging countries. The magnitude of this relationship is affected by the financial and operating characteristics of the firm.
From investors’ perspective, studies conducted by Refs. [29,30] found that an investment strategy linked to CSR does not significantly influence risk or return. In comparison, Ref. [30] specified that although this type of strategy has led to positive abnormal returns in the last decades, it will eventually change as firms with high ESG standards will be correctly priced and have a lower expected cost of capital.
Finally, other researchers have shown how ESG and CSR have different impacts on firms; Ref. [31] stated that firms that proactively support social responsibility and environmental sustainability are characterized by better profitability measures, lower short-term liquidity, higher long-term leverage, and better management efficiency than the entire industry or sector. In addition, according to [32], a firm can access additional resources by improving its CSR ratings.

2.2. Cluster 2: Sustainable Information Disclosure

This cluster highlights the determinants of sustainable information disclosure and how it affects a firm. One study conducted by Ref. [33] suggested that the most critical drivers of the disclosure of sustainability reports are media visibility and ownership structure. Additionally, Ref. [34] revealed that size, media, country-specific factors, industry, and sustainability performance significantly impact sustainable information disclosure. Both results are supported by [35,36], who found a positive effect of sustainability engagement and voluntary environmental disclosure on a firm’s market value. This relationship is more robust in countries with high investor protection and disclosure levels [36].
In addition, Ref. [37] recommended that sustainability leadership should be a mandate for strategic managers of publicly traded companies. According to their findings, conducting business using policies that integrate economic, social, and environmental principles is a business differentiation strategy contributing to shareholder value creation. After all, Ref. [38] highlighted that investors of firms that promote sustainability practices demand a lower rate of return, i.e., a lower cost of capital.

2.3. Cluster 3: Sustainable Practices and Cost of Equity

This cluster studies the relationship between sustainable practices and the cost of equity. According to [13], ESG Pillar scores have an inverse relationship with the cost of equity, which is supported by only environmental and governance performance. In this line, Ref. [39] found that environmental practices also reduce the implicit cost of equity, which is more significant in countries where the government is weak. Conversely, Ref. [16] found no evidence that the ESG score is related to the cost of capital; however, there is a positive relationship between the ESG score and the credit default swap spread in the Swedish stock market. In addition, Ref. [17] showed a negative correlation between ESG scores and the cost of capital and found a positive relationship between capitalization and free cash flow.
Furthermore, Refs. [38,40,41] found a negative relationship between quality sustainability reporting and the cost of capital. Within this context, Ref. [41] found that by providing an assurance statement, the effect of this relationship increases through improved credibility of the information. Additionally, Ref. [40] concluded that it also has a positive relationship with expected future performance. Last but not least, Ref. [38] found that the effect of carbon risk is directly related to the cost of equity. This relationship has been shown to be independent of the voluntary disclosure of sustainability reports.

2.4. Cluster 4: Corporate Governance on Financial Performance

This cluster focuses on the importance of accounting practices, decisions based on international standards, and the integration of CSR policies into the financial performance of firms. One study conducted by Ref. [42] noted that screening for compliant versus non-compliant companies allows investors to distinguish sustainable companies over the long term, providing greater diversification when holding socially responsible investment portfolios. The diversification is explained by the susceptibility of compliant firms to increase book debt ratios in periods of declining equity value.
By contrast, Ref. [43] identified the need to improve corporate governance and social responsibility to create an appropriate balance between sustainability, competitiveness, productivity, and financial and non-financial performance of firms. Lastly, Ref. [44] found that Nigerian firms’ adoption of International Financial Reporting Standards does not significantly influence the relationship between capital structure and profitability of firms.

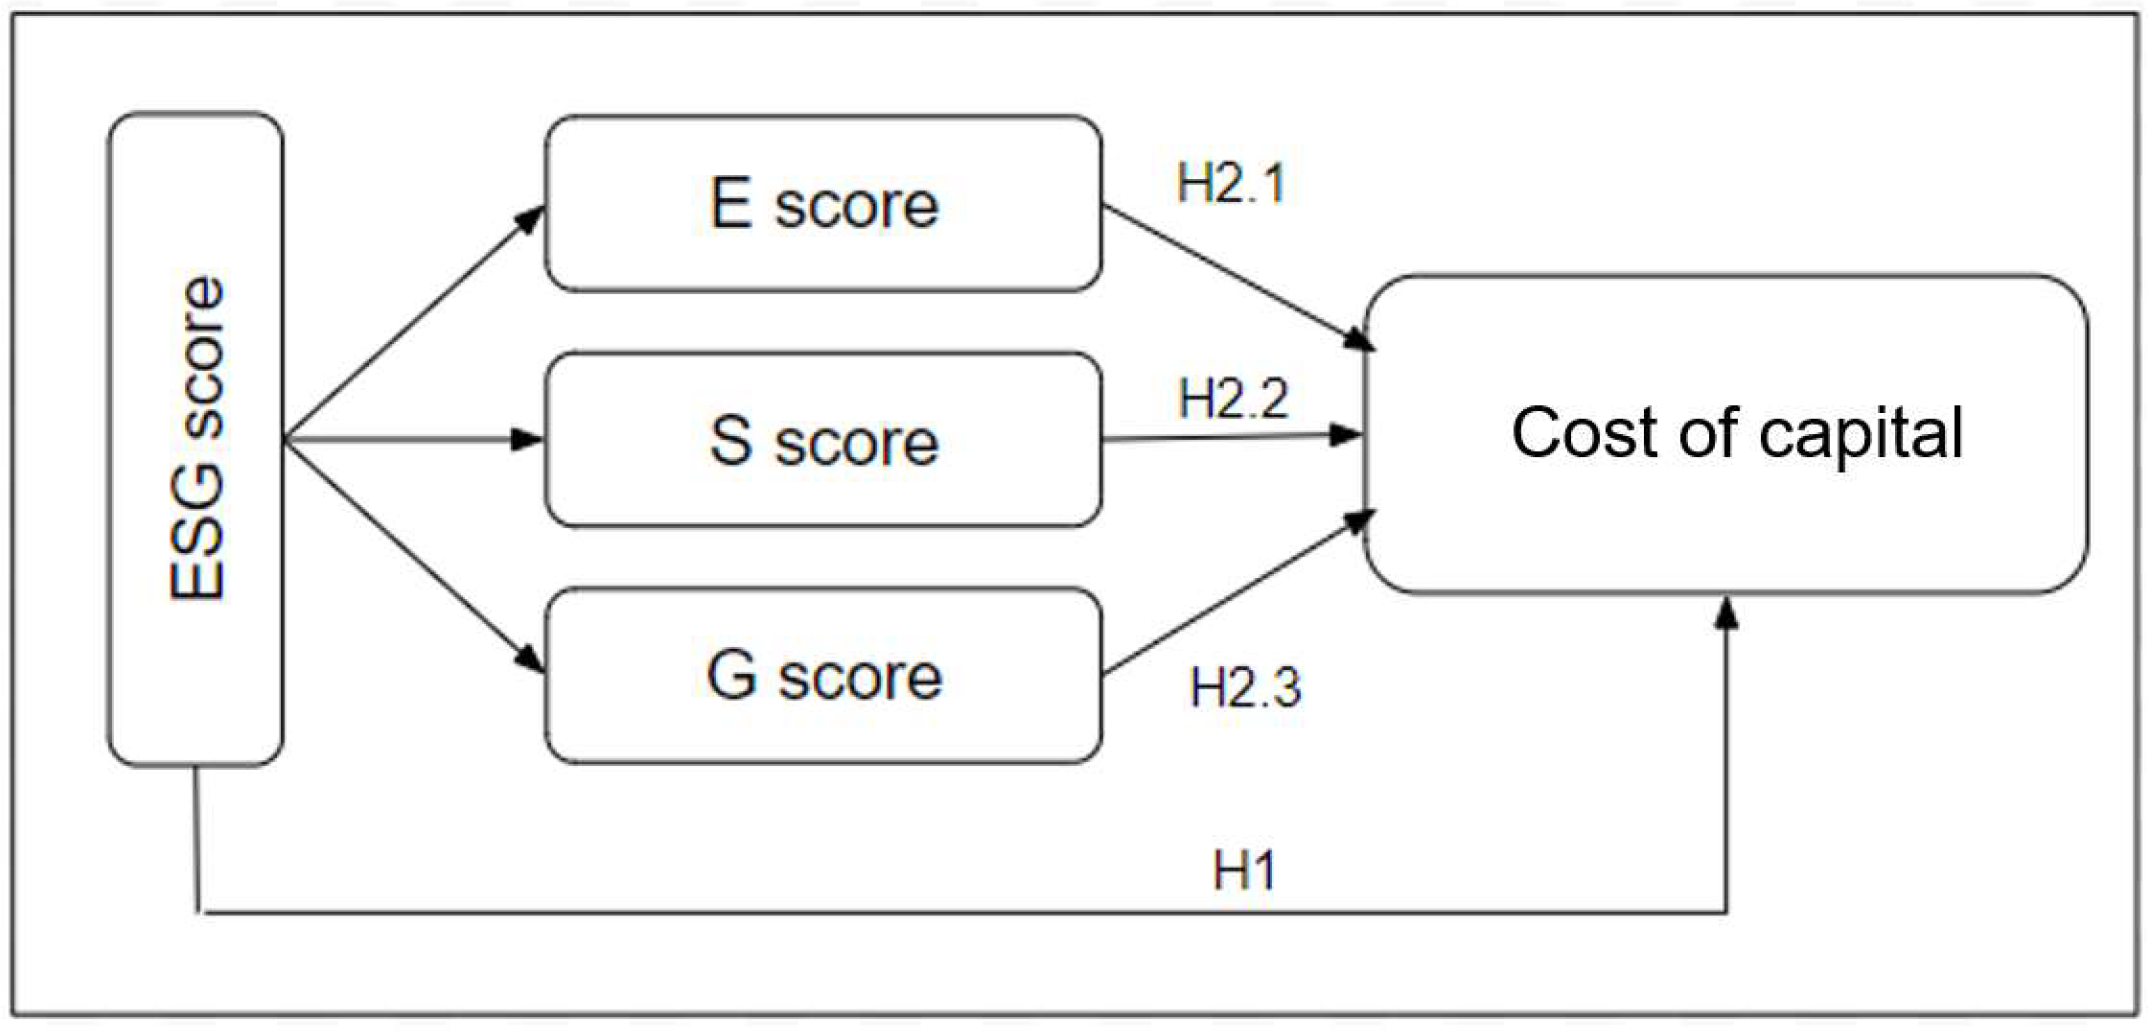
2.5. Hypothesis Development

The literature exemplifies research efforts that researchers have made to understand how sustainability affects firms’ financial variables such as market value [19,26,27] and profitability [31]. In particular, there is evidence of an inverse relationship between sustainable practices and the cost of capital [18,29,30]. However, in these studies, ESG scores were not used as an indicator to measure sustainability. Other authors have shown interest in understanding how ESG scores relate to the cost of capital [9,12,13]. Nevertheless, there is a scarcity of studies that explain their relationship in LatAm. Consequently, an opportunity is evident in the literature to evaluate ESG scores and the cost of capital in LatAm firms.
Therefore, we propose the following research question: How are ESG scores related to the cost of capital in LatAm? Since we have found evidence in the literature of a statistically significant inverse effect of sustainability and cost of capital on firms [9,18,29,30], we propose the following hypotheses to address our research question (Figure 2):
Hypothesis 1 (H1).
The relationship between the ESG scores and the cost of capital is significant and inverse.
We proposed the following model to test this hypothesis in LatAm:
W A C C i t = α 0 + α 1 P B R i t + α 2 R O A i t + α 3 L R i t + α 4 T A i t + α 5 E S G i t +   α 6 Y e a r . 2018 i t + α 7 Y e a r . 2019 i t + υ i t + ϵ i t
Hypothesis 2 (H2).
The relationship between each ESG Pillar score and the cost of capital is significant.
Hypothesis 2.1 (H2.1).
The relationship between the Environmental Pillar score and the cost of capital is inverse.
Hypothesis 2.2 (H2.2).
The relationship between the Social Pillar score and the cost of capital is inverse.
Hypothesis 2.3 (H2.3).
The relationship between the Governance Pillar score and the cost of capital is inverse.
We proposed the following model to test this hypothesis in LatAm:
W A C C i t = α 0 + α 1 P B R i t + α 2 R O A i t + α 3 L R i t + α 4 T A i t + α 5 E P S i t + α 6 S P S i t + α 7 G P S i t +   α 8 Y e a r . 2018 i t + α 9 Y e a r . 2019 i t + υ i t + ϵ i t
where EPS corresponds to the Environmental Pillar score, SPS to the Social Pillar score, and GPS to the Governance Pillar score.

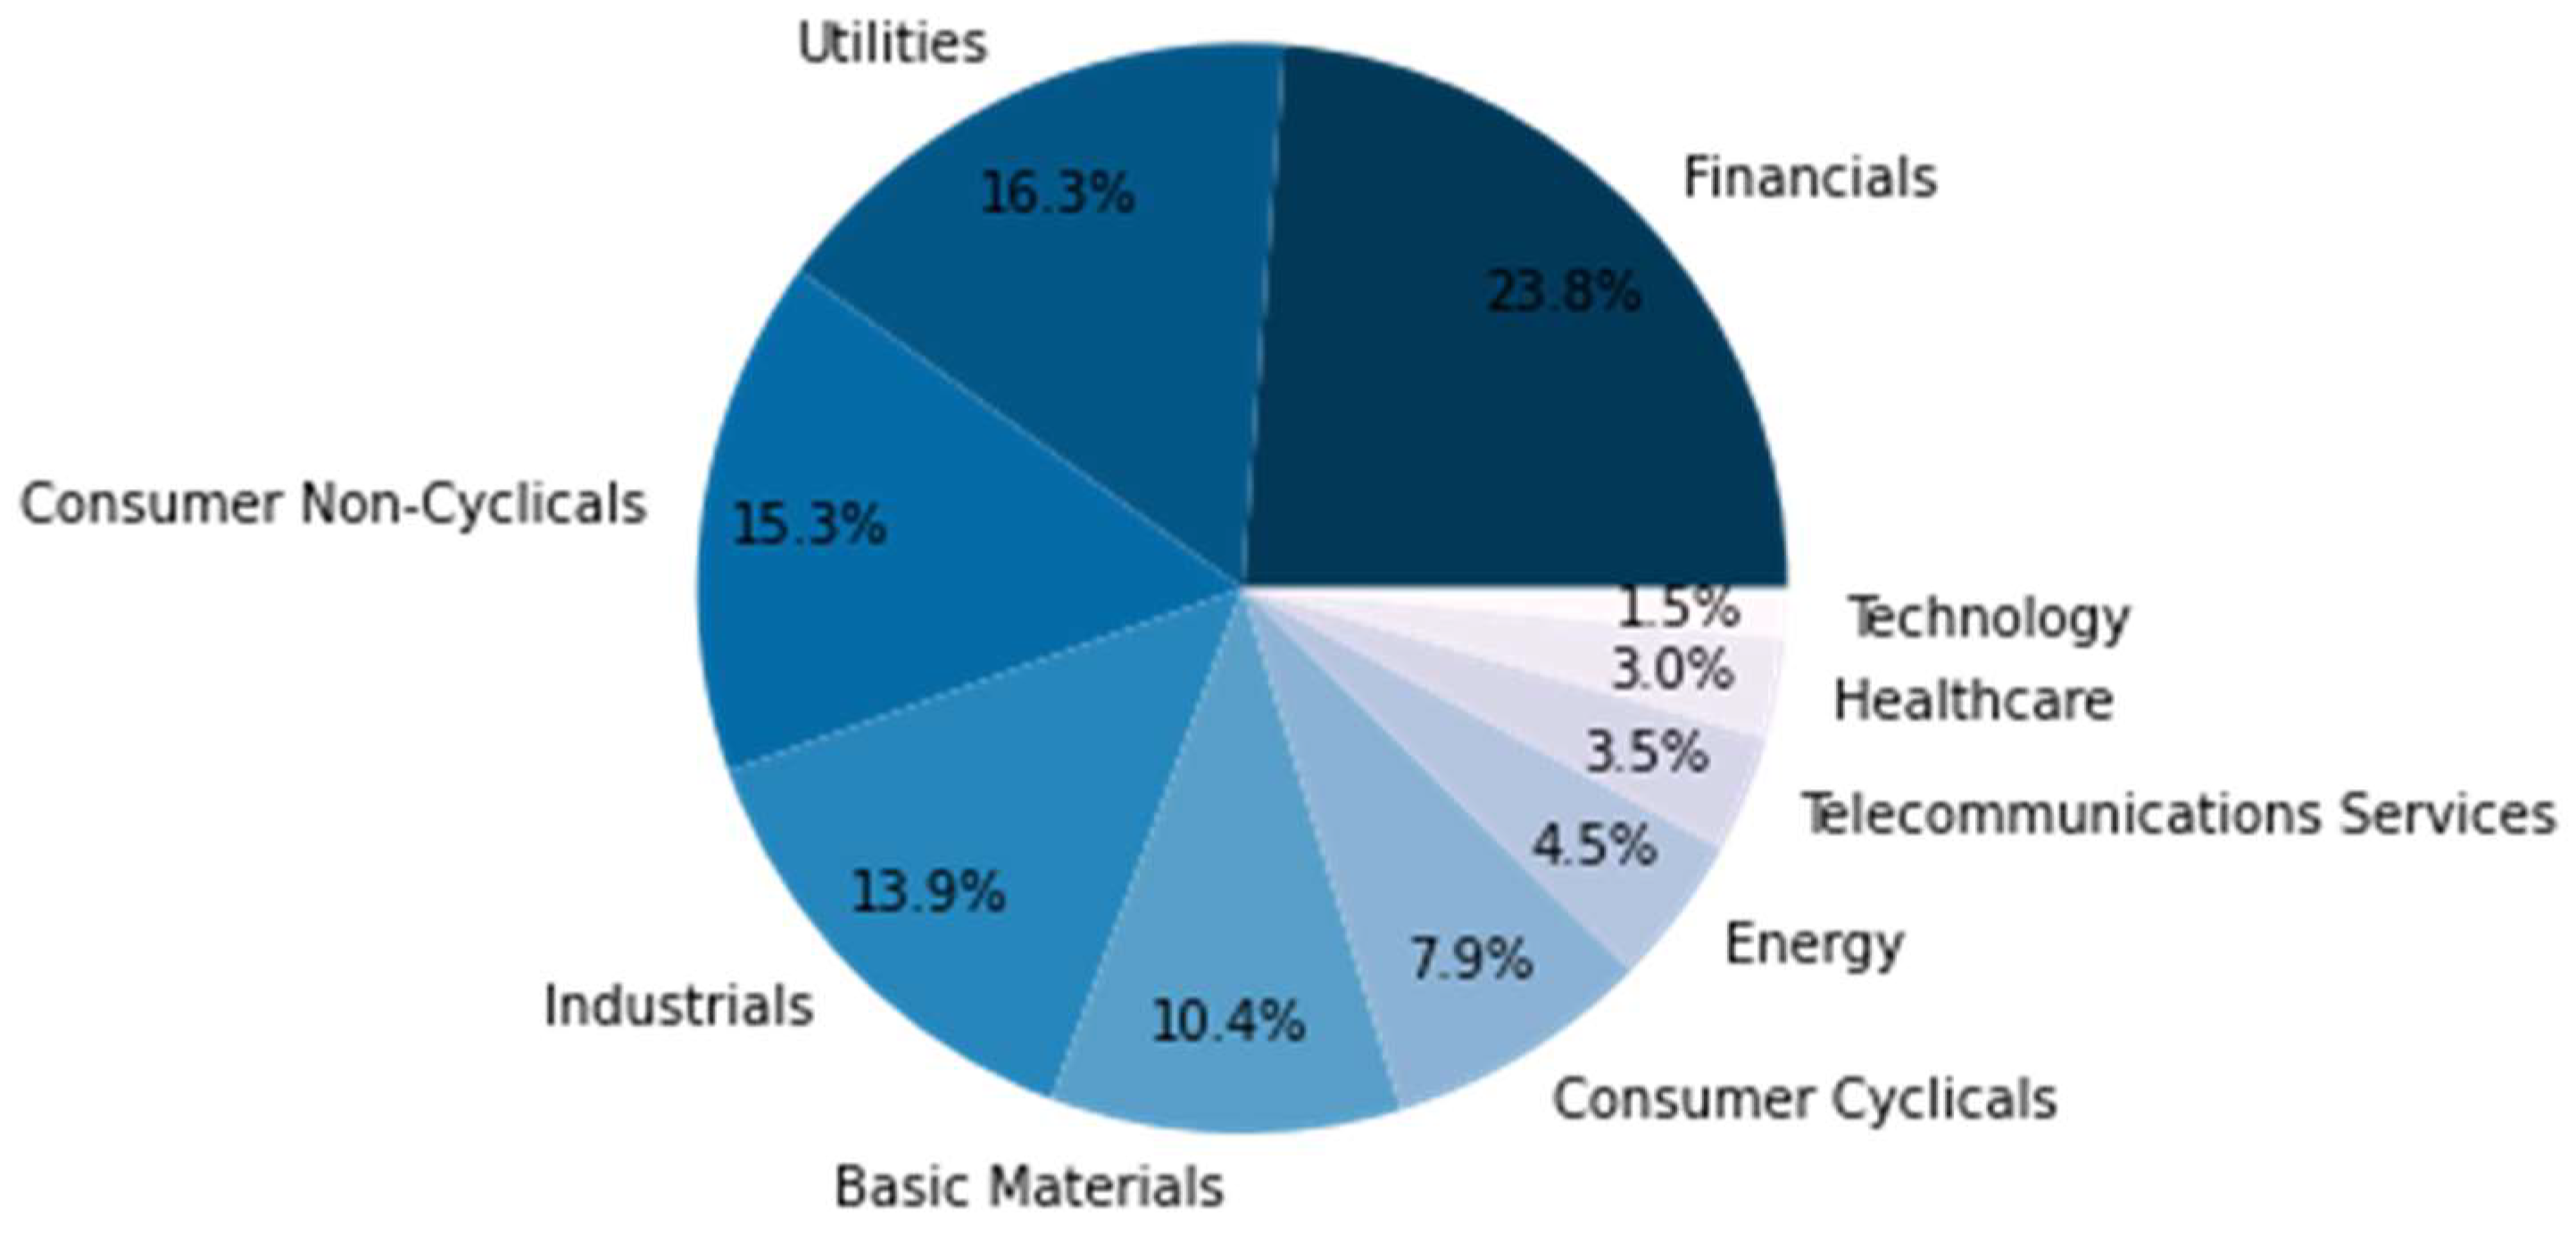
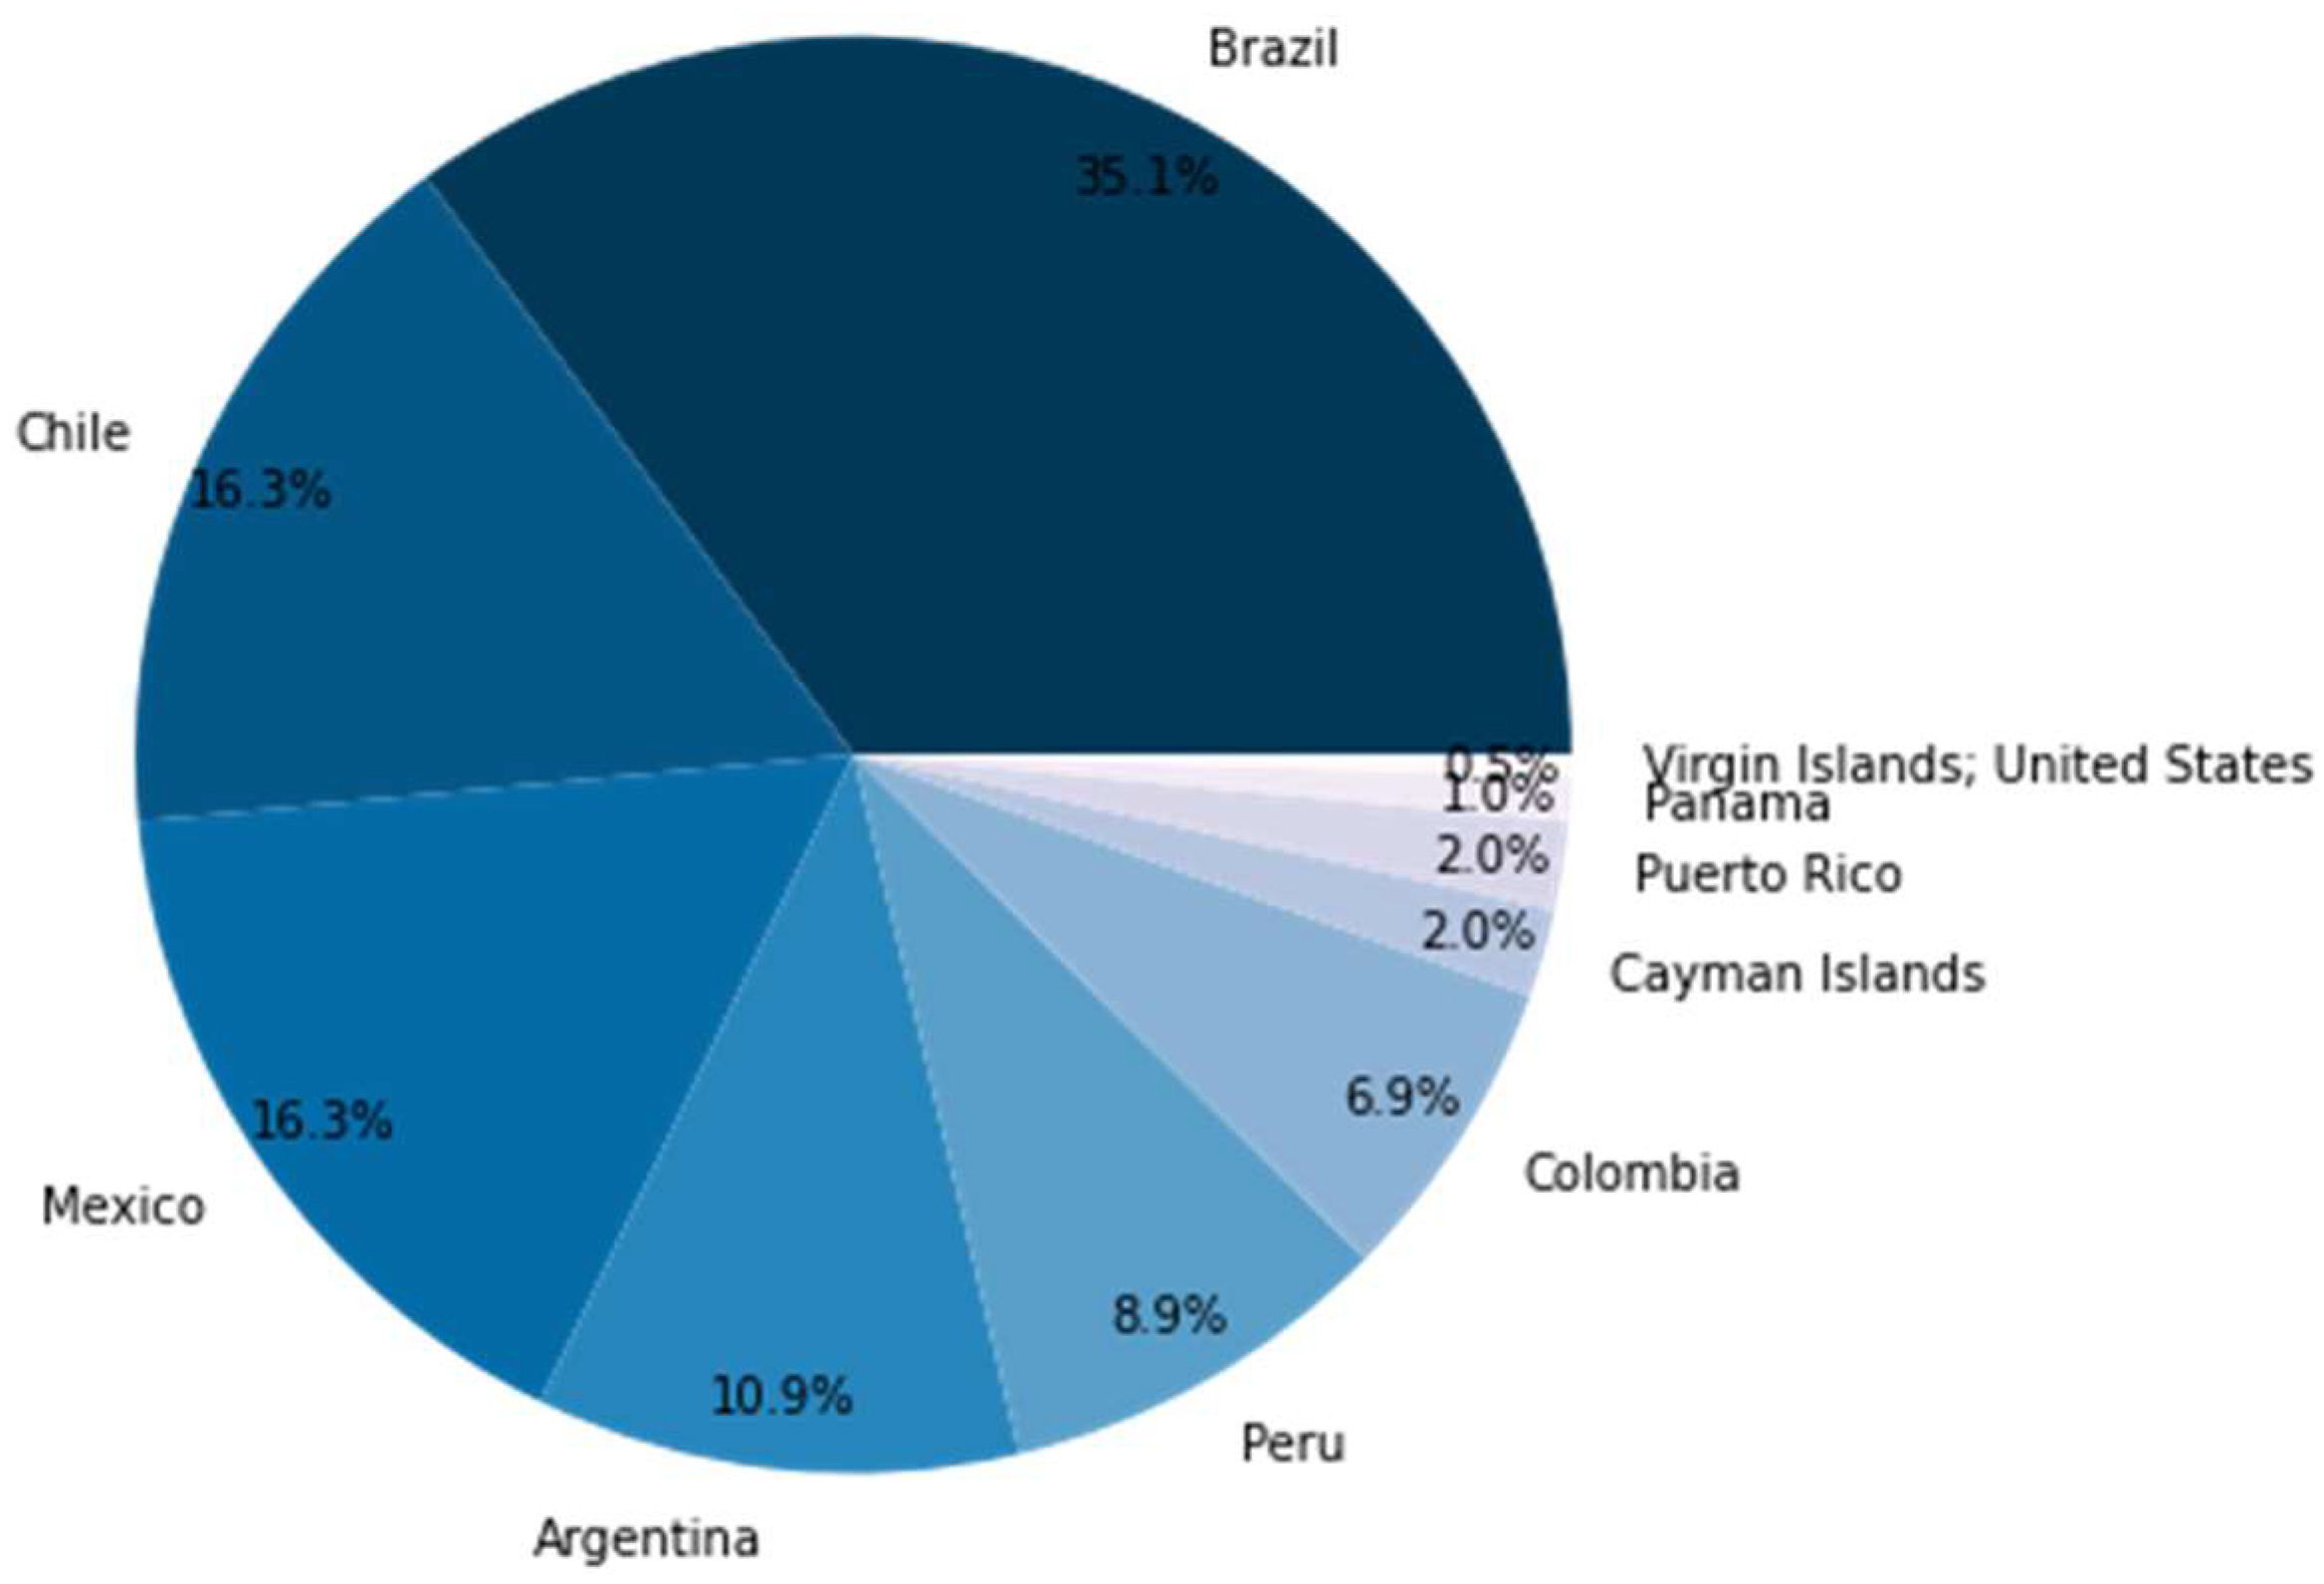
3. Data and Variables

Dependent variable: the variable of interest is the cost of capital. The cost of capital is calculated as the weighted average cost of financing an enterprise through debt, equity, and preferred shares.
Independent variables: the present study uses the ESG score calculated by Thomson Reuters Refinitiv, based on publicly reported information. It contains firm-level measures grouped into ten categories that reformulate the three pillar scores of ESG and the final ESG scores, reflecting a firm’s ESG performance, commitment, and effectiveness [45].
The impact of each one of the three ESG Pillar scores is also studied. The Environmental Pillar score covers a firm’s actions related to environmental responsibility, including resource use, emissions, and innovation. The Social Pillar score reflects a firm’s commitment to the community—where it operates and all areas of its supply chain—covering the workforce, human rights, community, and product responsibility. The governance score measures the degree to which all processes and systems of a firm ensure that its workers and management act in the best interests of its shareholders by providing for long-term operations, including management, shareholders, and CSR strategy [10].
Control variables: to define the variables that can significantly impact the cost of capital, we reviewed the literature to identify variables mainly used as control variables. The selected variables and their literature sources are shown in Table 1. First, we include firm size, measured by the natural logarithm of total assets (TA), and firm risk [46]. Second, we use return on assets (ROA) to measure firms’ profitability [15]. Moreover, we include the financial leverage ratio (LR), which is calculated as total debt divided by TA, to model the effects of capital structure decisions on firms’ cost of capital [47]. As a natural logarithm, the market-to-book ratio is used to proxy for both the distress risk and the level of firms’ growth opportunities [40,41].

Data Sources

Data were extracted from Thomson Reuters’ ESG database using Datastream, which provides a comprehensive source of data about ESG issues, covering approximately 70% of the world market capitalization. This data set contains financial information from public information sources collected and audited by ESG specialists for annual and CSR reports of firms worldwide [45].
The initial data set consists of 344 firms from LatAm countries, including Argentina, Brazil, Chile, Colombia, Cayman Islands, Virgin Islands, Panama, Peru, Puerto Rico, and Uruguay. Records are available from 2012 to 2019. Data from 2012 to 2016 were excluded due to the unavailability of information. Thus, the study period is from 2017 to 2019, consistent with firms’ growing interest in recent years to incorporate ESG issues into their corporate strategy. Moreover, 119 firms that did not disclose financial, environmental, social, and corporate governance information or provide sufficient data in the given years were excluded.
As a result, a longitudinal database consisting of 202 firms was obtained. Some of examples of firms under consideration are Petroleo Brasileiro SA Petrobras, JBS SA, America Movil SAB de CV, Grupo Bimbo SAB de CV, Falabella SA, Ecopetrol SA, Almacenes Exito SA, Telecom Argentina SA, InRetail Peru Corp, Avianca Holdings SA, Herbalife Nutrition Ltd., and Triple-S Management Corp. There are values for each variable considered in the study period, resulting in 606 observations distributed in the economic sectors shown in Figure 3. Financials (23.8%), utilities (16.3%), non-cyclical consumption (15.3%), and industrial (13.9%) sectors represent more than 60% of the firms.
Regarding the country in which the firms’ headquarters are located, 35.1% are in Brazil, 16.3% in Chile and Mexico, 10.9% in Argentina, 8.9% in Peru, 6.9% in Colombia, 2.0% in the Cayman Islands and Puerto Rico, 1.0% in Panama, and 0.5% in the Virgin Islands, as shown in Figure 4. Despite these results, the prominent characteristic of Brazil, Chile, and Mexico is the development of their capital markets.

4. Empirical Results

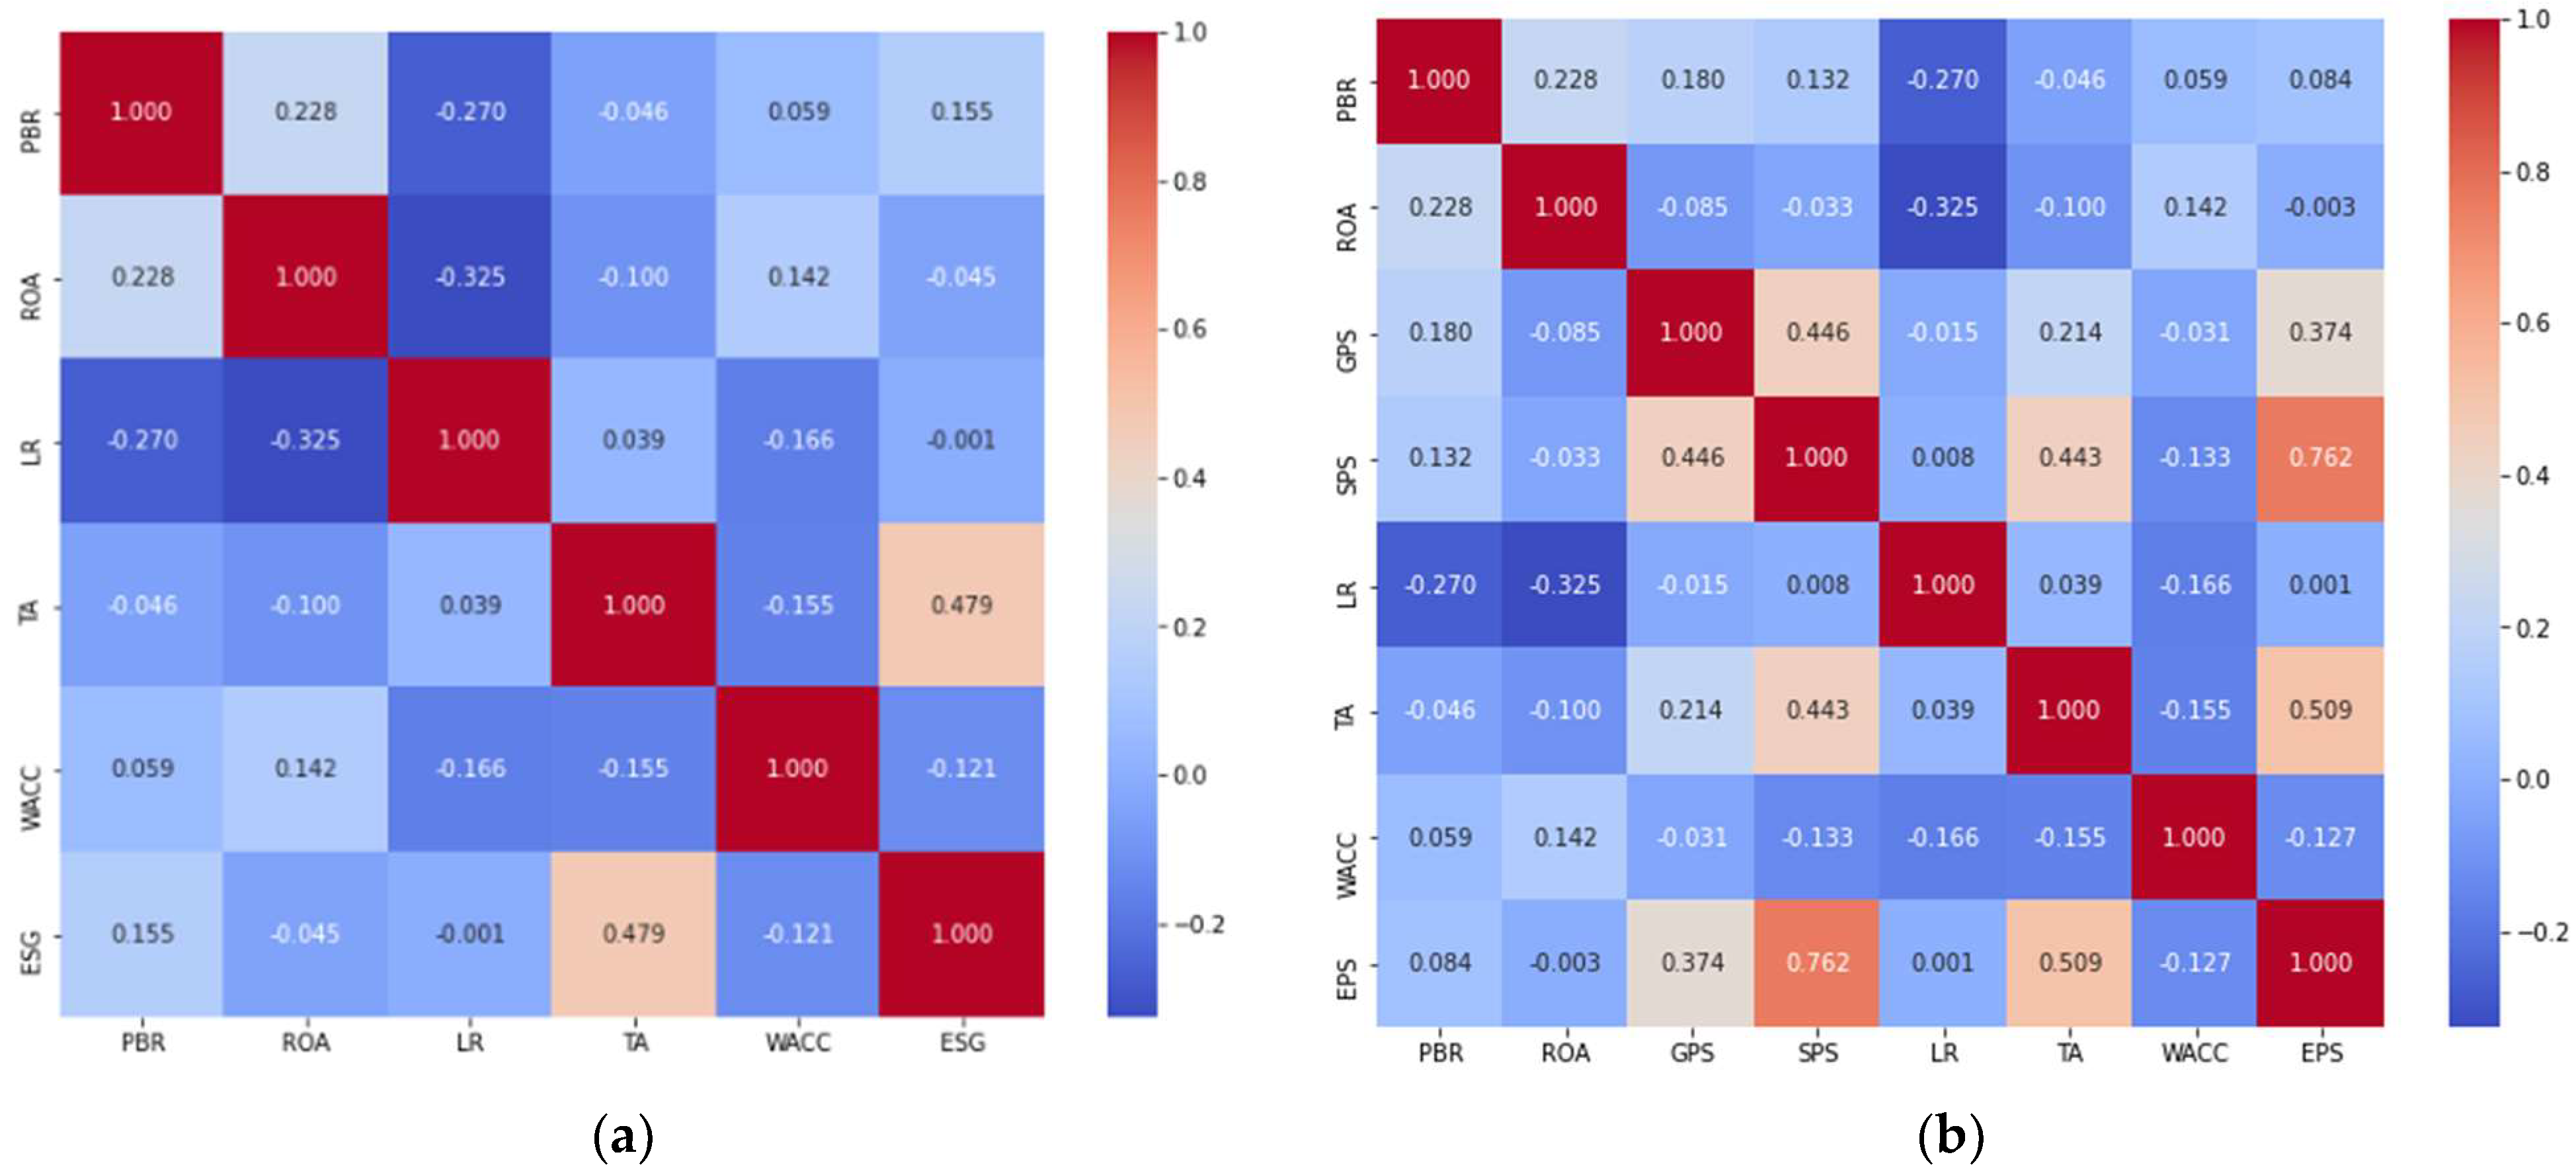
4.1. Descriptive Statistics

The descriptive statistics are presented in Table 2. Financial leverage, profitability, and firms’ growth opportunities have the highest coefficient of variation, suggesting significant differences within the firms due to the periods or economic sectors.
The average ESG score is 48.937, representing a C+ grade in the Refinitiv classification. According to Ref. [45], this score indicates a satisfactory relative ESG performance and a moderate degree of openness in publicly available ESG data. A firm’s highest grade is an A grade, implying an excellent relative ESG performance and a high degree of transparency in publicly reporting ESG data. Regarding the three ESG Pillar scores, Governance Pillar has the highest average score for LatAm firms (9a B grade), indicating good performance. The Environmental and Social pillars have the lowest values (C grade). These scores suggest that there is still much work to improve ESG levels in LatAm firms.
The correlation matrix of the variables in the model is presented in Figure 5. Because the data are time-series and cross-sectional, it is impossible to draw an accurate conclusion by considering only correlation effects. However, specific patterns can be inferred as a tool to understand the results better. The estimations do not show signs of collinearity among the independent variables due to low correlation coefficients. Among all the correlations with ESG, firm size, measured as the natural logarithm of TA, is the strongest, suggesting a positive relationship between these two variables. Moreover, in each of the pillar scores of ESG, this relationship is decisive.

4.2. Construction of the Model

To evaluate the hypotheses, two static panel data models were estimated. As shown in Figure 2, the first model examines the relationship between the cost of capital of the set of firms with their overall ESG score. The second model analyses the relationship between the cost of capital and each of the individual ESG pillar scores.
To select the appropriate panel model for the data, we first conducted a Breusch–Pagan Lagrangian test. We used this test to determine whether to use pooled OLS or random effects (RE) models. The null hypothesis in the LM test is that the variances between entities are zero. There are no significant differences between units (i.e., no panel effect). According to the results shown in Table 3, we rejected the null hypothesis with a significance of 5%. We concluded that the assumptions for running a pooled OLS regression model were not met.
Subsequently, we applied the Hausman test to determine the appropriateness of the method used to estimate our model. According to [50], the critical issue in deciding whether to use fixed effects (FE) or random effects (RE) is whether we can plausibly assume the FE method is uncorrelated with all covariates. Following what [51] stated, the null hypothesis of this test implies that the preferred model is RE. Moreover, rejecting the null hypothesis establishes that the FE method is selected.
According to Table 3, as the null hypothesis is rejected, under a significance level of 5%, the RE model will violate the Gauss–Markov theorem and end up with biased and inconsistent estimates. Therefore, we applied an FE model, which is unbiased and consistent. According to [52], “the key insight for the FE model is that if the unobserved variable does not change over time, then any changes in the dependent variable must be due to influences other than these fixed characteristics” (p. 289). In our model, “firm” represents the entities or panels (i), and “year” represents the time variable (t). To control the impact of the macroeconomic changing conditions on all firms, we included time dummy variables for 2018 and 2019.

4.3. Model Results

This section employs the Fixed Effect model estimators to present the results. We estimated both models using a panel ordinary least squares (OLS) algorithm that includes entity effects, which controls for factors that differ across entities but are constant over time. Moreover, we controlled for constant variables across entities that varied over time by including time-fixed effects. Additionally, clustered covariance of the entities was used to address correlation across time.

4.3.1. ESG Overall Performance and Cost of Capital

According to Table 4, all the variables included, except profitability (ROA), are statistically significant, at least at the 10% level, against a two-sided alternative. Regarding the joint F-test for the significance of all the variables, we get a p-value of approximately zero (0.0000). Thus, our variables are jointly significant, although the ROA is individually insignificant. The R-squared given in Table 3 is based within the transformation. It is interpreted as the time variation in the dependent variable, which implies that 40.13% is explained by the time variation in the explanatory variables.
Regarding the relationship of interest, the overall ESG score negatively influences the cost of capital. Thus, holding other variables constant, for a unit increase in the overall ESG score, the cost of capital is expected to decrease by 0.0006.
Interestingly, the estimated effect of the firm size (natural logarithm of TA) is substantially smaller than the ESG effect. For a 1% increase in a firm’s size, the cost of capital is expected to increase by 0.00006439 (0.0149 × log(1.01)), ceteris paribus.
However, the firms’ growth opportunities coefficient (measured as the natural logarithm of the market-to-book ratio) shows that for a 1% increase in a firm’s growth opportunities, the cost of capital is expected to decrease by 0.0001387 (0.0321 × log(1.01)), holding all other variables constant. Finally, LR has a negative impact on the cost of capital. Specifically, holding all other factors constant, a unit increase in LR will decrease the cost of capital by 0.0017. Regarding the time dummy variables, we observe a positive impact on the contextual conditions in 2018 and a negative impact on the conditions in 2019. In addition, the error term includes only things that vary over time.

4.3.2. ESG Pillar Scores and Cost of Capital

Table 4 presents the model results for the ESG pillar scores using the same control variables. The model has a within R-squared of 40.44%, which is a slight improvement in the percentage variation in the dependent variable explained by the time variation in the explanatory variables. Regarding the joint F-test for the significance of all nine variables, we obtained a p-value of approximately zero (0.0000). Therefore, our group of variables is jointly significant, although ROA, Social Pillar Score (SPS), and Environmental Pillar Score (EPS) are individually insignificant.
As mentioned before, the Social and Environmental pillar scores are not statistically significant in explaining the dependent variable. By contrast, the Governance pillar score shows a significant and negative relationship with the independent variable. For a unit increase in the overall GPS score, the cost of capital is expected to decrease by 0.0003, holding other variables constant. Similar to the earlier results, the estimated effect of firm size (natural logarithm of TA) is substantially smaller than the previous variable. For a 1% increase in a firm’s size, the cost of capital is expected to increase by 0.00006309 (0.0146 × log(1.01)), ceteris paribus.
Firms’ growth opportunities coefficient (measured as the natural logarithm of the market-to-book ratio) shows that for a 1% increase in a firm’s growth opportunities, the cost of capital is expected to decrease by 0.0001395 (0.0323 × log(1.01)), holding all other variables constant. Finally, the results confirm that LR has a negative impact on the cost of capital. Specifically, holding all other factors constant, a unit increase in financial leverage will decrease the cost of capital by 0.0017. Finally, regarding the time dummy variables, there is a positive impact on the contextual conditions in 2018 and a negative impact on the conditions in 2019. The error term includes only variables that change over time.
The initial hypothesis of a negative relationship between ESG and cost of capital (H1) is supported. In the second regression, the negative relationship between the Governance pillar score and cost of capital (H2.3) is also supported. A comparison of the magnitude of the impacts between ESG and GPS shows that the individual influence of the GPS pillar score is superior to the effect of all the ESG Pillar scores combined. Moreover, we could not find sufficient evidence to support hypotheses H2.1 and H2.3 since the relationships between the cost of capital and EPS and SPS variables are not statistically significant. It would be vital for further research on this topic to explore the relationship between these ESG pillar scores and the cost of capital.

5. Discussion

We examined the relationship between overall ESG scores and the cost of capital in LatAm firms. As we reviewed in Section 2, studies on sustainability have reported that there is a significant and negative impact of sustainable practices on the cost of capital or any of its pillars [13,27,38,39]. Along the same line, we found that LatAm firms with higher ESG scores benefit from a lower cost of capital. Based on our results, our findings corroborate literature claims that firms that praise sustainability have a higher valuation and a lower risk.
There may be some valid arguments for explaining why sustainability could reduce the cost of capital. On one hand, as found by [18,25], investors are interested in managing sustainability issues in the firms they invest in. Managers who do not deal with environmental, social, and governance issues are expected to undergo restricted access to private equity with a higher cost of capital. Showing the evaluations of this kind of matter to the market would mean better access to capital. On the other hand, higher ESG scores could be explained by regulations in the market that lead to better sustainable practices. This would have a negative effect on systemic risk (i.e., less risk), translating into lower costs of capital. If sustainability reduces the cost of capital, then sustainable firms may be counter-cyclical. It would be interesting to see whether this kind of situation could happen in the context of LatAm markets.
Secondly, we examined the relationship between each ESG pillar score and the cost of capital in LatAm firms. We found evidence that there is a negative relationship between the Governance Pillar score and the cost of capital. In other words, our results highlight the contribution of Governmental practices to lowering the cost of capital. Our results agree with [43], who emphasizes the importance of improving corporate governance to achieve an appropriate balance between sustainability, competitiveness, productivity, and financial and non-financial performance.
Access to equity information has improved over the past decade, and as a result, firms have become more transparent. Following the advent of the financial scandals that shattered the business world, the impact of ESG on the cost of capital has gained interest. Therefore, a corporate government that shows commitment and improvement of transparency and accountability within existing systems will be recognized by stakeholders. Furthermore, as found by Ref. [38], ESG issues impact reputation, and Ref. [41] showed that they are related to changes in the cost of capital. With this in mind, there could be a situation where market risk increases due to a political or economic crisis; therefore, reputation is affected. This could be due to possible immoral or inadequate governance actions in response to the situation mentioned. If that were the case, firms with sound governance policies (i.e., higher scores on the Governance Pillar score) would be considered less risky and, thus, have a lower cost of capital.
Regarding the effect of the environmental and social scores, we did not find statistical evidence of a relationship between them and the cost of capital in LatAm countries. However, it is vital to continue the research on the possible relationship between pillar scores and the cost of capital to disseminate better the effects of aligning social and environmental aspects with a company’s core business. Thus, firms will be able to identify new business opportunities leading to an increase in corporate value.
As discussed in Section 3, we included four variables that, according to the literature, could significantly impact the cost of capital and, therefore, be used as control variables. The statistical results show that three of these four variables significantly affect the cost of capital. The results also show a negative and significant relationship between the financial leverage ratio and the cost of capital, implying that capital structure decisions inherently affect the firms’ cost of capital. The control variable, denoted as the natural logarithm of the market-to-book ratio, also shows a negative and significant relationship with the cost of capital, which indicates that the cost of financing decreases for a firm with higher growth opportunities and lower distress risk.
On the other hand, differently from what was performed by [15], the ROA does not show a significant relationship with the cost of capital in our model.
Overall, it is not clear-cut which mechanisms lead to the relationships found between ESG scores and the cost of capital. Some thoughts were discussed during this section, but there can be many different sources that can explain them. These open the door to a broad research field that will drive us to understand what markets are most valuable regarding sustainability practices. However, there is also the opportunity to find which other issues may have a chance to be more valued both by the firms and investors to fulfill their objectives while contributing to a more sustainable society.

6. Conclusions

The relationship between the cost of capital and the ESG Pillar scores has not been extensively explored, especially in emerging markets. Therefore, we fill this research gap by studying the relationship between ESG Pillars scores and the cost of capital in LatAm.
This paper makes several contributions to the existing literature. First, one remarkable finding of the present study is that the empirical results, which are based on the FE regression model, indicate that the overall ESG score is negatively related to the cost of capital of LatAm firms. From the firms’ perspective, this relationship suggests that the greater the ESG practice, the lower the economic price of the firm for attracting capital to the firm. Second, since ESG scores are derived from three pillars—Social, Governance, and Environmental—we also examine the individual effects of each pillar score on the cost of capital. From this analysis, we find that governance practices explain the negative relationship between ESG scores and the cost of capital. This indicates that the increase in transparency about internal processes and governance entities can be an essential driver of value creation for firms and higher investor confidence. Thus, based on these results, executives of LatAm firms can direct part of their decisions toward the adoption of more efficient and sustainable ESG practices, especially corporate governance. These actions would allow for increased visibility and stakeholder recognition. There are also implications for managers and policymakers.
Finally, researchers and professionals may use the present study’s findings to broaden the central aspects of ESG related to financial performance and cost of capital. Moreover, implementing incentives that highlight the importance and promote ESG practices would contribute to sustainability and the competitiveness of organizations in the region.
Despite the contributions of the present study, it has some limitations. First, only a limited sample of LatAm firms and years are considered. Because ESG scores were introduced recently, the number of firms in the region that have this information is restricted. However, to the best of our knowledge, this paper contributes to the body of knowledge and practice by analyzing the relationship between ESG scores and the cost of capital in LatAm. Second, data were obtained from secondary sources. Although the variables used are employed in the literature, it is advisable to use direct financial information from the firms. It would be interesting to conduct a future study where more firms from more countries are involved. The present results can be contrasted with others that employ variables from different sources of information.
Thus, to better understand the relationship between ESG scores and financial results, it is essential to analyze specific variables such as gas emission, board gender diversity, independent board members, sustainability compensation incentives, human rights, and workforce. These issues should be addressed in future research.

Author Contributions

A.G.R., J.M. and J.D.G.-R. conceived and designed the experiments, analyzed, and interpreted the data. P.A. and A.P. performed the experiments and interpreted the data. All authors have read and agreed to the published version of the manuscript.

Funding

This research received no external funding.

Data Availability Statement

The study data are available on special request from the corresponding author.

Acknowledgments

We would like to thank the editorial team and anonymous reviewers who contributed to improving this paper’s quality. They help us to improve the significance of the paper.

Conflicts of Interest

The authors declare no conflict of interest.

References

  1. United Nations. Transforming Our World: The 2030 Agenda for Sustainable Development; United Nations: New York, NY, USA, 2015; Volume 16301. [Google Scholar]
  2. Principles for Responsable Investment What is the PRI? About the PRI. 2022. Available online: https://www.unpri.org/about-us/about-the-pri (accessed on 16 March 2022).
  3. Yesuf, A.J.; Aassouli, D. Exploring synergies and performance evaluation between Islamic funds and socially responsible investment (SRIs) in light of the Sustainable Development Goals (SDGs). Heliyon 2020, 6, e04562. [Google Scholar] [CrossRef] [PubMed]
  4. Cesarone, F.; Luis Martino, M.; Carleo, A. Does ESG Impact Really Enhance Portfolio Profitability? Sustainability 2022, 14, 2050. [Google Scholar] [CrossRef]
  5. Jonsdottir, G.E.; Sigurjonsson, T.O.; Alavi, A.R.; Mitchell, J. Applying Responsible Ownership to Advance SDGs and the ESG Framework, Resulting in the Issuance of Green Bonds. Sustainability 2021, 13, 7331. [Google Scholar] [CrossRef]
  6. Camilo Mejía-Escobar, J.; David González-Ruiz, J.; Franco-Sepúlveda, G.; Becchetti, L.; Ciciretti, R. Current State and Development of Green Bonds Market in the Latin America and the Caribbean. Sustainability 2021, 13, 10872. [Google Scholar] [CrossRef]
  7. Dhaliwal, D.; Li, O.Z.; Tsang, A.; Yang, Y.G. Corporate social responsibility disclosure and the cost of equity capital: The roles of stakeholder orientation and financial transparency. J. Account. Public Policy 2014, 33, 328–355. [Google Scholar] [CrossRef]
  8. El Ghoul, S.; Guedhami, O.; Kwok, C.C.Y.; Mishra, D.R. Does corporate social responsibility affect the cost of capital? J. Bank. Financ. 2011, 35, 2388–2406. [Google Scholar] [CrossRef]
  9. Brammer, S.; Pavelin, S. Building a Good Reputation. Eur. Manag. J. 2004, 22, 704–713. [Google Scholar] [CrossRef]
  10. Duque-Grisales, E.; Aguilera-Caracuel, J. Environmental, Social and Governance (ESG) Scores and Financial Performance of Multilatinas: Moderating Effects of Geographic International Diversification and Financial Slack. J. Bus. Ethics 2019, 168, 315–334. [Google Scholar] [CrossRef]
  11. Petrakis, P.; Carayannis, E.; Kostis, P.; Aldowaish, A.; Kokuryo, J.; Almazyad, O.; Goi, H.C. Environmental, Social, and Governance Integration into the Business Model: Literature Review and Research Agenda. Sustainability 2022, 14, 2959. [Google Scholar] [CrossRef]
  12. Atan, R.; Alam, M.M.; Said, J.; Zamri, M. The impacts of environmental, social, and governance factors on firm performance: Panel study of Malaysian companies. Manag. Environ. Qual. Int. J. 2018, 29, 182–194. [Google Scholar] [CrossRef]
  13. Ng, A.C.; Rezaee, Z. Business sustainability performance and cost of equity capital. J. Corp. Financ. 2015, 34, 128–149. [Google Scholar] [CrossRef]
  14. Voluntary Nonfinancial Disclosure and the Cost of Equity Capital: The Initiation of Corporate Social Responsibility Reporting. Account. Rev. 2011, 86, 59–100. Available online: https://www.jstor.org/stable/29780225 (accessed on 17 February 2022). [CrossRef]
  15. Shad, M.K.; Lai, F.W.; Shamim, A.; McShane, M. The efficacy of sustainability reporting towards cost of debt and equity reduction. Environ. Sci. Pollut. Res. 2020, 27, 22511–22522. [Google Scholar] [CrossRef] [PubMed]
  16. Bernstsson, W. The Impact of ESG Score on Firm’s Cost of Capital and Riskiness; University of Gothenburg: Gothenburg, Sweden, 2019. [Google Scholar]
  17. Middha, D.; Shailesh Doshi, Y. Relationship between Esg and Financial Performance of Publicly Listed Firms on the s&p 500; Simon Fraser University: Burnaby, BC, Canada, 2019. [Google Scholar]
  18. Husted, B.W.; Sousa-Filho, J.M. de Board structure and environmental, social, and governance disclosure in Latin America. J. Bus. Res. 2019, 102, 220–227. [Google Scholar] [CrossRef]
  19. Moreno-Gómez, J.; Calleja-Blanco, J. The relationship between women’s presence in corporate positions and firm performance: The case of Colombia. Int. J. Gend. Entrep. 2018, 10, 83–100. [Google Scholar] [CrossRef]
  20. Lafuente, E.; Vaillant, Y. Balance rather than critical mass or tokenism: Gender diversity, leadership and performance in financial firms. Int. J. Manpow. 2019, 40, 894–916. [Google Scholar] [CrossRef]
  21. Waltman, L. A review of the literature on citation impact indicators. J. Informetr. 2016, 10, 365–391. [Google Scholar] [CrossRef] [Green Version]
  22. Marquez-Cardenas, V.; Gonzalez-Ruiz, J.D.; Duque-Grisales, E. Board gender diversity and firm performance: Evidence from Latin America. J. Sustain. Financ. Investig. 2022, 24, 2017256. [Google Scholar] [CrossRef]
  23. David González-Ruiz, J.; Camilo Mejia-Escobar, J.; Franco-Sepúlveda, G.; González-Ruiz, C.; Mejia-Escobar, J.D. Towards an Understanding of Project Finance in the Mining Sector in the Sustainability Context: A Scientometric Analysis. Sustainability 2021, 13, 10317. [Google Scholar] [CrossRef]
  24. Chen, D.; Jia, F.; Guo, J. A systematic review of current status and trends of mega-infrastructure projects. Ain Shams Eng. J. 2022, 13, 11. [Google Scholar] [CrossRef]
  25. Tamala, J.K.; Maramag, E.I.; Simeon, K.A.; Ignacio, J.J. A bibliometric analysis of sustainable oil and gas production research using VOSviewer. Clean. Eng. Technol. 2022, 7, 100437. [Google Scholar] [CrossRef]
  26. van Eck, N.J.; Waltman, L. VOSviewer Manual; Universiteit Leiden: Leiden, The Netherlands, 2020. [Google Scholar]
  27. Crifo, P.; Forget, V.D.; Teyssier, S. The price of environmental, social and governance practice disclosure: An experiment with professional private equity investors. J. Corp. Financ. 2015, 30, 168–194. [Google Scholar] [CrossRef]
  28. Yoon, B.; Lee, J.; Byun, R. Does ESG Performance Enhance Firm Value? Evidence from Korea. Sustainability 2018, 10, 3635. [Google Scholar] [CrossRef] [Green Version]
  29. Guenster, N. Performance Implications of SR Investing: Past versus Future. In Socially Responsible Finance and Investing: Financial Institutions, Corporations, Investors, and Activists; Wiley: Hoboken, NJ, USA, 2012; pp. 443–454. [Google Scholar] [CrossRef]
  30. Humphrey, J.E.; Lee, D.D.; Shen, Y. Does it cost to be sustainable? J. Corp. Financ. 2012, 18, 626–639. [Google Scholar] [CrossRef]
  31. DiSegni, D.M.; Huly, M.; Akron, S. Corporate social responsibility, environmental leadership and financial performance. Soc. Responsib. J. 2015, 11, 131–148. [Google Scholar] [CrossRef] [Green Version]
  32. Cajias, M.; Fuerst, F.; Bienert, S. Can investing in corporate social responsibility lower a company’s cost of capital? Stud. Econ. Financ. 2014, 31, 202–222. [Google Scholar] [CrossRef]
  33. Dienes, D.; Sassen, R.; Fischer, J. What are the drivers of sustainability reporting? A systematic review. Sustain. Account. Manag. Policy J. 2016, 7, 154–189. [Google Scholar] [CrossRef]
  34. Albers, C.; Günther, T. Disclose or not disclose: Determinants of social reporting for STOXX Europe 600 firms. Zeitschrift für Plan. Unternehm. 2010, 21, 323–347. [Google Scholar] [CrossRef] [Green Version]
  35. Fazzini, M.; Dal Maso, L. The value relevance of “assured” environmental disclosure: The Italian experience. Sustain. Account. Manag. Policy J. 2016, 7, 225–245. [Google Scholar] [CrossRef]
  36. Yu, M.; Zhao, R. Sustainability and firm valuation: An international investigation. Int. J. Account. Inf. Manag. 2015, 23, 289–307. [Google Scholar] [CrossRef]
  37. Miralles-Quiros, M.D.M.; Miralles-Quiros, J.L.; Arraiano, I.G. Sustainable Development, Sustainability Leadership and Firm Valuation: Differences across Europe. Bus. Strateg. Environ. 2017, 26, 1014–1028. [Google Scholar] [CrossRef]
  38. Martínez Ferrero, J. Effect of sustainable practices on capital costs and corporate reputation. Rev. Contab. Account. Rev. 2014, 17, 153–162. [Google Scholar] [CrossRef] [Green Version]
  39. Gupta, K. Environmental Sustainability and Implied Cost of Equity: International Evidence. J. Bus. Ethics 2018, 147, 343–365. [Google Scholar] [CrossRef]
  40. Bachoo, K.; Tan, R.; Wilson, M. Firm Value and the Quality of Sustainability Reporting in Australia. Aust. Account. Rev. 2013, 23, 67–87. [Google Scholar] [CrossRef]
  41. Martínez-Ferrero, J.; García-Sánchez, I.M. Sustainability assurance and cost of capital: Does assurance impact on credibility of corporate social responsibility information? Bus. Ethics A Eur. Rev. 2017, 26, 223–239. [Google Scholar] [CrossRef]
  42. Hussain, H.I.; Grabara, J.; Razimi, M.S.A.; Sharif, S.P. Sustainability of Leverage Levels in Response to Shocks in Equity Prices: Islamic Finance as a Socially Responsible Investment. Sustainability 2019, 11, 3260. [Google Scholar] [CrossRef] [Green Version]
  43. Gh Popescu, C.R. Corporate social responsibility, corporate governance and business performance: Limits and challenges imposed by the implementation of directive 2013/34/EU in Romania. Sustainability 2019, 11, 5146. [Google Scholar] [CrossRef] [Green Version]
  44. Olubukola, O.A. Adoption of International Financial Reporting Standard, Capital Structure and Profitability of Listed Firms in Nigeria. 2017. Available online: https://ibima.org/accepted-paper/adoption-of-international-financial-reporting-standard-capital-structure-and-profitability-of-listed-firms-in-nigeria-2/ (accessed on 17 February 2022).
  45. Refinitiv Environmental, Social and Governance (ESG) Scores. 2022. Available online: https://www.refinitiv.com/content/dam/marketing/en_us/documents/methodology/esg-scores-methodology.pdf (accessed on 17 December 2021).
  46. Fama, E.F.; French, K.R.; Lakonishok, J.; Penman, S.; Sinquefield, R.; Stulz, R. Size and Book-to-Market Factors in Earnings and Returns. J. Financ. 1995, 50, 131–155. [Google Scholar] [CrossRef]
  47. Vena, L.; Sciascia, S.; Cortesi, A. Integrated reporting and cost of capital: The moderating role of cultural dimensions. J. Int. Financ. Manag. Account. 2020, 31, 191–214. [Google Scholar] [CrossRef]
  48. Fama, E.F.; French, K.R.; Constan-Tinides, G.; Ferson, W.; George, E.; Harvey, C.; Lakonishok, J.; Sinquefield, R.; Stulz, R.; Zmijeweski, M. The Cross-Section of Expected Stock Returns. J. Financ. 1992, 47, 427–465. [Google Scholar] [CrossRef]
  49. Fama, E.F.; French, K.R. Common risk factors in the returns on stocks and bonds. J. Financ. Econ. 1993, 33, 3–56. [Google Scholar] [CrossRef]
  50. Wooldridge, J.M. Introductory Econometrics: A Modern Approach, 5th ed.; Cengage-Learning: South-Western, UK, 2013. [Google Scholar]
  51. Greene, W. Econometric Analysis, 8th ed.; Pearson: London, UK, 2018. [Google Scholar]
  52. Stock, J.; Watson, M. Introduction to Econometrics, 4th ed.; Pearson: London, UK, 2019. [Google Scholar]
Figure 1. Most studies about the relationship between sustainability and the cost of capital are based on bibliographic coupling. Source: Authors using VosViewer.
Sustainability 14 05012 g001
Figure 2. Research framework.
Sustainability 14 05012 g002
Figure 3. Data distribution by sector. Source: Authors based on data from Refinitiv Thomson Reuters.
Sustainability 14 05012 g003
Figure 4. Data distribution by the country of the firm’s headquarters. Source: Authors based on data from Refinitiv Thomson Reuters.
Sustainability 14 05012 g004
Figure 5. (a) Correlation matrix between ESG overall score and the explanatory variables. (b) Correlation matrix between ESG pillar scores and the explanatory variables.
Sustainability 14 05012 g005
Table 1. Financial variables and their literature.
Variable Denotation Measurement Literature Sources
Firm size TA Natural logarithm of total assets [46]
Profitability ROA Return on assets [15]
Financial leverage LR Total debt divided by total assets [48]
Firm’s growth opportunitiesPBR Natural logarithm of the market-to-book ratio [48,49]
Table 2. Descriptive statistics of model’s variables.
VariableMean Std. Dev.Min 25% 50% 75% Max CV
WACC 0.0890.0500.0210.0570.0730.1060.3380.562
ESG 48.93719.3426.70033.55252.06964.62689.5230.395
EPS 48.78123.5424.91527.99850.58067.99797.2460.483
GPS 50.38321.7006.27932.38352.42467.46492.2330.430
SPS 47.84323.9913.00227.16451.56966.55395.0140.500
PBR 0.5070.859−2.7430.0030.4831.0063.4811.694
ROA 0.0440.085−0.6960.0140.0380.0770.4661.932
LR 1.2233.6730.0000.1910.4870.98446.2403.003
TA 8.4091.5543.1287.4638.3809.51412.9800.185
Table 3. Model selection tests.
Statisticp-Value
Breusch–Pagan
Lagrangian test
18.1855 ***
(LM Statistic)
0.0027
Hausman test54.5311 ***
(Chi-squared)
0.0000
*** Significantly different from zero at 1% level.
Table 4. Fixed effects regressions result in the cost of capital.
Variable(1)(2)
Constant0.0065
(0.0614)
0.0129
(0.0615)
PBR−0.0321 ***
(0.0056)
−0.0323 ***
(0.0055)
ROA0.0328
(0.0252)
0.0315
(0.0250)
LR−0.0017 **
(0.0008)
−0.0017 *
(0.0009)
TA0.0149 *
(0.0080)
0.0146 *
(0.0080)
ESG−0.0006 **
(0.0003)
GPS −0.0003 **
(0.0001)
SPS −0.0000
(0.0002)
EPS −0.0003
(0.0002)
Year 20180.0143 ***
(0.0023)
0.0142 ***
(0.0023)
Year 2019−0.0075 ***
(0.0021)
−0.0076 ***
(0.0021)
R-squared0.40130.4044
F-statistic (robust)20.849 ***16.797 ***
Number of observations606606
Note: Numbers in parentheses are standard errors. * Significantly different from zero at 10% level. ** Significantly different from zero at 5% level. *** Significantly different from zero at 1% level.
Publisher’s Note: MDPI stays neutral with regard to jurisdictional claims in published maps and institutional affiliations.

