Article

A Comparison of Biosolids Production and System Efficiency between Activated Sludge, Moving Bed Biofilm Reactor, and Sequencing Batch Moving Bed Biofilm Reactor in the Dairy Wastewater Treatment

by
Rui Boavida-Dias
1,2,
João R. Silva
3,
Andreia D. Santos
3,4,
Rui C. Martins
1,4,
Luis M. Castro
3,4,5 and
Rosa M. Quinta-Ferreira
1,4,*
1
Department of Chemical Engineering, University of Coimbra, Rua Sílvio Lima, 3030-790 Coimbra, Portugal
2
Low Carbon & Resource Efficiency, R&Di, Instituto de Soldadura e Qualidade, 4415-491 Grijó, Portugal
3
Department of Chemical and Biological Engineering, Polytechnic of Coimbra, Rua Pedro Nunes, 3030-199 Coimbra, Portugal
4
CIEPQPF—Chemical Engineering Processes and Forest Products Research Center, Department of Chemical Engineering, University of Coimbra, 3030-790 Coimbra, Portugal
5
SiSus—Sustainable Industrial Systems Laboratory, Institute of Applied Research (i2A), Polytechnic of Coimbra, Rua Pedro Nunes, 3030-199 Coimbra, Portugal
*
Author to whom correspondence should be addressed.
Sustainability 2022, 14(5), 2702; https://doi.org/10.3390/su14052702
Submission received: 7 February 2022 / Revised: 20 February 2022 / Accepted: 22 February 2022 / Published: 25 February 2022
(This article belongs to the Special Issue Toxicity Assessment and Remediation of Industrial Wastewater)

Abstract

:
Dairy industry wastewater is rich in organic content, presenting a high biodegradability, and therefore biological treatments are widely employed. This study aimed to evaluate biosolids production in three systems: activated sludge (AS), movingbed biofilm reactor (MBBR), and sequencingbatch movingbed biofilm reactor (SBMBBR). Simulated dairy wastewater was used at different organic load rates (OLRs): 1.22, 2.87, and 5.44 gCOD L−1d−1. Besides biosolids production, COD, total carbon (TC), and total nitrogen (TN) removal efficiency was evaluated. Biosolids production was measured in the mixed liquor, carrier-adhered biomass, treated wastewater, and surplus sludge. The operational conditions were kept similar for the three systems, with a carrier filling ratio of 50% for MBBR and SBMBBR. The SBMBBR proved to have better performance in the removal efficiencies of COD, TC, and TN for all OLRs studied. The MBBR presented a similar COD and TC removal efficiency as the SBBR for the two highest OLRs (2.87 and 5.44 gCOD L−1d−1). Concerning biosolids production, the MBBR system produced less biomass and delivered the lowest amount of adhered biomass inside the carriers. The AS treatment generated the highest amount of sludge and offered the worst treatment capability for all OLRs evaluated.

1. Introduction

The European Union (EU) is the largest dairy exporter in the world, and milk demand should increase in the following years due to the anticipated valorization of fat milk. It is expected that EU milk production will reach around 162 million tons by 2031 [1]. EU milk production will need to comply with stringent environmental standards, which implies reducing pollutant emissions into the water environment. However, to reduce emissions, the dairy sector will have to resort to the most cost-efficient and reliable technologies. In this regard, comparing the production of biosolids (which are associated with increased operating costs) and the efficiency of treatment between conventional and alternative technologies can significantly define the best available option among biological treatments to provide the sustainable development of the dairy sector.
The dairy industry produces wastewater at many stages of the production process, from primary processing and separation of milk to manufacturing, packing, and distributing the final products [2,3]. Depending on the type of manufactured products, stage of production, and farm/factory size, the wastewater produced is generally composed of milk residues, fats, proteins, lactose and carbohydrates, detergents, and chemical reagents. Additionally, these types of effluents are characterized by significant variations in pH and compounds that may span a wide range of concentrations [3,4,5]. Dairy wastewater is characterized by high nutrient concentration and high levels of biological oxygen demand (BOD) and chemical oxygen demand (COD). Usually, BOD in dairy effluents ranges from 0.8 to 2.5 kg per ton of milk, while the COD level usually is 1.5 times the level of BOD [6]. In their work, Karadag et al. [2] indicated that COD concentrations in the dairy industry are usually between 2 and 6 g L−1, while they increase up to 10 g L−1 in milk-processing effluent. Dairy industries generate 1 to 3 m3 of wastewater per ton of milk processed. On average, wastewater discharge is 70% of the amount of freshwater used at the plant. However, the type of operation and final products influences the effluent characteristics and the amount of generated wastewater [7]. With the dairy industry growing in Europe-28 and increasing wastewater generation [8], it becomes necessary to access the best available options for its treatment. Due to its high biodegradability, biological treatments are one of the most suitable methods for dairy wastewater management, including processes such as aerated lagoons, anaerobic digester (AD), activated sludge (AS), moving bed biofilm reactors (MBBRs), and sequencing batch reactors (SBRs), among others [9].
Anaerobic systems have been applied to different wastewaters from the dairy industry. These systems allow for energy recovery and high waste stabilization [10]. However, even with high COD removal efficiencies between 75 and 90% [11,12,13,14], it is often suggested to employ a pos-aerobic system to achieve safe discharge limits, especially for nitrogen [11,12,15]. Both aerobic and anaerobic systems rely on different operational aspects, such as higher retention time (HRT), sludge retention time (SRT), operating temperature, pH, and biomass growth rate. When comparing the anaerobic with the aerobic processes, the first tend to suffer higher operational instability. Temperature variations, the presence of inhibitors such as ammonia, or volatile fat acids accumulation causing a pH drop hinder system efficiency [10]. Moreover, the higher retention time and maintenance costs of some AD reactor designs often lead to extensive use of the aerobic processes instead of the anaerobic [15].
The aerobic biological treatments present as a limitation the production of high amounts of sludge, which increases the cost of maintenance and sludge treatment [16]. In particular, the AS wastewater treatment process, which is widely employed worldwide as it allows for efficient biodegradation, is associated with high treatment costs due to sludge disposal and energy consumption [17]. Therefore, it is crucial to study alternatives to the conventional activated sludge system, aiming to minimize sludge production, thus, reducing the cost and the impacts of its handling. For instance, attached growth processes increase the biofilm surface area, increasing the volume of substrate able to be adsorbed from wastewater, improving the overall efficiency of the process [18]. Biofilm in the carriers might promote aerobic, anoxic, and anaerobic mechanisms, with the substrate limitation being responsible for the thickness of the biofilm [18,19,20]. This type of reactor opens a variety of positive perspectives for its recognized ability to oxidize carbon and nitrogen, for requiring a smaller reactor than an activated sludge system, for not requiring any sludge recycle, for the reduced costs combined with a smaller carbon footprint, lower requirement for settling volume and sludge formation, and for its biomass retention capacity in floating mobile plastic carriers [18,21,22,23,24,25].
The MBBR is a wastewater treatment technology in which the biomass grows on carriers that move freely in the water volume inside the reactor [21]. The MBBR allows upgrading performance and volumetric treatment capability in existing wastewater treatment plants with minimal additional costs and a reduced footprint [26]. The main characteristic of these systems is the biofilm growing on a protected area with different species of microorganisms coexisting in the carriers’ surface, enhancing protection and resilience to environmental conditions [19]. The treatment system does not require any sludge recycling, and only the surplus biomass should be separated, which constitutes a considerable advantage over the AS and SBR systems [21,27]. However, due to aeration and oxygen requirements of the carrier mixing, ensuring that formation of stagnant zones within the reactors does not occur is the main setback of this system. Under complete aerobic conditions, MBBR systems can be used for carbon oxidation, combined carbon oxidation and nitrification, or separate stage nitrification [21,23,28]. MBBR optimal performance should be based on pH, feed concentration, filling ratio (less than 70%), high HRT, optimum airflow rate, high surface area of carrier materials, microorganisms’ metabolic characteristics, and biofilm-forming potential. Nevertheless, the MBBR remains a valuable technology for wastewater treatment, reaching an efficiency above 98% for BOD and COD removal [29].
Another technology applied to treat wastewaters is the sequencing batch moving bed biofilm reactor (SBMBBR). This is a flexible and straightforward operation that merges the SBR and MBBR technologies. The combination benefits decentralized treatment as it decreases sludge production and increases the amount of effective biomass, even for lower-sedimentation sludges [30]. It is often preferable to increase treatment time, reducing the number of cycles per day, as it allows for better nitrogen removal efficiency and increases efficiency in the presence of high organic loads [31].
Activated sludge has been reported as an efficient and reliable system for COD removal [4]. Carta-Escobar et al. [32] obtained COD removal efficiencies between 72.1 and 81.0% and between 44.4 and 66.2% for organic load rates of 0.237 and 0.700 kg m−3 d−1, respectively. Since 1992, the MBBR has been studied for dairy wastewater treatment with results varying from 60 to 95% COD removal efficiency, mainly depending on OLR and HRT [33,34,35]. Total nitrogen removal has been overlooked for this type of system when working with dairy wastewater. Still, the denitrification efficiency caused by the biomass in the carriers is widely known, especially for polyethylene carriers [36,37]. SBR-type systems have been reported to be effective in treating dairy wastewater. COD, TN, TC, and phosphorous have successfully reached high removal efficiencies [38,39,40]. Thus, combining a conventional MBBR with a conventional SBR should provide higher removal capability and improve stability.
A similar study to the one presented by the authors has been performed by Khalaf et al. [41] who compared the performance of activated sludge and sequence-batch reactor systems for dairy wastewater treatment. The authors achieved high COD and NH3-N removal for an optimum temperature of 35 °C for all the four studied reactors. AS obtained 93.56% and 89.01% for COD and NH3-N removal, while a biofilm SBR achieved 97.79% and 93.22%, respectively. However, the authors overlooked sludge production and total nitrogen and carbon removal.
The present study was carried out to evaluate the potential that the MBBR and SBMBBR systems have to replace AS in the treatment of dairy wastewater. The evaluation was based on the total sludge production and the removal efficiency of chemical oxygen demand (COD), soluble total carbon (TC), and soluble total nitrogen (TN) of each system.

2. Materials and Methods

2.1. Materials

For this study, three laboratory-scale reactors made of Plexiglass with 3.5 L of working volume operated under the same conditions to appraise the performance in terms of carbon, nitrogen, and organic matter removal efficiency. The effluent used simulated dairy wastewater comprising dilutions of 1:80, 1:100, and 1:200, from low-fat milk. The initial biological sludge was obtained from a conventional AS domestic wastewater treatment station. The MBBR and SBMBBR were seeded with pre-inoculated carriers from the wastewater treatment plant of Arzila, Coimbra. The carriers used were the “Bioflow 9” made from high-density polyethylene with 9 mm diameter, 7 mm height, 800 m2 m−3 specific surface, specific biofilm surface area of 500 m2 m−3, and 145 kg m−3 of packing density. The filling fraction (FF) of carriers was set to be roughly 50% of the reactor working volume of MBBR and SBMBBR, setting up the carrier-specific surface area to 0.39 m2 and 0.49 dm3 effective carrier volume. The aeration of the reactors was made with a bubbling aerator, ensuring that the oxygen was oversupplied. Thus, dissolved oxygen was not a limiting factor in the reaction.

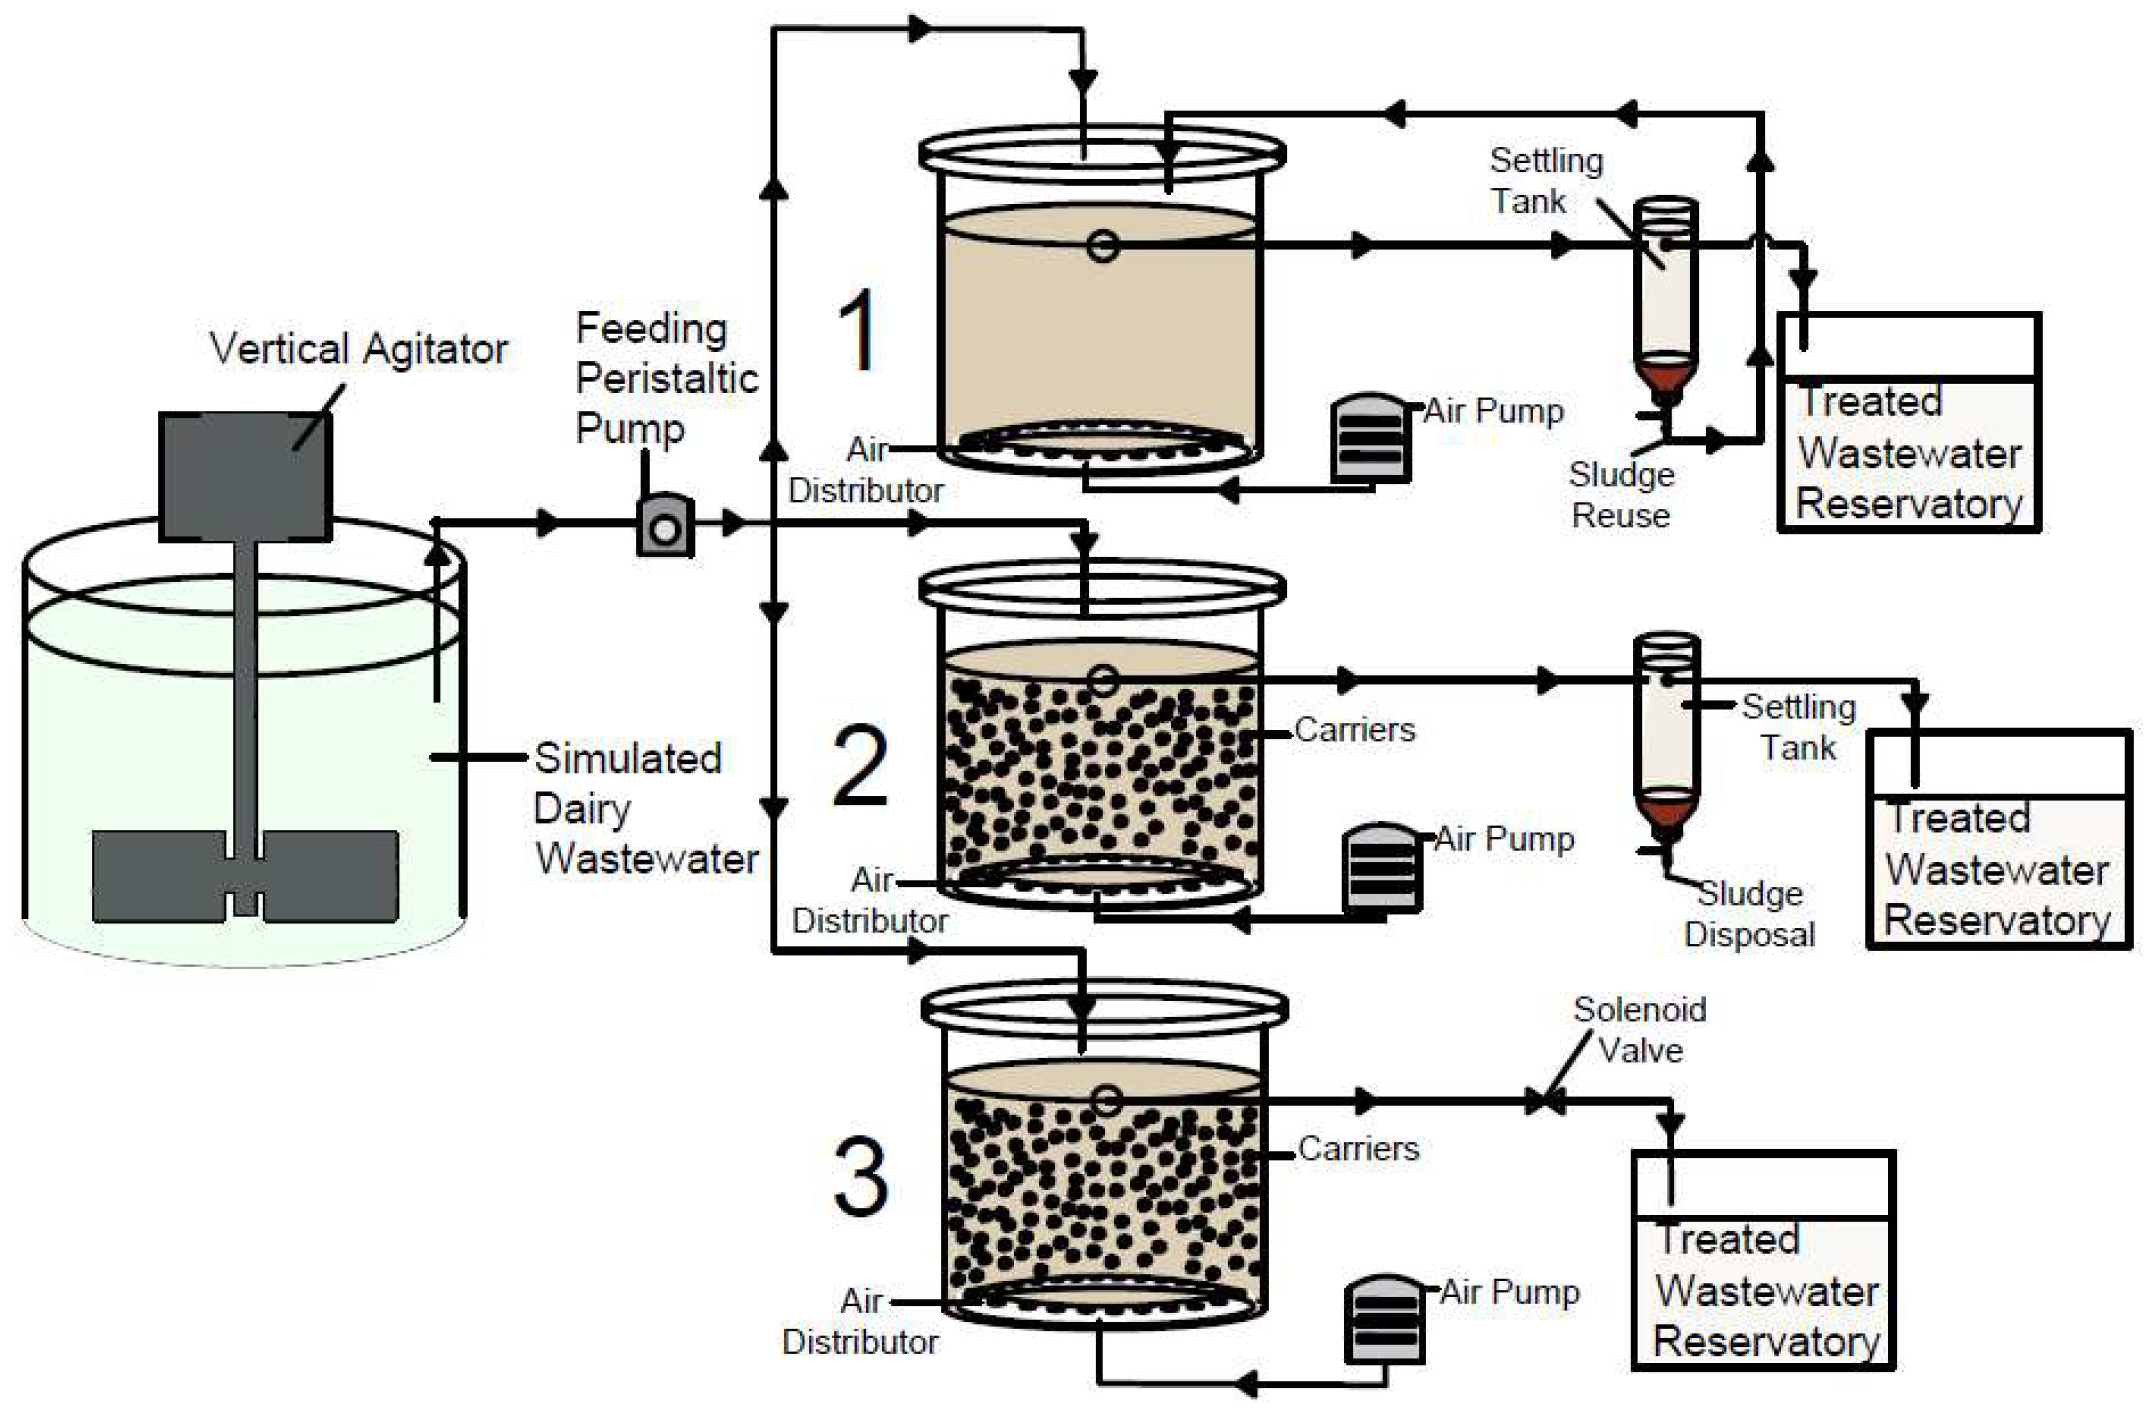
2.2. Experimental Setup

The three reactors were operated under similar conditions in three different configurations: AS, MBBR, and SBMBBR. They were inoculated with the same sludge volume (1.6 L) and tap water volume (2 L). A period of acclimatization for microorganisms’ adaptation lasted roughly two weeks, feeding 5 mL of milk every day, allowing the microbial communities to adapt to their new environment and acclimate to the synthetic dairy influent. The AS liquor sludge had an equivalent acclimatization period.
The experimental work was divided into three periods, with the influent loading rates presented in Table 1. The feed COD:N relation was between 10.0 and 12.8 for each stage, with effluent flow rate established at 7.2 L d−1 for each reactor, corresponding to a hydraulic retention time of 12 h. Initial suspended sludge concentration (MLSS) inside the reactor was 1015, 283, and 423 mgTSS L−1 for AS, MBBR, and SBMMBR, respectively.
Both AS and MBBR reactors had a sedimentation unit with a liquid volume estimated at 3 L. For SBMBBR, it is not necessary to have a settling tank since sedimentation occurs inside the reactor. The SBMBBR operated in 12 h cycles, 0.5 h for static filling, 8 h of aeration, 2.5 h of sedimentation, and 1 h of treated wastewater withdrawal. The MBBR and AS systems worked under an uninterrupted flow of oxygen. A schematic representation of the experimental work is presented in Figure 1. Sludge retention time (SRT) was dependent on the OLR. AS presented 6, 5, and 2 days, MBBR presented 1, 0.5, and 0.5 days, and SBMBBR presented 10, 0.5, and 1.5 days for OLR of 1.22, 2.87, and 5.44 gCOD L−1d−1, respectively.

2.3. Analytical Methods

Influent, effluent, and mixed-liquor samples were analyzed with respect to total chemical oxygen demand, soluble carbon and nitrogen, and suspended solids (SS). The solids adhered in the carriers were measured according to the methodology described by Oliveira [42]. Ten (10) carriers from the reactor were randomly removed, well mixed, and shaken by ultrasounds and manual removal in a volume of 250 mL of distilled water. The process was repeated to ensure the release/detach of the adhered solids. Carriers would be replaced in the same amount from a reactor kept operating under similar conditions. All the samples were placed in closed recipients and stored at about 4 °C when their immediate analysis was not possible.
Chemical oxygen demand (COD) was determined by the 5220 D method (closed reflux), whereas the total suspended solids (TSS) and volatile suspended solids (VSS) for mixed-liquor suspended solids (MLSS), treated wastewater, and excess sludge were analyzed using the 2540 B, D, and E methods [43]. Dissolved total carbon (TC) present in the water was measured by a nondispersive infrared detector (NDIR) after oxidative combustion, using Shimadzu TOC-VCPH/CPN Total Organic Carbon Analyzer and TOC-Control V software. Dissolved total nitrogen (TN) was measured by chemiluminescence, using Shimadzu Total N Measuring Unit TNM-1. BOD was measured with self-check OxiTop®-IDS Set 6.
The total amount of TSS and VSS comprised in the carriers was calculated based on the total number of plastic carriers in the bioreactors. The total sludge produced (Equation (1)) for each reactor was calculated by the sum of the masses of MLSS produced after each measurement, the excess sludge removed from the reactors to perform the characterization analysis and to maintain a regular operation, and the TSS present in the treated wastewater.
S l u d g e   P r o d u c e d   ( g / d ) = T S S r e a c t o r × V r e a c t o r + T S S t r e a t e d × V t r e a t e d + T S S e x c e s s   s l u d g e × V e x c e s s   s l u d g e

3. Results and Discussion

3.1. Organic Matter, Total Carbon, and Total Nitrogen Removal

A comparison of the removal efficiencies of TC, TN, and COD was performed for AS, MBBR, and SBMBBR regarding the influence of the system design on biosolids production and removal performance to understand how different loading rates would affect the reactors’ individual efficiency. In Figure 2, the average removal efficiencies for soluble COD, TC, and TN are presented with their associated standard deviation. The SBMBBR stands out as the most efficient for the tested parameters of the three studied systems at an OLR of 1.22 mgCOD L−1d−1.
Denitrification in an activated sludge process plays a major role in TN removal. The denitrification process is primarily carried out by heterotrophic bacteria, although autotrophic denitrifiers are also identified [20]. In an anoxic environment, the nitrate ion can be reduced by organic matter to nitrogen gas. Thus, the denitrification capacity is the amount of nitrate that can be removed per liter of influent. In a biologic reactor that is kept entirely aerobic, the denitrification will occur in the final settler, where an adequate environment for denitrification is established as soon as the oxygen is consumed [24]. The SBMBBR system has a higher concentration of bacteria in suspension than the MBBR, which might improve the TN treatment capability.
Moreover, SBMBBR aeration allows for nitrification, and the subsequent anoxic environment promotes denitrification. Since the SBMBBR had 6 h of the anoxic phase each day and higher microorganism growth, it might greatly influence TN removal. The anoxic phase is associated with greater TN removal, which increases further with MLSS growth [44,45]. Furthermore, biofilm-based systems can enhance nitrogen removal efficiency [46], with the SBMBBR combining the anoxic phase with the biofilm formed in the carriers. Therefore, another possible explanation for the SBMBBR’s high efficiency for TN removal at different organic loads might depend on the increased amount of biomass based upon attached growth in the carriers. The biofilm accumulation highly depends on the carrier’s surface roughness and more importantly on the specific surface area which is usually attributed to high organic removal [20].
Adding carriers as an attached growth medium improves nitrifying bacteria retention, which could also provide a longer sludge retention time [44,47]. This factor enables higher microbial resistance to environmental conditions and enhances the degradation of organic matter [18]. As for the MBBR, the nitrogen removal efficiency of the MBBR depends primarily on attached-growth biomass [44], with the attached biomass becoming more specific due to the lack of biomass recirculation [25]. The conventional AS system also increases TN removal efficiency for higher OLRs. However, it is less effective when compared with the other two systems. The same occurs with COD and TC for which AS showed lower average efficiency. The anoxic phase increases COD removal on an SBR reactor type. Kulikowska et al. [48] stated that higher COD removal efficiency was achieved in the SBR working with anoxic phases. Bazari [49] studied the influence of aeration time and MLSS concentration on COD removal in a conventional SBR. From this study, two major conclusions can be drawn for dairy effluents: aeration time is optimal after 5 h with a concentration between 1000 and 2500 mgO2 L−1 and that MLSS impacts treated wastewater COD, with higher concentrations between 6000 and 9000 mg L−1 improving COD removal, especially for lower times of aeration. In the present study, COD feed concentrations were similar, with MLSS present in the SBR being always lower than 6000 mg L−1, which was compensated by the 8 h aeration time, thus improving COD removal for lower MLSS. With increasing COD feed load, TN removal also increases for MBBR and AS systems, with SBMBBR efficiency being higher even for low organic loads. This fact indicates that organic load between 1.22 and 5.44 is a crucial aspect in TN removal for the MBBR and AS but not for the SBMBBR that presents a good TN removal capability, independently of the OLR. In Table 2, the average removal efficiencies for total COD, TC, and TN with the associated standard deviations are presented. SBBR stands out as the most efficient for the tested parameters of the three studied systems at an OLR of 1.22 mgCOD L−1d−1.
The analysis of the results presented in Figure 2 shows that all the proposed systems allow compliance with the discharge value for the organic matter (measured as COD) in industrial wastewater emission defined in Portuguese legislation (Decree-Law 236/98 of August 1) [50], which is 150 mgCOD L−1, except for AS with an OLR of 5.44 gCOD L−1d−1. Santos et al. [19] used dairy wastewater with COD concentrations of 600–800 mgO2 L−1 and 1100–1200 mgO2/L−1, in batch and continuous operation, to remove COD using an MBBR. For a carrier filling fraction of 40%, the authors achieved higher COD reductions than for 20% [27]. These results suggest that the biofilm formed in the carriers effectively improves COD removal.
In terms of total nitrogen, only the MBBR for OLR of 1.22 and SBMBBR for OLR of 1.22 and 2.87 gCOD L−1d−1 guarantee compliance with the limit value defined in the same legal diploma, which, for total nitrogen, is 15 mgN L−1. As stated before, the SBMBBR had high removal efficiencies due to the anoxic phase being promoted inside the reactor. Such high TN removal indicates that the carbon was sufficient for denitrification to occur [44]. Tsitouras et al. [30] studied two SBMMBR reactors in sequence, applied to cheese production wastewater, under different aeration conditions, for 16 h cycles, with K5 carriers. Particular interest for this study points to the one operating under aerobic and anoxic conditions, which achieved 97.3% COD and 58.8% TN removal efficiency. Even though COD removal was similar, TN removal efficiency was lower than the one achieved for the present study.
From Figure 2, one can perceive that for an OLR of 1.22 gCOD L−1d−1, the SBMBBR had the best average COD, TC, and TN removal. However, when the OLR increases to 2.87 and 5.44 gCOD L−1d−1, the MBBR and SBMBBR are very similar in performance regarding COD and TC parameters. TN was best removed in the SBMBBR at 2.87 gCOD L−1d−1, but similar to MBBR at 5.44 gCOD L−1d−1. Furthermore, it is interesting to notice that the AS system’s standard deviation is high compared to the other two, especially for 1.22 gCOD L−1d−1. The introduction of carriers seems to help stabilize the overall efficiency and removal rates of TN, TC, and COD. However, it is expected that for higher OLRs, MBBR process efficiency is adversely affected. The former is attributed to the increase of suspended biomass, in which case, it functions as a hybrid biofilm-activated sludge process than a pure biofilm reactor [26]. In fact, the settling phase in a sequencing-batch reactor is often regarded as more efficient in obtaining a higher quality supernatant than a continuous flow process [31].
These results permit us to conclude that the two alternative methods to the conventional AS system allow removal rates of organic matter and nitrogen that are similar or superior to the activated sludge system. Kalaf et al. [41] compared alternative biofilm reactors with conventional AS and SBR when treating dairy wastewater. Their findings led them to acknowledge that the introduction of carriers could increase the removal efficiencies and reduce the acclimatization period of the system. Furthermore, the biofilm systems performed better in terms of COD and NH3-N removal than the conventional reactors. The authors summarized that the SBR was the optimum treatment for dairy wastewater. Even though this is also true for the present research, with the SBR performing better in terms of TN, COD, and TC, the authors overlooked the biomass formation of the different systems.

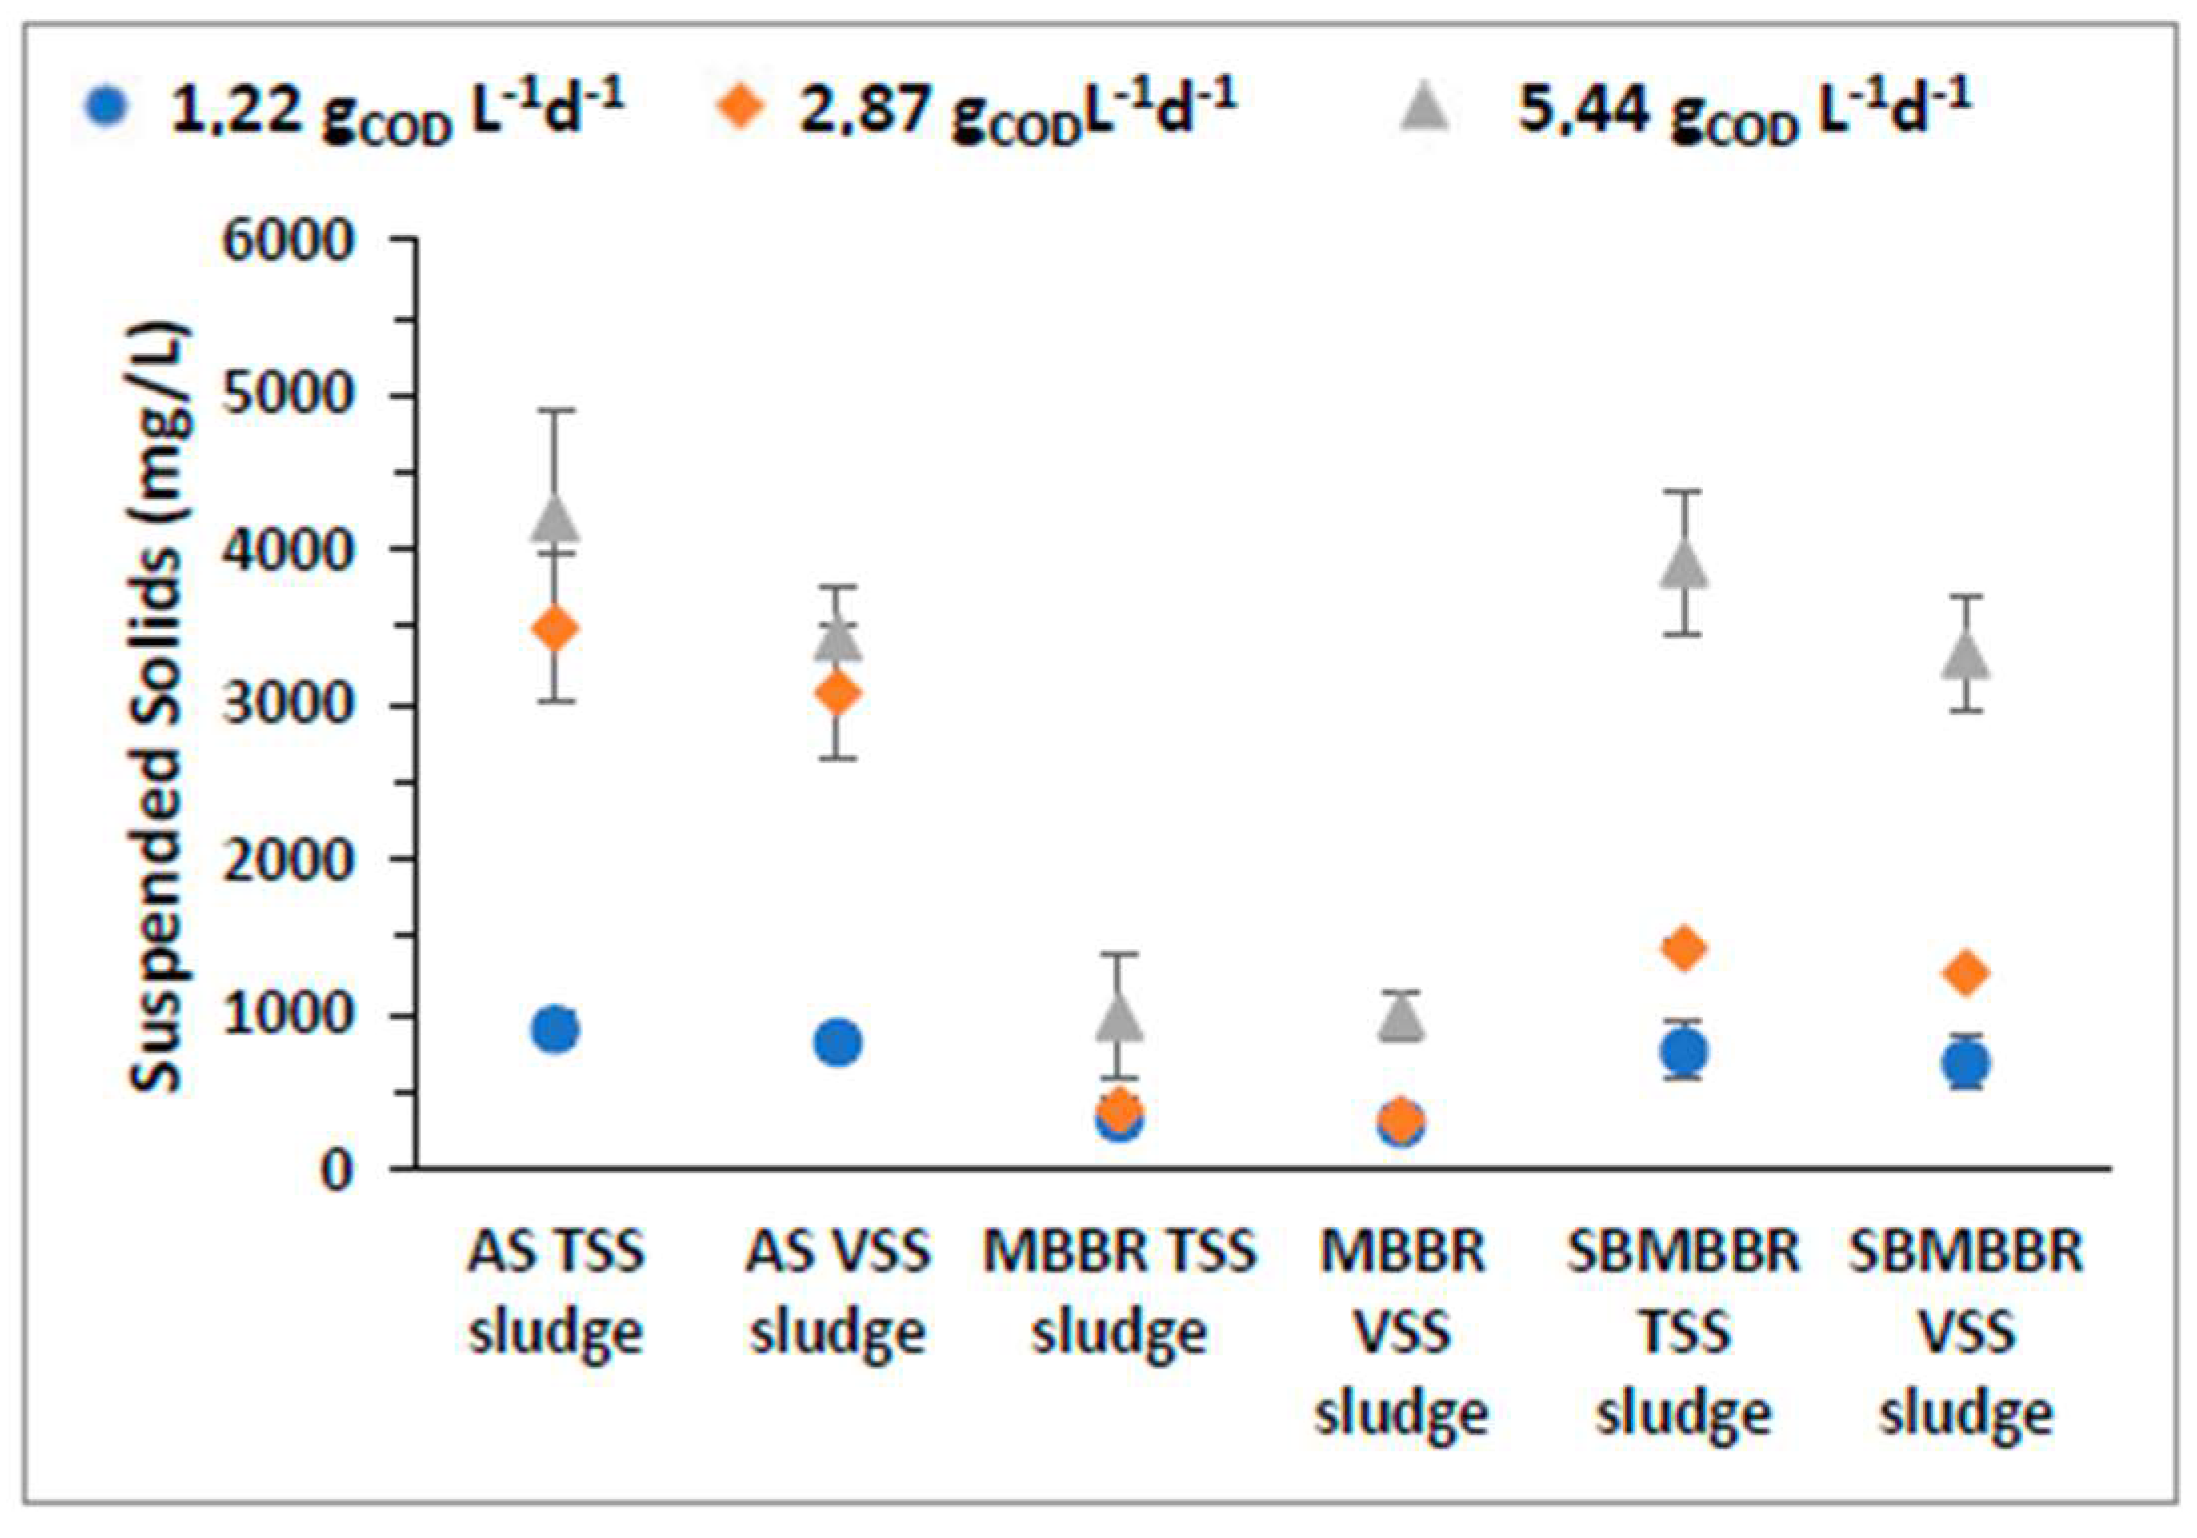
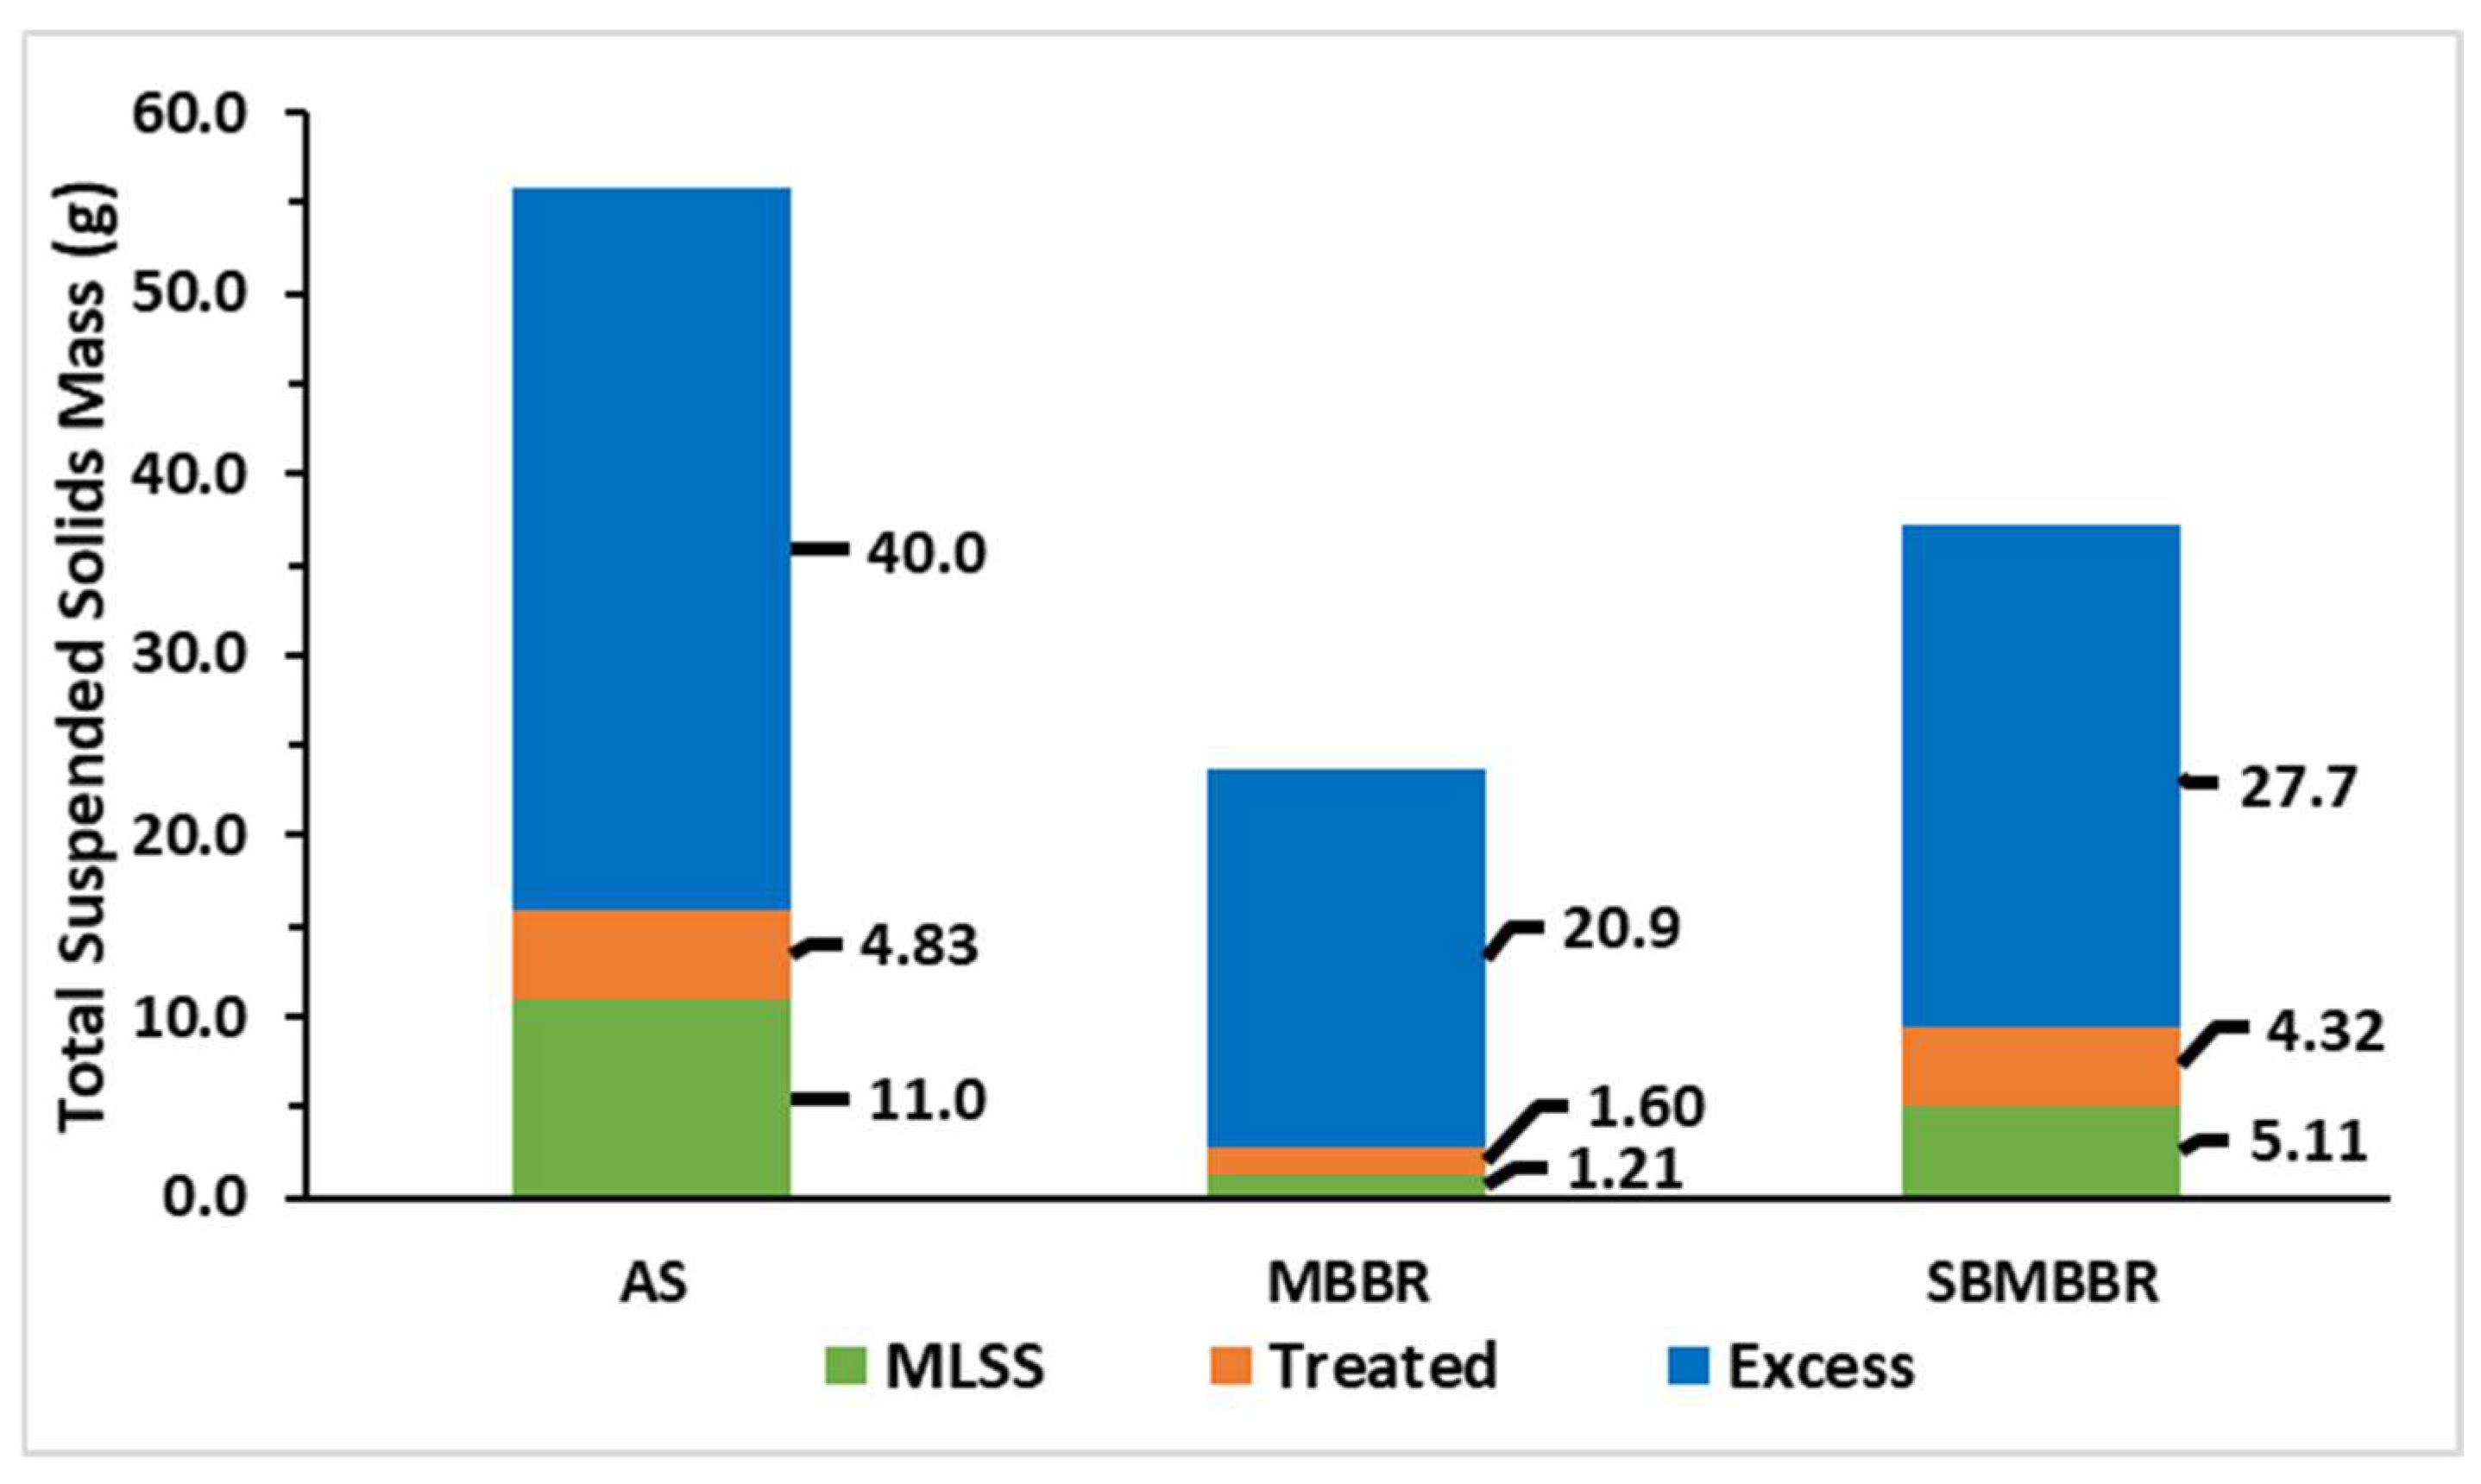
3.2. Mixed-Liquor Suspended Solids

MLSS monitorization is an integral part of the AS system as sludge management is key to optimizing operational conditions of the process, impacting energy consumption, performance, and sludge disposal costs in a wastewater treatment facility [51]. In this regard, the MBBR strongly reduces sludge production. It reduced up to 88.9% TSS than AS and 72.8% less than the SBMBBR. For a better understanding and evaluation, a comparison of TSS and VSS values between the MLSS of the three reactors is presented in Table 3. One can perceive that AS is the system that produces a higher quantity of sludge, while the MBBR system highly reduces sludge production. The SBMBBR offers higher treatment as well as reduced sludge production when compared with the conventional activated sludge process. The MBBR has the lowest concentration of suspended solids (SS) and, despite having removal efficiencies higher than AS, it is behind the SBMBBR for OLRs of 1.22 and 2.87 gCOD L−1d−1. Despite having a higher concentration of SS, the AS system had the worst treatment efficiencies regarding all the studied parameters, which stresses the carrier’s role in biodegradation and denitrification.
Figure 3 shows the average suspended MLSS concentration inside the three reactors, and we can observe that with an increasing OLR, the reactional content also increases in SS concentration. Bassin et al. [52] observed that when the organic load is too high, the carriers get clogged, increasing the biomass in suspension. This analysis can explain, at least partially, the results observed in terms of the increase in the concentration of suspended biomass for the highest value of the OLR in the SBMBBR system.

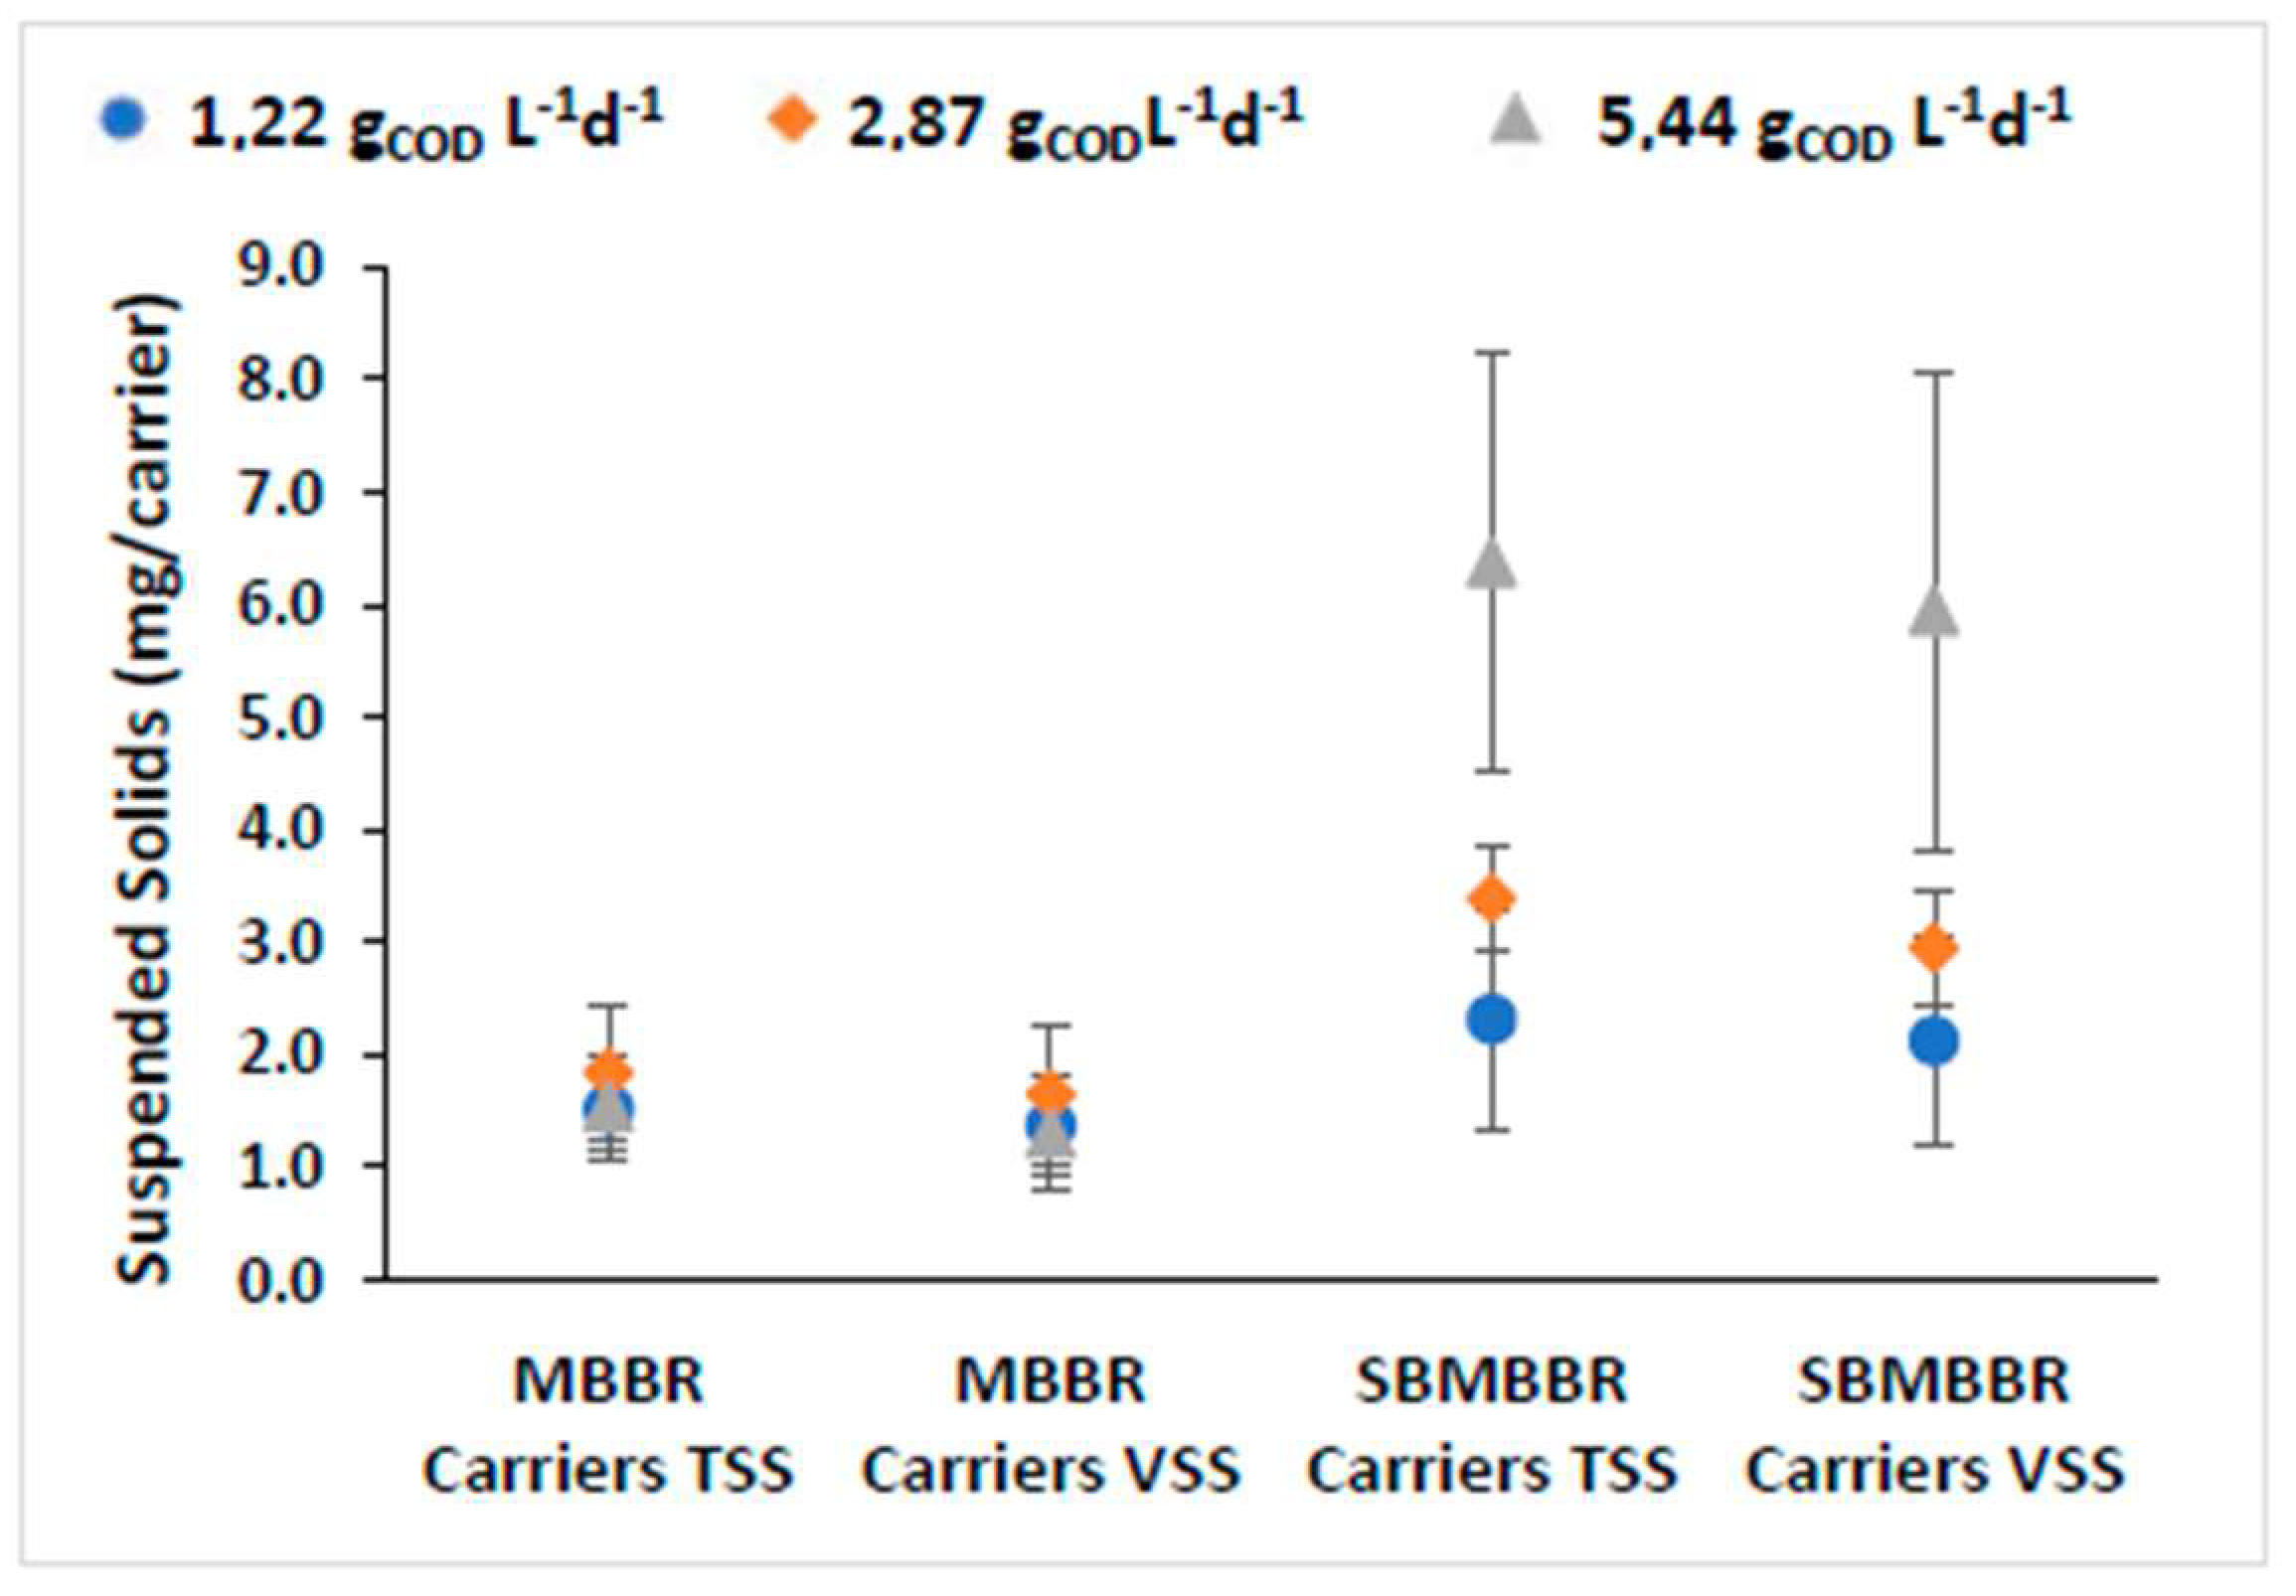
3.3. Carrier Biomass Assessment

The amount of attached solids per surface is crucial when discussing moving-bed wastewater treatment plants [53]. The mass attached to the carrier depends on the wastewater composition, operating conditions, and the organic loading rates [52,54]. A biofilm consists of cells aggregated and embedded within a matrix of EPS (extracellular polymeric substances). EPS are crucial for providing stability and adherence of the biofilm to carriers in the MBBR [29]. Bacteria growing in biofilm cells own increased stability when compared to freely suspended cells, concerning variations in the influent composition and abrupt changes in load, temperature, and toxicity. Therefore, biofilm increases the potential for removing pollutants, mainly due to the wide variety of microbial functional groups present in these environments [26]. For this reason, biofilms should be more resilient to mechanical instability and organic loads variations and be able to reduce hydraulic retention time. Additionally, the installation and operation costs are reduced due to the lower volume of sludge produced. The former means that the bacteria adhering to the carriers effectively degrade the organic compounds, even at low concentrations of suspended solids. This way, the higher biofilm activity obtained should increase compounds’ biodegradation and the system’s overall efficiency while decreasing treatment costs. In fact, the development of anoxic zones in the biofilm suits the moving-bed carriers, as it promotes the growth of anaerobic organisms capable of nutrient removal [55]. The TSS and VSS carriers’ mass for the MBBR and SBMBBR is presented in Figure 4.
Visibly, SBMBBR carriers contained higher adhered biomass. It is relevant to note that higher organic load allowed for increased biomass growth in the SBMBBR carriers. For the MBBR, both TSS and VSS mass were similar for all three OLR values. Aygun et al. [56] used K1 biofilm carriers, with an HRT of 8 h with 6 to 96 gCOD m−2d−1 (in the present paper, it was 2.4 and 10.9 minimum and maximum, respectively). The authors achieved higher amounts of attached biomass for higher organic loading rates. However, the attached biomass was relatively similar for low organic loads, between 6 and 12 gCOD m−2 d−1, and only significantly increased when the loading rate was higher than 12. Therefore, this study is in accordance with the previous research, with the MBBR presenting similarly attached biomass in the carriers. The fact that the SBMBBR shows higher MLSS mass (seen in Figure 3), due to retaining most of the SS, might be the key factor for the increased biofilm development. Fonseca and Bassin [53] suggested that different methods for attached solids determination could lead to different results. One disadvantage of the presented approach is the difficulty of ensuring that the rinse water removes all the adhered biomass. This might lead to higher standard deviations, especially when the biomass strongly adheres to the carrier surface. Another possible explanation is that the biofilm thickness is maintained through shear forces and turbulence during homogeneous mixing [29], which in the SBMBBR was interrupted during the feeding, settling, and extraction phases, providing a time frame for the biofilm thickness to increase. The ratio of VSS/TSS was found to be between 81% and 90% and 87% and 92% in the carriers for the MBBR and SBMBBR, respectively.
Greater stability of the process is ensured in the SBMBBR due to partial immobilization of the bacteria, which in return may also lead to a higher concentration of biomass within the reactor [26]. Consequently, SBMBBR and MBBR TN removal rates correlate with the biofilm growing in the carriers. A thicker biofilm might increase the anoxic reaction and further explain the higher TN removal in the SBMBBR. However, the combination of extra adhered biomass with a higher concentration of suspended biomass does not necessarily translate as the best option to increase treatment efficiency. The reason depends on the TC and COD removal being similar for 2.87 and 5.44 gCOD L−1d−1.
Figure 5 shows a graphic representation of the TSS produced during the 42 days of operation. “MLSS” corresponds to the mass of TSS present in the reactional volume. “Excess” is the mass of sludge retrieved from the reactor for sampling and to maintain regular operation. “Treated” corresponds to the mass of TSS in the treated wastewater.
From these results, it is possible to observe that the AS system produces a greater amount of suspended solids, as it sums up to 55.8 g of TSS. On the other hand, the MBBR produced 23.7 g having the lowest amount of biomass, while the SBMBBR placed in between AS and MBRR produced a total of 37.2 g of TSS. The higher sludge amount in AS can be associated with sludge recirculation. Since the MBBR and SBMBBR did not have this system in place, the suspended sludge accumulation was lower. It is also understandable that the settling tank after the MBBR system helped to keep sludge in the effluent lower. On the other hand, if the solids inside the SBMBBR system do not settle and compact properly, part of the solids can come out of the reactor during the decantation phase. As described by Rusten et al. [33], suspended sludge in the MBBR is highly dependent on the OLR, with suspended solids concentration varying from below 10 to above 500 g m−3. Higher organic loads increased SS, but COD efficiency was highly affected, especially for HRT lower than 8 h. A volumetric organic load of 500 gCOD m−3 h−1 and of 900 gCOD m−3 h−1 reached 85% and 60% COD removal, respectively. Aygun et al. [55] observed a sludge production of 0.35 gTSS d−1 for about 2.85 gCOD d−1. In an SBR-type reactor, the sludge production is hindered by the anoxic phase, resulting in a biomass decay rate, when compared to fully aerated SBRs [48].
In overall terms, accounting periods A, B, and C, AS and SBMBBR produced 135% and 42.4% more sludge than the MBBR, respectively. The SBMBBR produced 64.9% less TSS than the AS system. The daily production of sludge is presented in Figure 6. Once again, the MBBR stands out, producing less sludge for higher OLRs. Higher sludge production, as expected, is achieved for higher OLRs.

4. Conclusions

The three studied systems offered excellent treatment capabilities for a dairy industry effluent. In terms of COD, nitrogen, and carbon removal capabilities, the SBMBBR technology seems to have the best performance at lower OLRs. In fact, the SBMBBR reaches an average COD and TC removal efficiencies above 95% and higher than 85% for TN in the range of the studied OLR values. It allows for a consistent treatment capability for low and high organic loads. Even though the SBMBBR offers the best treatment capability and organic load resilience, it produces a significant amount of sludge compared to the MBBR, increasing global treatment costs.
This way, considering treatment performance in terms of the quantity of biomass present in the reactor, the MBBR brings benefits since it can deal with high loads without necessarily meaning increased biomass production. In addition, the MBBR system offers simplicity in the treatment process by removing the sludge recirculation line, lowering maintenance requirements. Moreover, operating with a lower suspended biomass concentration grants the possibility of having smaller clarifiers, without compromising the treatment quality. These reasons constitute an opportunity to reduce investment and operational costs in the dairy industry’s wastewater treatment.
The improvements are notorious when both MBBR and SBMBBR are compared with AS. The adhered biofilm’s surface area seems to improve biodegradation, adsorbing a higher amount of substrates from the influent wastewater. These technologies not only increase the quality of the treated wastewater but also reduce operating costs, as they produce less sludge, especially in the MBBR configuration. Choosing a suitable and reliable system depends on the OLR and cost-efficiency relation due to sludge production.
Concerning COD, the proposed systems allowed compliance with the current Portuguese legislation of 150 mgCOD L−1, except for AS with an OLR of 5.44 gCOD L−1d−1. Even though MBBR-treated-effluent TN for an OLR of 1.22 gCOD L−1d−1 is in conformity with the defined limit value of 15 mgN L−1, the SBMBBR stands out because it guarantees compliance when considering the OLR of 1.22 and 2.87 gCOD L−1d−1.
Therefore, the results of this study contribute to the optimization of wastewater treatment systems in the dairy industry, either by increasing efficiency or by reducing the costs of operation of the conventional activated sludge treatment. Future studies should include a detailed analysis of costs associated with each system to improve decision making further.

Author Contributions

Conceptualization, L.M.C., R.C.M., and R.M.Q.-F.; validation, L.M.C., R.C.M., R.M.Q.-F., and J.R.S.; formal analysis, R.B.-D. and J.R.S.; investigation, R.B.-D.; data curation, R.B.-D. and J.R.S.; writing—original draft preparation, J.R.S.; writing—review and editing, R.B.-D., L.M.C., R.M.Q.-F. and A.D.S.; visualization, J.R.S., L.M.C., and A.D.S.; supervision, L.M.C., R.C.M., and R.M.Q.-F. All authors have read and agreed to the published version of the manuscript.

Funding

This research received no external funding.

Institutional Review Board Statement

Not applicable.

Informed Consent Statement

Not applicable.

Data Availability Statement

Not applicable.

Conflicts of Interest

The authors declare that the research was conducted in the absence of any commercial or financial relationships that could be construed as a potential conflict of interest.

References

  1. Directorate General for Agriculture and Rural Development. EU Agricultural Outlook for Markets and Income 2021–2031; Publications Office of the European Union: Luxemburg, 2021; Available online: https://data.europa.eu/doi/10.2762/753688 (accessed on 12 January 2022).
  2. Ahmad, T.; Aadil, R.M.; Ahmed, H.; ur Rahman, U.; Soares, B.C.V.; Souza, S.L.Q.; Pimentel, T.C.; Scudino, H.; Guimarães, J.T.; Esmerino, E.A.; et al. Treatment and utilization of dairy industrial waste: A review. Trends Food Sci. Technol. 2019, 88, 361–372. [Google Scholar] [CrossRef]
  3. Catenacci, A.; Bellucci, M.; Yuan, T.; Malpei, F. Dairy wastewater treatment using composite membranes. In Current Trends and Future Developments on (Bio-) Membranes; Elsevier: Amsterdam, The Netherlands, 2020; pp. 261–288. ISBN 978-0-12-816823-3. [Google Scholar]
  4. Kolev Slavov, A. Dairy wastewaters—General characteristics and treatment possibilities—A review. Food Technol. Biotechnol. 2017, 55, 14–28. [Google Scholar] [CrossRef]
  5. Noukeu, N.A.; Gouado, I.; Priso, R.J.; Ndongo, D.; Taffouo, V.D.; Dibong, S.D.; Ekodeck, G.E. Characterization of effluent from food processing industries and stillage treatment trial with eichhornia crassipes (Mart.) and panicum maximum (Jacq.). Water Resour. Ind. 2016, 16, 1–18. [Google Scholar] [CrossRef] [Green Version]
  6. Jaganmai, G.; Jinka, R. Production of lipases from dairy industry wastes and its applications. Int. J. Curr. Microbiol. App. Sci. 2017, 5, 67–73. [Google Scholar]
  7. Chaubey, M. Wastewater Treatment Technologies: Design Considerations; John Wiley & Sons: Hoboken, NY, USA, 2021; ISBN 978-1-119-76525-7. [Google Scholar]
  8. European Commission. Joint Research Centre. Best Available Techniques (BAT) Reference Document for the Food, Drink and Milk Industries: Industrial Emissions Directive 2010/75/EU; (Integrated Pollution Prevention and Control); Publications Office: Luxemburg, 2019. [Google Scholar]
  9. Kushwaha, J.P.; Srivastava, V.C.; Mall, I.D. An overview of various technologies for the treatment of dairy wastewaters. Crit. Rev. Food Sci. Nutr. 2011, 51, 442–452. [Google Scholar] [CrossRef] [PubMed]
  10. Bella, K.; Rao, P.V. Anaerobic digestion of dairy wastewater: Effect of different parameters and co-digestion options—A review. Biomass. Conv. Bioref. 2021. [Google Scholar] [CrossRef]
  11. Matsumoto, E.M.; Osako, M.S.; Pinho, S.C.; Tommaso, G.; Gomes, T.M.; Ribeiro, R. Treatment of wastewater from dairy plants using anaerobic sequencing batch reactor (ASBR) following by aerobic sequencing batch reactor (SBR) aiming the removal of organic matter and nitrification. Water Pract. Technol. 2012, 7, wpt2012048. [Google Scholar] [CrossRef]
  12. Rajagopal, R.; Torrijos, M.; Kumar, P.; Mehrotra, I. Substrate removal kinetics in high-rate upflow anaerobic filters packed with low-density polyethylene media treating high-strength agro-food wastewaters. J. Environ. Manag. 2013, 116, 101–106. [Google Scholar] [CrossRef] [PubMed]
  13. Dębowski, M.; Zieliński, M.; Krzemieniewski, M.; Brudniak, A. Effect of magneto-active filling on the effectiveness of methane fermentation of dairy wastewaters. Int. J. Green Energy 2014. [Google Scholar] [CrossRef]
  14. Jürgensen, L.; Ehimen, E.A.; Born, J.; Holm-Nielsen, J.B. A combination anaerobic digestion scheme for biogas production from dairy effluent—CSTR and ABR, and biogas upgrading. Biomass Bioenergy 2018, 111, 241–247. [Google Scholar] [CrossRef]
  15. Goli, A.; Shamiri, A.; Khosroyar, S.; Talaiekhozani, A.; Sanaye, R.; Azizi, K. A Review on different aerobic and anaerobic treatment methods in dairy industry wastewater. J. Environ. Treat. Tech. 2019, 7, 113–141. [Google Scholar]
  16. Dąbrowski, W.; Żyłka, R.; Malinowski, P. Evaluation of energy consumption during aerobic sewage sludge treatment in dairy wastewater treatment plant. Environ. Res. 2017, 153, 135–139. [Google Scholar] [CrossRef] [PubMed]
  17. Daverey, A.; Pandey, D.; Verma, P.; Verma, S.; Shah, V.; Dutta, K.; Arunachalam, K. Recent advances in energy efficient biological treatment of municipal wastewater. Bioresour. Technol. Rep. 2019, 7, 100252. [Google Scholar] [CrossRef]
  18. Shahot, K.; Idris, A.; Omar, R.; Mohamed Yusoff, H. Review on biofilm processes for wastewater treatment. Life Sci. J. 2014, 11, 1–13. [Google Scholar]
  19. Wang, S.; Parajuli, S.; Sivalingam, V.; Bakke, R. Biofilm in moving bed biofilm process for wastewater treatment. In Bacterial Biofilms; Dincer, S., Sümengen Özdenefe, M., Arkut, A., Eds.; IntechOpen: London, UK, 2020; ISBN 978-1-78985-899-0. [Google Scholar]
  20. Bhattacharya, R.; Mazumder, D. Simultaneous nitrification and denitrification in moving bed bioreactor and other biological systems. Bioprocess. Biosyst. Eng. 2021, 44, 635–652. [Google Scholar] [CrossRef]
  21. Ødegaard, H. A Road-map for energy-neutral wastewater treatment plants of the future based on compact technologies (Including MBBR). Front. Environ. Sci. Eng. 2016, 10, 2. [Google Scholar] [CrossRef]
  22. McQuarrie, J.P.; Boltz, J.P. Moving bed biofilm reactor technology: Process applications, design, and performance. Water Environ. Res 2011, 83, 560–575. [Google Scholar] [CrossRef] [PubMed]
  23. Biological wastewater treatment. In Environmental Engineering, 3rd ed.; Grady, C.P.L.; Daigger, G.T. (Eds.) IWA Publishing: London, UK, 2011; ISBN 978-1-84339-342-9. [Google Scholar]
  24. Van Haandel, A.C.; van der Lubbe, J.G.M. Handbook of Biological Wastewater Treatment: Design and Optimisation of Activated Sludge Systems, 2nd ed.; IWA Publishing: London, UK, 2012; ISBN 978-1-78040-000-6. [Google Scholar]
  25. Ødegaard, H. Innovations in wastewater treatment: The moving bed biofilm process. Water Sci. Technol. 2006, 53, 17–33. [Google Scholar] [CrossRef] [PubMed]
  26. Dezotti, M.; Lippel, G.; Bassin, J.P. Advanced Biological Processes for Wastewater Treatment; Springer International Publishing: Cham, Switzerland, 2018; ISBN 978-3-319-58834-6. [Google Scholar]
  27. Santos, A.D.; Martins, R.C.; Quinta-Ferreira, R.M.; Castro, L.M. Moving bed biofilm reactor (MBBR) for dairy wastewater treatment. Energy Rep. 2020, 6, 340–344. [Google Scholar] [CrossRef]
  28. Ødegaard, H.; Rusten, B.; Westrum, T. A new moving bed biofilm reactor—Applications and results. Water Sci. Technol. 1994, 29, 157–165. [Google Scholar] [CrossRef]
  29. Mahto, K.U.; Das, S. Bacterial biofilm and extracellular polymeric substances in the moving bed biofilm reactor for wastewater treatment: A review. Bioresour. Technol. 2022, 345, 126476. [Google Scholar] [CrossRef] [PubMed]
  30. Tombola, R.; Buttiglieri, G.; Auset, M.; Gonzalez-Olmos, R. Recycled corrugated wire hose cover as biological carriers for greywater treatment in a sequential batch biofilm reactor. J. Environ. Manag. 2019, 240, 475–484. [Google Scholar] [CrossRef] [PubMed]
  31. Gerardi, M.H. Troubleshooting the Sequencing Batch Reactor: Gerardi/Troubleshooting the Sequencing Batch; John Wiley & Sons, Inc.: Hoboken, NJ, USA, 2010; ISBN 978-0-470-64963-3. [Google Scholar]
  32. Cartaescobar, F.; Peredamarin, J.; Alvarezmateos, P.; Romeroguzman, F.; Duranbarrantes, M.; Barrigamateos, F. Aerobic purification of dairy wastewater in continuous regimepart I: Analysis of the biodegradation process in two reactor configurations. Biochem. Eng. J. 2004, 21, 183–191. [Google Scholar] [CrossRef]
  33. Andreottola, G.; Foladori, P.; Ragazzi, M.; Villa, R. Dairy wastewater treatment in a moving bed biofilm reactor. Water Sci. Technol. 2002, 45, 321–328. [Google Scholar] [CrossRef]
  34. Rusten, B.; Ødegaard, H.; Lundar, A. Treatment of dairy wastewater in a novel moving bed biofilm reactor. Water Sci. Technol. 1992, 26, 703–711. [Google Scholar] [CrossRef]
  35. Tsitouras, A.; Al-Ghussain, N.; Delatolla, R. Two moving bed biofilm reactors in series for carbon, nitrogen, and phosphorous removal from high organic wastewaters. J. Water Process. Eng. 2021, 41, 102088. [Google Scholar] [CrossRef]
  36. Yuan, Q.; Wang, H.; Hang, Q.; Deng, Y.; Liu, K.; Li, C.; Zheng, S. Comparison of the MBBR Denitrification carriers for advanced nitrogen removal of wastewater treatment plant effluent. Env. Sci. Pollut. Res. 2015, 22, 13970–13979. [Google Scholar] [CrossRef] [PubMed]
  37. Wang, J.; Rong, H.; Cao, Y.; Zhang, C. Factors affecting simultaneous nitrification and denitrification (SND) in a moving bed sequencing batch reactor (MBSBR) system as revealed by microbial community structures. Bioprocess. Biosyst. Eng. 2020, 43, 1833–1846. [Google Scholar] [CrossRef]
  38. Leonard, P.; Tarpey, E.; Finnegan, W.; Zhan, X. Efficient treatment of dairy processing wastewater in a laboratory scale intermittently aerated sequencing batch reactor (IASBR). J. Dairy Res. 2018, 85, 379–383. [Google Scholar] [CrossRef]
  39. Ozturk, A.; Aygun, A.; Nas, B. Application of sequencing batch biofilm reactor (SBBR) in dairy wastewater treatment. Korean J. Chem. Eng. 2019, 36, 248–254. [Google Scholar] [CrossRef]
  40. Leonard, P.; Clifford, E.; Finnegan, W.; Siggins, A.; Zhan, X. Deployment and optimisation of a pilot-scale IASBR system for treatment of dairy processing wastewater. Energies 2021, 14, 7365. [Google Scholar] [CrossRef]
  41. Khalaf, A.H.; Ibrahim, W.A.; Fayed, M.; Eloffy, M.G. Comparison between the performance of activated sludge and sequence batch reactor systems for dairy wastewater treatment under different operating conditions. Alex. Eng. J. 2021, 60, 1433–1445. [Google Scholar] [CrossRef]
  42. De Oliveira, D.V.M. Evaluation of a MBBR (moving bed biofilm reactor) pilot plant for treatment of pulp and paper mill wastewater. IJEMA 2014, 2, 220. [Google Scholar] [CrossRef]
  43. Standard Methods for the Examination of Water and Wastewater, 23rd ed.; Baird, R.; Eaton, A.; Rice, E. (Eds.) American Public Health Association, American Water Works Association and the Water Environment Federation: Denver, CO, USA, 2017; ISBN 13 978-1625762405. [Google Scholar]
  44. Phanwilai, S.; Kangwannarakul, N.; Noophan, P.; Kasahara, T.; Terada, A.; Munakata-Marr, J.; Figueroa, L.A. Nitrogen removal efficiencies and microbial communities in full-scale IFAS and MBBR municipal wastewater treatment plants at high COD:N ratio. Front. Environ. Sci. Eng. 2020, 14, 115. [Google Scholar] [CrossRef]
  45. Tian, X.; Guo, S.; Xu, K.; Zhao, C.; Wang, X.; Bian, D. Effect of mixed liquor suspended solids (MLSS) on simultaneous nitrification and denitrification in a sequencing batch reactor. IOP Conf. Ser.: Earth Environ. Sci. 2018, 186, 012041. [Google Scholar] [CrossRef] [Green Version]
  46. Wu, L.; Wei, W.; Xu, J.; Chen, X.; Liu, Y.; Peng, L.; Wang, D.; Ni, B.-J. Denitrifying Biofilm processes for wastewater treatment: Developments and perspectives. Environ. Sci. Water Res. Technol. 2021, 7, 40–67. [Google Scholar] [CrossRef]
  47. Shao, Y.; Shi, Y.; Mohammed, A.; Liu, Y. Wastewater ammonia removal using an integrated fixed-film activated sludge-sequencing batch biofilm reactor (IFAS-SBR): Comparison of suspended flocs and attached biofilm. Int. Biodeterior. Biodegrad. 2017, 116, 38–47. [Google Scholar] [CrossRef]
  48. Kulikowska, D.; Klimiuk, E.; Drzewicki, A. BOD5 and COD Removal and sludge production in SBR working with or without anoxic phase. Bioresour. Technol. 2007, 98, 1426–1432. [Google Scholar] [CrossRef] [PubMed]
  49. Bazari, H. Biological treatment of dairy wastewater by sequencing batch reactor. Iran. J. Environ. Health Sci. Eng. 2004, 1, 65–69. [Google Scholar]
  50. Decreto-Lei n.o 236/98|DRE. Available online: https://dre.pt/ (accessed on 26 January 2022). (In Portuguese).
  51. Sid, S.; Volant, A.; Lesage, G.; Heran, M. Cost Minimization in a full-scale conventional wastewater treatment plant: Associated costs of biological energy consumption versus sludge production. Water Sci. Technol. 2017, 76, 2473–2481. [Google Scholar] [CrossRef] [Green Version]
  52. Bassin, J.P.; Dias, I.N.; Cao, S.M.S.; Senra, E.; Laranjeira, Y.; Dezotti, M. Effect of increasing organic loading rates on the performance of moving-bed biofilm reactors filled with different support media: Assessing the activity of suspended and attached biomass fractions. Process Saf. Environ. Prot. 2016, 100, 131–141. [Google Scholar] [CrossRef]
  53. Fonseca, D.L.; Bassin, J.P. Investigating the most appropriate methods for attached solids determination in moving-bed biofilm reactors. Bioprocess. Biosyst. Eng. 2019, 42, 1867–1878. [Google Scholar] [CrossRef] [PubMed]
  54. Wang, R.-C.; Wen, X.-H.; Qian, Y. Influence of carrier concentration on the performance and microbial characteristics of a suspended carrier biofilm reactor. Process. Biochem. 2005, 40, 2992–3001. [Google Scholar] [CrossRef]
  55. Wang, X.J.; Xia, S.Q.; Chen, L.; Zhao, J.F.; Renault, N.J.; Chovelon, J.M. Nutrients removal from municipal wastewater by chemical precipitation in a moving bed biofilm reactor. Process. Biochem. 2006, 41, 824–828. [Google Scholar] [CrossRef]
  56. Aygun, A.; Nas, B.; Berktay, A. Influence of high organic loading rates on COD removal and sludge production in moving bed biofilm reactor. Environ. Eng. Sci. 2008, 25, 1311–1316. [Google Scholar] [CrossRef]
Figure 1. Schematic representation of the laboratory AS (1), MBBR (2), and SBMBBR (3) synthetic dairy wastewater treatment.
Sustainability 14 02702 g001
Figure 2. Concentration of COD, TC, and TN present in feed and treated wastewater for AS, MBBR, and SBMBBR systems and respective standard deviations. The presented feed concentrations were diluted 10 times.
Sustainability 14 02702 g002
Figure 3. MLSS concentration (mg L−1) and respective standard deviation for AS, MBBR, and SBMBBR reactors for the studied OLR.
Sustainability 14 02702 g003
Figure 4. Adhered SS mass per carrier and respective standard deviation for MBBR and SBMBBR reactors for the different OLRs.
Sustainability 14 02702 g004
Figure 5. Sum of total suspended solids mass (g) during periods A, B, and C for the three reactors.
Sustainability 14 02702 g005
Figure 6. Sludge produced per day (gTSS d-1) for each type of bioreactor and different OLRs.
Sustainability 14 02702 g006
Table 1. Influent loading rates, BOD, and operation time frame for each OLR.
OLR (gCOD L−1d1)Time (Days)BOD (mgO2 L−1)TC (gCL−1d−1)TN (gNL−1d−1)
1.22172470.450.10
2.87144951.170.23
5.44119892.190.53
Table 2. Removal efficiency (%) for AS, MBBR, and SBBR for the OLR of 1.22, 2.87, and 5.44 gCOD L−1d−1 and the respective standard deviations.
OLR
(gCOD L−1d−1)
SystemAverage COD (m gCOD L−1)Average TC (mgC L−1)Average TN (mgN L−1)
InfluentTreated%InfluentTreated%InfluentTreated%
1.22AS594.2 ± 42.743.9 ± 23.192.7 ± 3.5217.7 ± 34.528.1 ± 10.787.6 ± 3.449.1 ± 3.514.2 ± 6.675.1 ± 9.5
MBBR38.0 ± 13.793.6 ± 2.517.3 ± 3.792.0 ± 1.812.5 ± 2.575.7 ± 4.1
SBBR28.1 ±9.695.3 ± 1.69.2 ± 2.995.8 ± 0.95.4 ± 1.888.5 ± 5.0
2.87AS1396 ± 119.879.4 ± 18.994.3 ± 1.5569.2 ± 47.550.5 ± 11.291.1 ± 2.1113.8 ± 14.030.2 ± 8.273.1 ± 8.1
MBBR53.7 ± 15.196.2 ± 1.123.6 ± 4.595.7 ± 0.216.3 ± 4.985.6± 3.6
SBBR49.9 ±9.5296.4 ± 0.627.8 ± 2.896.3 ± 1.911.9 ± 6.489.3 ± 6.7
5.44AS2646 ± 238.6178 ± 6093.3 ± 2.11064 ± 27.863.2 ± 7.594.0 ± 0.9259.7 ± 27.830.1 ± 7.888.1 ± 3.8
MBBR117 ± 2695.6 ± 0.954.1 ± 9.294.9 ± 0.620.6 ± 6.492.1 ± 2.1
SBBR126 ±14.695.2 ± 0.750.0 ± 6.295.1 ± 0.720.5 ± 7.591.8 ± 3.6
Table 3. Average sludge difference (%) regarding the three reactors in terms of TSS and VSS concentration for each OLR.
OLR
(gCOD L−1d−1)
Average TSS % Difference Inside the ReactorAverage VSS % Difference Inside the Reactor
AS vs.
MBBR
AS vs.
SBMBBR
SBMBBR
vs. MBBR
AS vs.
MBBR
AS vs.
SBMBBR
SBMBBR
vs. MBBR
1.22−63.6−15.3−57.1−64.4−15.6−57.8
2.87−88.9−59.2−72.8−89.5−58.8−74.6
5.44−76.5−6.80−74.8−71.2−3.07−70.3
Publisher’s Note: MDPI stays neutral with regard to jurisdictional claims in published maps and institutional affiliations.

