
The Use of a Simplified Carbon Footprint Tool for Organic Waste Managers: Pros and Cons


1
Department of Economic Studies, University “G. d’Annunzio”, Viale Pindaro 42, 65127 Pescara, Italy
2
ACEA Pinerolese Industriale S.p.a, Via Vigone 42, 10064 Pinerolo, Italy
*
Author to whom correspondence should be addressed.
Sustainability 2022, 14(4), 1951; https://doi.org/10.3390/su14041951
Submission received: 2 December 2021
/
Revised: 9 January 2022
/
Accepted: 4 February 2022
/
Published: 9 February 2022
(This article belongs to the Special Issue Life Cycle Thinking, Sustainability and Circular Economy: Practical Applications and Future Challenges)
Abstract
:Given that the pressure of climate change action on companies is increasing, it is recommended to measure the improvement of mitigation activities in terms of GHG emissions. This paper aims to highlight the still-open aspects that characterise simplified GHG accounting tools, starting from the outcomes of a case study. This study was performed using a simplified Italian software for the CO2 eq accounting of composting and anaerobic digestion, two mitigation activities that contribute an important share of global GHG emissions reduction. The tool is based on the life-cycle thinking approach. It has been applied to an Italian company that treats the organic fraction of municipal solid waste. The tool analysis has made it possible to stress several issues that are currently the object of debate in the literature, for example, the trade-off between the flexibility of the software and its user friendliness or the multifunctionality issues and their different interpretations. However, focusing on just one impact category, i.e., climate change, may lead to an incomplete picture of the overall environmental performance of the process analysed. Therefore, this tool could be improved by including other impact categories, such as eutrophication and acidification, which may be affected by the studied activities.
1. Introduction
The role of greenhouse gas (GHG) emissions as a major cause of climate change has long been stressed by the scientific community [1,2,3,4] as well as the urgency to make effective decisions [5]. Indeed, systematic and trans-sectoral actions are being undertaken to tackle that issue [4,6].
About 8–10% of global GHG emissions are caused by food that is not consumed [7]. In the European Union, approximately 118 to 138 million tonnes of bio-waste are generated annually, only 40% of which are recycled into high-quality compost and digestate [8]. Therefore, there is a potential not yet utilised. Composting and anaerobic digestion (AD) are considered as mitigation activities for GHG reduction [9] because they decrease landfilling, recover materials, and, in the case of AD, also derives alternative fuels from renewable sources [2]. As stated by Manninen et al. [10], biogas, the fuel deriving from AD, constitutes a significant part of the energy market. The large potential in producing biogas is confirmed by the European Commission [11]. Substituting fossil fuels with renewable energy and thus decarbonising the energy sector [12] can help addressing climate change. Renewable energy promotion is amongst the goals of the European Union’s energy policy [13] and several other international commitments, such as the Paris Agreement [14]. In such a context, it is essential to adopt cleaner technologies aimed at mitigating global warming and, at the same time, to measure their climate performance in order to verify their effectiveness.
To facilitate performance measurement, different tools have been developed, amongst which are those that measure the carbon footprint (CF): “CF refers to the total amount of greenhouse gas (GHG) emissions directly or indirectly produced by an activity or accumulated during a product life cycle and can be used to evaluate the main environmental hotspots and the mitigation or improvement measures” [4] (p. 3). Generally, the amount of GHG is expressed in mass of CO2 equivalent—CO2 eq [2]. The time horizon considered for calculating the Global Warming Potential (GWP), which is the most common climate change indicator [15], is often 100 years [16,17]; the same time reference is suggested in the ISO 14064-1 standard [2]. The concept of CF can be applied either at the company or product level, which changes the objective of an analysis and, therefore, the boundaries of a study [4]. CF measurement tools are more widespread in the scientific community, specifically amongst smart software researchers [18], but also outside [19]. These have become important reference points for GHG management [20] in both the private and public sectors. Yue et al. [6] found that after the United Nations [21] Agenda release, the interest in CF measurement methods, with the related calculation tools, increased amongst researchers. Over time, several types of CFs have been developed, most of which are based on a life-cycle approach [1,4] and, in particular, on the Life Cycle Assessment (LCA) method [6]. Thus, some authors, e.g., [15,17,19], have considered CF as a “simplified LCA” or “single-aspect LCA” [22] focused on a single impact category: climate change. Simplified LCA is useful especially for small- and medium-sized enterprises [23], which have limited resources in terms of time, finance, or skills to perform a more complex study, but also for companies that choose to emphasise the CF in their corporate disclosure for its communicative power. Indeed, organisations need to show their efforts in tackling climate change given that businesses were identified as one of the main actors considered responsible for this issue, as revealed by the Special Eurobarometer on European perceptions of climate change survey [24]. CF measurements could be included in the carbon accounting system of a company [25] and are useful to transform technical data into information for governance by means of a concise indicator, which could be adapted to a local, national, or international level or oriented to a specific context. As regards the latter case, several CFs on AD and composting systems can be found in literature. Vosooghnia et al. [26] stated that different studies concerning the GHG emissions of AD plants for organic residues have been carried out and that global warming is one of the most important impact categories besides eutrophication and acidification. In the same paper, the authors stated the need to assess the carbon intensity of AD and the use of digestate regarding its benefits related to carbon storage capacity and the avoided mineral fertiliser production, as also mentioned by others [27].
Although many studies have been conducted in this field, there is a lack of uniformity in the applied methods. Bacenetti and Fiala [28], for example, in their CF study on electricity production from biogas, used an LCA approach and referred to IPCC guidelines [29]. Bartocci et al. [30] applied two LCAs only focused on GHG emissions of several AD scenarios, namely an attributional LCA and a consequential LCA, with the aim to propose an environmental indicator together with an economic one for multicriteria decision making. They referred to Product Category Rules [31] for different purposes, e.g., to set system boundaries. Vosooghnia et al. [26] carried out a CF of AD according to ISO 14040 [32] and 14044 [33] standards. Concerning composting, Vinci et al. [34] performed an LCA according to ISO 14040 [32] and 14044 [33], and then, starting from the LCA results, a CF referring to the guidelines of IPCC [29] was presented.
The abovementioned studies as well as most of those found in literature were performed without any sector-specific calculators for either AD or composting.
However, some tools developed in the private sector specifically for biogas analysis are available in different forms and level of detail, e.g., the Biomass and Biogas Carbon Calculator (B2C2) developed by E4tech [35], the NNFCC carbon calculator [36], the Anaerobic Digestion Calculator by RENERGON International AG [37], or the Biogas Calculations tool [38]. In all these cases, mere composting is not provided for. Moreover, GHG-related information is not very detailed; indeed, these tools offer also economic and/or technical information. In most cases, the methodology is not publicly available. Moreover, no specific tools for the mere accounting of composting activities have been found by the authors.
Sector-specific CF tools could offer suitable and detailed references for default emission factors per sector [39] and focus on the most relevant phases of the studied product or activity. For example, Arzoumanidis et al. [23] (p. 424) argued that a simplified tool developed for the agri-food sector could permit practitioners to carry out an “easy and relatively fast implementation of LCA with a precise set of data.”
Having a specific tool not only for AD but also for composting processes is important because composting currently has a significant role in the management of OFMSW even though the interest in AD is growing (especially in some geographic areas, mainly followed by a composting process of digestate). For example, in Italy, the OFMSW is treated as follows [40]: composting (49.2% of the total treated fraction), AD/composting integrated system (45.7%), and AD (5.1%).
To this end, a tool on the evaluation of CO2 eq for both composting and AD activities has been proposed by the Italian Composting and Biogas Association (in Italian: Consorzio Italiano Compostatori—CIC) for their members. The tool provides CO2 eq accounting of the activities carried out by the member organisations.
The aim of this work is twofold: to test the tool and to analyse its strengths and weaknesses based on sector-specific literature and to draw more general indications for CF practitioners.
To date, to the best of the authors’ knowledge, the study presented here is the first based on the aforementioned tool.
The rest of this article is structured as follows: in Section 2, the methodological approach is explained, followed by the description of the case study. The results are illustrated in Section 3. Then, the discussion is presented in Section 4, evaluating the strengths and weaknesses of the tool. Finally, Section 5 concludes this article.
2. Materials and Methods
In this section, the methodological approach (Section 2.1.) and the description of the case study (Section 2.2.) are explained. The latter is divided in an illustration of the main stages of the studied plant (Section 2.2.1.) and, finally, the GHG accounting method (Section 2.2.2.).
2.1. Methodology of “CO2mpost” Tool
The tool employed in this study is called “CO2mpost” v 1.0, proposed by CIC for their members. This is a restricted-access online CF tool for activities in the composting/AD sector. The user can select one of the three types of activities: composting, AD/composting integrated system, and AD/composting integrated system, including upgrading of biogas. All types of technologies adopted in Italy are taken into account. The objective of the tool is the accounting of the GHG emissions limited to the three above-mentioned activities, thus excluding other plant activities, e.g., wastewater or mixed waste treatment [41]. Therefore, an allocation may be needed for those flows shared by different processes. The tool is based on the life-cycle approach, following international standards, such as the GHG Protocol [39], IPCC guidelines [29], and ISO 14040 standard series. The system boundaries include all phases carried out within the AD and/or composting plants as well as input/output transport. The treatment of scraps in dedicated plants is also considered. The biogenic CO2 emissions are considered neutral. The balance of CO2 eq is computed by considering the emissions released and avoided during a given time span, e.g., a year. For the GHG emissions, several activities are considered, covering all three scopes proposed by the GHG Protocol [39], i.e., (i) consumption of energy and auxiliary materials; (ii) direct emissions of CH4 and N2O related to the AD and composting activities, including the stationary combustion of biogas. Only the airborne emissions of gases that potentially contribute directly to Global Warming, and notably, CH4, N2O, and CO2 are considered. However, since CO2 is biogenic, it is considered Global Warming neutral; therefore, it was not included; (iii) emissions due to the waste treatment from composting and/or AD processes, which are categorised based on the type of activity, namely landfill, Waste-to-Energy (WtE) plant, and wastewater treatment; and (iv) emissions from transport of inputs, products, and scraps with EURO-4 diesel lorries. As regards the energy consumption, the Italian power mix and the relevant sources used in Italy for heating and transport of goods are included, i.e., natural gas or diesel oil.
The benefits are credited for the system in the form of avoided CO2 emissions. A first type of benefits accounted for is related to the compost production and use. It is assumed that compost can be used in three different contexts. The first is compost application in floriculture. Benefits may derive from the avoided production of peat and the avoided CO2 eq emissions. Indeed, peat is included amongst the fossilised materials, such as oil, coal, and natural gas [42]. The second context is the use of compost in agriculture, which avoids the production of mineral fertilisers. In particular, energy and raw materials resulting in emission of GHGs are involved in fertilisers production [43]. Regarding the use of compost in agriculture, another benefit is accounted for, namely its function as a carbon sink. Third is the use of compost for environmental restoration. In this case, the benefit related to compost as a GHG reservoir is credited. A second type of benefits is related to electricity and thermal energy from biogas. The avoided amount of the residual electricity mix is considered given that it prevents double counting in energy source disclosure [44]. The “residual energy mix means the total annual energy mix for a Member State, excluding the share covered by cancelled guarantees of origin” [45] (p. 103). Guarantees of origin are an electricity-tracking instrument proposed by the European Union to assign generation attributes (energy source and environmental impacts) to the generated and sold electricity [46]. The aim of the guarantees of origin is to show that a certain share of energy is from renewable sources [45]. For thermal energy, avoided use of natural gas is accounted for. Other benefits concern the use of biomethane (in substitution for natural gas) for residential thermal energy and biogenic CO2 for commercial purposes, obtained from the upgrading process. Finally, amongst the benefits, the avoided emissions related to the mechanical-biological treatment (MBT) of organic waste are also included. This process is mandatory before landfilling undifferentiated organic waste. In this case, the CO2 eq derived from the electricity used, as well as CH4 and N2O emitted during the treatment stages, are considered as avoided emissions. For detailed information on the emission factors used, see Table 1. In the online tool, three Key Performance Indicators (KPIs) are also presented: emissions per tonne of waste input, avoided emissions per tonne of waste input, and net emissions per tonne of waste input.
Regarding the structure of the software, the user side of the tool is structured in five sections: overview, input, results, archive, and support. The first one corresponds to the home page, where the results of the last analysis carried out are summarised. In this section, information about emitted, avoided, and net amount of CO2 eq is presented. In the second section, a pre-set form should be filled in by the user with data concerning the flows of the investigated process. The results section shows the outcomes elaborated after entering the input data. Tables regarding the amounts of CO2 eq avoided and emitted are shown, with the details of the affected phases. Moreover, the three aforementioned KPIs are presented. The results are also available graphically. The archive is dedicated to the storage of previous analyses. Finally, the support section contains the manual of the tool, in Italian language, which is downloadable.
2.2. Case Study
This section is structured in two subsections. Section 2.2.1. provides information concerning the main stages of the studied plant. Section 2.2.2 is related to the GHG accounting on the plant.
2.2.1. General Information on the Plant
CF was carried out on an Italian plant operated by ACEA Pinerolese Industriale S.p.a. (from now on “ACEA”), located in Pinerolo, in the Piedmont region, Italy; the reference year was 2019. ACEA is a modern multi-utility company, which, in 2019, processed 75,057 tonnes of organic waste, principally OFMSW (59,103 tonnes), collected from an area of 2200 km2 populated by about 1,000,000 inhabitants distributed over 100 municipalities. The OFMSW consists of biodegradable waste from kitchens and canteens and local markets. Garden and park waste are also included.
The source-segregated OFMSW undergoes preliminary treatment to remove plastic bags containing the waste, ferrous materials, and other bio-components not easily degradable (nutshells, stones, etc.). Bags are first shredded by means of a bag opener and then separated in a disc screen. The finer matter is mechanically treated to separate unwanted material, such as bones, stones, heavy objects, and residual plastic material, to obtain the solid bio-organic fraction. Hot process water is added to it in a mixer to yield a 10% solid wet suspension that constitutes the organic humid fraction feed for the anaerobic digester. The reactor is operated with 14-day hydraulic retention time and operates at thermophilic temperatures. Three streams get separated from the bioreactor: a gaseous stream of biogas, inert material (removed at the pre-chamber), and digestate. The latter stream is sent to the belt press for the recovery of solid sludge for composting, and a liquid fraction is sent to coagulation-flocculation for water recovery, partially recirculated after water depuration. Composting consists of essentially two phases, both in aerobic conditions, namely bioxidation and maturing. During the first step, active microbial biodegradation takes place, while in the second one, the residual organic matter is slowly degraded [51]. A total of 6317 tonnes of compost were obtained in 2019; compost is spread within a range of 50 km from the plant, mainly for agronomic uses. The co-product was biogas (6,331,164 m3) combusted in a Combined Heat and Power (CHP) engine to obtain electric and thermal energy, partially sold. Finally, the scraps from the plant, amounting to 18,305 tonnes, are sent to a WtE plant located in the same province. This fraction mostly consists of wet plastic (compostable and non) bags contaminated with organic scraps and small parts of inert materials. Figure 1 shows both the inputs and the outputs of the plant.
2.2.2. GHG Accounting
The following phases were included in the analysis: transports of OFMSW to the plant, AD and composting activities, transport of the compost produced, transport of scraps and scrap treatment. Physical allocation, i.e., allocation by mass, was adopted to associate the share of compost to the different uses. To separate the share of biogas produced by means of AD from other sources, which are collected in the same gasometer, an allocation by volume was adopted. Finally, an energy allocation was adopted to discriminate the electricity and heat produced from biogas or from other sources. Moreover, the substitution method was applied by the tool for accounting the benefits concerning the co-products obtained from the AD/composting system [33,52]. Benefits on the avoided landfilling of OFMSW were also included because they are considered by the tool developers as a co-product of the activity (Figure 2).
As regards the GHG activity data, most of the inputs are primary and site-specific. In rare cases, secondary data were considered, e.g., the amount of CH4 and N2O per tonne of dry organic waste introduced in the plant. These data were derived from the Italian Greenhouse Gas Inventory Report [53] and cited in the manual in case of lack of primary data. Secondary data were also used for transport. In this case, CIC suggested an estimate based on national conditions, namely 50 km for the transport of OFMSW to the plant [41].
3. Results
In Figure 3, an overview of the main results is presented. The activity of AD and post composting generated a balance of −7710 tonnes CO2 eq in 2019. This amount does not exactly correspond to the difference between the amounts of the CO2 eq emitted and the one avoided, which are reported in the same figure. To avoid giving an excessive feeling of accuracy, the software developers decided that the GHG emission values are to be displayed on the overview page by showing only a few significant figures. Instead, the computational model calculates the emissions balance starting from non-approximate values; this may result in inaccuracies in the displayed balance [54]. In the following subsections, details of the emitted and avoided CO2 eq are provided.
3.1. CO2 Emitted
The amount of CO2 eq emitted is 3700 tonnes (Figure 4), about one-third of which (1090 tonnes) is related to the thermal energy consumption. The second largest share is the direct emissions (810 tonnes), which can be divided into emissions from AD (630 tonnes) and emissions from biogas combustion (190 tonnes). Waste and transport activities produce 780 tonnes each. Regarding the waste section, the outcome is principally affected by their treatment in a WtE plant (700 tonnes). In contrast, concerning the transport impacts, the most affecting activity is the transportation of the inputs to the case study plant, which accounted for 610 tonnes of CO2 eq. Emissions derived from the electricity consumption (220 tonnes) make up a minor share of the total amount. Finally, the consumption of auxiliary materials emits the least CO2 (21 tonnes).
3.2. CO2 Avoided
The CO2 eq avoided is 11,400 tonnes (Figure 4). The avoided landfilling with previous bio-stabilisation generates most of the total benefits (−7810 tonnes). For the benefits account of this phase, energy consumed and CH4 and N2O emissions during the process of BMT are considered. The second largest contribution comes from the renewable electricity produced from biogas (−2220). It is assumed that the part of renewable electricity permits a reduction of the residual national mix. The third most important contribution comes from the production of compost (−1090 tonnes) divided as follows: substitution of peat in floriculture (−130 tonnes), substitution of NPK mineral fertilisers in agriculture (−540 tonnes), and carbon sequestration in agriculture and environmental restoration (−410 tonnes). Thermal energy production contributes the least to avoided emissions (−300 tonnes).
3.3. Key Performance Indicators
Regarding the KPIs, the outcomes are divided in 0.049 tonnes CO2 eq/tonne waste for GHG emissions and −0.15 tonnes CO2 eq/tonne waste for avoided emissions. Finally, concerning net emissions, the outcome is −0.1 tonne CO2 eq/ tonne waste.
4. Discussion
As a whole, the tool can be considered useful for identifying the main climate change hotspots of an activity related to AD and/or composting. In Italy, composting is the most-used treatment process for OFMSW management. At the same time, AD has recently shown a higher development rate than composting, especially the integrated system [40]. In contrast, overall, in Europe, AD without composting is more frequent than integrated AD/composting [8]. However, in both cases, this means that AD is assuming an increasingly pivotal role in organic waste management. Given the OFMSW is the most collected fraction of the urban solid waste [40], a tailored CF tool for AD and composting companies may become important for the entire sector.
The tool analysed in this study could be adopted for the preliminary detection of the strengths and weaknesses of such activities, based on which further in-depth analyses could be carried out for performance improvements. For example, in this case study, outcomes show that the thermal energy consumption significantly affects the CO2 eq emitted. ACEA has been aware of this excess in thermal energy consumption produced by a boiler due to a lack in efficiency of their previous CHP system, which was subsequently renewed in 2020. Therefore, it is expected that data from 2021 will show the changes in energy use, which means that, if the analysis were to be repeated for 2021, the real improvement could be evaluated. The software can store previous analyses and allows them to be compared to the most recent ones.
Despite being a simplified tool, for some aspects, the level of detail of this tool is considerable. For example, during the inventory phase, data on the different final uses of compost (floriculture, agriculture, or just environmental restoration) and the relevant amounts need to be entered separately. The software will show the outcomes in terms of CO2 eq avoided for each final use option, meaning the tool is able to distinguish the contributions related to the different applications of compost. It is important to capture this difference because the compost will substitute different products depending on the type of application, either floriculture or agriculture. Hence, different GHG emissions should be considered as avoided. In particular, according to Boldrin et al. [43], peat substitution has a larger potential for emission savings than the spreading of compost on land. However, obtaining information about the final destination of this co-product could often be quite difficult for companies [43], as also confirmed by this case study.
Moreover, the consumption of auxiliary materials (e.g., lubricants) is also included in the inventory, despite their generally lower contribution to the overall impacts, as confirmed also by this study. For this reason, Møller et al. [27], who conducted a similar study, excluded them from the accounting. A similar level of detail can be seen for the flows concerning transport. The contributions related to the transport of OFMSW in input as well as of compost and scraps in output can be identified separately.
Like in the ISO 14064-1 [2], the accounting of the emissions related to the exported energy is performed separately. This standard refers to exported electricity as the “electricity that is supplied by the organization to users outside the organizational boundaries” [2] (p. 34).
One of the limits of the tool is that it is based on predefined scenarios that could not entirely represent the reality of a plant. For instance, in the input section, users cannot change pre-set units of measurement or add any phases or flows besides those already provided by default. The type of transport (EURO-4 diesel lorries) also cannot be changed. However, as a result of the last upgrading of regulation [55], based on which incentives are provided to produce biomethane for transport, an increase in consumption of this biofuel also in the waste management sector can be expected. Hence, in the future, it may be useful to add this option to account for the relevant benefit.
The limited flexibility described above, however, seems to be a feature of other simplified tools, such as that analysed by Pattara et al. [1] for accounting GHGs in the wine sector. On the other hand, in this way, the tool is more user-friendly for non-skilled users, who simply have to enter the required data after the appropriate calculations where indicated. Moreover, in the case of CO2mpost, the provided manual contains details on the methodology and examples of how input data should be inserted/collected in order to avoid mistakes. Furthermore, if site-specific data are not available, sector average values are suggested for certain inputs. Finally, the rigidity of the model permits to compare multiple studies given that they are based on the same approach [56].
A critical phase, where special attention is required by the user, is the partitioning of the flows in case of other activities taking place in the same plant, which are to be excluded from the system boundaries. This approach is considered as the last option in the ISO 14040 series [32,33] to deal with multifunctionality. However, being a simplified instrument, the partitioning could be a choice justified by the fact that it is easier than expanding boundaries [57]. Nevertheless, a substitution method is adopted by this tool for the inclusion of avoided impacts as benefits. However, the methodological choice to add, amongst the substitutes of co-products, the avoided impacts related to not sending waste to MBT is not frequent in literature, as this is often considered an alternative scenario in comparative LCA studies. This might become critical for the reliability and comparability of the results, thus becoming a potential limitation of the study. However, it is widely accepted that landfills should be the least-preferred option in waste management from an environmental point of view [58]; therefore, avoided landfilling may represent an implicit benefit for AD and composting. For example, Neri et al. [59] expanded the boundaries by adding avoided landfilling in AD scenarios. The debate on how to deal with multifunctionality is still open, and the work of Moretti et al. [60] demonstrates that there are different schools of thought. The Directive of the European Union [45], for example, recommends the allocation method in the accounting of GHG emissions of co-products from the production and use of biofuels because “it is easy to apply, is predictable over time, minimises counter-productive incentives and produces results that are generally comparable with those produced by the substitution method” [45] (p. 99). In particular, the same Directive proposes an allocation based on energy content. Wardenaar et al. [57], who studied how different allocation methods influence the GHG emission outcomes of an LCA on bio-electricity production, confirm that physical partitioning on energy content is the favoured allocation method for policy directives.
This tool can also be very useful for small companies that do not have enough resources for commissioning analyses from external practitioners. Indeed, the user’s manual contains examples and compilation tips; moreover, few operations are required by the software, and a better understanding of the outcomes is supported by means of graphics and tables. Graphic contents also facilitate communication to stakeholders and allow different outcomes from several analyses to be quickly compared. Mode and content of communication are important aspects, considering the complexity of the argumentation [5] and the need for simplification in order to adapt fact-based information to a heterogeneous audience. In this context, CF has become a popular way to raise awareness on the GHG emissions and their impact on the environment. Organisations could use information given by a CF to communicate their efforts in dealing with the climate crisis, in accordance with several regulations and guidelines (mandatory or not). Examples are the Renewable Energy Directive [45] and its current proposal of amendment [61], in which GHG emission savings criteria are set for bioenergy, and the JRC Report [62] on the accounting of GHG emissions and the ISO 14064-1 [2], which provides a guidance at the organisational level for quantifying and reporting GHG emissions and removals.
In order to make the most of the tool’s potential from a communication point of view—the major strength of this tool, in the authors’ opinion—it is suggested to use it to show the relation between the scraps output and the organic waste input. The scraps are closely related to the quality of the OFMSW, which, in turn, depends on the ability of citizens to correctly segregate the waste at source. Studying household waste has a pivotal relevance if one considers that the largest share of the food waste in Europe derives from the consumption stage [63]. Therefore, this tool could be used to communicate to citizens the results of different scenarios analyses, changing the quantity of produced scraps, such as non-biodegradable materials. During the awareness campaign, citizens should be guided towards a better understanding of how their behaviour may affect the variation of CO2 eq emissions. In this way, their participation in the management of the integrated waste cycle may be improved. Indeed, if the quality of OFMSW increases, the quantity of scraps to incinerate decreases. Despite energy recovery, this activity ranks last in the waste hierarchy [64] in which, instead, prevention comes first. With increased prevention, the impacts of transport to the WtE plant would automatically decrease. A simulation using improvement scenarios could also be useful for a company’s strategic purposes, e.g., when comparing various types of bags for the OFMSW collection. In a recent study authored by Dolci et al. [65], who conducted a comparative LCA of food waste management with different types of collection bags, paper bags have shown interesting results compared to biodegradable plastic bags.
A tailored tool for a specific sector, such as this one, can contribute to improve the performance of the related operators. In this case, the software could support companies to monitor their environmental performances regarding GHG emissions and to achieve voluntary targets. KPIs are considered useful information for the decision-making processes in this regard, e.g., for the development of biogas technologies from food waste [66]. Similarly, Sassanelli et al. [67] stated that KPIs could be applied in internal reporting and benchmarking or for improving databases for life-cycle-based analyses. Moreover, they could support the identification of the environmental and economic benefits of circular economy. In the case of the KPIs proposed in this tool, which relate the CO2 eq with the amount of organic waste collected and treated annually, the benefits of circular economy practices on GHG emissions reduction by means of composting and AD are readily available. They could even be considered as complementary simplified indicators in the circularity assessment of an organic waste management system.
Furthermore, if the use of the tool were to become more widespread throughout a country, more detailed information about the conditions of a specific area could be collected, filling in gaps in national monitoring of climate change impacts, thus making this tool a support for policies. It should be noted that geographical factors can affect data related, e.g., to the implemented technology, the feedstock composition, or the distance from biowaste collection points to plants. Just to name an example, in case of lack of primary data for the transport of OFMSW to the plant, the user’s manual [41] suggests using the national average value (which is more appreciated), i.e., 50 km. In contrast, Giuntoli et al. [62] recommended inputting 20 km for the same transport process, as this is the European average value. Another benefit of sector-specific calculators is the presence of a unique approach, which assures consistency between assessments, thus allowing them to be compared. For this reason, it would be advantageous to promote the use of this tool throughout the country to have sectorial data based on the same methodology for adapting policies to the real context.
A comparison with other tools in the same field has shown that CO2mpost, to the best of the authors’ knowledge, is the only one that provides results concerning the key stages and parameters for both AD and composting plants. Therefore, when analysing AD/composting integrated plants, highlighting the weaknesses and strengths of the system under study is quick and easy. Although developed for the Italian context, the structure of this tool could also be replicated in other countries.
However, since the CF is just focused on one environmental impact category, if performed alone, it could lead the company to suboptimal choices [17] from the environmental point of view because of potential burden shifting [1]. For this reason, future developments of the tool could include a more holistic environmental analysis considering at least those impact categories most affected by AD and composting [68], namely eutrophication and acidification. In this way, potential trade-offs amongst the most important impact categories could be highlighted. Moreover, being a tool suitable to communication, companies could use the results of the analysis for obtaining financial support in terms of sustainable finance if the eligibility criteria of the EU taxonomy [9]—e.g., the impact on local water or on sensitive ecosystems, species, or habitats—were included. The multifunctionality issue should also be better clarified for improving the lack of uniformity in this specific sector, also given the importance of that issue in the field of bioeconomy [60]; indeed, 94% of the studies reviewed by Moretti et al. [60] on LCAs of multifunctional case studies are connected to bioeconomy and related sectors.
Moreover, other case studies should be performed with this tool for generalized and more consistent conclusions taking into account different types of input (for example, not just OFMSW but also manure), different types of activities (only composting plant or AD with post-composting, also including upgrading), and different plant sizes. Finally, an eventual upgrading of the tool should include the use of biomethane as a transport fuel for accounting the relative benefit, in line with the current (legal) developments of this co-product.
5. Conclusions
Given the relevance of climate change issues and the need for mitigation measures in the organic waste management, the tool CO2mpost adopted has proved suitable for measuring and communicating CO2 eq emissions of composting or AD plants activities, including the transport of inputs and outputs. Nevertheless, it is important to underline that it could be risky to communicate the results of a simplified tool to the public if the robustness of the tool had not yet been adequately demonstrated. Tools such this could be also useful for comparisons between AD and composting companies. The software exhibits different features of others simplified tools. The analysis of the tool and its results has made it possible to stress several topics currently subject to debate in the literature, for example, the trade-off between lower flexibility and increased user friendliness of the software or the multifunctionality issues and its different interpretations. Being a simplified tool, CO2mpost strikes a suitable balance between simplicity of assessment and comprehensiveness of results. However, the only impact category considered is climate change, and this could be a limitation for those practitioners that want to obtain an overall picture of their environmental performance. For this reason, an expansion of the analysis to other impact categories that are particularly affected by composting and AD activities would be appreciable. Future developments of the study will include a complete LCA to verify by how much the results of the simplified tool differ from those of the LCA and how many additional resources are needed (time, information, etc.).
Author Contributions
Conceptualization, E.M., V.N., D.M. and A.R.; data curation, E.M. and V.N.; formal analysis, E.M.; methodology, E.M. and A.R.; software, E.M. and V.N.; supervision, A.R.; validation, D.M.; writing—original draft, E.M.; writing—review and editing, V.N., D.M. and A.R. All authors have read and agreed to the published version of the manuscript.
Funding
This research received no external funding.
Institutional Review Board Statement
Not applicable.
Informed Consent Statement
Not applicable.
Data Availability Statement
The data presented in this study are available on request from the corresponding author. The data are not publicly available due to privacy reasons.
Acknowledgments
The authors would like to thank ACEA Pinerolese Industriale S.p.A. for providing the data, Consorzio Italiano Compostatori for making the tool available, and Elia Rillo for his helpful explanations on the software. The authors would also like to thank the reviewers for their helpful comments as well as Anna Walker, who carried out a language review of the latest version of this paper.
Conflicts of Interest
The authors declare no conflict of interest.
References
- Pattara, C.; Raggi, A.; Cichelli, A. Life Cycle Assessment and Carbon Footprint in the wine supply-chain. Environ. Manag. 2012, 49, 1247–1258. [Google Scholar] [CrossRef]
- ISO. ISO 14064-1:2019. Greenhouse Gases Specification with Guidance at the Organization Level for Quantification and Reporting of Greenhouse Gas Emissions and Removals; ISO: Geneva, Switzerland, 2018. [Google Scholar]
- Ellen Macarthur Foundation. Completing the Picture: How the Circular Economy Tackles Climate Change. 2019. Available online: https://www.ellenmacarthurfoundation.org/assets/downloads/Completing_The_Picture_How_The_Circular_Economy-_Tackles_Climate_Change_V3_26_September.pdf (accessed on 8 June 2021).
- Scrucca, F.; Barberio, G.; Fantin, V.; Porta, P.L.; Barbanera, M. Carbon Footprint: Concept, methodology and calculation. In Carbon Footprint Case Studies. Environmental Footprints and Eco-design of Products and Processes; Muthu, S.S., Ed.; Springer: Singapore, 2021; pp. 1–31. [Google Scholar]
- Wilson, A.J.S.; Orlove, B. Climate urgency: Evidence of its effects on decision making in the laboratory and the field. Curr. Opin. Environ. Sustain. 2021, 51, 65–76. [Google Scholar] [CrossRef]
- Yue, T.; Haiwen, L.; Ruyin, L.; Hong, C.; Xin, G.; Junli, L. Research trends and hotspots related to global carbon footprint based on bibliometric analysis: 2007–2018. Environ. Sci. Pollut. Res. 2020, 27, 17671–17691. [Google Scholar] [CrossRef] [PubMed]
- UNEP. UNEP Food Waste Iindex Report. 2021. Available online: https://www.unep.org/resources/report/unep-food-waste-index-report-2021 (accessed on 23 March 2021).
- Siebert, S.; Gilbert, J.; Ricci-Jürgensen, M. Compost Production in Europe. 2021. Available online: https://www.compostnetwork.info/wordpress/wp-content/uploads/190823_ECN-Compost-Production-in-Europe_final_layout-ECN.pdf (accessed on 14 January 2021).
- European Union. Taxonomy Technical Report. 2019. Available online: https://ec.europa.eu/info/sites/info/files/business_economy_euro/banking_and_finance/documents/190618-sustainable-finance-teg-report-taxonomy_en.pdf (accessed on 23 March 2021).
- Manninen, K.; Koskela, S.; Nuppunen, A.; Sorvari, J.; Nevalainen, O.; Siitonen, S. The applicability of the renewable energy directive calculation to assess the sustainability of biogas production. Energy Policy 2013, 56, 549–557. [Google Scholar] [CrossRef]
- European Commission. Sustainability of Bioenergy; Commission Staff Working Document Impact Assessment. SWD, 2016, 418 final. Part 4/4; European Commission: Brussels, Belgium, 2016. [Google Scholar]
- De La Peña, L.; Guo, R.; Cao, X.; Ni, X.; Zhang, W. Accelerating the energy transition to achieve carbon neutrality. Resour. Conserv. Recyc. 2022, 177, 105957. [Google Scholar] [CrossRef]
- European Union. 2030 Climate & Energy Framework. 2020. Available online: https://ec.europa.eu/clima/policies/strategies/2030_en (accessed on 5 January 2021).
- UNFCCC. Paris Agreement. 2015. Available online: https://unfccc.int/sites/default/files/english_paris_agreement.pdf (accessed on 5 October 2021).
- De Rosa, M.; Pizzol, M.; Schmidt, J. How methodological choices affect LCA climate impact results: The case of structural timber. Int. J. Life Cycle Assess. 2018, 23, 147–158. [Google Scholar] [CrossRef]
- Brandão, M.; Levasseur, A.; Kirschbaum, M.U.F.; Weidema, B.P.; Cowie, A.L.; Jørgensen, S.V.; Hauschild, M.Z.; Pennington, D.W.; Chomkhamsri, K. Key issues and options in accounting for carbon sequestration and temporary storage in life cycle assessment and carbon footprinting. Int. J. Life Cycle Assess. 2013, 18, 230–240. [Google Scholar] [CrossRef]
- Arzoumanidis, I.; Fullana-i-Palmer, P.; Raggi, A.; Gazulla, C.; Raugei, M.; Benveniste, G.; Anglada, M. Unresolved issues in the accounting of biogenic carbon exchanges in the wine sector. J. Clean. Prod. 2014, 82, 16–22. [Google Scholar] [CrossRef]
- Rahman, F.; O’Brien, C.; Ahamed, S.I.; Zhang, H.; Liu, L. Design and implementation of an open framework for ubiquitous carbon footprint calculator applications. Sustain. Comput. Inform. Syst. 2011, 1, 257–274. [Google Scholar] [CrossRef]
- Weidema, B.P.; Thrane, M.; Christensen, P.; Schmidt, J.; Løkke, S. Carbon Footprint. A catalyst for Life Cycle Assessment? J. Ind. Ecol. 2008, 12, 3–6. [Google Scholar] [CrossRef]
- Pandey, D.; Agrawal, M.; Pandey, J.S. Carbon footprint: Current methods of estimation. Environ. Monit. Assess. 2011, 178, 135–160. [Google Scholar] [CrossRef]
- United Nation. Transforming our World: The 2030 Agenda for Sustainable Development. 2015. Available online: https://sdgs.un.org/2030agenda (accessed on 1 October 2021).
- Finkbeiner, M.; Neugebauer, S.; Berger, M. Carbon footprint of recycled biogenic products: The challenge of modelling CO2 removal credits. Int. J. Sustain. Eng. 2013, 6, 66–73. [Google Scholar] [CrossRef]
- Arzoumanidis, I.; Salomone, R.; Petti, L.; Mondello, G.; Raggi, A. Is there a simplified LCA tool suitable for the agri-food industry? An assessment of selected tools. J. Clean. Prod. 2017, 149, 406–425. [Google Scholar] [CrossRef]
- European Union. Special Eurobarometer 459 “Climate Change” Report. 2017. Available online: https://op.europa.eu/en/publication-detail/-/publication/5f03345d-9f43-11e7-b92d-01aa75ed71a1/language-en (accessed on 1 December 2021).
- Harangozo, G.; Szigeti, C. Corporate carbon footprint analysis in practice—With a special focus on validity and reliability issues. J. Clean. Prod. 2017, 167, 1177–1183. [Google Scholar] [CrossRef]
- Vosooghnia, A.; Pollettini, A.; Rossi, A.; Vázquez-Rowe, I.; Francini, G. Carbon footprint of anaerobic digestion combined with ultrasonic post-treatment of agro-industrial organic residues. J. Environ. Manag. 2021, 278, 111459. [Google Scholar] [CrossRef] [PubMed]
- Møller, J.; Boldrin, A.; Christensen, T.H. Anaerobic digestion and digestate use: Accounting of greenhouse gases and global warming contribution. Waste Manag. Res. 2009, 27, 813–824. [Google Scholar] [CrossRef] [PubMed] [Green Version]
- Bacenetti, J.; Fiala, M. Carbon footprint of electricity from anaerobic digestion plants in Italy. Environ. Eng. Manag. J. 2015, 14, 1495–1502. [Google Scholar] [CrossRef]
- IPCC. IPCC Guidelines for National Greenhouse Gas Inventories Volume 4 Agriculture, Forestry and Other Land Use. 2006. Available online: https://www.ipcc-nggip.iges.or.jp/public/2006gl/vol4.html (accessed on 1 December 2021).
- Bartocci, P.; Zampilli, M.; Liberti, F.; Pistolesi, V.; Massoli, S.; Bidini, G.; Fantozzi, F. LCA analysis of food waste co-digestion. Sci. Total Environ. 2020, 709, 136187. [Google Scholar] [CrossRef]
- EPD International AB. Product Category Rules. 2020. Available online: https://test1.environdec.com/PCR (accessed on 8 October 2021).
- ISO. ISO 14040: 2006; Environmental Management—Life Cycle Assessment—Principles and Framework. ISO: Geneva, Switzerland, 2006.
- ISO. ISO 14044: 2006; Environmental Management—Life Cycle Assessment—Requirements and Guidelines. ISO: Geneva, Switzerland, 2006.
- Vinci, G.; Ruggieri, R.; Billi, A.; Pagnozzi, C.; Di Loreto, M.V.; Ruggeri, M. Sustainable Management of Organic Waste and Recycling for Bioplastics: A LCA Approach for the Italian Case Study. Sustainability 2021, 13, 6385. [Google Scholar] [CrossRef]
- E4tech. Biomass and Biogas Carbon Calculator (B2C2). 2015. Available online: https://www.e4tech.com/resources/163-biomass-and-biogas-carbon-calculator-b2c2.php?filter=year%3A2015 (accessed on 23 March 2021).
- NNFCC. Biomethane & Biogas Carbon Calculator. 2015. Available online: https://www.nnfcc.co.uk/publications/tool-biomethane-carbon-calculator (accessed on 23 March 2021).
- RENERGON International AG. Anaerobic Digestion Calculator. 2021. Available online: https://www.renergon-biogas.com/en/anaerobic-digestion-calculator (accessed on 2 March 2021).
- Biogas World. Biogas Calculations. 2021. Available online: https://www.biogasworld.com/biogas-calculations (accessed on 23 March 2021).
- World Business Council for Sustainable Development (WBCSD); World Resources Institute (WRI). The Greenhouse Gas Protocol. A Corporate Accounting and Reporting Standard, Revised Edition; WBCSD: Geneva, Switzerland; WRI: Washington, DC, USA, 2004. [Google Scholar]
- ISPRA. Rapporto Rifiuti Urbani—Edizione 2020. 2020. Available online: https://www.isprambiente.gov.it/it/pubblicazioni/rapporti/rapporto-rifiuti-urbani-edizione-2020 (accessed on 29 July 2021). (in Italian)
- Consorzio Italiano Compostatori. CO2mpost v. 1.0—Tool Online per la Valutazione della CO2 Prodotta ed Evitata per le Attività di Compostaggio e Digestione Anaerobica; Manuale utente; Consorzio Italiano Compostatori: Rome, Italy, 2020. (in Italian) [Google Scholar]
- ISO. ISO 14067: 2018; Greenhouse Gases—Carbon Footprint of Products—Requirements and Guidelines for Quantification. ISO: Geneva, Switzerland, 2018.
- Boldrin, A.; Andersen, J.K.; Møller, J.; Favoino, E.; Christensen, T.H. Composting and compost utilization: Accounting of greenhouse gases and global warming contributions. Waste Manag. Res. 2009, 27, 800–812. [Google Scholar] [CrossRef] [Green Version]
- Kuronen, A.; Lehtovaara, M.; Jakobsson, S. Issuance Based Residual Mix Calculation Methodology; Version 1.1; Grexel Systems ltd: Helsinky, Finland, 2020; Available online: https://www.aib-net.org/facts/european-residual-mix (accessed on 21 September 2021).
- European Union. Directive (EU) 2018/2001 of the European Parliament and of the Council of 11 December 2018 on the promotion of the use of energy from renewable sources. L 328/82. 2018. Available online: https://eur-lex.europa.eu/legal-content/EN/TXT/?uri=uriserv:OJ.L_.2018.328.01.0082.01.ENG (accessed on 21 April 2021).
- Klimscheffskij, M.; Van Craenenbroeck, T.; Lehtovaara, M.; Lescot, D.; Tschernutter, A.; Raimundo, C.; Seebach, D.; Timpe, C. Residual mix calculation at the heart of reliable electricity disclosure in Europe—A case study on the effect of the RE-DISS project. Energies 2015, 8, 4667–4696. [Google Scholar] [CrossRef] [Green Version]
- Association of Issuing Bodies. European Residual Mixes 2018; Version 1.2, 2019-07-11; Association of Issuing Bodies: Brussels, Belgium, 2018. [Google Scholar]
- Ecoinvent 3.5. 2018. Available online: https://www.ecoinvent.org/database/older-versions/ecoinvent-35/ecoinvent-35.html (accessed on 18 July 2021).
- Smith, A.; Brown, K.; Ogilvie, S.; Rushton, K.; Bates, J. Waste Management Options and Climate Change: Final Report. 2001. Available online: http://web.rec.org/documents/ECENA/training_programmes/2008_06_budapest/session2/16-climate_change_full_study.pdf (accessed on 16 March 2021).
- ARPAV-ORC. Benefici ambientali nell’utilizzo del compost. In Compost, una Fonte di Nuova Fertilità; Chiarion, M., Ed.; Veneto Agricoltura: Legnaro, Italy, 2009; pp. 19–26. (in Italian) [Google Scholar]
- Mainero, D.; Montoneri, E.; Boffa, V.; Montoneri, C. New Perspective from Organic Fraction Treatment: Renewable Energy and Chemicals. 2014. Available online: https://www.academia.edu/33155590/New_Perspective_From_Organic_Fraction_Treatment_Renewable_Energy_and_Chemicals (accessed on 25 March 2021).
- ISO. ISO/TR 14049: 2012; Environmental Management—Life Cycle Assessment—Illustrative Examples on How to Apply ISO 14044 to Goal and Scope Definition and Inventory Analysis. ISO: Geneva, Switzerland, 2012.
- ISPRA. Italian Greenhouse Gas Inventory 1990–2017. National Inventory Report 2019. 2019. Available online: https://www.ruminantia.it/ispra-pubblicato-litalian-greenhouse-gas-inventory-1990-2017-national-inventory-report-2019 (accessed on 28 June 2021).
- Rillo, E.; Studio Fieschi & Soci Srl, Turin, Italy. Personal Communication, 2022.
- MiSE. Decreto 2 marzo 2018 sulla Promozione dell’uso del Biometano e Degli Altri Biocarburanti Avanzati nel Settore dei Trasporti; GU Serie Generale n.65 del 19-03-2018; Ministero dello Sviluppo Economico: Rome, Italy, 2018. (in Italian) [Google Scholar]
- Östergren, K.; Scherhaufer, S.; De Menna, F.; Herrero, L.G.; Gollnow, S.; Davis, J.; Vittuari, M. Simplified LCA & LCC of Food Waste Valorization, Description of Standardised Models for the Valorisation Spreadsheet Tool for Life-Cycle Assessment and Life-Cycle Costing; REFRESH Deliverable 5.4; 2018. Available online: https://eu-refresh.org/simplified-lca-lcc-food-waste-valorisation.html (accessed on 12 October 2021).
- Wardenaar, T.; van Ruijven, T.; Beltran, A.M.; Vad, K.; Guinée, J.; Heijungs, R. Differences between LCA for analysis and LCA for policy: A case study on the consequences of allocation choices in bio-energy policies. Int. J. Life Cycle Assess. 2012, 17, 1059–1067. [Google Scholar] [CrossRef] [Green Version]
- Cobo, S.; Dominguez-Ramos, A.; Irabien, A. From linear to circular integrated waste management systems: A review of methodological approaches. Resour. Conserv. Recy. 2018, 135, 279–295. [Google Scholar] [CrossRef]
- Neri, E.; Passarini, F.; Cespi, D.; Zoffoli, F.; Vassura, I. Sustainability of a bio-waste treatment plant: Impact evolution resulting from technological improvements. J. Clean. Prod. 2017, 171, 1006–1019. [Google Scholar] [CrossRef]
- Moretti, C.; Corona, B.; Edwards, R.; Junginger, M.; Moro, A.; Rocco, M.; Shen, L. Reviewing ISO compliant multifunctionality practices in environmental life cycle modelling. Energies 2020, 13, 3579. [Google Scholar] [CrossRef]
- European Union. Proposal for a directive of the European Parliament and of the Council amending Directive (EU) 2018/2001 of the European Parliament and of the Council, Regulation (EU) 2018/1999 of the European Parliament and of the Council and Directive 98/70/EC of the European Parliament and of the Council as regards the promotion of energy from renewable sources, and repealing Council Directive (EU) 2015/652. COM (2021) 557 final. 2021. Available online: https://ec.europa.eu/info/sites/default/files/amendment-renewable-energy-directive-2030-climate-target-with-annexes_en.pdf (accessed on 13 October 2021).
- Giuntoli, J.; Agostini, A.; Edwards, R.; Marelli, L. Solid and Gaseous Bioenergy Pathways: Input Values and GHG Emissions. Calculated According to the Methodology set in COM, 2016, 767; Version 2; Publications Office of the European Union: Luxembourg, 2017; Available online: https://publications.jrc.ec.europa.eu/repository/handle/JRC104759 (accessed on 2 December 2021).
- Caldeira, C.; De Laurentiis, V.; Corrado, S.; van Holsteijn, F.; Sala, S. Quantification of food waste per product group along the food supply chain in the European Union: A mass flow analysis. Resour. Conserv. Recyc. 2019, 149, 479–488. [Google Scholar] [CrossRef]
- European Parliament. Directive 2008/98/EC of the European Parliament and of the Council of 19 November 2008 on Waste and Repealing Certain Directives. 2008. Available online: https://eur-lex.europa.eu/eli/dir/2008/98/2018-07-05 (accessed on 14 March 2021).
- Dolci, G.; Rigamonti, L.; Grosso, M. Life cycle assessment of the food waste management with a focus on the collection bag. Waste Manag. Res. 2021, 39, 1317–1327. [Google Scholar] [CrossRef]
- Feiz, R.; Johansson, M.; Lindkvist, E.; Moestedt, J.; Påledal, S.N.; Svensson, N. Key performance indicators for biogas production—Methodological insights on the life-cycle analysis of biogas production from source-separated food waste. Energy 2020, 200, 117462. [Google Scholar] [CrossRef]
- Sassanelli, C.; Rosa, P.; Rocca, R.; Terzi, S. Circular economy performance assessment methods: A systematic literature review. J. Clean. Prod. 2019, 229, 440–453. [Google Scholar] [CrossRef]
- Mancini, E.; Negro, V.; Mainero, D.; Raggi, A. Analisi di uno strumento di carbon footprint per il compostaggio e la digestione anaerobica. In Innovazione e Circolarità—Il Contributo del Life Cycle Thinking nel Green Deal per la Neutralità Cclimatica. Proceedings of the Italian LCA Network Conference, Reggio Calabria, Italy, 22–24 September 2021; forthcoming.
Figure 1.
Simplified flow chart of inputs and outputs of the plant.

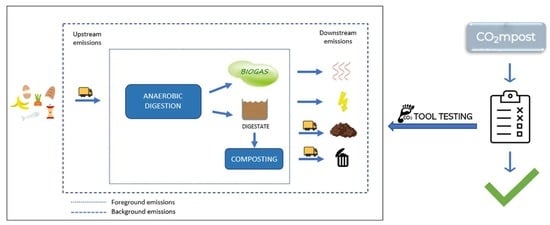
Figure 2.
System boundaries of the study.

Figure 3.
Overview of the main results from the online tool (English translation by the authors). The results are expressed per year (2019).
Figure 3.
Overview of the main results from the online tool (English translation by the authors). The results are expressed per year (2019).

Figure 4.
Details of avoided and emitted CO2 eq provided by the tool (English translation by the authors).
Figure 4.
Details of avoided and emitted CO2 eq provided by the tool (English translation by the authors).


Table 1.
Main emission factors for GHG emissions accounted [41].
Table 1.
Main emission factors for GHG emissions accounted [41].
| Type of Activity | Emission Factor | Source |
|---|---|---|
| Energy consumption | ||
| Italian electricity residual mix | 0.596 kg CO2 eq/kWh | [47] |
| Renewable resources | ||
| hydropower | 0.0062 CO2 eq/kWh | [48] |
| photovoltaic | 0.069 CO2 eq/kWh | [48] |
| wind power | 0.017 CO2 eq/kWh | [48] |
| geothermal | 0.074 CO2 eq/kWh | [48] |
| other renewable resources | 0.265 CO2 eq/kWh | [48] |
| Fossil resources | ||
| natural gas | 2.60 kg CO2 eq/m3 | [48] |
| LPG—liquefied petroleum gas | 0.935 kg CO2 eq/kg | [48] |
| diesel oil | 0.268 kg CO2 eq/kg | [48] |
| gasoline | 0.258 kg CO2 eq/kg | [48] |
| Auxiliary materials consumption | ||
| polyelectrolytes | 0.332 kg CO2 eq/kg | [48] |
| sulphuric acid | 0.116 kg CO2 eq/kg | [48] |
| iron (III) chloride | 0.831 kg CO2 eq/kg | [48] |
| amine oxide | 4.830 kg CO2 eq/kg | [48] |
| lubricating oil | 1.270 kg CO2 eq/kg | [48] |
| Direct emissions | ||
| methane, biogenic | 27.8 kg CO2 eq/kg | [48] |
| dinitrogen monoxide | 265 kg CO2 eq/kg | [48] |
| direct emissions for biogas combustion | 0.0296 kg CO2 eq/m3 | [48] |
| Waste treatment | ||
| residual waste (to landfill) | 0.097 kg CO2 eq/kg | Calculated by the tool developer |
| WtE | 0.038 kg CO2 eq/kg | [48] |
| wastewater treatment | 0.49 kg CO2 eq/m3 | [48] |
| Transport | ||
| in input/in output | 0.163 kg CO2 eq/tkm | [48] |
| Compost | ||
| avoided unit of peat | 0.823 kg CO2 eq/kg | [49,50] |
| avoided unit of nitrogen (N) fertiliser | 5.290 kg CO2 eq/kg | [49,50] |
| avoided unit of phosphorus (P) fertiliser | 0.520 kg CO2 eq/kg | [49,50] |
| Avoided unit of potassium (K) fertiliser | 0.380 kg CO2 eq/kg | [49,50] |
| avoided waste in MBT before landfilling | 0.104 kg CO2 eq/kg | Calculated by the tool developer |
Publisher’s Note: MDPI stays neutral with regard to jurisdictional claims in published maps and institutional affiliations. |
© 2022 by the authors. Licensee MDPI, Basel, Switzerland. This article is an open access article distributed under the terms and conditions of the Creative Commons Attribution (CC BY) license (https://creativecommons.org/licenses/by/4.0/).
Share and Cite
MDPI and ACS Style
Mancini, E.; Negro, V.; Mainero, D.; Raggi, A. The Use of a Simplified Carbon Footprint Tool for Organic Waste Managers: Pros and Cons. Sustainability 2022, 14, 1951. https://doi.org/10.3390/su14041951
AMA Style
Mancini E, Negro V, Mainero D, Raggi A. The Use of a Simplified Carbon Footprint Tool for Organic Waste Managers: Pros and Cons. Sustainability. 2022; 14(4):1951. https://doi.org/10.3390/su14041951
Chicago/Turabian StyleMancini, Eliana, Viviana Negro, Davide Mainero, and Andrea Raggi. 2022. "The Use of a Simplified Carbon Footprint Tool for Organic Waste Managers: Pros and Cons" Sustainability 14, no. 4: 1951. https://doi.org/10.3390/su14041951
Note that from the first issue of 2016, this journal uses article numbers instead of page numbers. See further details here.