Article

Influence of the Height in a Colombian Multi-Tunnel Greenhouse on Natural Ventilation and Thermal Behavior: Modeling Approach

by
Edwin Villagrán
1,
Jorge Flores-Velazquez
2,*,
Mohammad Akrami
3,* and
Carlos Bojacá
1
1
Department of Biological and Environmental Sciences, Faculty of Natural Sciences and Engineering, Jorge Tadeo Lozano University, Bogotá 111321, Colombia
2
Coordination of Hydrosciences, Postgraduate Collage, Carr Mex Tex km 36.5, Montecillo Edo de Mexico 62550, Mexico
3
Department of Engineering, University of Exeter, Exeter EX4 4QF, UK
*
Authors to whom correspondence should be addressed.
Sustainability 2021, 13(24), 13631; https://doi.org/10.3390/su132413631
Submission received: 25 October 2021 / Revised: 25 November 2021 / Accepted: 6 December 2021 / Published: 9 December 2021
(This article belongs to the Special Issue Sustainable Agricultural Engineering Technologies and Applications)

Abstract

:
The dimensions of a passive greenhouse are one of the decisions made by producers or builders based on characteristics of the available land and the economic cost of building the structure per unit of covered area. In few cases, the design criteria are reviewed and the dimensions are established based on the type of crop and local climate conditions. One of the dimensions that is generally exposed to greater manipulation is the height above the gutter and the general height of the structure, since a greenhouse with a lower height has a lower economic cost. This has led some countries in the tropical region to build greenhouses that, due to their architectural characteristics, have inadequate microclimatic conditions for agricultural production. The objective of this study was to analyze the effect on air flows and thermal distribution generated by the increase of the height over gutter of a Colombian multi-tunnel greenhouse using a successfully two-dimensional computational fluid dynamics (CFD) model. The simulated numerical results showed that increasing the height of the greenhouse allows obtaining temperature reductions from 0.1 to 11.7 °C depending on the ventilation configuration used and the external wind speed. Likewise, it was identified that the combined side and roof ventilation configuration (RS) allows obtaining higher renovation indexes (RI) in values between 144 and 449% with respect to the side ventilation (S) and roof ventilation (R) configurations. Finally, the numerical results were successfully fitted within the surface regression models responses.

1. Introduction

In Colombia, plasticulture and protected agriculture have promoted a method of agricultural production that generates higher crop yields per unit of available land area, compared to open field production [1]. The use of passive greenhouses, where the microclimate is managed by means of natural ventilation, has become more widespread. This type of greenhouse is also quite common in other regions of the world [2]. This cultivation method allows, among others, the intensification of horticultural or ornamental production [3], better management of water resources and fertilizer applications [4,5], partial or total control of the micro-climatic variables that affect crop growth and development [6]. In recent years, this production technology has also become a crop protection tool used by producers in the face of increasingly frequent and severe weather events due to climate change [3,7,8].
The use of greenhouses or protected agriculture structures with plastic roofing worldwide has been estimated at more than 3.5 million hectares, which have been established mainly in countries such as China, Korea, Spain, Mexico, France and Italy [9]. In the specific case of Colombia, statistics show that there are approximately 11,000 hectares destined for the ornamental and horticultural sectors. The main production areas are located mostly in regions with altitudes above 1500 m above sea level, where cold and humid mountain climate conditions predominate [10,11,12]. In Colombia, as in the other countries mentioned above, different types of greenhouses have been built and a high percentage of them are light structures with a low technological level [13,14].
These typologies of geometric designs of plastic roofing greenhouses already conceived, originated from some initial concerns of the producers such as land area, easily available structural and roofing materials, versatile structure designs for its construction, but mainly the final economic cost of the greenhouse or structure used. [15,16]. However, an adequate design process should include an analysis of the local climatic conditions so that, based on these conditions, the builders or decision makers can propose the appropriate architecture and geometry of the greenhouse that, together with the selected roofing material, will generate adequate microclimate conditions for the growth and development of the crops [17,18].
In terms of climatic information, there are already local or regional information tools or systems where it is possible to obtain data series of the main meteorological variables of a specific site. In the last three decades, significant progress has been made in improving the optical and thermal properties of polyethylene roofing material, seeking greater benefits for the development of the main horticultural and ornamental crops [19,20]. Therefore, in each country the producer has the possibility of selecting a type of plastic roofing according to his needs. This facilitates the selection of an optimal roofing material or the most suitable for the local climate conditions, so that inside the structures the behavior of temperature, relative humidity and vapor pressure deficit can be managed within the optimal range for agricultural production [21].
On the other hand, there is the architectural aspect and the geometrical dimensions of the greenhouse to be built. Although there are some design parameters established for naturally ventilated greenhouses, such as the width and length [22]. The information available on other parameters such as height is variable and many of the related studies recommend increasing the height of structures used in tropical and subtropical climate conditions [10,23]. However, the height level of the structure is not defined to a specific limit but varies between types of greenhouses and types of climatic conditions [17,24]. It would be ideal, therefore, to have at the availability of the greenhouse structure designers, a software or a design methodology that allows them to evaluate this characteristic and to be able to define the adequate dimensions. This design tool should be able to be implemented in different types of greenhouses and under different operation scenarios.
One of the methodologies that can offer quick solutions is computational fluid dynamics (CFD) simulation. This simulation tool has been implemented to analyze aspects related to the characteristics of multiple types of greenhouses [25,26,27]. In addition, when a CFD model is successfully validated experimentally, it is possible to analyze unbuilt scenarios, which promotes the efficient use of resources and avoids the construction of unsuitable greenhouse structures or undesirable microclimate conditions [28,29].
Regarding the use of CFD studies applied to the optimization of passive greenhouse structures, it should be mentioned that, for example, in a two-dimensional study for a Chinese solar greenhouse, it was determined that, as longer greenhouse sections were generated, higher temperatures were produced inside the structure [30]. Similarly, Villagrán et al. [10] determined that by increasing the roof ventilation surface with respect to the covered floor area (SVC/SC) from 2.5 to 20.1% in a traditional Colombian greenhouse, it was possible to obtain ventilation rates higher than 0.04 m3 s−1 m−2 for the prevailing conditions of the local climate.
Regarding the greenhouse width, it is known that in Almeria type structures [31], which include the arc type [32] and gothic tunnel type [33], as the more spans that are joined laterally, the greater the width of the greenhouse, the ventilation rate is reduced exponentially, which in turn generates higher temperature values inside the greenhouse [31,32,33]. For the height dimension, Boulard and Fatnassi [34] using a CFD-2D study on an 8-span arch-type greenhouse found that when the height above the greenhouse gutter increases from 3 to 5 m, the reduction of the thermal gradient between the interior and the exterior is reduced from 3.5 to 2.0 °C. This allowed the authors to conclude that the greenhouse height positively affects the natural ventilation phenomenon and allows to generate better thermal conditions inside the greenhouse [34].
Recently Fatnassi et al. [35] conducted a study in a tunnel type greenhouse with butterfly roof vents, where the thermal behavior of the greenhouse was evaluated numerically under four different gutter heights, 4, 5, 6 and 7 m, respectively. It was found that when the height is increased from 4 to 5 m, the temperature inside the greenhouse decreases by approximately 2 °C, while when it is increased from 6 to 7 m the temperature value only decreases by 0.2 °C. According to these results, the authors concluded that the effect of increasing greenhouse height on air temperature is clearly asymptotic, therefore, the increase in height should be analyzed as a climatic benefit versus economic cost ratio.
In this study, an experimentally validated CFD-2D model has been implemented under the climatic conditions of a region of the savanna of Bogota, Colombia. The CFD model was used to evaluate the effects on the air flow velocity and the interior temperature of a gothic-type greenhouse as the height level increases from 2.5 m to 5.0 m, under three ventilation configurations, side ventilation (R), roof vents (S) and combined ventilation (RS). Finally, the numerical data obtained in each of the developed simulation scenarios were grouped by ventilation configuration and fitted to response surface regression models. This was done to generate a more integrated and simpler method of analysis of the response variables analyzed and their relationship with the microclimate generated

2. Materials and Methods

2.1. Description of Prototype Proposed for Analysis

The analysis proposed in this research was carried out on a gothic multi-tunnel greenhouse with a 200 µm thick polyethylene cover located in the Savannah of Bogota, Colombia. The greenhouse was composed of a total of six spans, each span had a width length of 9.33 m, for a total greenhouse width length of 55.98 m (Figure 1). The greenhouse had a gutter height of 4.0 m and a maximum roof height of 8.3 m. It was equipped with ventilation areas on the side walls, with an effective opening of 3.7 m, which equals a lateral ventilation surface with respect to the covered floor area of 13.21%. Likewise, the ventilation surface was complemented with a roof ventilation area of 1.5 m of total opening in each of the spans, therefore, the roof ventilation surface with respect to the covered surface is 16.1%.

2.2. Computational Fluid Dynamics Modeling

The numerical calculation of the physical processes involving fluid movement and related variables such as pressure, force, density, temperature and their associated changes in heat and mass transfer phenomena can be solved using computational fluid dynamics [36]. Currently, CFD is one of the most widely used analysis, design or redesign methodologies in different sectors of the economy, therefore, it is possible to find CFD studies approached from mechanical, environmental, aeronautical and automotive engineering [37]. On the other hand, its use in the agricultural sector has not been insignificant and in the last two decades it has been implemented as a tool for process analysis involving natural ventilation processes or energy optimization of greenhouse structures [22,38].
CFD analysis is a resolution technique that solves a set of nonlinear partial equations from algebraic discretization by means of numerical simulation using the finite volume method. A CFD simulation process is composed of three phases of development, preprocessing, processing and post-processing [39]. In the preprocessing phase, the computational domain, and the geometry of the structure on which the natural ventilation process will be analyzed are designed. In this phase the numerical meshing process applied to the whole computational domain including the greenhouse geometry is also generated, these processes must be performed based on criteria of good CFD simulation practices [22,40].
In the processing phase, the numerical solution of the evaluated problem is performed, when the air and energy flow in the model is calculated by solving the governing equations based on the physical laws of conservation of energy, mass and momentum. In this phase, the sub models considered as source terms of the governing equations are selected, such as turbulence, buoyancy or free convection, solar radiation, porous media and phenomena associated with mass transfer [41]. Finally, in the post-processing phase, it is possible to develop a qualitative and quantitative analysis of the numerical results obtained for each scenario evaluated [42].
It should be noted that the CFD-2D model used in this research has been previously successfully validated experimentally, verifying its high predictive capacity for air flow patterns and thermal distribution inside the greenhouse analyzed. The validation results can be verified in the works developed by Villagrán and Bojacá [16,43] and by Villagrán et al. [1]. Therefore, for this research work, details related to the validation process will not be discussed, although relevant aspects of each of the CFD simulation phases will be mentioned.

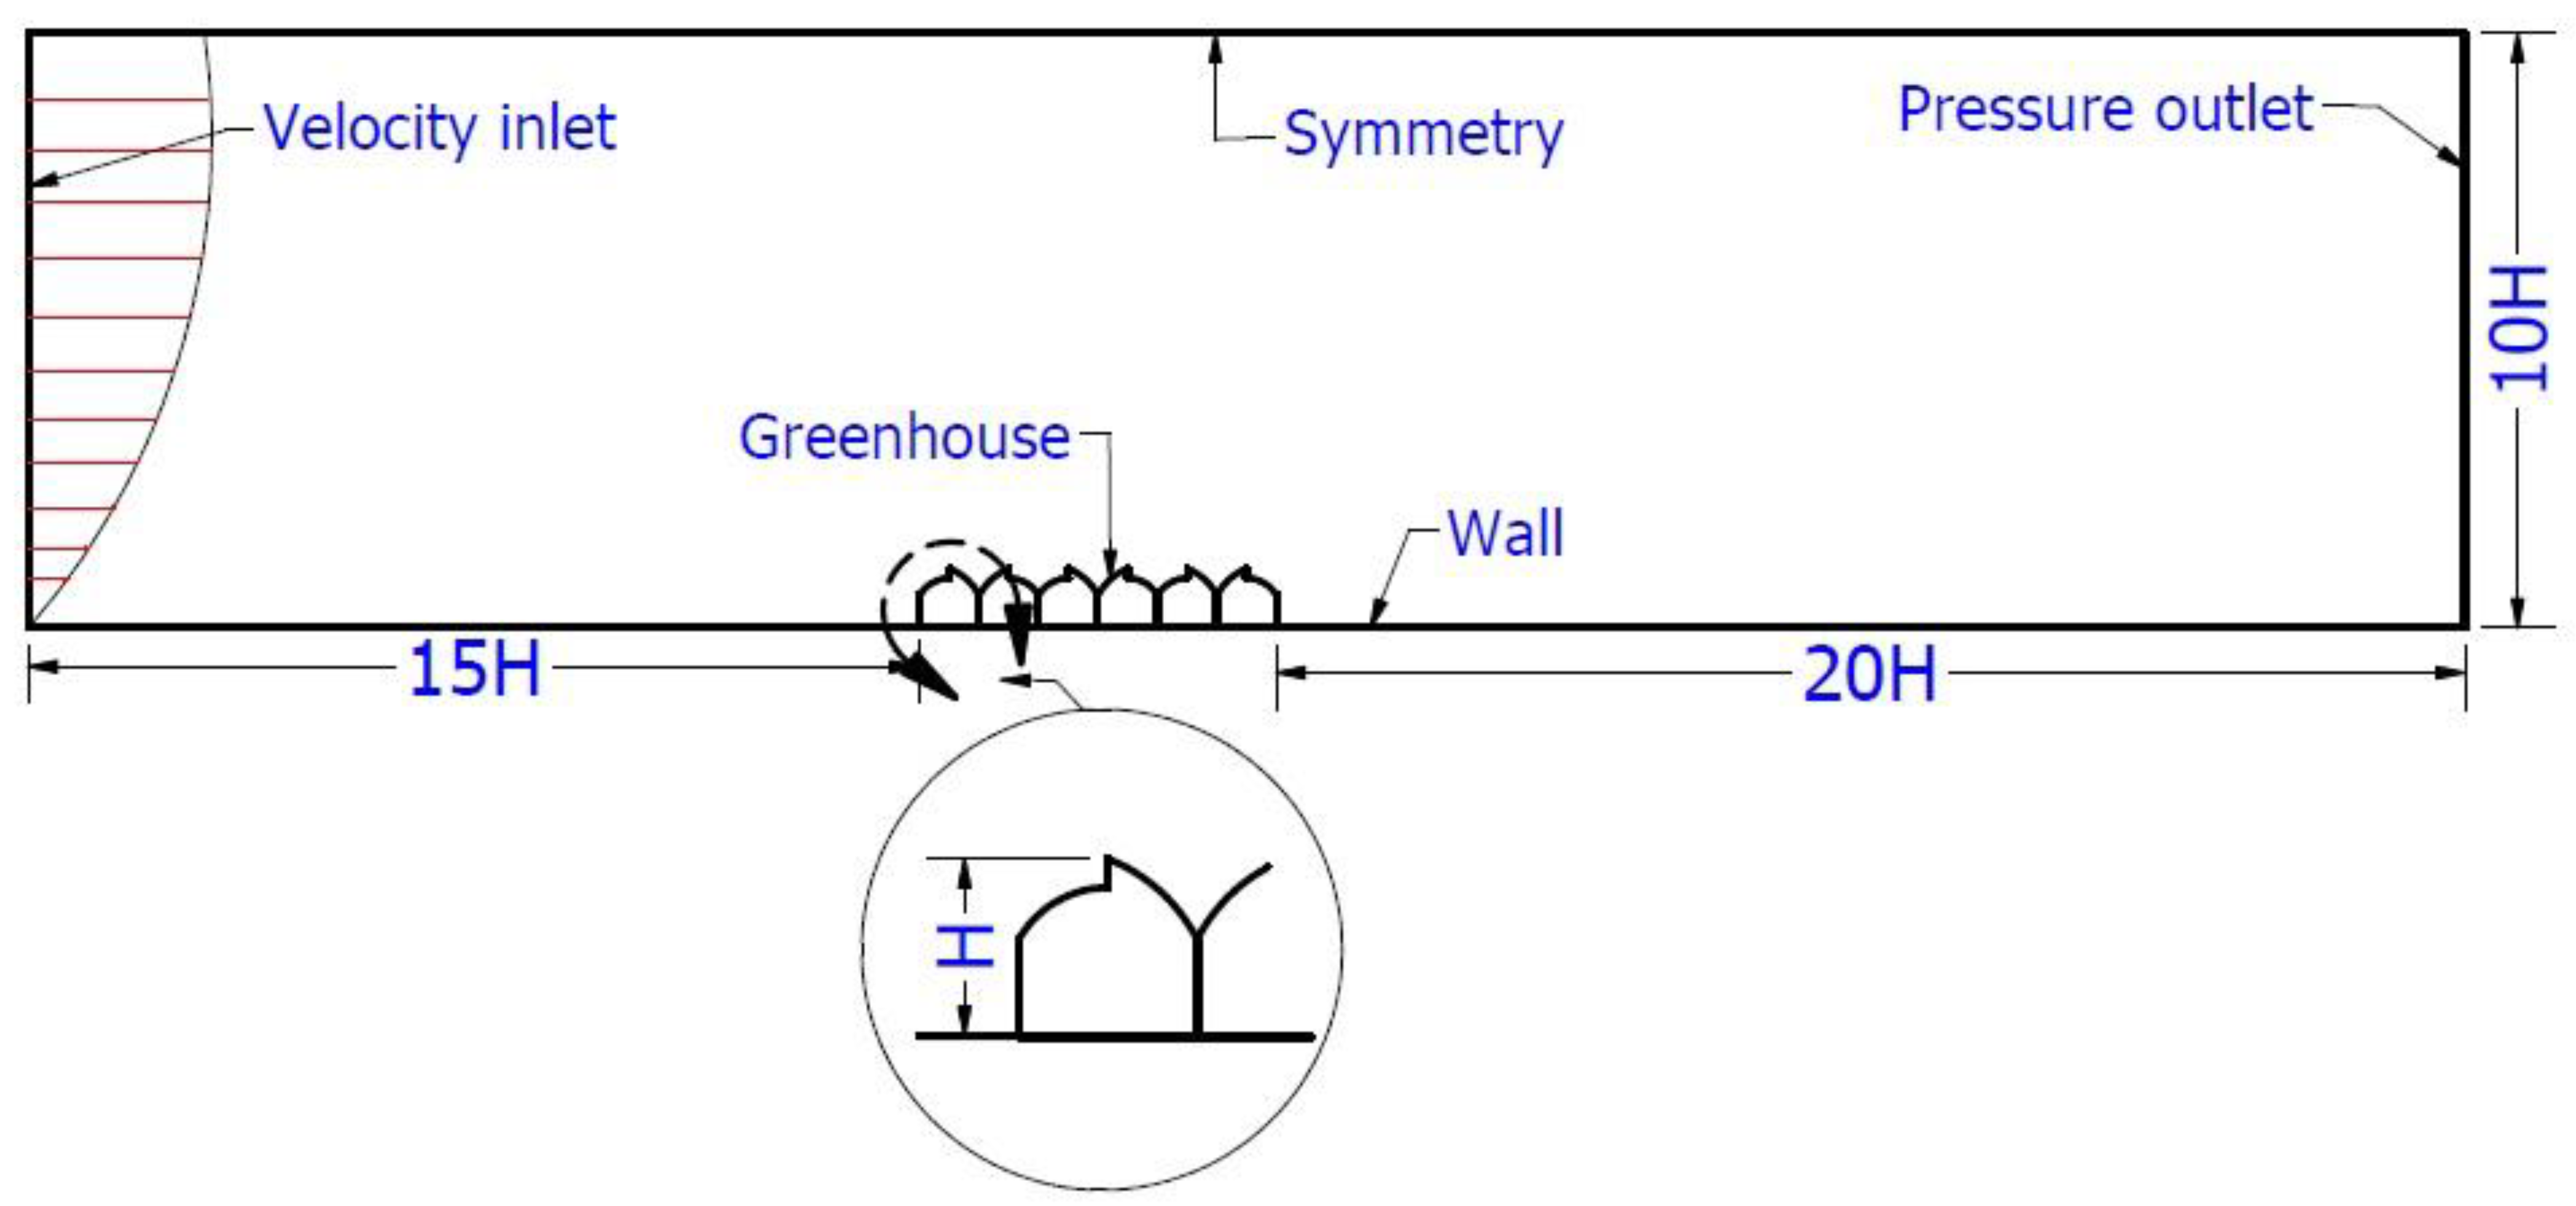
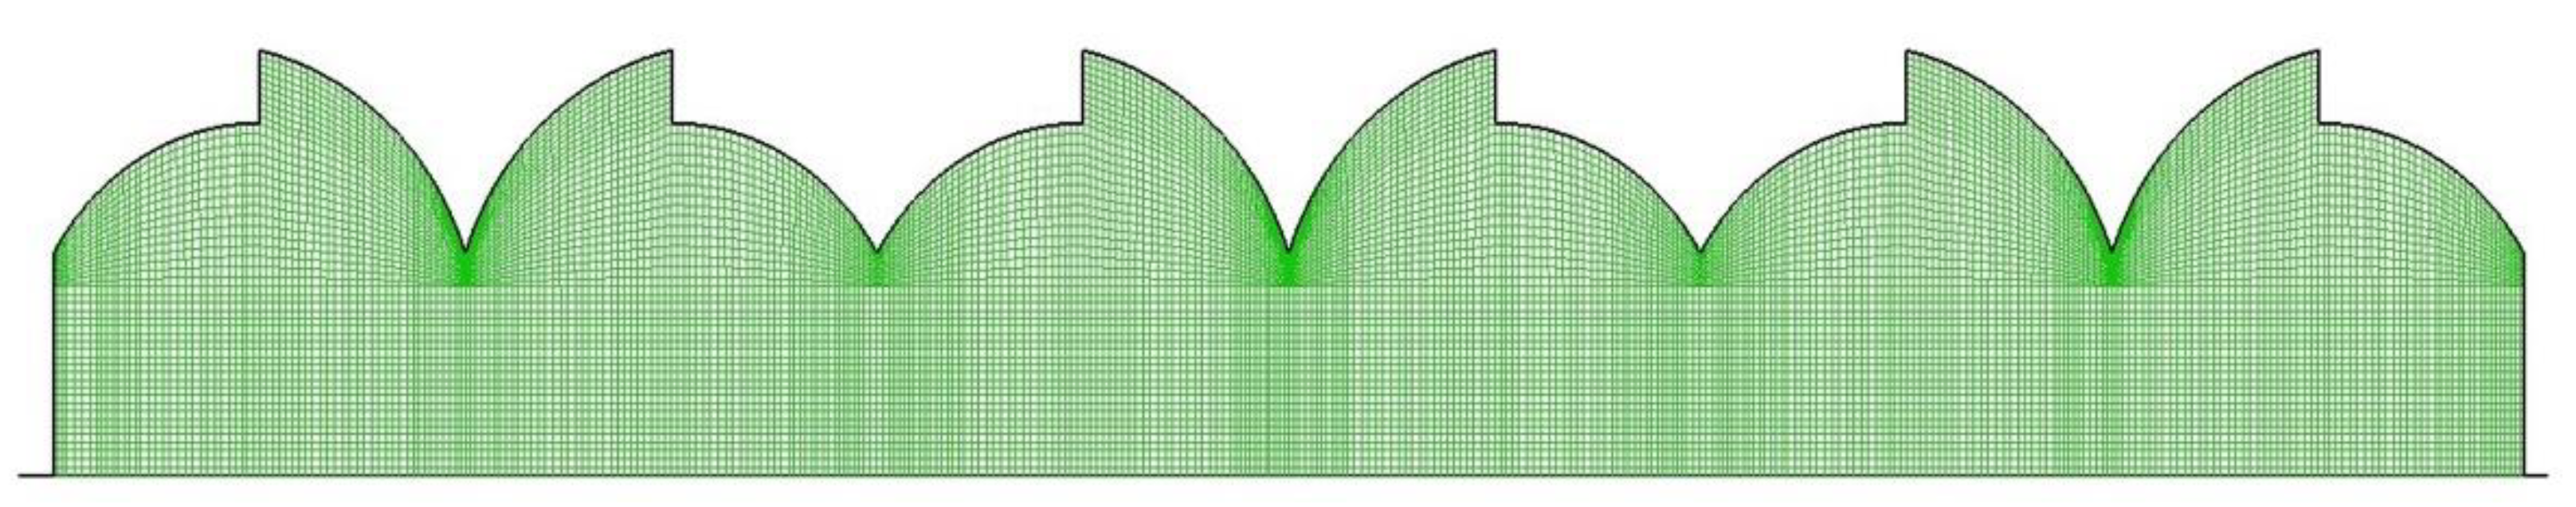
2.2.1. Pre-Processing

The commercial software ANSYS ICEM CFD (v. 18.0, ANSYS Inc., Canonsburg, PA, USA, EE. UU.) was used, by means of which a large computational domain was created in a two-dimensional configuration. It included the geometry of the cross section of the analyzed greenhouse, as well as the process of meshing the computational domain was performed by means of this software. The two-dimensional CFD studies of natural ventilation are useful and have a capacity to predict the ventilation rate and the thermal distribution, inside a structure when the dominant external wind currents blow perpendicular to the ventilation areas [27,44].
It was determined that the dimensions of the computational domain, establishing as the reference for the maximum height of the structure (H), should have dimensions from the region of the airflow inlet to the windward sidewall of the structure of 15H. From the leeward sidewall to the airflow outlet boundary of 20H and a minimum height from ground level of 10H (Figure 2). These dimensions are established following the guidelines given in numerical studies of natural ventilation of greenhouses and are the dimensions that allow to adequately describe the physical phenomena associated with the analyzed problem within the atmospheric boundary layer [1,45].
In the meshing process, the computational domain volume was discretized into an unstructured grid of square or rectangular elements (Figure 3). The size of the numerical grid was defined by a mesh independence test as described in the work done by Villagran et al. [1], at the end of the analysis process, the selected numerical grid was composed of a total of 1,104,369 elements. The quality parameters evaluated were cell size and cell-to-cell size variation; it was found that 95.2% of the cells of the mesh were within the high-quality interval (0.95–1). The orthogonality criterion was also evaluated, where the minimum value obtained was 0.92, a value considered as high quality [10].
Once the geometry has been constructed, it is possible to define the boundary conditions to be established in the limits of the computational domain and in the geometry of the greenhouse (Figure 1). In this specific case the right side was defined as the air flow inlet boundary, for which a condition determined by a logarithmic wind speed profile was established, this logarithmic profile depends on the climatic characteristics and the type of soil in the study region, factors that have been previously determined in the work developed by Villagrán et al. [1].
The left boundary on the other hand was determined as a pressure and airflow outflow boundary, while the upper boundary of the computational domain was set as a wall boundary condition with an imposed solar radiation flux. The wall-type boundary condition was also established for the lower boundary of the computational domain, the floor, the walls and the roof of the greenhouse, while the ventilation areas were set to the indoor boundary condition depending on the ventilation configuration analyzed. The physical and optical properties of the materials within the computational domain were also defined with the values summarized in Table 1.
Subsequently, six greenhouse models (M1–M6) were created with the only variations being the height under the gutter (H1) and the lateral ventilation dimension (SV), as described in Table 2. The meshing process for models M1 to M6 was performed on the same geometric model already discretized from model M4, simply decreasing the greenhouse height for models M1 to M3 and increasing it for models M5 and M6.
Finally, the simulation scenarios to be analyzed were defined, these were built from the ventilation configurations used locally, which are: ventilation by the lateral sides (S), by the roof vents (R) and combined ventilation (RS). After this, the greenhouse model to be evaluated was defined from M1 to M6 and finally the climatic conditions to be used as starting conditions for each simulation were determined. These conditions were known from previous studies developed in the same study region and where it was established that the maximum daytime temperature averaged 22.3 °C, the maximum solar radiation level was 853 Wm-2 and wind conditions can vary between values of 0.2 and 1.6 ms−1. Therefore, it was determined to perform the evaluations under four wind speeds S1 (0.2 ms−1), S2 (0.5 ms−1), S3 (1 ms−1) and S4 (1.6 ms−1). According to the above, 72 simulations were performed and coded as shown in Table 3.

2.2.2. Processing

For the numerical solution of the Reynolds-averaged Navier-Stokes (RANS) equations, the ANSYS FLUENT processing software was used. The air flow in the greenhouse was considered to be turbulent and with a density change associated with temperature changes that can be modeled by the Boussinesq approximation. The method of resolution selected for the CFD model was semi-implicit for the pressure and velocity bound equations using the SIMPLE algorithm. Finally, residual convergence criteria were established in 10−6 for the energy equation and in 10−3 for the other variables such as continuity, turbulence and momentum [41].
The influence of solar radiation intensity on the spatial behavior of temperature was considered using the discrete order (DO) radiation model, which allows modeling the radiation and calculating the convective exchanges that occur in the computational domain, [46].
It was also decided not to include any type of crop, because the purpose of the study is not to analyze the heat and mass transfer flows that occur between the indoor environment and any species of plants. On the contrary, the main objective is to make an analysis of the ventilation phenomenon under the most critical condition that can occur in a real scenario and that is in empty conditions and under the most extreme climatic conditions [37,47]. This is an approach that is still valid and continues to be implemented in a significant number of studies carried out in various countries [48,49,50,51]. In addition, as different types of horticultural, ornamental, aromatic and medicinal crops are grown in the region, the analysis developed in this study can be applied to any type of crop.

2.2.3. Post-Processing

For this phase, where the main objective is to perform the qualitative and quantitative analysis of the evaluated scenarios, ANSYS CFD-Post software was used. Therefore, for each of the 72 simulations developed, two-dimensional plots of temperature and airflow patterns were generated and numerical values of air velocity and temperature in the greenhouse cross section at a height of 1.4 m above ground level were extracted. These data sets were analyzed for each simulation scenario and as a whole using response surface regression models.

2.2.4. Response Surface Modeling

Response surface regression models were fitted to each of the three ventilation scenarios under consideration (roof (R), side (S), and roof—side (RS)). For each scenario, models were fitted to evaluate the response of varying levels of exterior wind speed and greenhouse height on the internal temperature and air velocity. The objectives of applying response surface models on top of the CFD simulated scenarios was threefold: (1) to establish an approximate relationship between the response variables and the exterior wind speed and greenhouse height that can be used for predicting temperature or internal wind speed values for a given combination of the predictors; (2) to determine the statistical significance of the explanatory variables through hypothesis testing; and (3) to determine the optimum combination of the explanatory variables that result in the maximum response over the region under consideration.
Response surface models are an extension of linear models and works similarly; however, extra arguments should be added to consider the response-surface portion of the model [52]. In the present study, second order models including first-order response, two-way interactions and quadratic terms for the explanatory variables were included in the model’s formulation. Once calibrated, the models were tested for their goodness of fit through measures such as the coefficient of determination, lack of fit and pure error [53,54].
The output of the models was plotted as perspective plots to depict the combined effect of the experimental factors (external wind speed and greenhouse height) over the dependent variables (internal temperature and air velocity). The models were fitted using the rsm package (v. 2.10.2; [52]) included in the statistical software R (v. 4.0.4; [55]).

3. Results and Discussion

3.1. Airflow Patterns

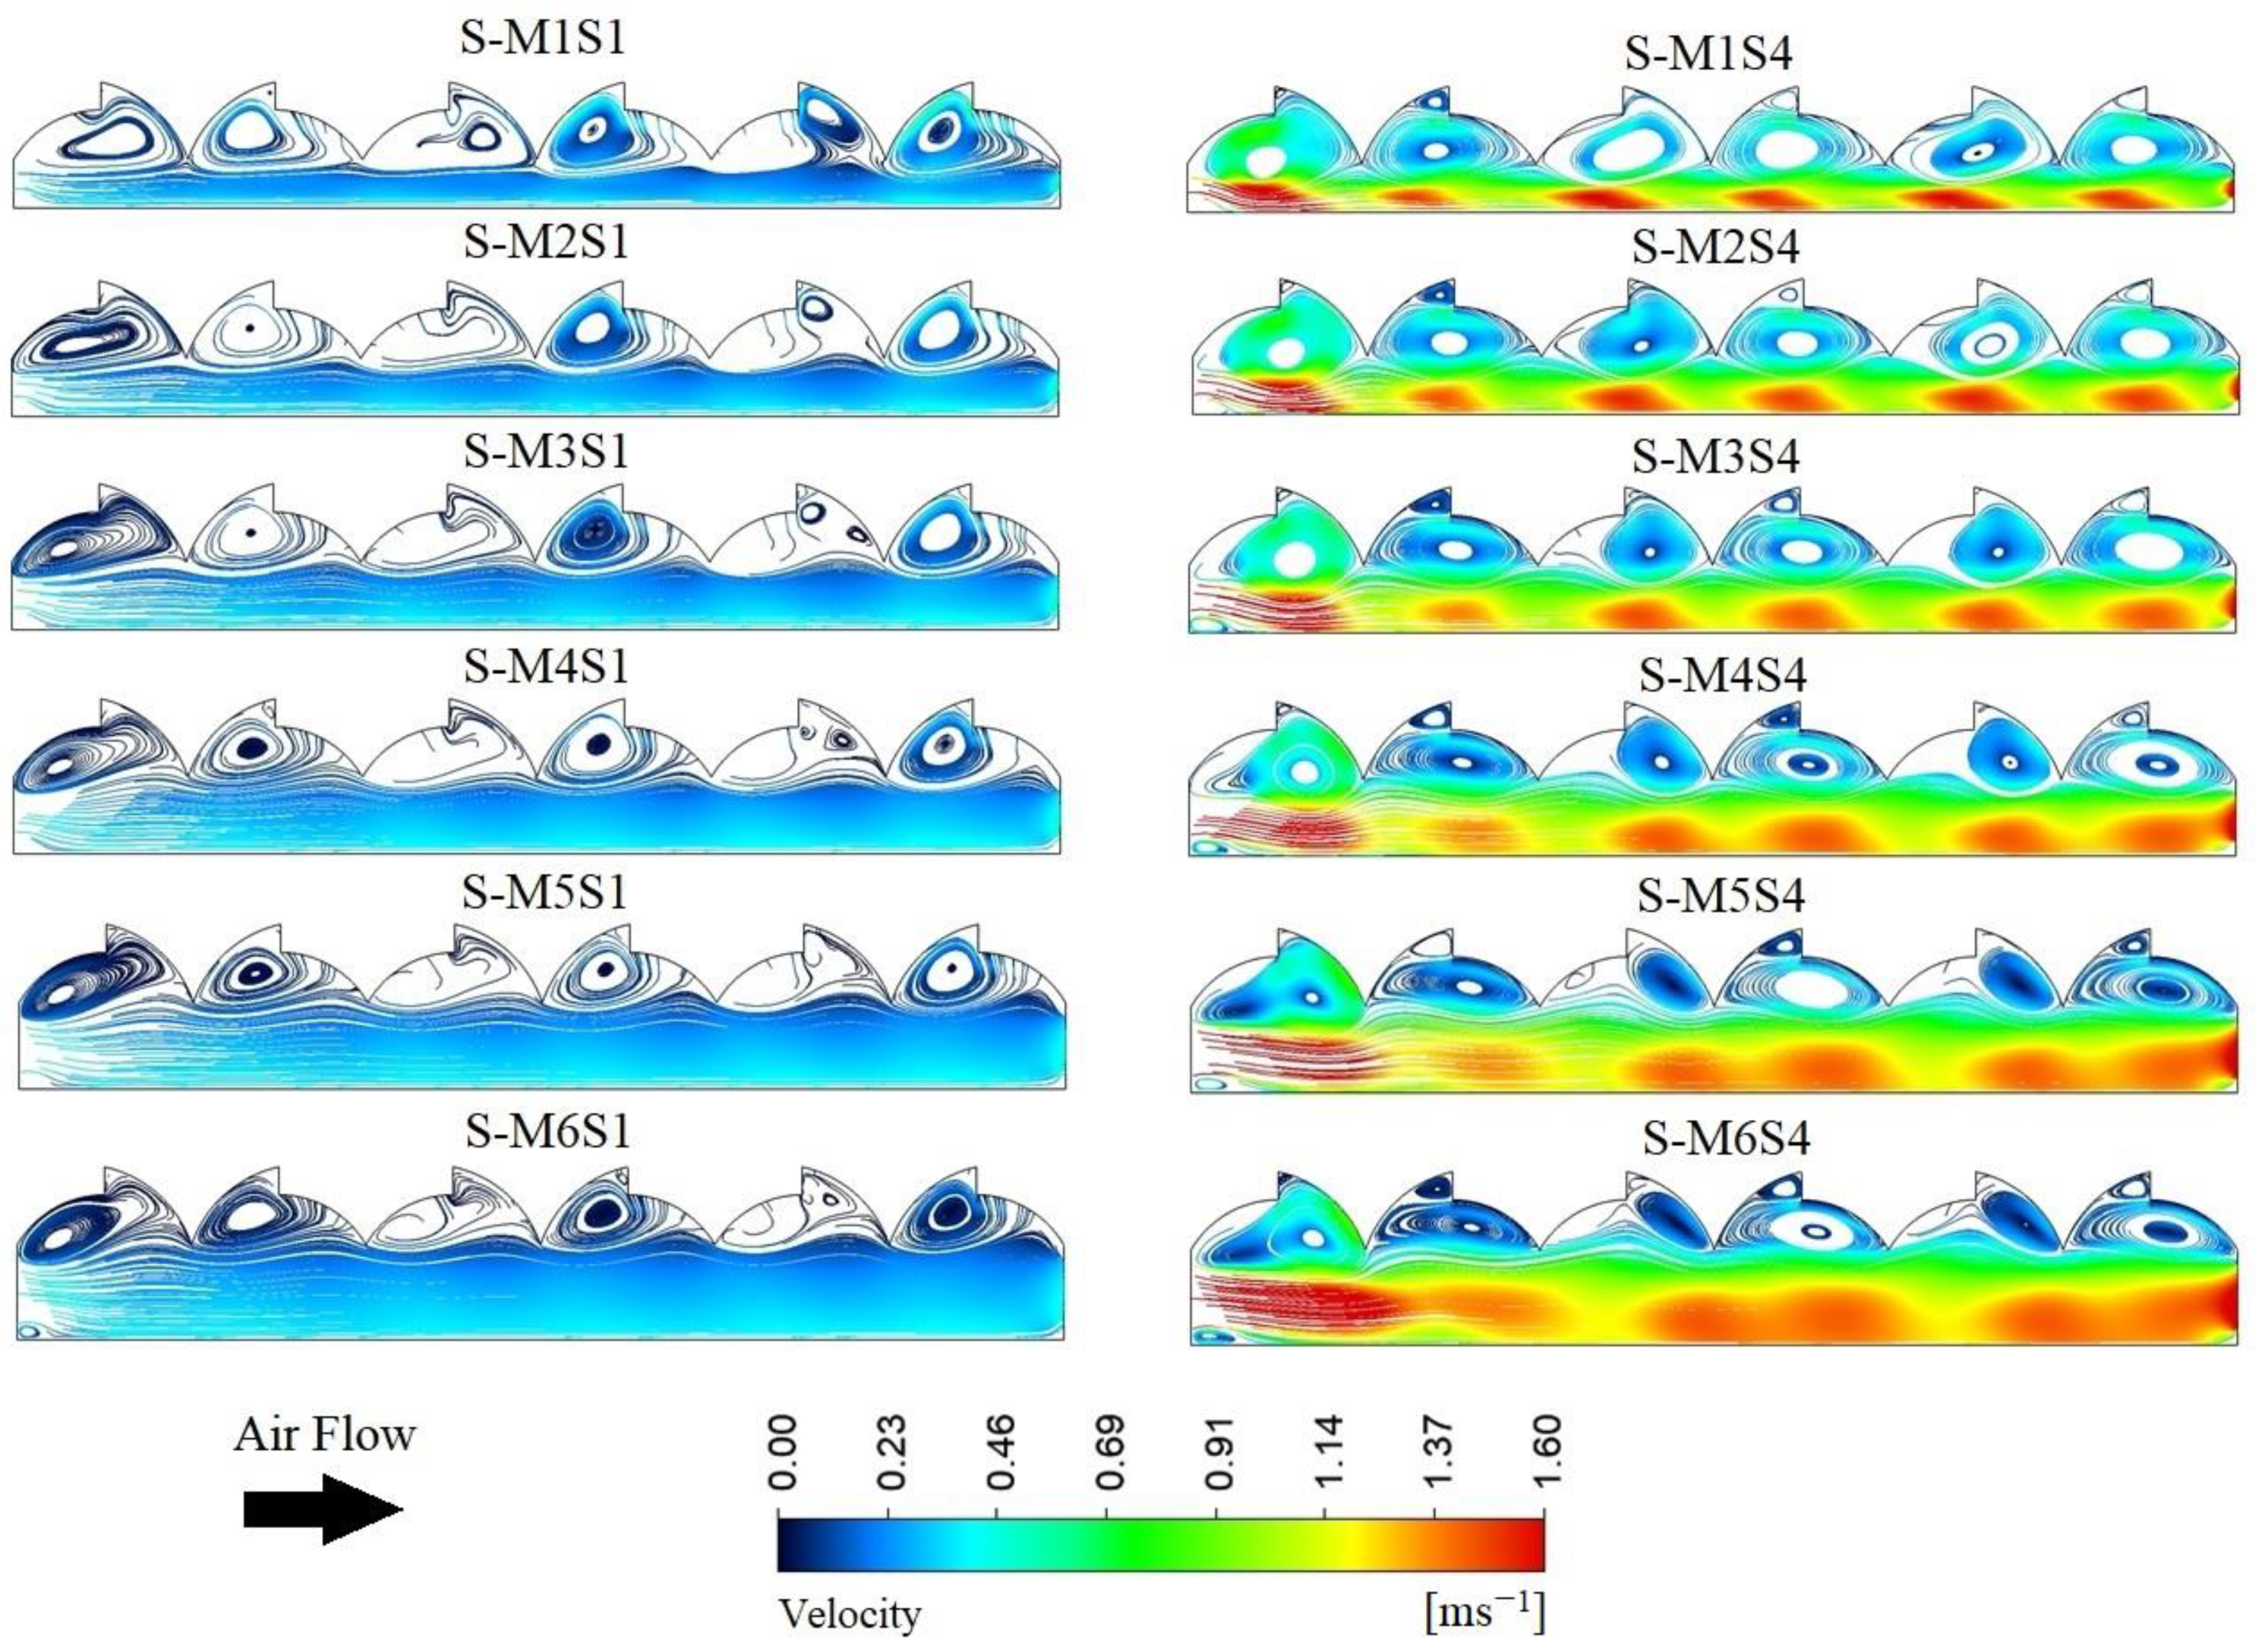
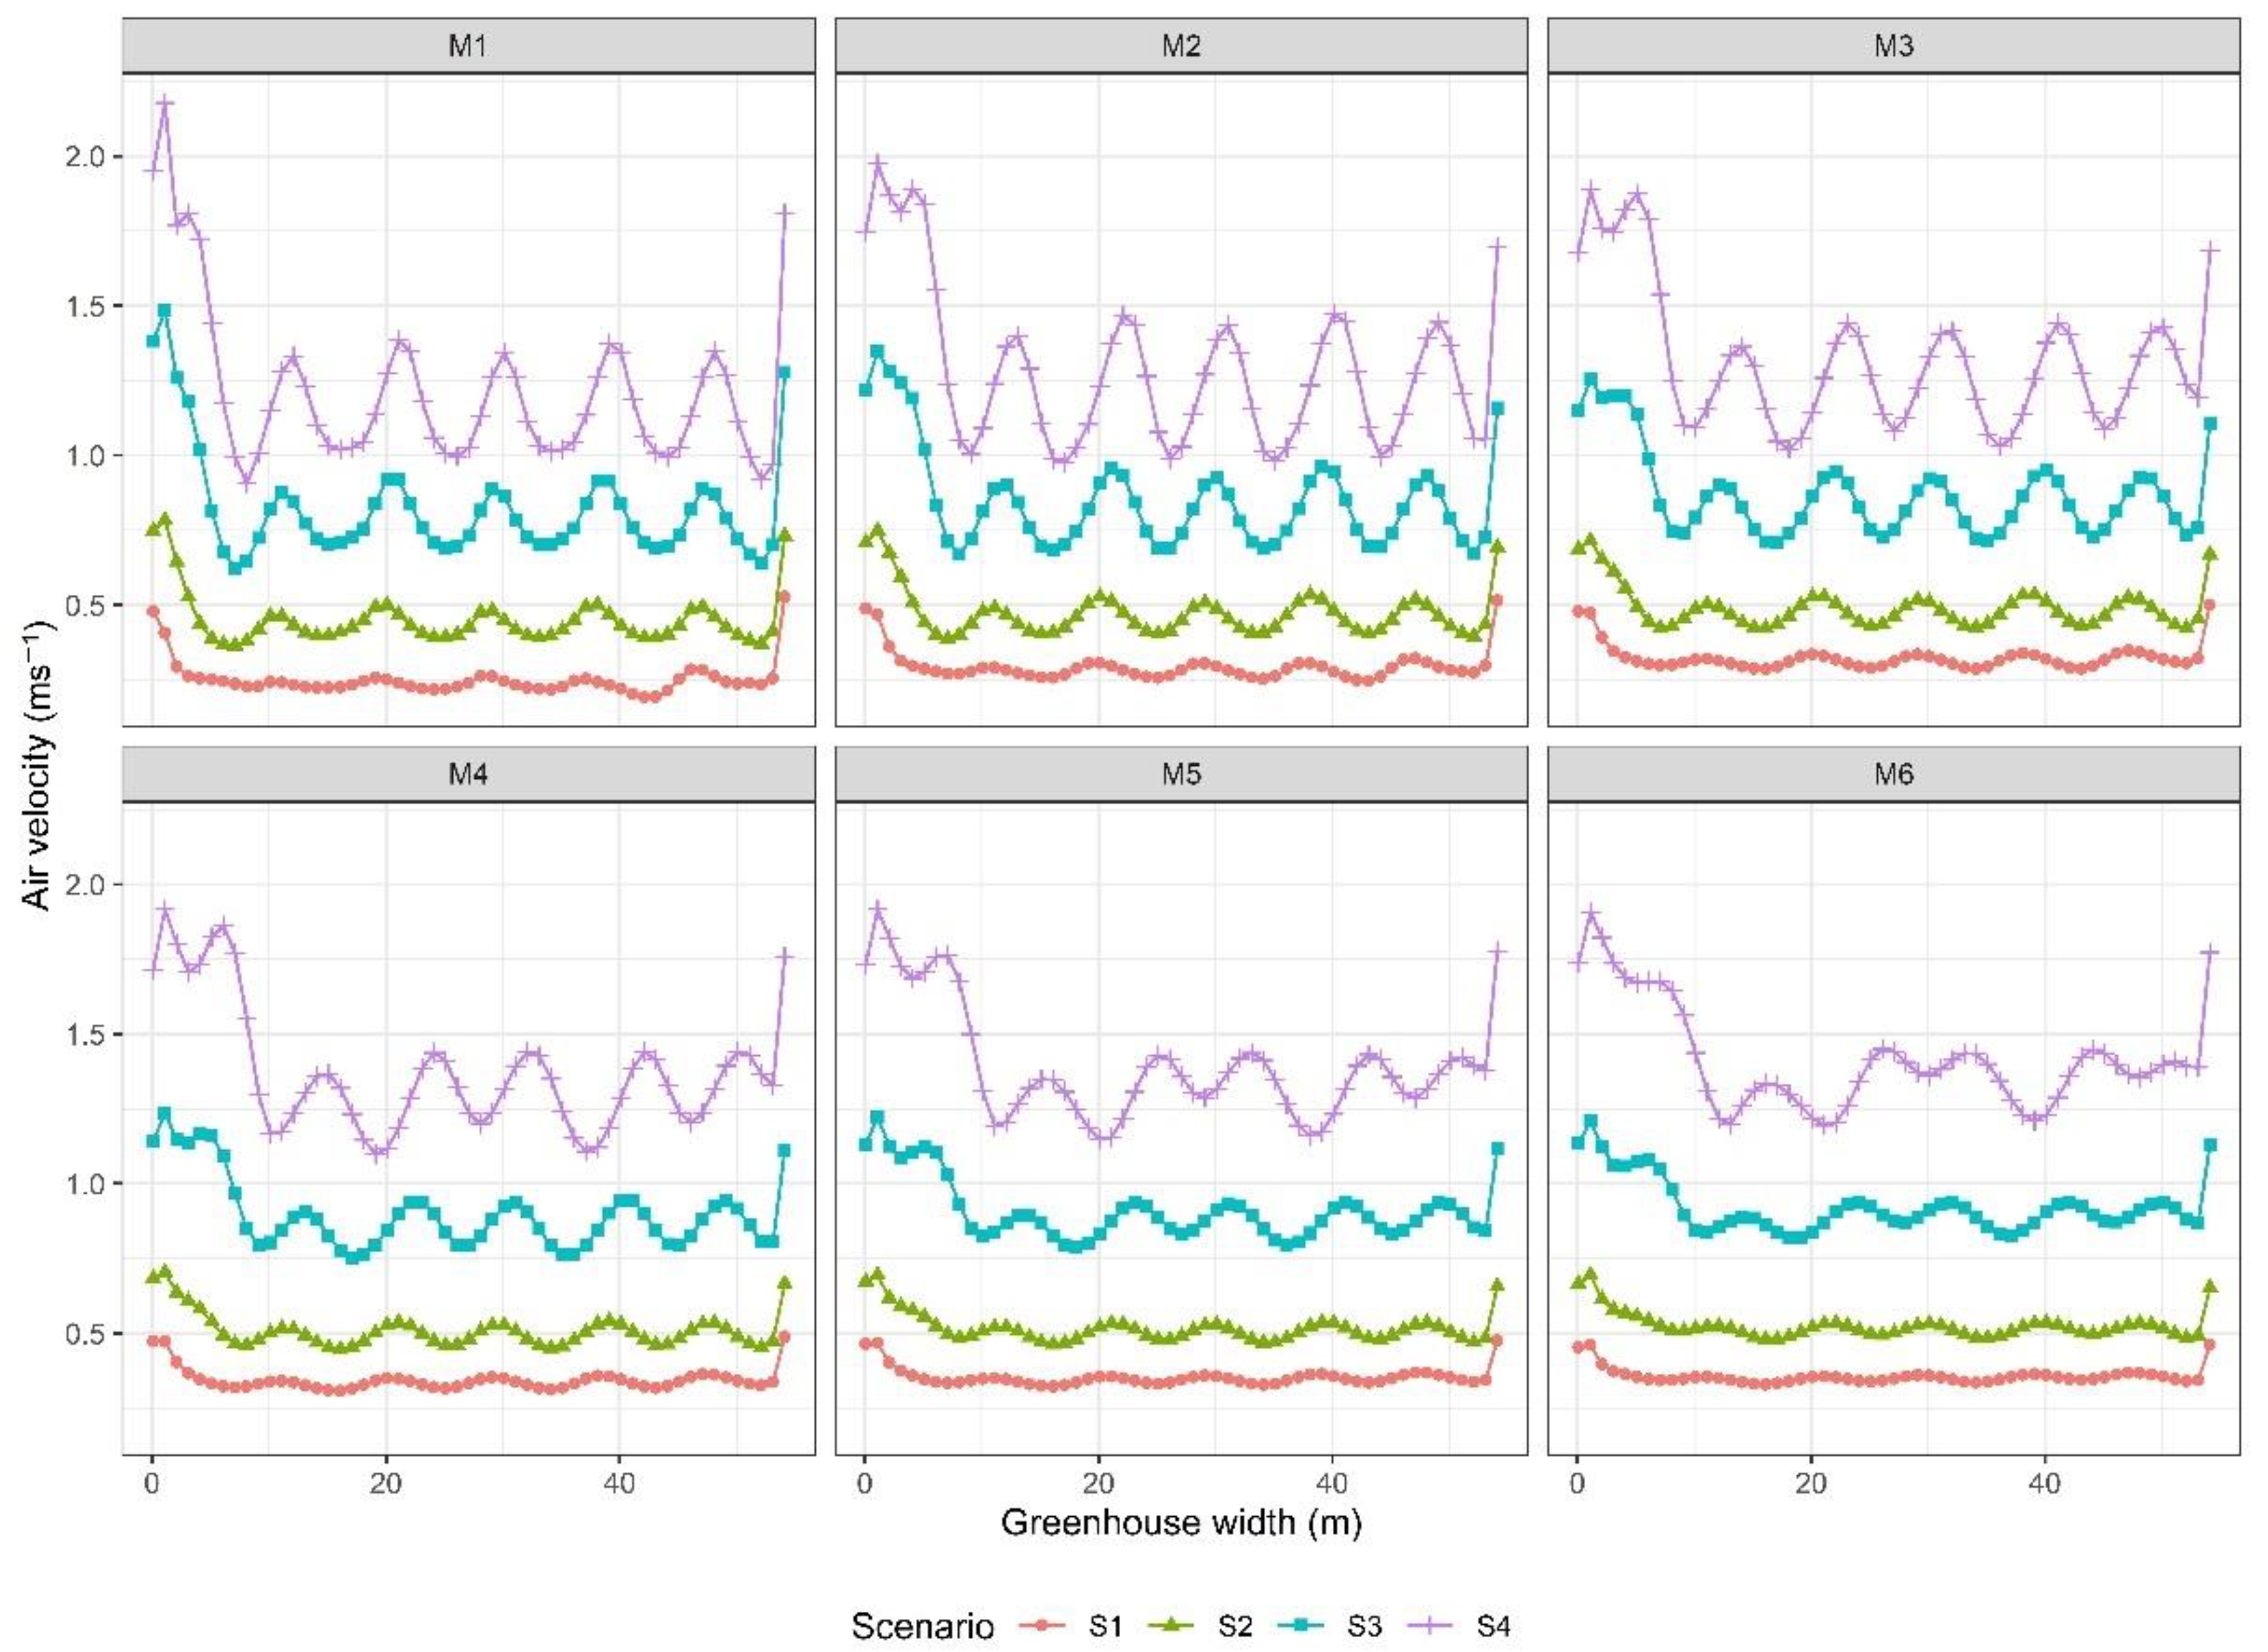
3.1.1. Side Ventilation (S)

The airflow patterns under the ventilation configuration through the sidewall (S) areas of the greenhouse can be seen in Figure 4. In general terms, it is observed that the airflow pattern enters the greenhouse through the ventilation area on the windward side and moves horizontally in an airflow pattern that has a height very similar to the height under the gutter of each of the greenhouses evaluated (M1-M6), this horizontal flow leaves the greenhouse again through the ventilation area arranged on the leeward wall.
Another common feature is the air circulation loops that are generated in the upper part of each of the greenhouse spans, this occurs because due to the buoyancy phenomenon and the associated pressure components, the warm air inside the greenhouse moves vertically towards the roof area and its space in the lower part of each span is occupied by the fresh air that enters from the outside environment [3,56]. It should also be noted that qualitatively it is observed that as the height of the greenhouse increases, the air flow that moves over the nearby area where the crops are grown has a higher velocity; this same behavior is observed in the air flow that leaves the greenhouse through the leeward ventilation.
To quantitatively analyze the airflows, velocity data were extracted from a cross profile at a height of 1.4 m above ground level. In general, the airflows show a behavior for velocity that oscillates between a minimum of 0.25 ± 0.05 ms−1 for S-M1S1 and a maximum of 1.42 ± 0.16 ms−1 for S-M6S4. It was also observed that the air flows inside the greenhouse show a direct relationship with the wind speed outside, therefore, the higher the wind speed, the higher the air velocity inside the greenhouse. This occurs in greenhouses where this type of ventilation is analyzed and where porous insect-proof screens are not contemplated in the ventilation areas [29,57].
On the other hand, it is also observed that as the height of the greenhouse increases, the average air flow velocity inside the greenhouse increases for the wind speed scenarios analyzed (S1 to S4). In summary, the increase in velocity between the extreme simulation scenarios was 42.3, 20.9, 19.4 and 16.2% for M1S1, M1S2, M1S3, M1S4 compared to M6S1, M6S2, M6S3, M6S4, respectively. These velocity increases in the higher greenhouse models occur because the effect of air friction is reduced as the ratio (L/H1) between the greenhouse length (L) and the height above the gutter (H1) decreases, which coincides with what was previously reported in the study developed by Chu et al. [44].
Another factor that showed a direct relationship with height was the uniformity of the air flow velocity behavior along the cross axis of the greenhouse (Figure 5). In general terms, it is observed that as the height of the structure increases, the velocity behavior curves show less oscillation between the points of high and low air velocity. This can also be verified with the standard deviation (sd) values. In S-M1S4 the sd value was ±0.27 ms−1 while for S-M6S4 it was ± 0.16 ms−1. This will undoubtedly promote a more homogeneous microclimate behavior inside the greenhouse, helping to limit the negative impacts on growth and development generated by non-uniform microclimates [58].

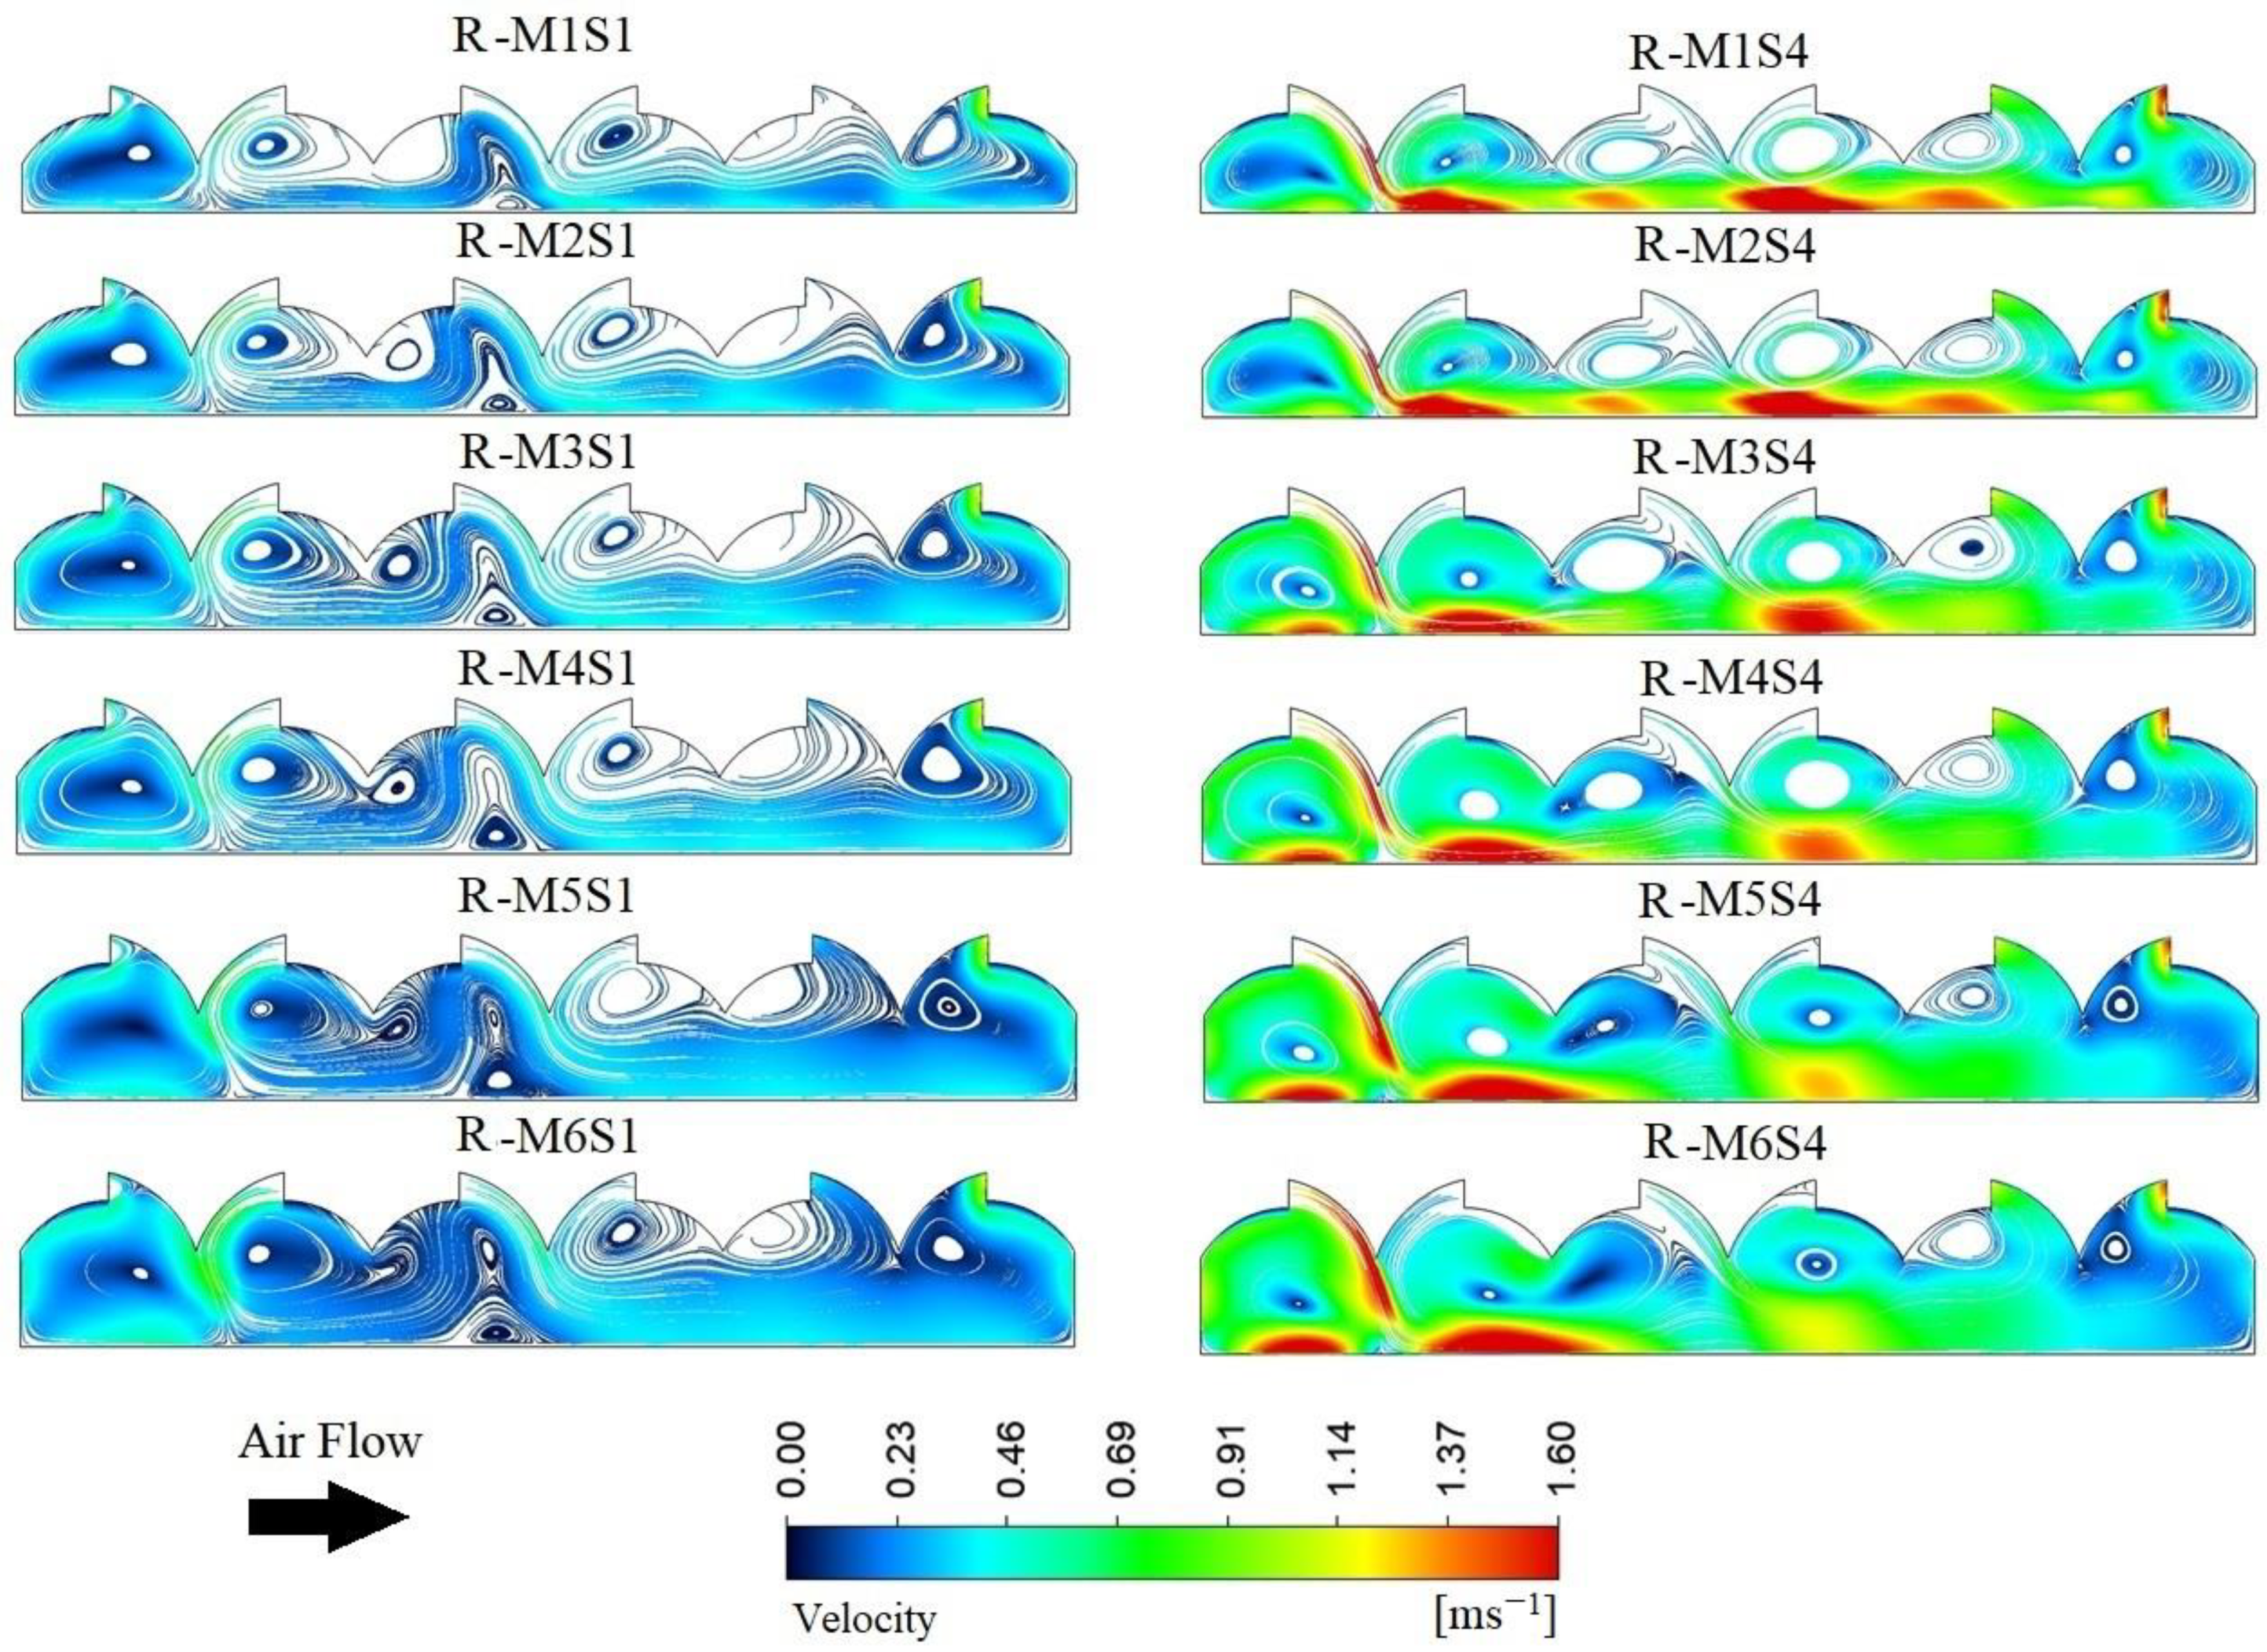
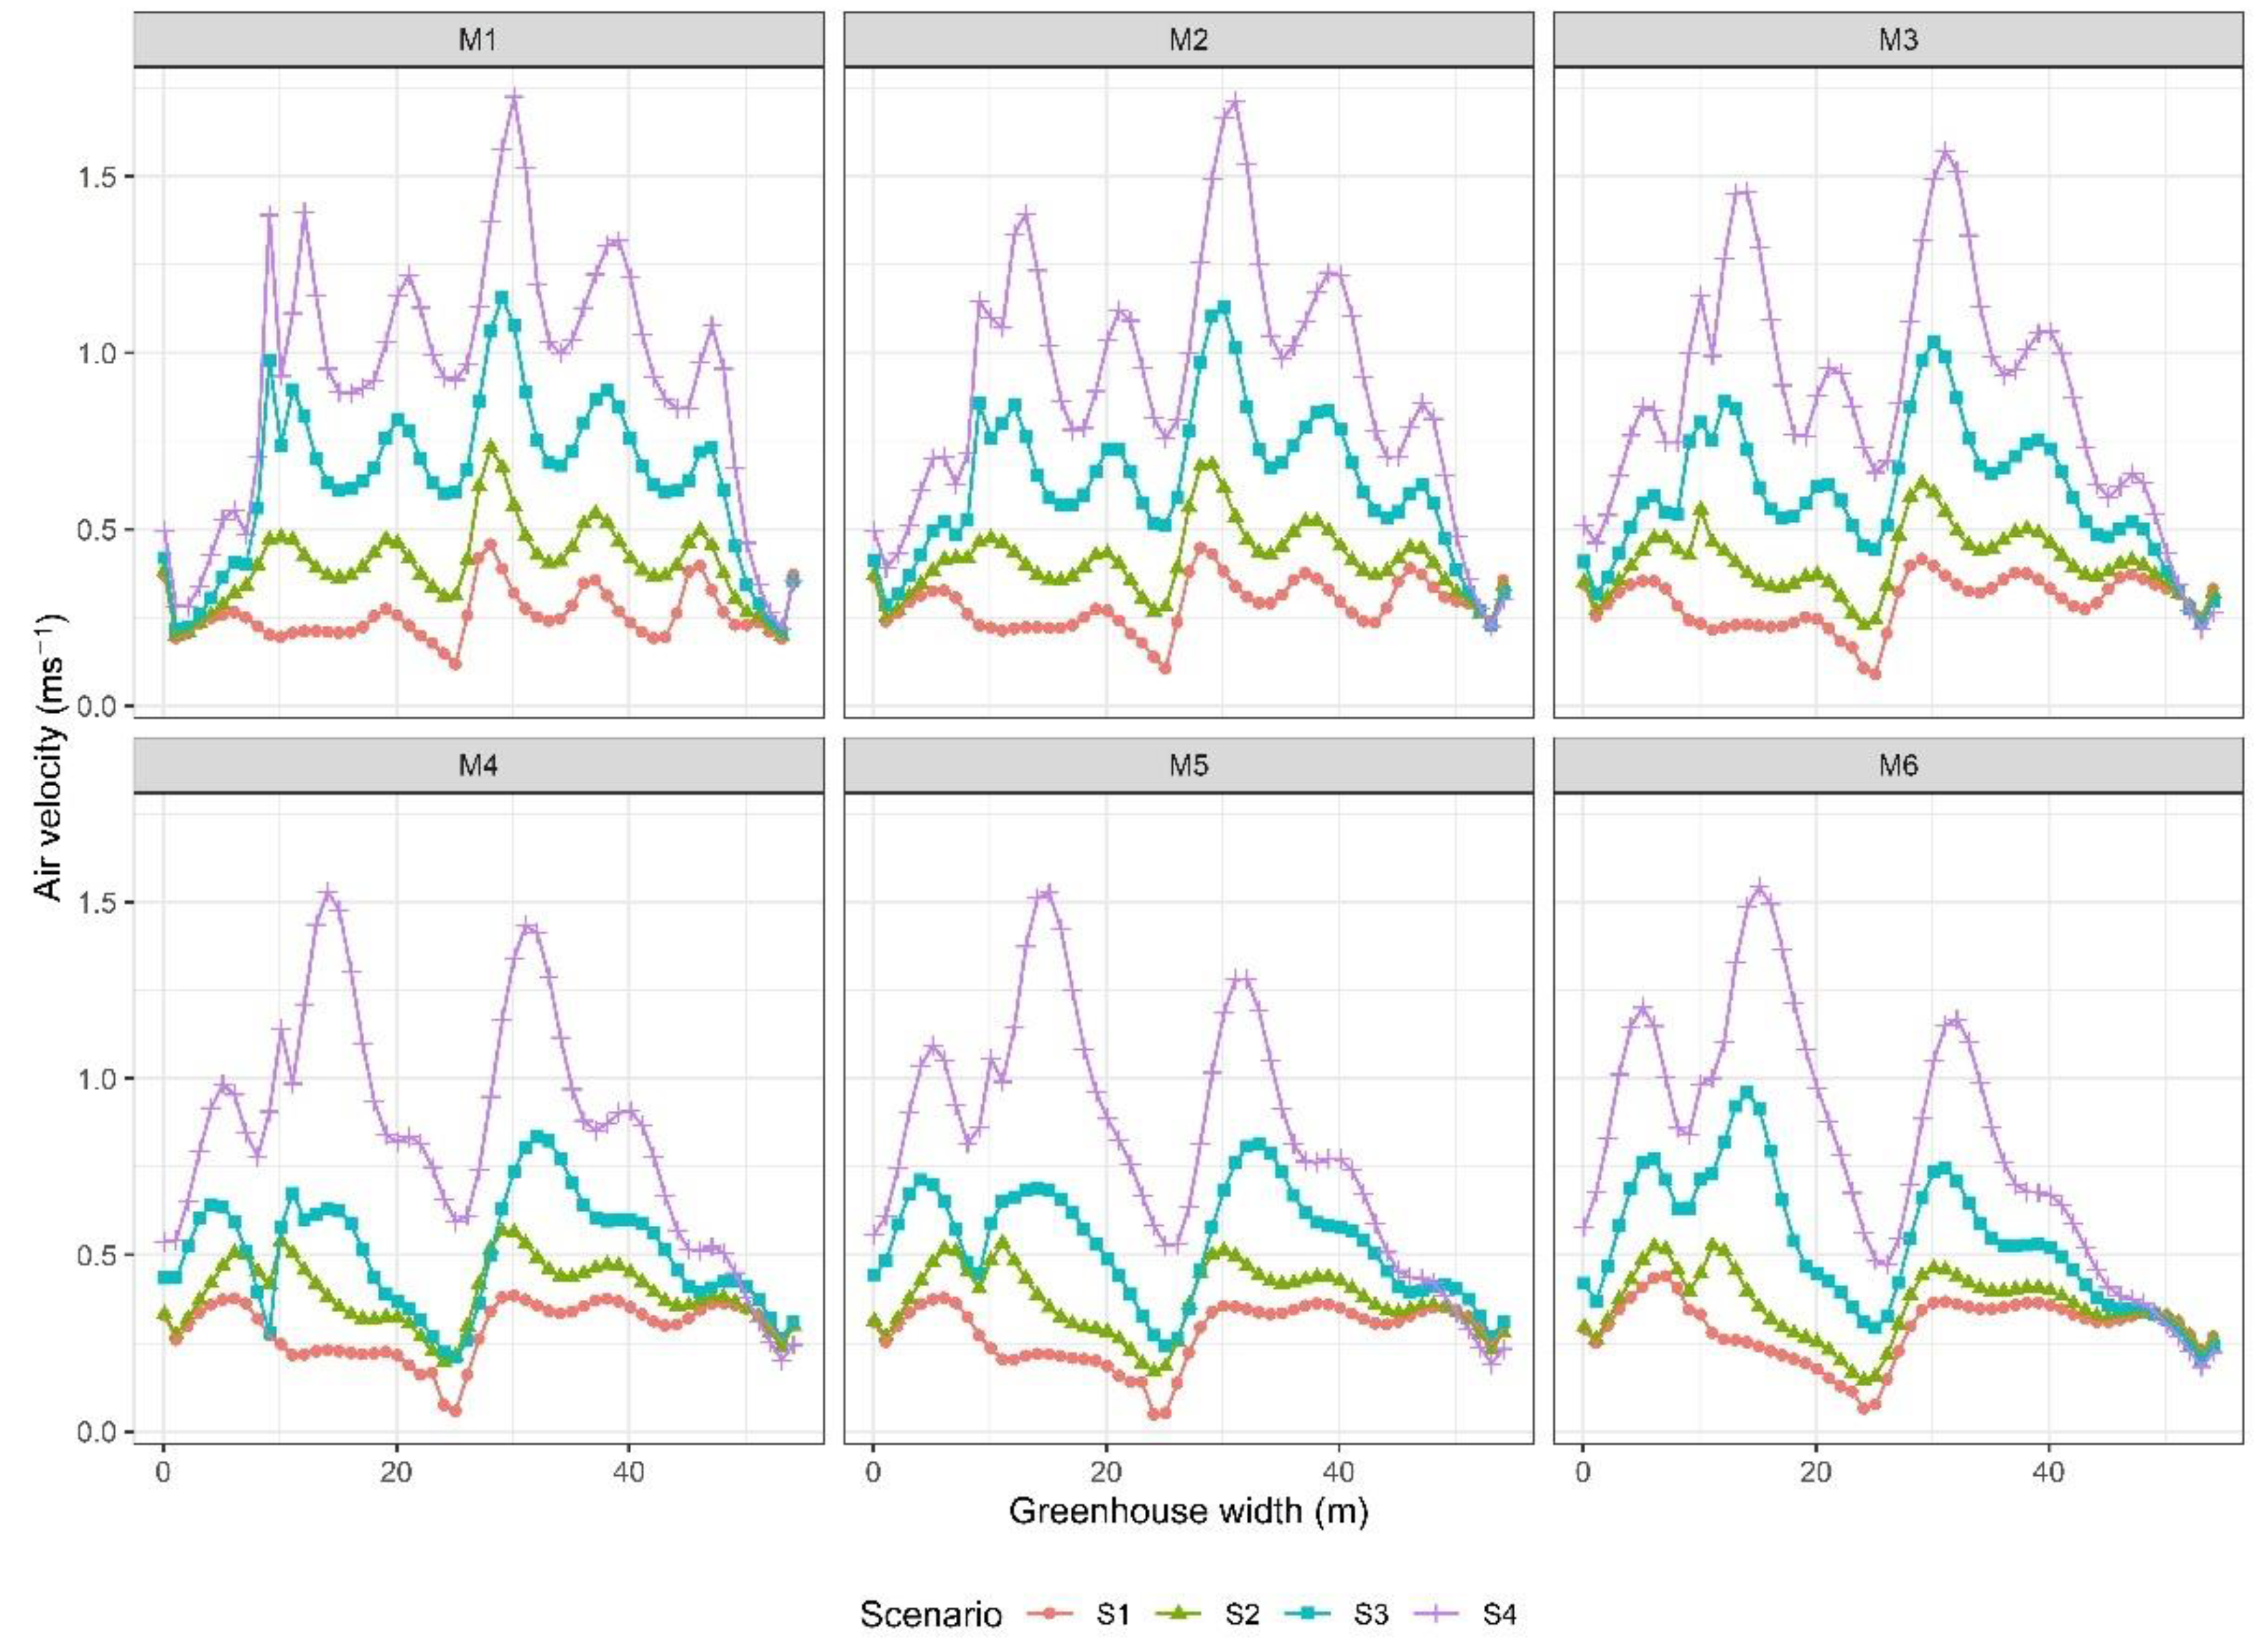
3.1.2. Roof Ventilation (R)

Figure 6 shows the simulated airflow patterns for this ventilation configuration. In this case, since the side windows are closed, the airflow patterns are forced in and out through the windows in the roof region [16]. For the low velocity scenarios S1 where the thermal component of natural ventilation dominates, a behavior where three flow patterns are generated is observed. In span 1, an air flow was identified that enters through the ventilation area and becomes a convective movement loop between the floor and the roof of this span.
Subsequently, between span 2 and the middle of span 3 there is an airflow pattern that moves in the direction of the outside wind at ground level and a flow that moves in the opposite direction to the outside wind at the top of the roof of these spans. Finally, through the ventilation area of span 3 an airflow enters and mixes with another airflow entering from the ventilation area of span 4, flows that move towards the leeward wall and exits through the ventilation areas of spans 4 and 5. It should also be noted that the confluence of flows over the central area of span 3 generates a small low velocity loop near the floor region, being this an inadequate movement pattern that may cause the generation of a heat spot over this region [29,33,35].
For the case of the S4 scenario wind speed, the natural ventilation of the greenhouse will depend on the thermal and wind components together [59,60]. In this case, we were able to identify an air flow pattern that enters through span 1 and forms a recirculation pattern between the roof of the span, the floor and the wall of the windward side, where the highest air flow velocity occurs at ground level, which coincides with that reported by Kwon et al. [61]. Likewise, part of the air flow entering through the window of span 1 is mixed with another air flow entering through the window of span 2, which generates an acceleration of the air flow above ground level; the same behavior is repeated with the air flows entering through spans 3 and 4; finally, the air flows leave the greenhouse through spans 4 and 5.
In numerical terms, the air flow velocity inside the greenhouse over the area where the crops are grown ranged from a minimum of 0.26 ± 0.07 ms−1 for R-M1S1 to a maximum of 0.92 ± 0.36 ms−1 in R-M1S4. In this specific case no increase in air flow velocity is observed as the greenhouse height increases in the case of the low velocity scenario S1 it is observed that between M1 and M6 there is only an increase of 11.5% but this same value is obtained between M1 compared to M2, M3 and M4.
For the case of S2 the air velocity increased between M1 and M2 by 2.5% but compared to the other greenhouse models it decreased by up to 12.5% with M6 specifically. In the S3 scenarios the air flow velocity decreased up to 20.5% compared M1 with M5 and M6 and finally in S4 the air velocity also decreased up to 15% compared M1 with M6.
Regarding the behavior of the air flow in the cross axis of the greenhouse, it was found that for models M1, M2 and M3 there is a very similar distributed behavior in space, while for M4, M5 and M6 there is a small change in this spatial distribution, which may be caused by the change in greenhouse heights (Figure 7). Likewise, the inside air velocities increase as the wind speed increases, which has already been demonstrated in several research works [22,33,49,62].
On the other hand, there is a quite heterogeneous behavior among each of the six spans, finding that the smallest standard deviation among these scenarios was ±0.07 ms−1 in the low velocity scenarios S1, while for the high velocity scenarios S4 this standard deviation was up to ± 0.36 ms−1. The lowest air speed points were the regions near the leeward and windward wall and the highest air speed points were the areas below spans 2 and 4.

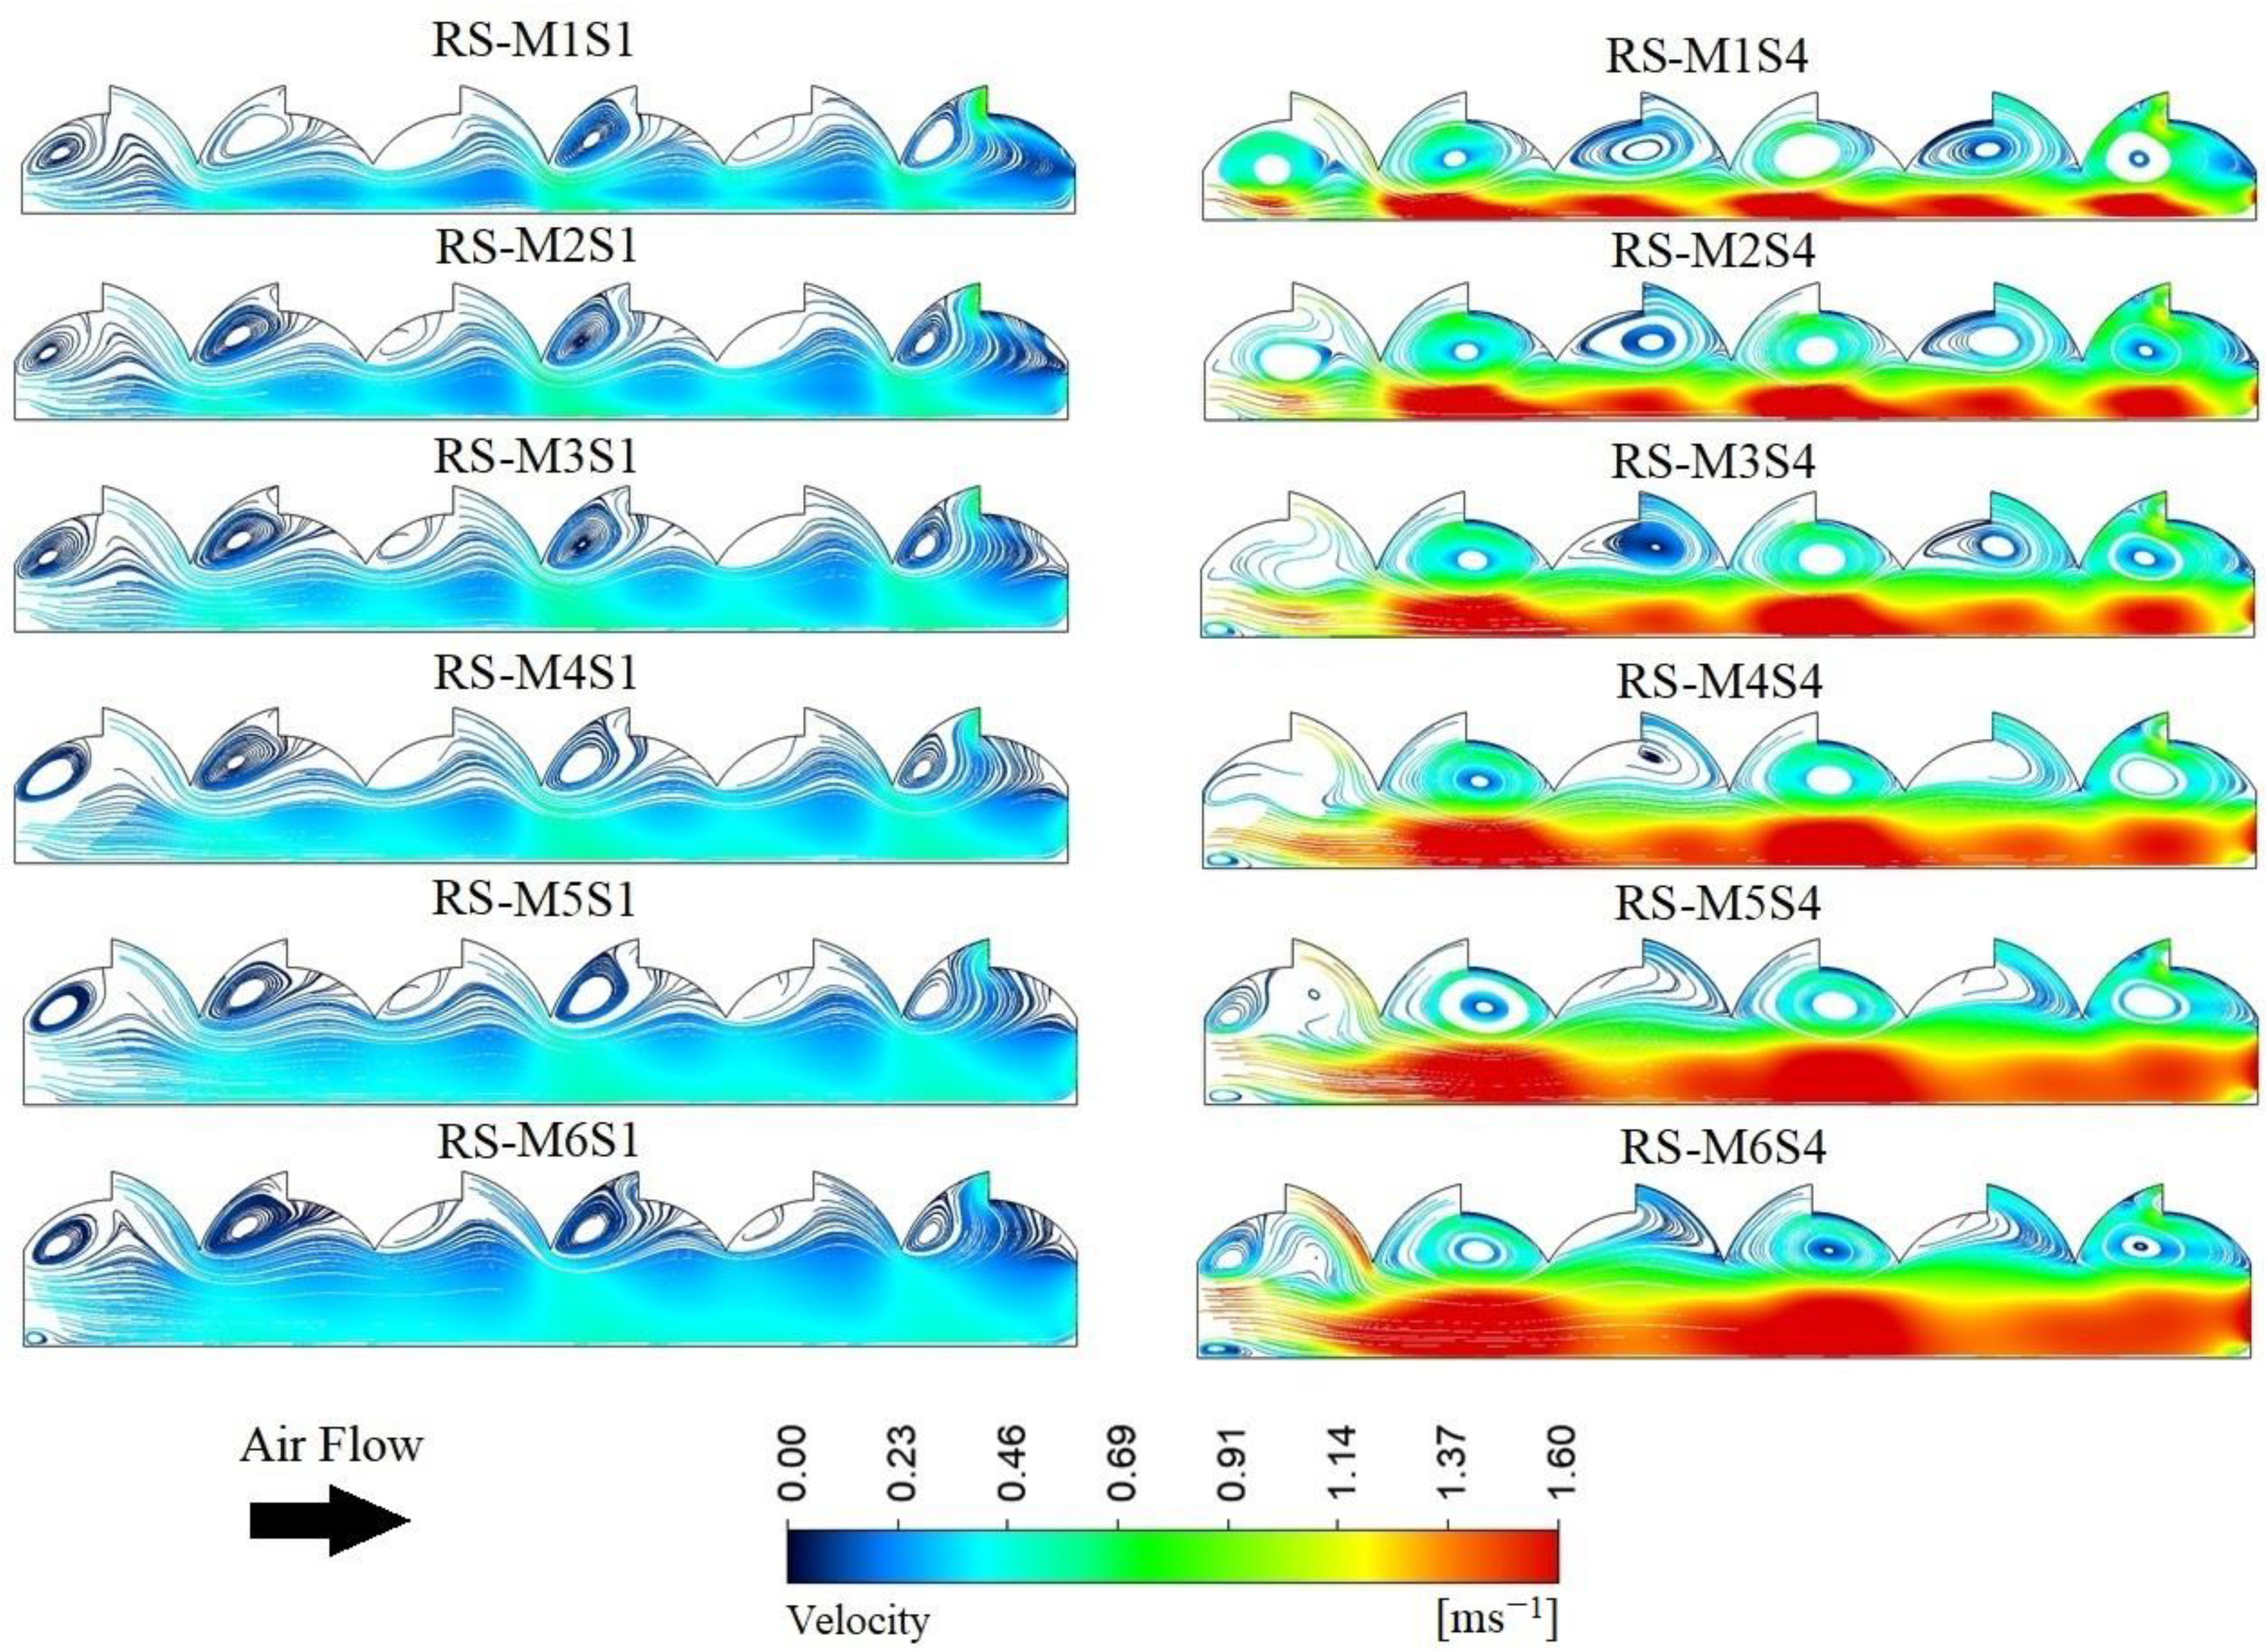
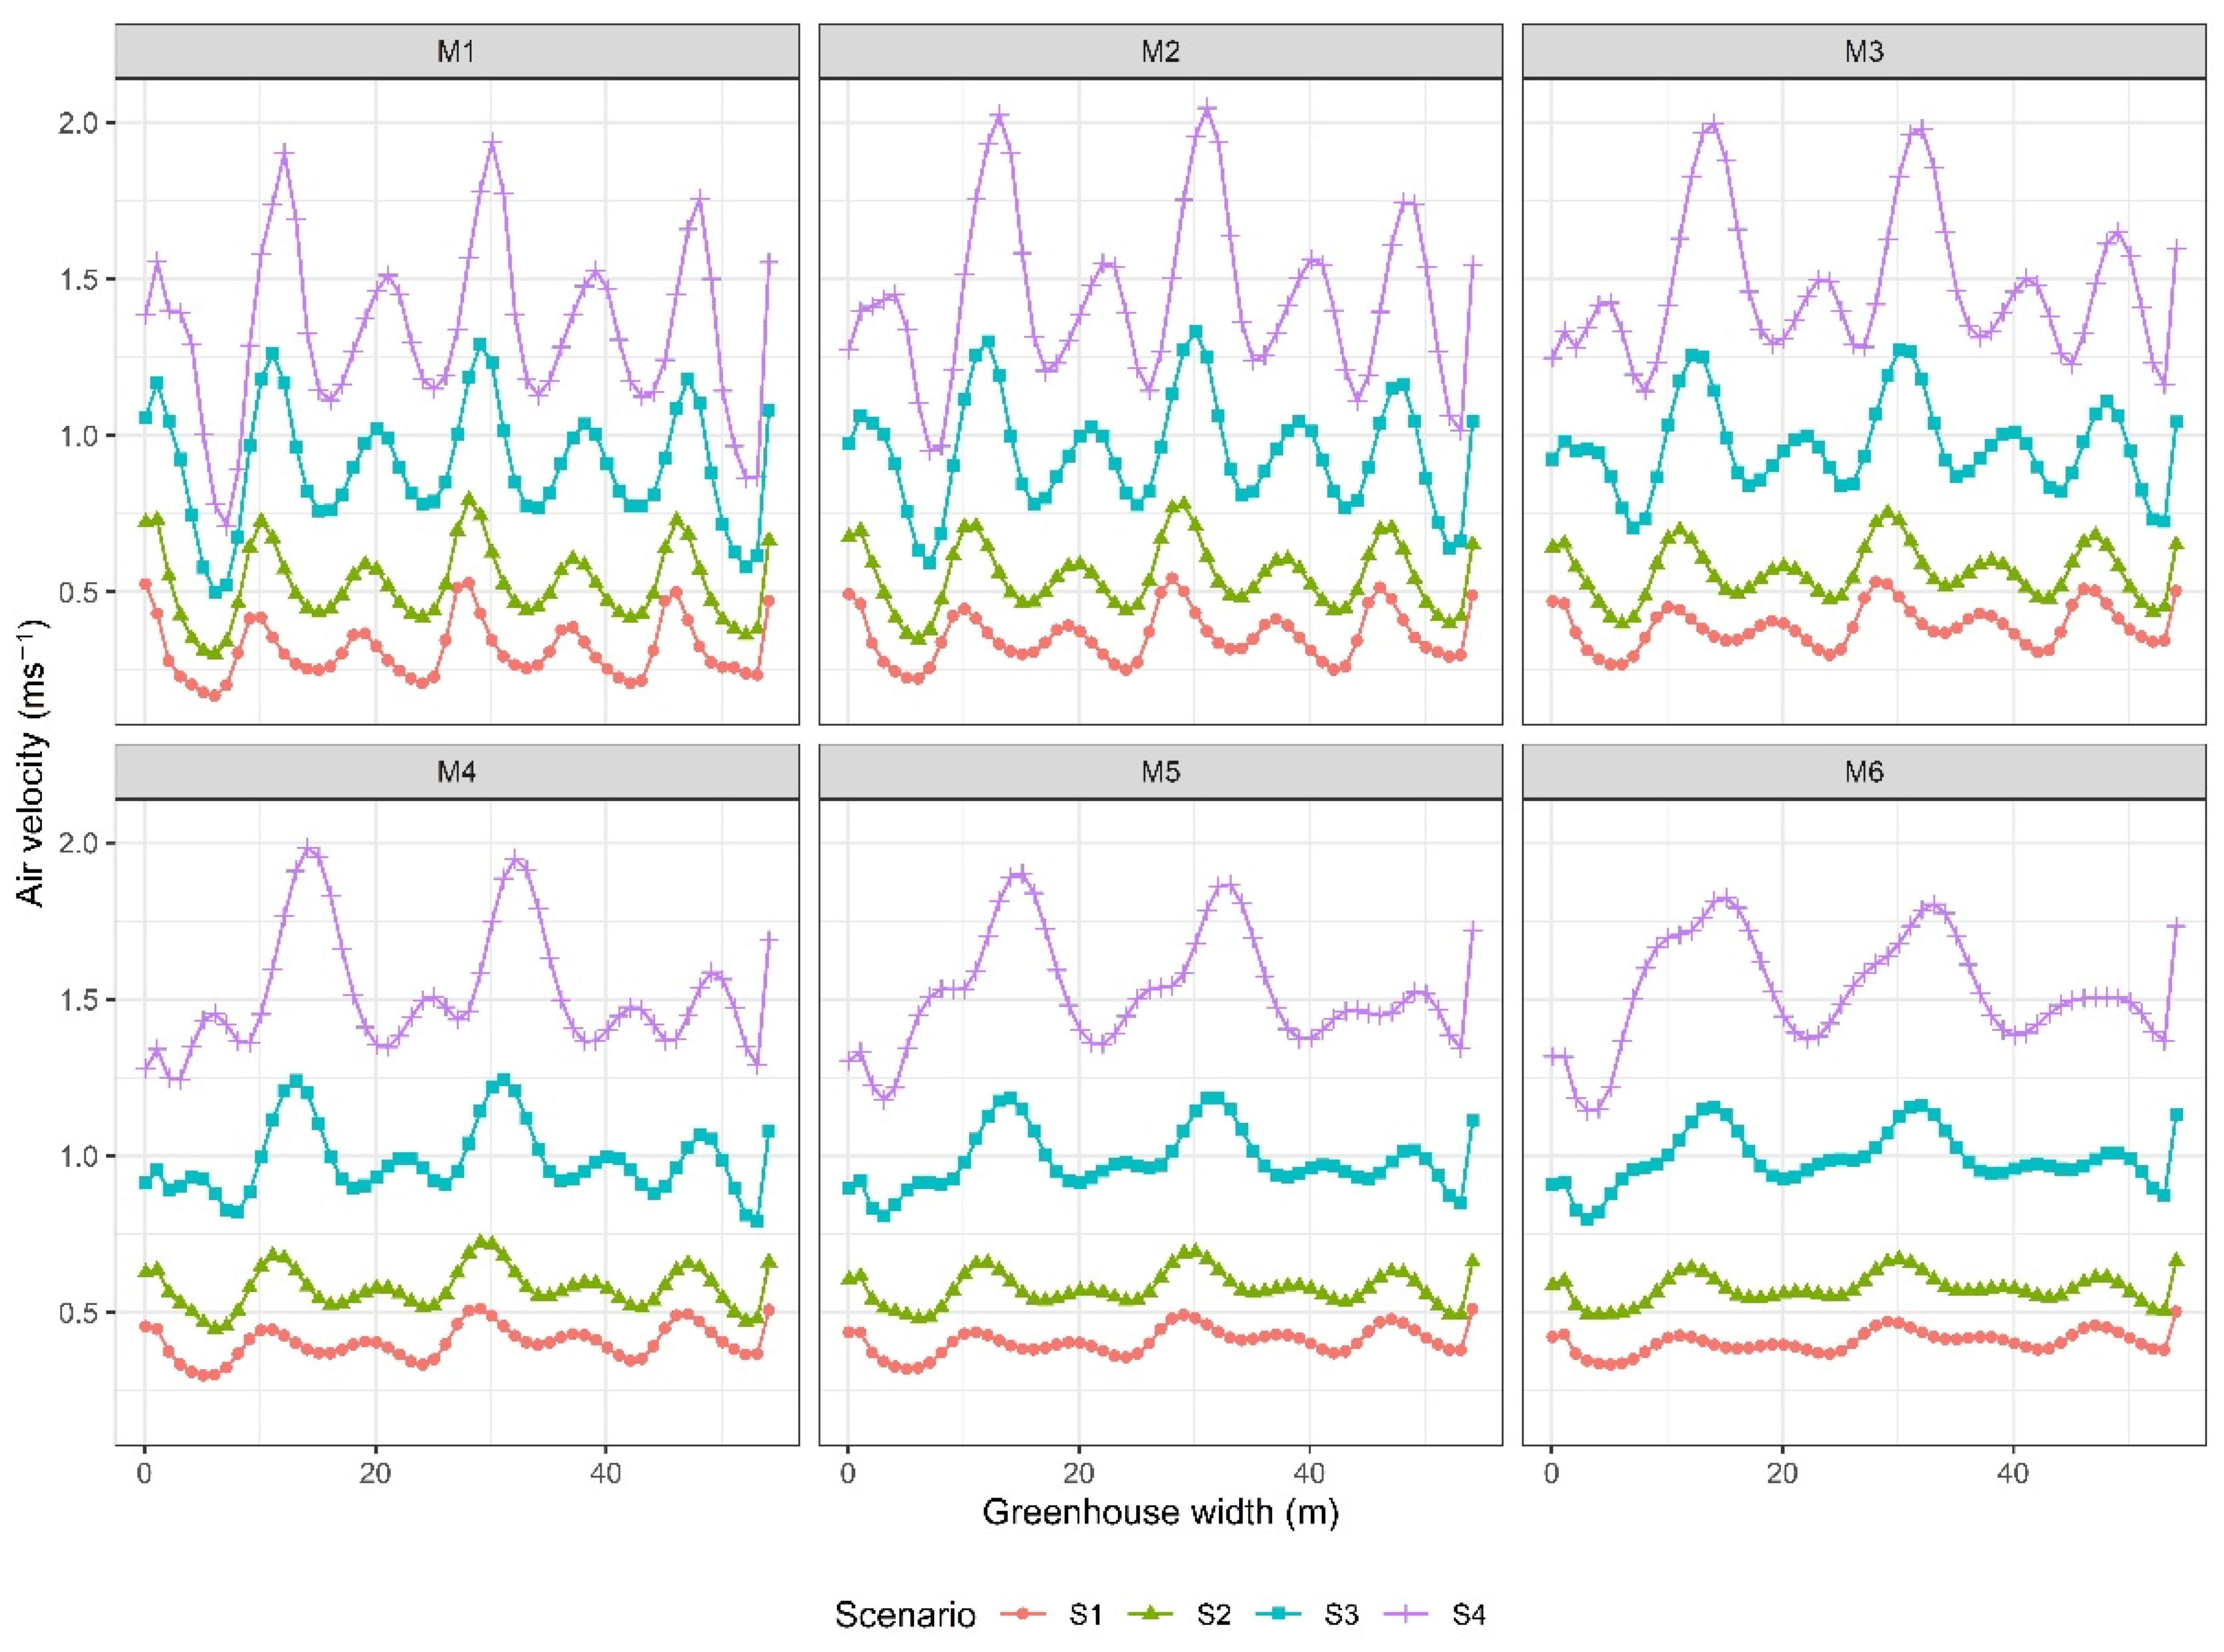
3.1.3. Side and Roof Ventilation (RS)

The spatial distribution of the airflow patterns for the combined ventilation configuration can be seen in Figure 8. Qualitatively, more continuous and intense airflows can be observed over the entire cross-sectional area analyzed, both in the crop and canopy regions, which should positively impact the greenhouse renovation rates and directly the thermal performance of the greenhouse [62].
Numerically, the air flows presented a mean velocity that ranged from a minimum value of 0.31 ± 0.09 ms−1 in RS-M1S1 to a maximum of 1.53 ± 0.17 in RS-M6S4. For the case of S1, it is observed that the airflow velocity increases up to 29.1% in M5 and M6 compared to M1. Likewise, in S4 the increase in velocity was 15% in the M6 greenhouse with respect to the value obtained in M1, therefore, the greenhouse height has a significant impact on the airflow velocity. This is mainly due to the fact that, according to the analysis of natural ventilation carried out in previous studies, the greater the distance between the central axis of the side ventilation with respect to the central axis of the roof ventilation, the more dynamic the wind and thermal component is and therefore the better the air flow patterns are obtained [56,63].
On the other hand, the spatial behavior of the air flow velocity inside the greenhouse cross section can be found for some of the simulated scenarios in Figure 9. In general terms, it can be observed that as the height of the greenhouse increases, the less oscillation between the points of higher and lower velocity exists in the spatial distribution curves. At the same time, it should be noted again that these changes in air flow velocity are mainly due to the dynamics of incoming and outgoing air flows and to the interaction of warm and cold air masses that mix and generate buoyancy flows [10,64]. Although these values are less critical in the M3 to M5 greenhouse scenarios under the RC combined ventilation configuration.
Regarding air flow velocities, in general, under the three configurations evaluated, the values obtained are within the ranges reported in passive greenhouse ventilation studies [5,65]. Although for the low velocity condition S1, 100% of the airflows present velocities lower than the minimum recommended value of 0.5 ms−1 for plant growth inside greenhouses [42,65].

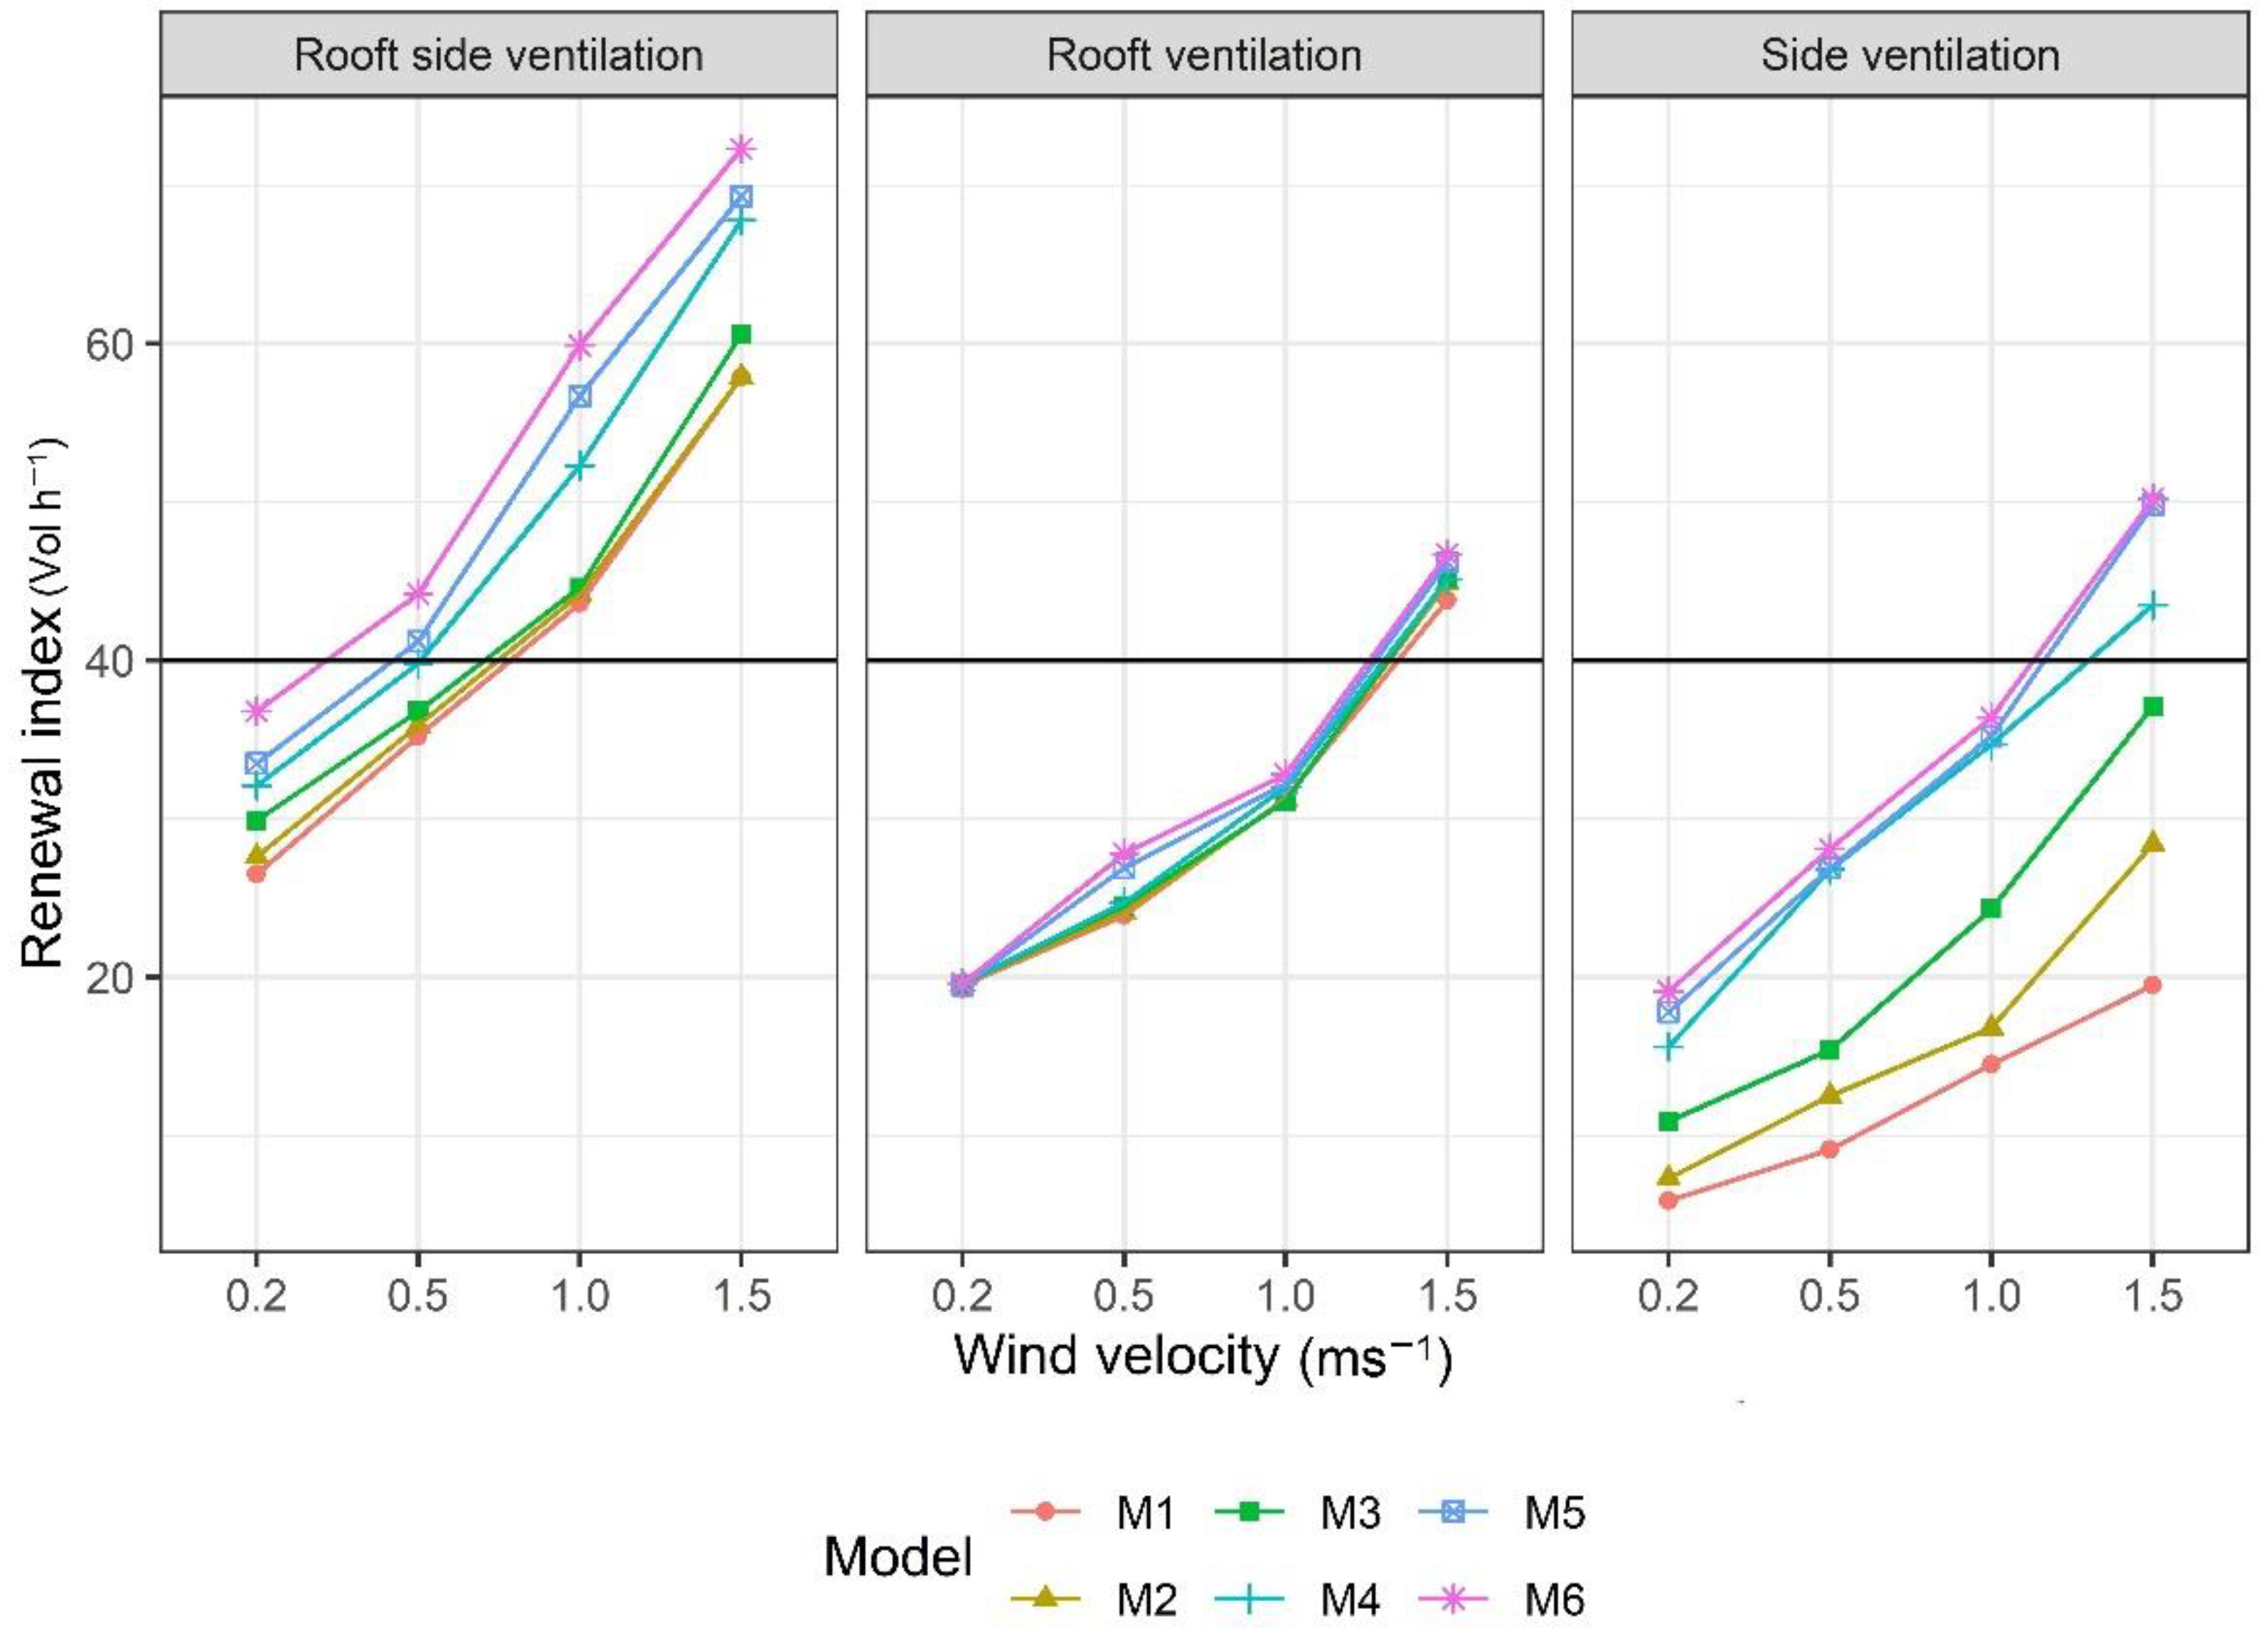
3.2. Renewal Index (RI)

The renewal index (RI) was calculated using the method of integration of the volumetric flow of air leaving the ventilation areas of the greenhouse, the results obtained can be seen in Figure 10. The RI values ranged from a minimum of 5.89 Vol h−1 obtained in S-M1S1 to a maximum of 72.3 Vol h−1 obtained in S-M6S4. It is important to highlight that these are the contrasting scenarios, therefore, the minimum RI was obtained in the greenhouse with the lowest height and ventilation area, evaluated at the lowest wind speed (S1), while the maximum RI was obtained in the greenhouse with the highest height and ventilation area evaluated at the highest wind speed (S4).
For the lowest wind speed (S1), RI values between 5.89 Vol h−1 and 19.1 Vol h−1 were obtained in the side ventilation configuration S for M1 and M6, respectively. Likewise, for the ventilation configuration through the vents of the roof region R, RI values of 19.4 and 19.7 Vol h−1 were obtained in M1 and M6, which are values compared to those obtained in S of 329% and 3.68%, respectively. Finally, for the RS combined ventilation configuration, an RI value was obtained for M1 of 26.5 Vol h−1 which is a value 449% higher compared to the S ventilation configuration and 36.6% higher compared to the R ventilation configuration. For M6, a value of 36.8 Vol h−1 was obtained, which is 92.7% and 86.8% higher than the S and R ventilation configurations, respectively.
Regarding the S4 velocity scenario, RI values were obtained for the S ventilation configuration of 19.5 and 50.2 Vol h−1 for M1 and M6, respectively. For the R ventilation configuration, values of 43.8 and 46.7 Vol h−1 were obtained for M1 and M6, respectively, which represents an increase in M1 of 224.6% with respect to the S configuration; on the other hand, for M6 there was a reduction of 14.6% in RI with respect to S. In the case of the RS configuration, a value of 59.7 Vol h−1 was obtained in M1, which is equivalent to a higher value of RI by 306.1% with respect to the S configuration and 136.6% with respect to R. While in M6 an RI value of 72.3 Vol h−1 was obtained, this value being 144 and 154.8% higher than those obtained in S and R, respectively.
To highlight the scenarios where RI values above or equal to the recommended minimum (RI ≥ 40 Vol h−1) are achieved for naturally ventilated agricultural structures [11,66]. Under ventilation configuration S, this was only obtained under greenhouse models M4, M5 and M6 and under external wind speed conditions of 1.5 ms−1, with this same speed condition for ventilation configuration R adequate RI values are obtained in all greenhouse models (M1–M6).
While for the RS combined ventilation configuration, the RI values are adequate for all greenhouses (M1–M6) under wind speed scenarios higher than 1 ms−1, the same is true for the M4, M5 and M6 models under wind speeds higher than 0.5 ms−1. It is therefore relevant for greenhouse growers or greenhouse builders or decision makers to seriously analyze the prevailing wind speed conditions in the study region [62,67].
These results reaffirm some conclusions already determined in previous works related to the natural ventilation of greenhouses, where it was identified that the renewal indexes are dependent on the ventilation configuration used [68,69,70,71]. It was also identified that there is a linear relationship between the renewal index and wind speed [38,56,72,73], the ventilation configuration that allows to obtain the highest renewal index values is the combined configuration of roof and side vents [10,16,74,75].
On the other hand, in the side ventilation configuration, the increase of renewal indexes as a function of the increase of the side ventilation area is relevant and significant only in narrow greenhouses (width < 60 m) or with few attached spans (<6 spans) [76,77,78,79]. Finally, the IR in low external wind speed conditions are more stable and higher in greenhouse structures with relevant ventilation areas in the roof region [14,29,80].

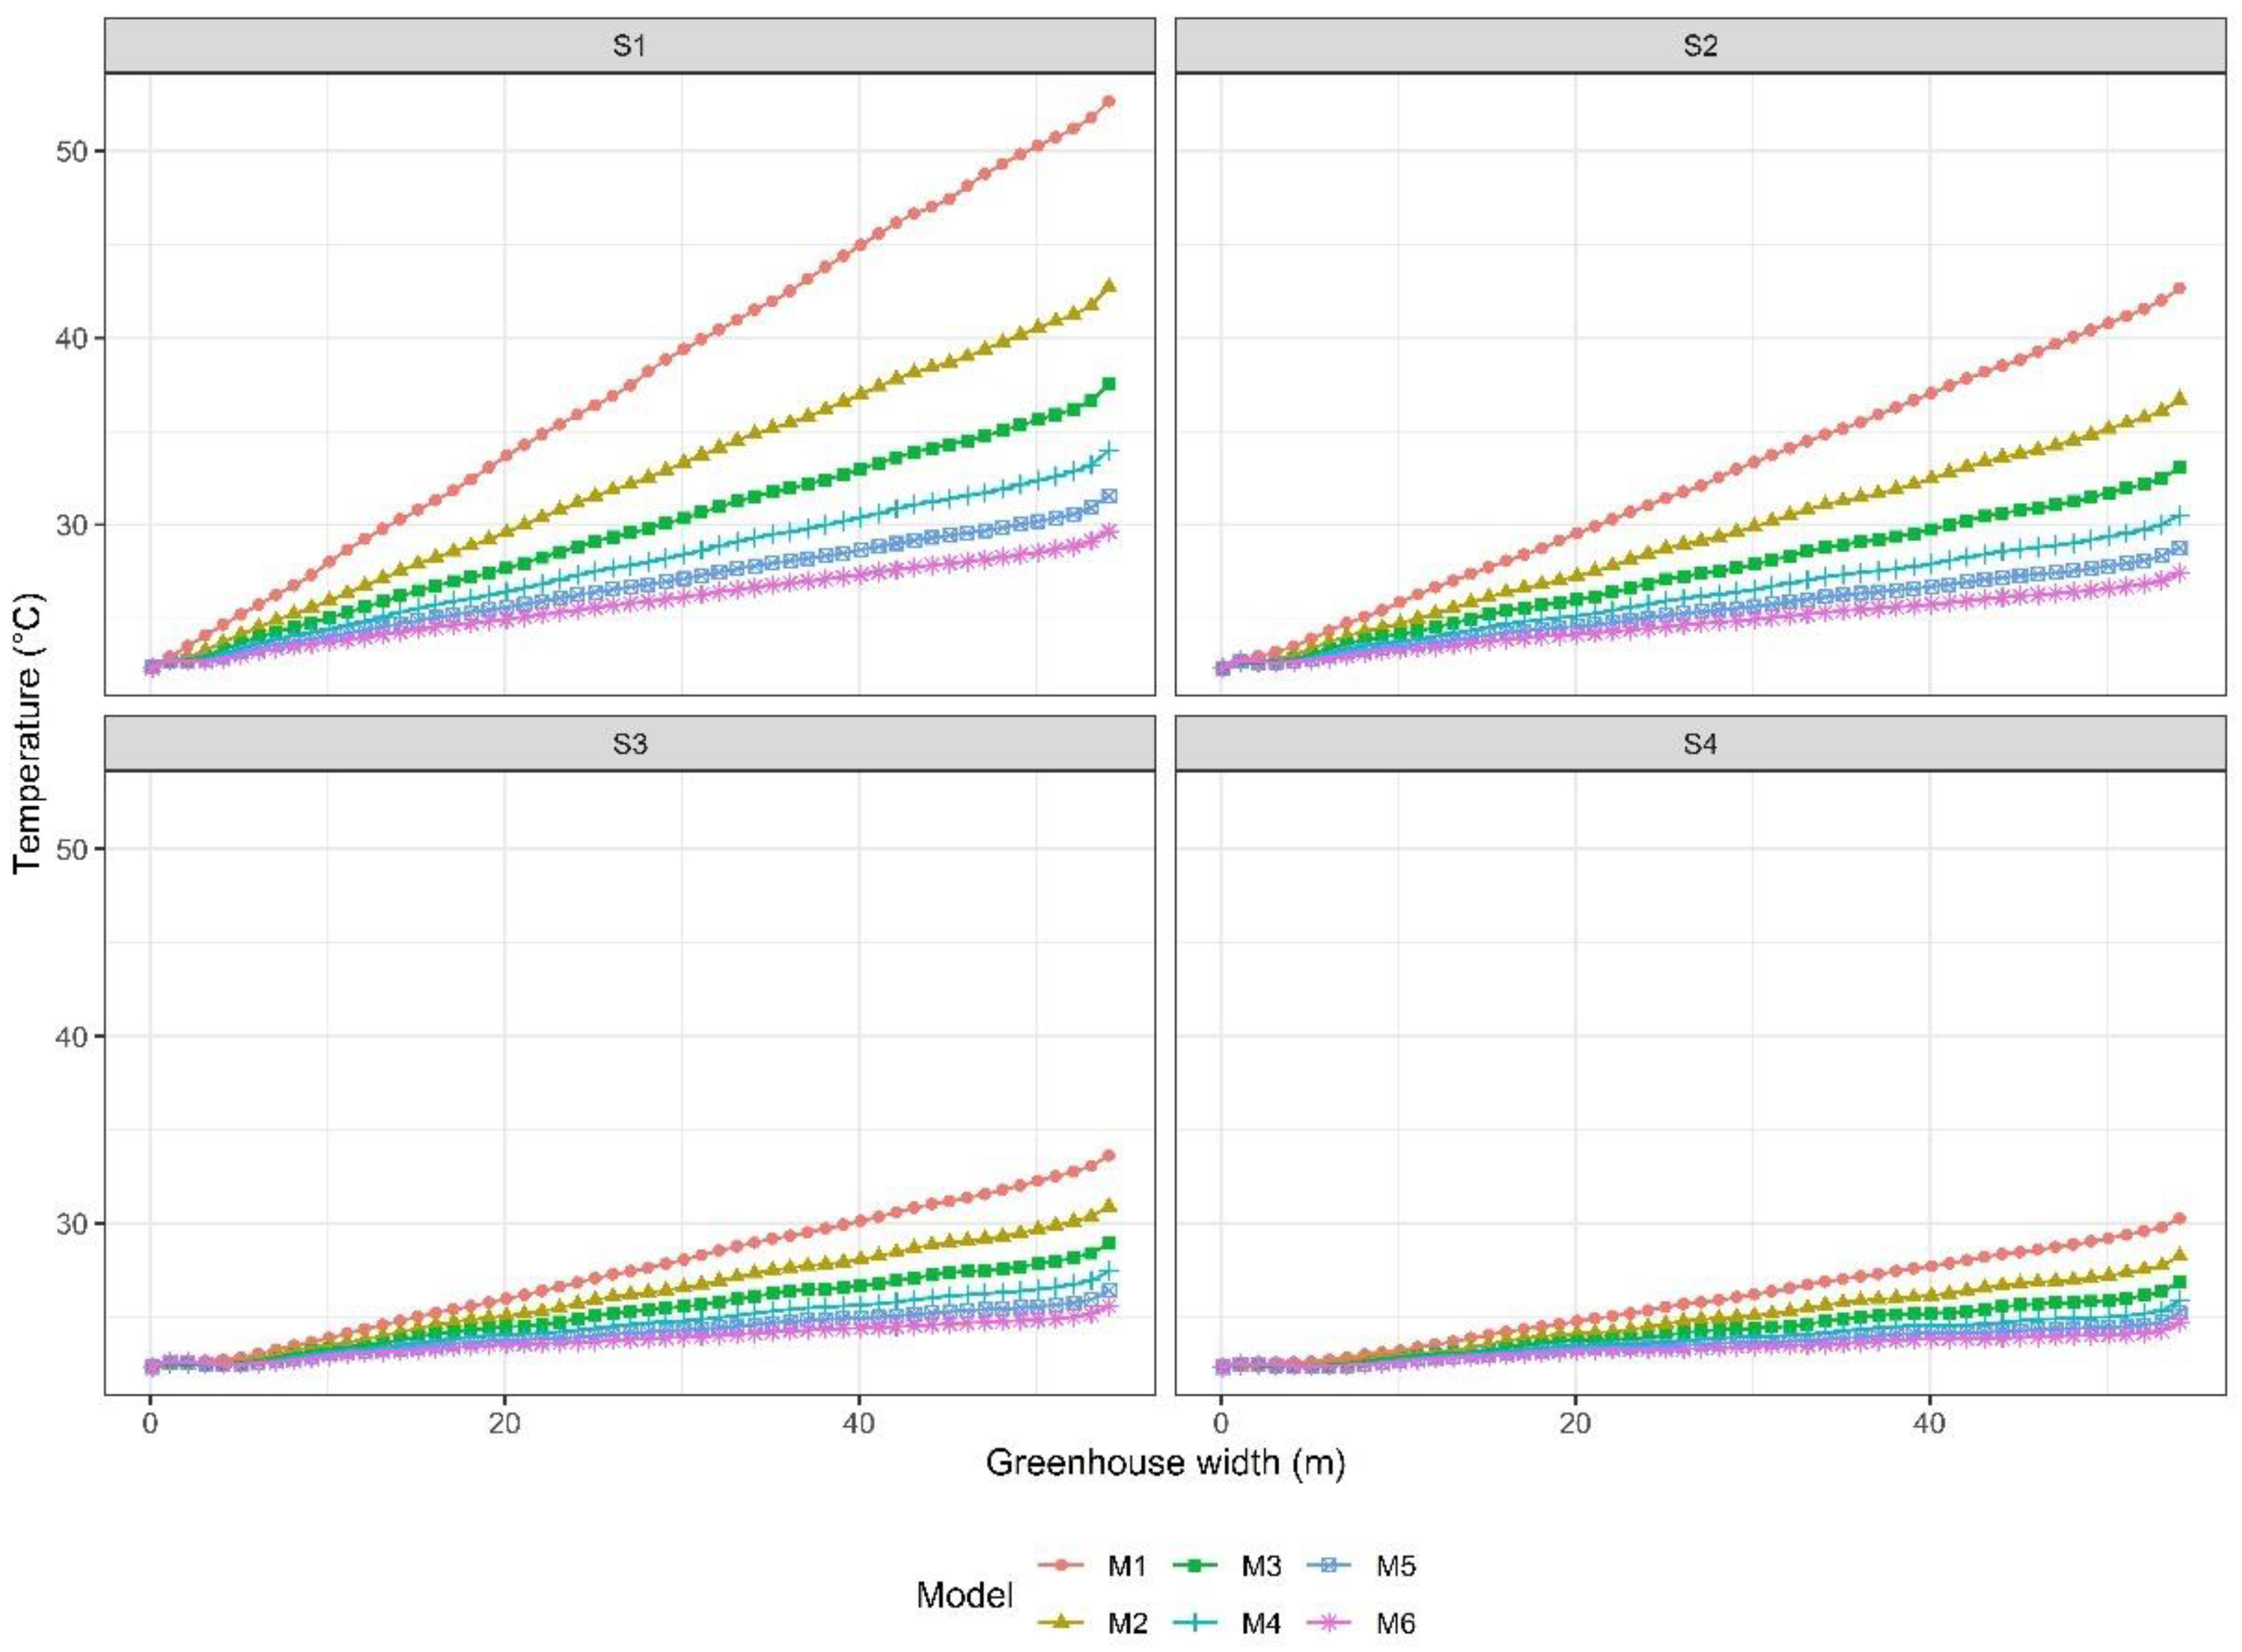
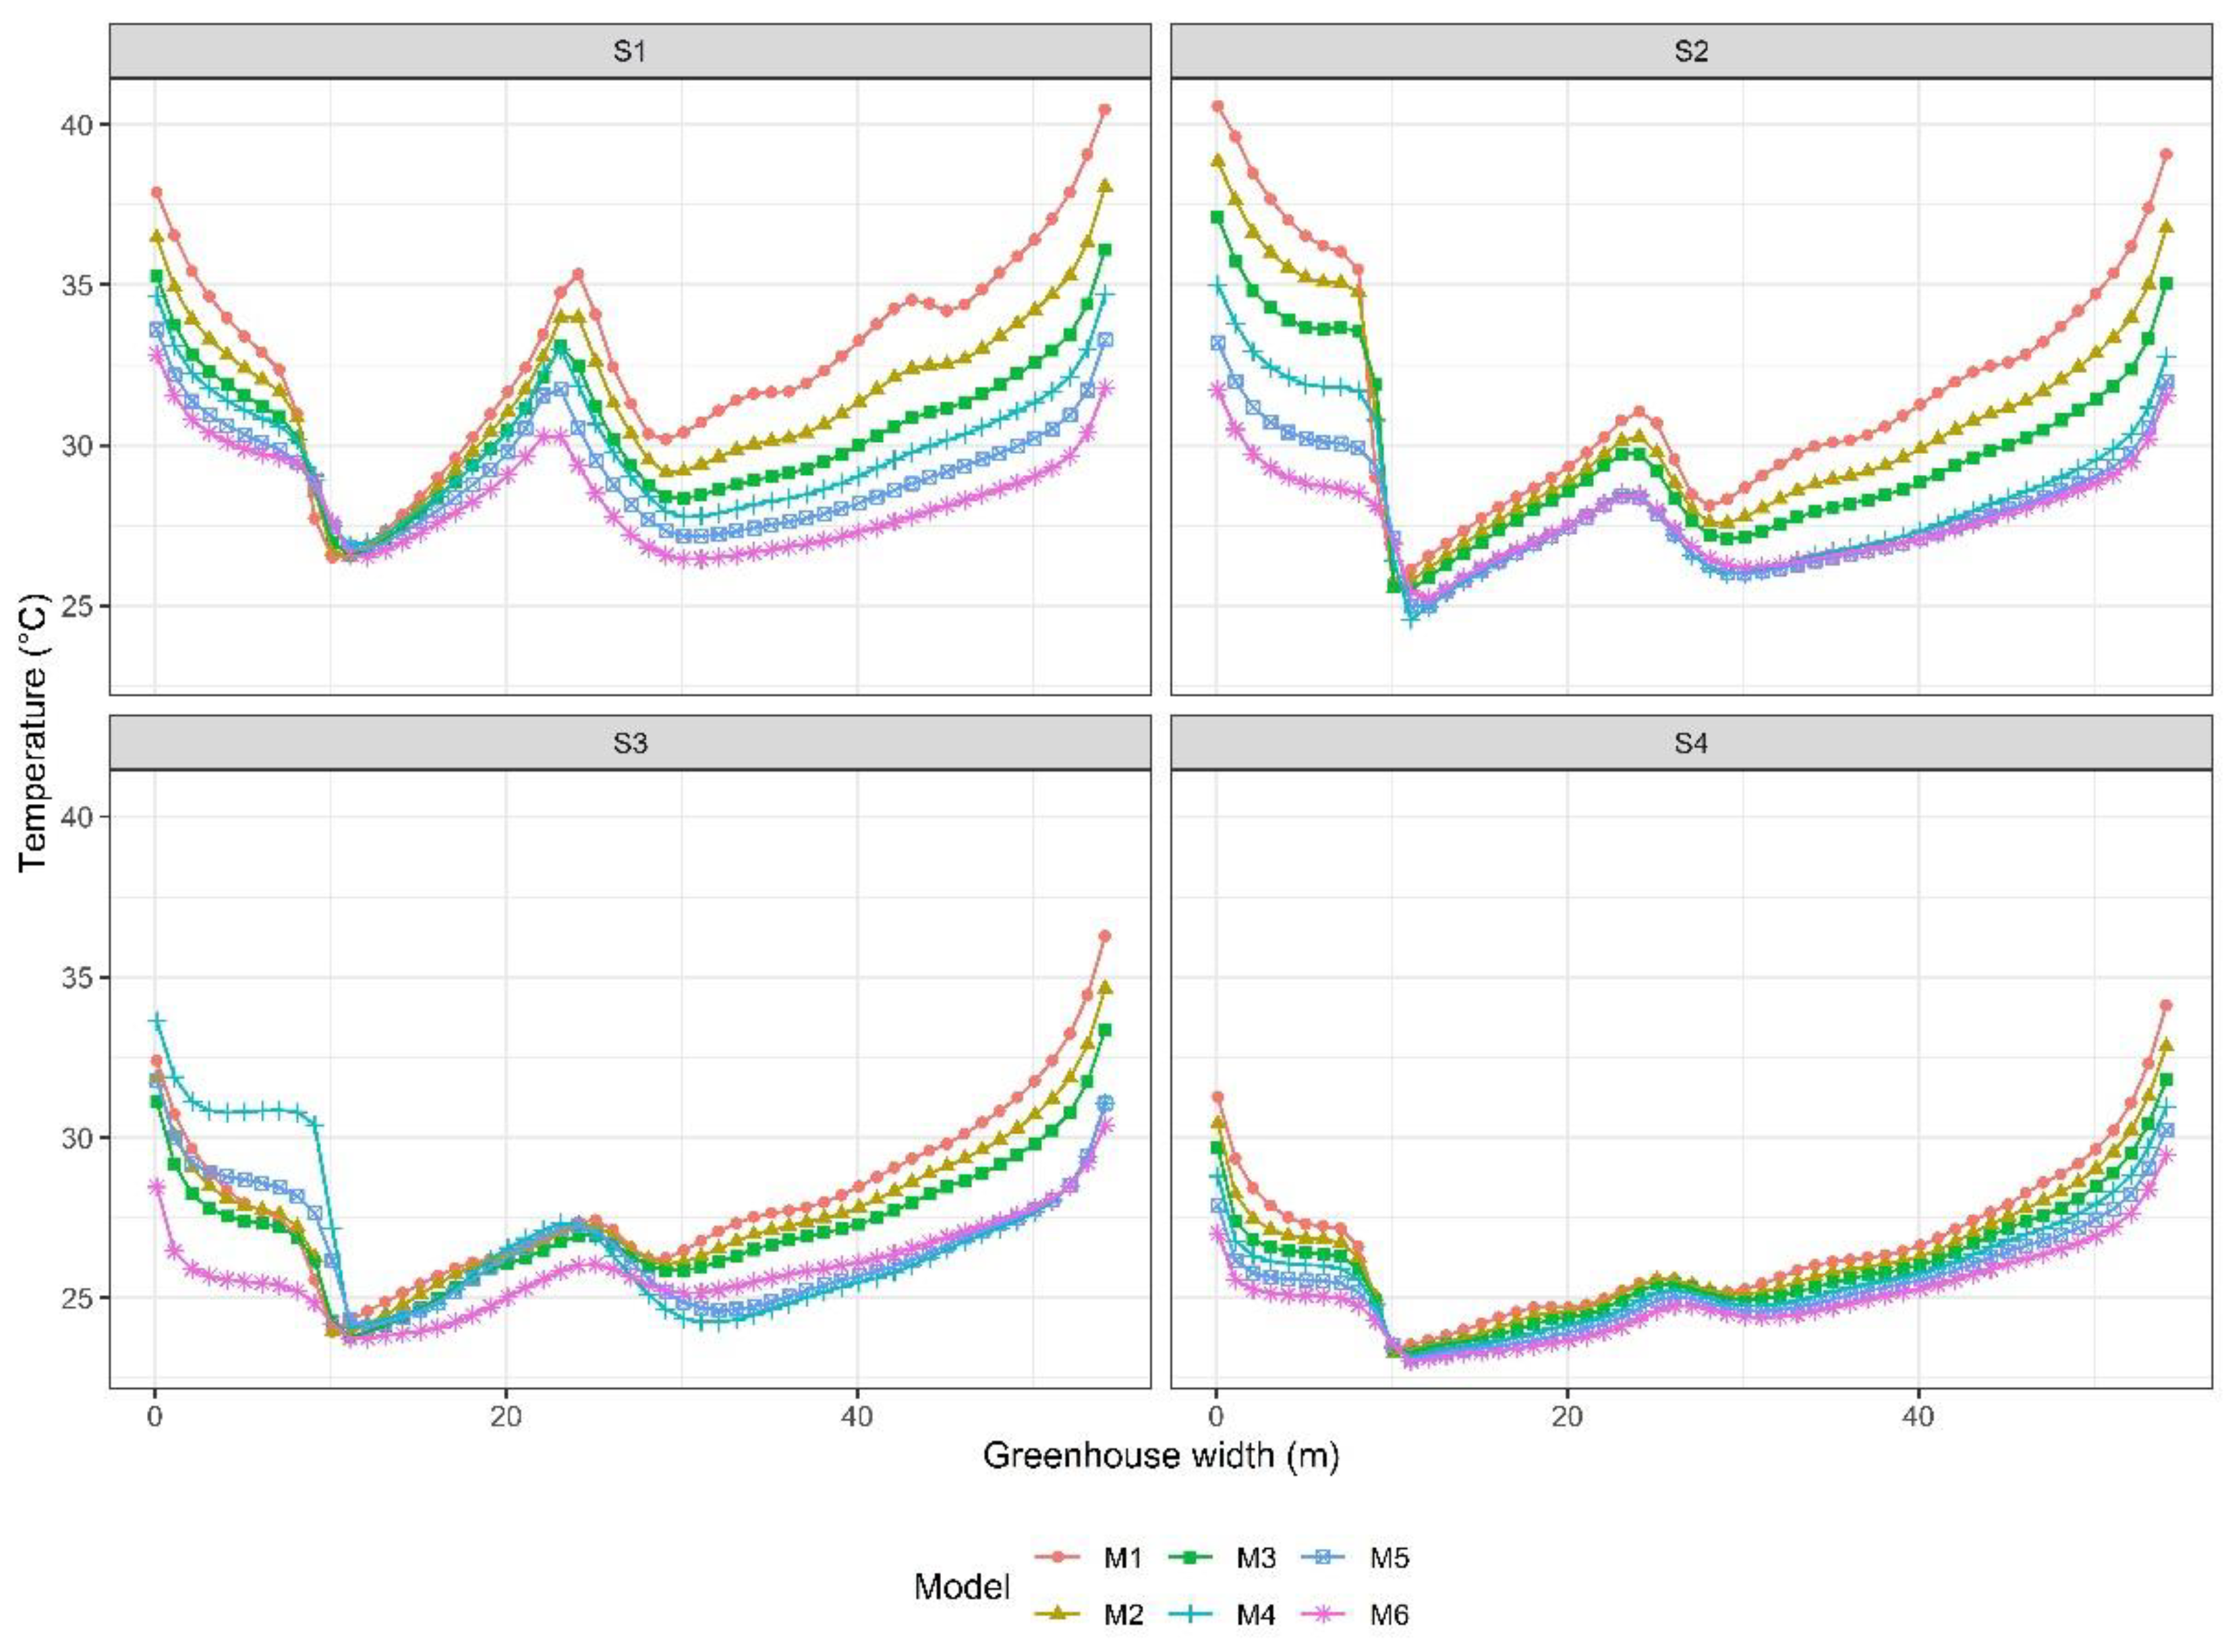
3.3. Spatial Distribution of Temperature

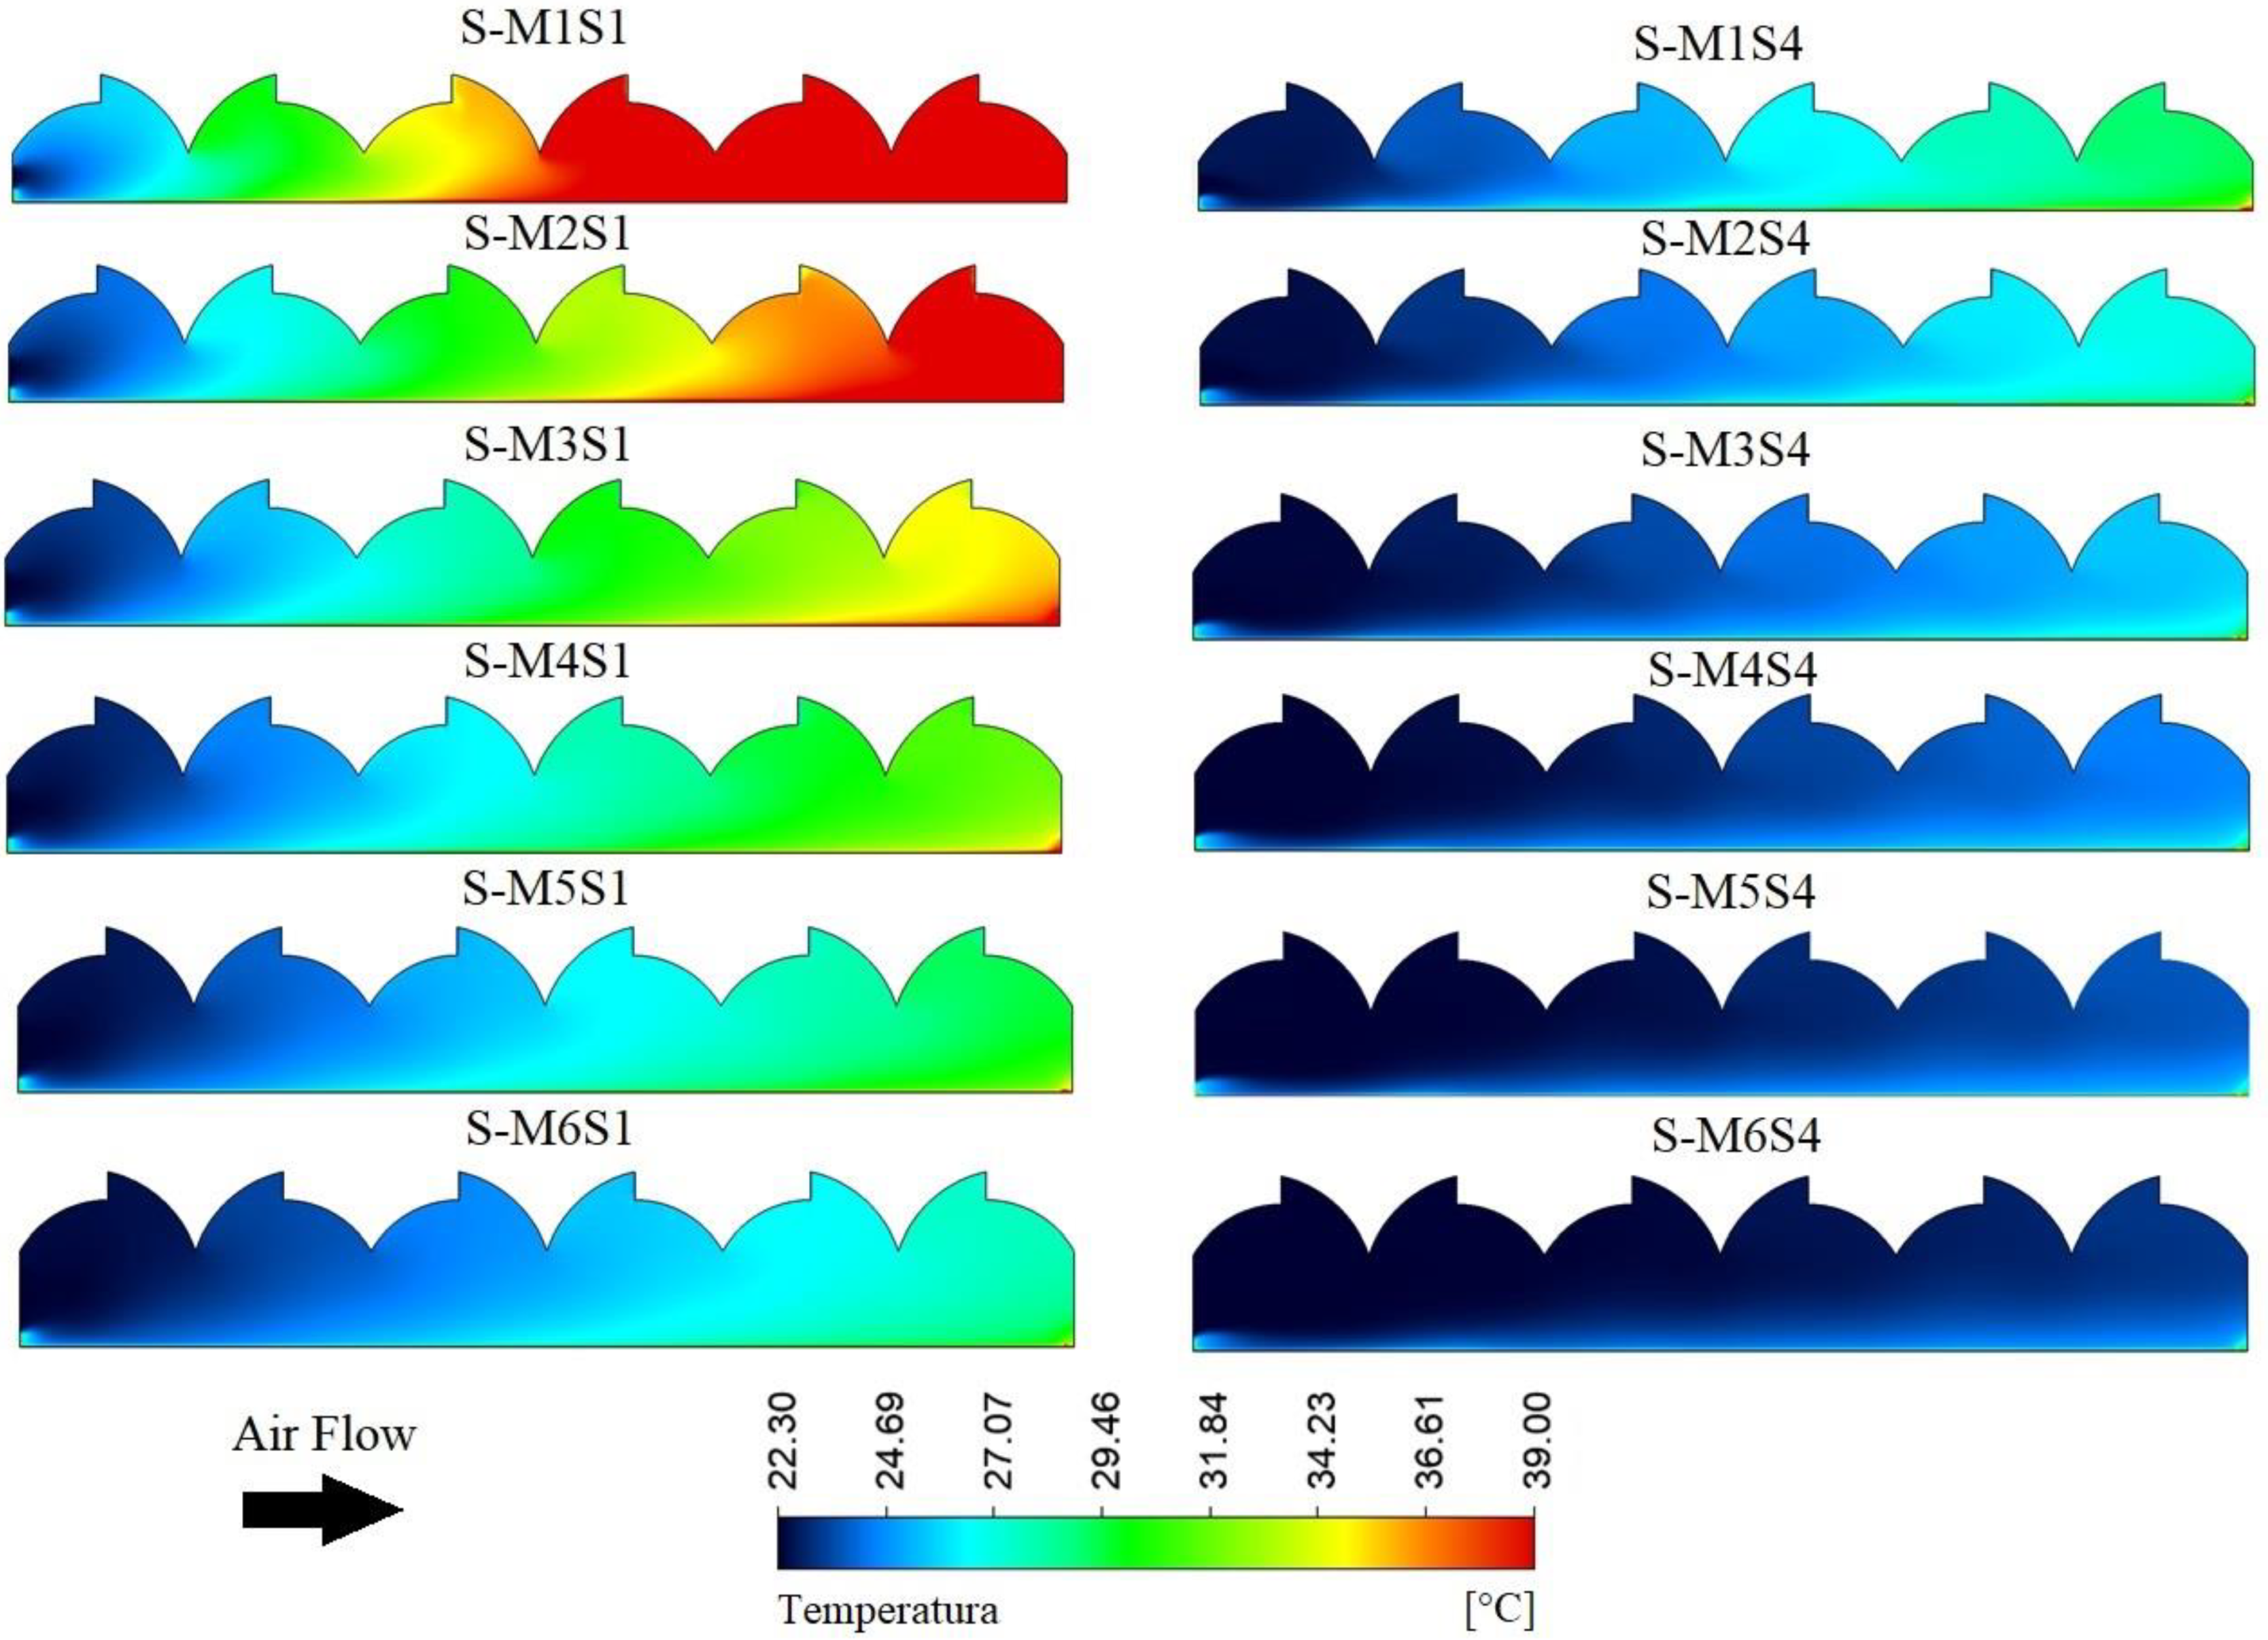
3.3.1. Side Ventilation (S)

The distribution of the thermal behavior for each of the evaluated scenarios can be seen in Figure 11. In general terms, irrespective of the outside wind speed, it was found that the cool zones correspond to the ventilation regions where the air enters the greenhouse, while the regions of higher temperature are located in the region where the air flow exits from the interior of the structure. This behavior occurs mainly because the air that enters the greenhouse through the windward window of span 1, as it crosses the cross section, mixes with the warm air and increases its energy level by heat transfer [10,45].
On the other hand, the height of the greenhouse directly influences the magnitude and spatial distribution of the temperature; it was observed that as the height of the greenhouse increases, the magnitude of the temperature and the percentage of the area of the structure with high temperature values decrease. This is an effect generated by the higher renovation index and the higher level of thermal inertia obtained in higher greenhouses [1,35]. Likewise, it is possible to observe the effects of the external wind speed, where for the highest speed scenario S4 it was found that the temperature value inside the greenhouse was lower and also presented a greater homogeneous behavior, coinciding with what was reported Flores-Velázquez [81].
In numerical terms, the average air temperature inside the greenhouse ranged between maximum values of 37.5 ± 8.9 °C for S-M1S1 and a minimum of 23.3 ± 0.6 °C for S-M6S4. For the S1 scenario it can be observed that the temperature decreases 11.7 °C comparing greenhouses M1 and M6 respectively, likewise for the S4 scenario this temperature reduction between M1 and M6 is only 2.5 °C, therefore, the increase in greenhouse height will be more relevant in regions where calms or low wind speeds predominate. Although under these conditions it should also be analyzed up to what level it is convenient from the technical and economic point of view to increase the greenhouse height, since for the M4 and M5 models under this condition no less important reductions of 9.7 and 10.8 °C, respectively, would be obtained.
Another relevant criterion to be analyzed is the uniform distribution of temperature in the cross axis of the greenhouse. This is undoubtedly a factor that has received more attention in recent years, since it has a direct influence on the physiological behavior of the plants and on the final yield of the crops [58,82]. Therefore, for this study, the values obtained in the cross section of each of the greenhouses were plotted as a function of wind speed (Figure 12).
In general, it is again observed the difference that exists between span 1 on the windward side (cool area) and span 9 on the leeward side (warm area) with relevant thermal differentials higher than 15 °C. Likewise, in some critical scenarios, the temperature in some areas of the cross section of the greenhouse exceeds 40 °C, a value that is quite inadequate for the growth and development of any vegetal species [83].

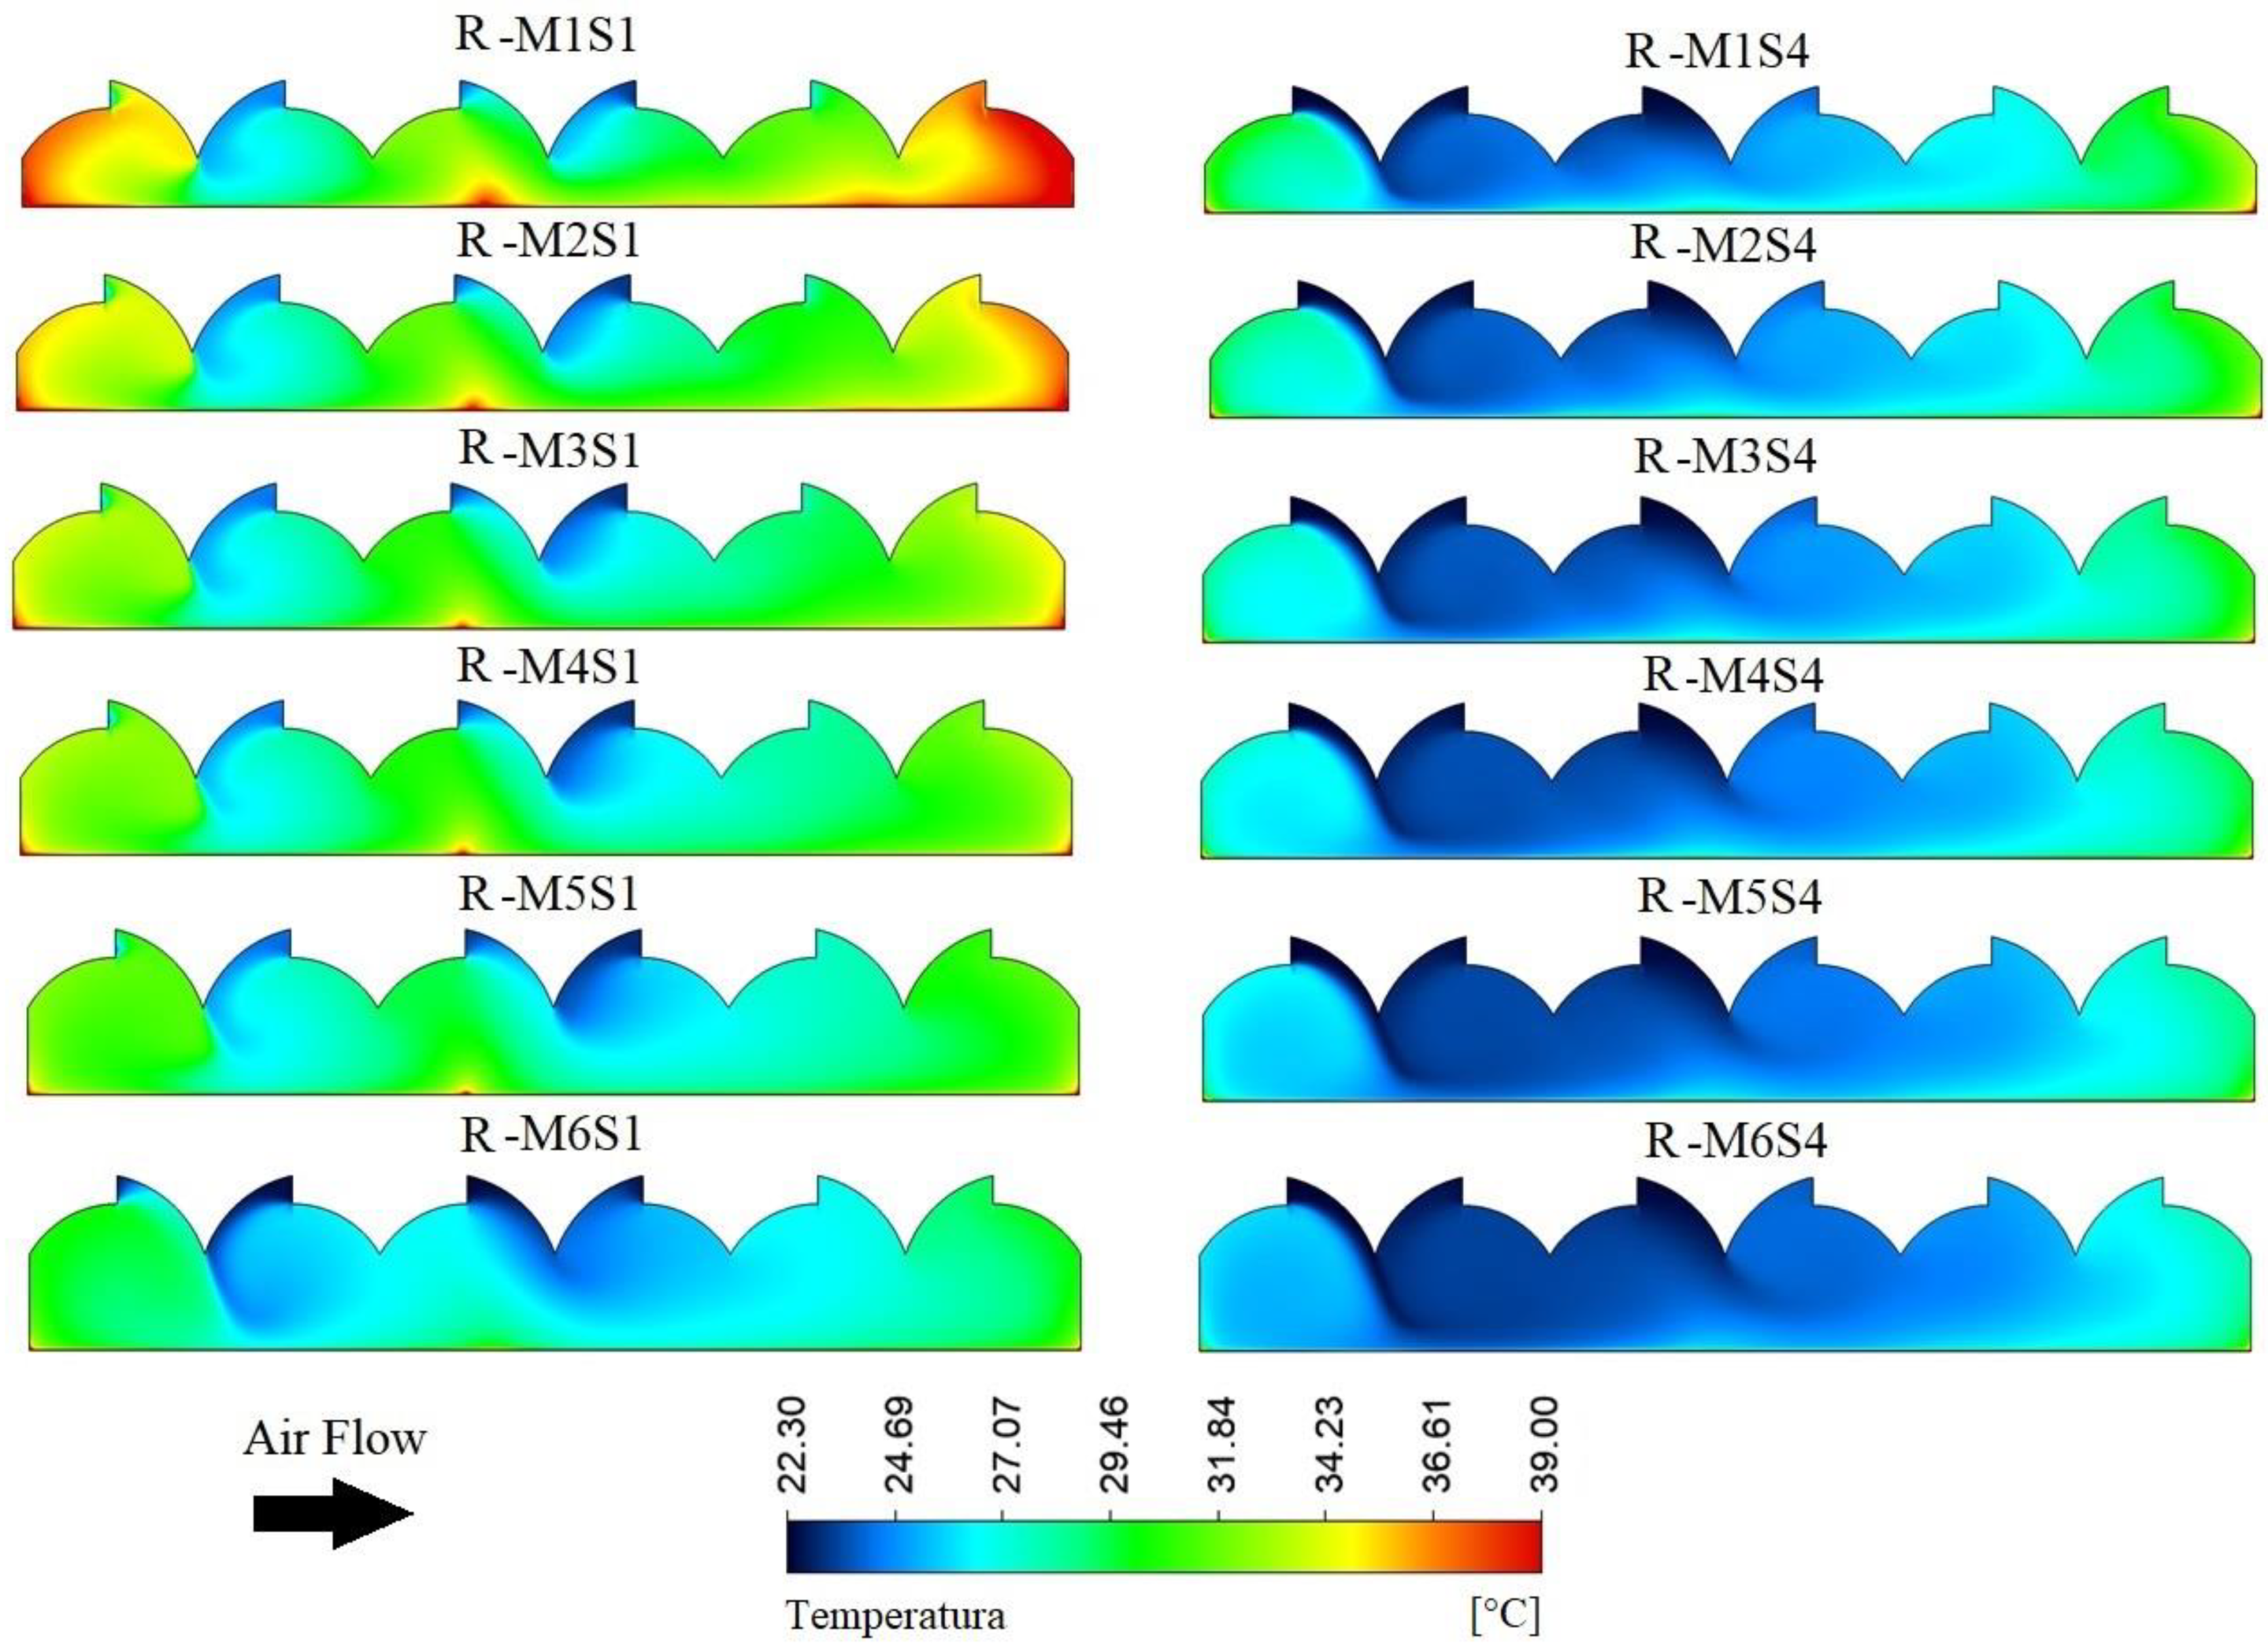
3.3.2. Roof Ventilation (R)

In qualitative terms, it is observed that under ventilation configuration R, lower temperatures are obtained with respect to configuration S (Figure 13). In general, it is observed that the highest temperature areas are located on the windward and leeward sides of the span, respectively. This behavior is related to the ventilation configuration and to the characteristics of the airflows of these regions near the greenhouse walls previously analyzed, a similar behavior was reported in a work on natural ventilation of four types of multi-tunnel greenhouses by Park et al. [84].
For this configuration it is also observed that there is a positive effect of wind speed and greenhouse height on the magnitude and distribution of the temperature inside the structure. In the most critical case S-M1S1 it is observed that there are relatively important areas of high temperature in spans 1, 3 and 5, while in the S-M6S1 scenario these areas are significantly reduced. In S-M1S4 the high temperature area disappears in span 3 and the hot areas in spans 1 and 6 are reduced to an area very close to the side wall of each side and, finally, in S-M6S4 these high temperature areas disappear completely in the spans already described.
In numerical terms the average air temperature ranged between maximum value of 32.7 ± 3.1 °C for R-M1S1, value that is lower by 4.8 °C with respect to S-M1S1, the minimum value obtained was 25.0 ± 1.3 °C in R-M6S4 value that is higher by 1.7 °C with respect to S-M6S4. For the S1 scenario the temperature reduction obtained was 1.3, 2.2, 2.8, 3.6 and 4.3 °C in M2 to M6 compared to M1 respectively, while in S4 these reductions with respect to M1 were 0.5, 0.7, 1.1, 1.1, 1.4, 1.7 °C in M2 to M6, successively, results that continue to confirm the importance of roof ventilation in low wind speed conditions (S1).
For this case, the thermal behavior on the greenhouse cross axis in each scenario evaluated shows a totally different spatial temperature distribution than that observed in the previous ventilation configuration (Figure 14). Due to the air inlet and outlet flows through the roof vents and the airflow distribution patterns discussed in Figure 6, it is possible to observe the temperature variations occurring between span 1, 3 and 6 successively. It can also be seen how this temperature distribution tends to be more uniform and smaller in magnitude as the height of the greenhouse and the outside wind speed increase.

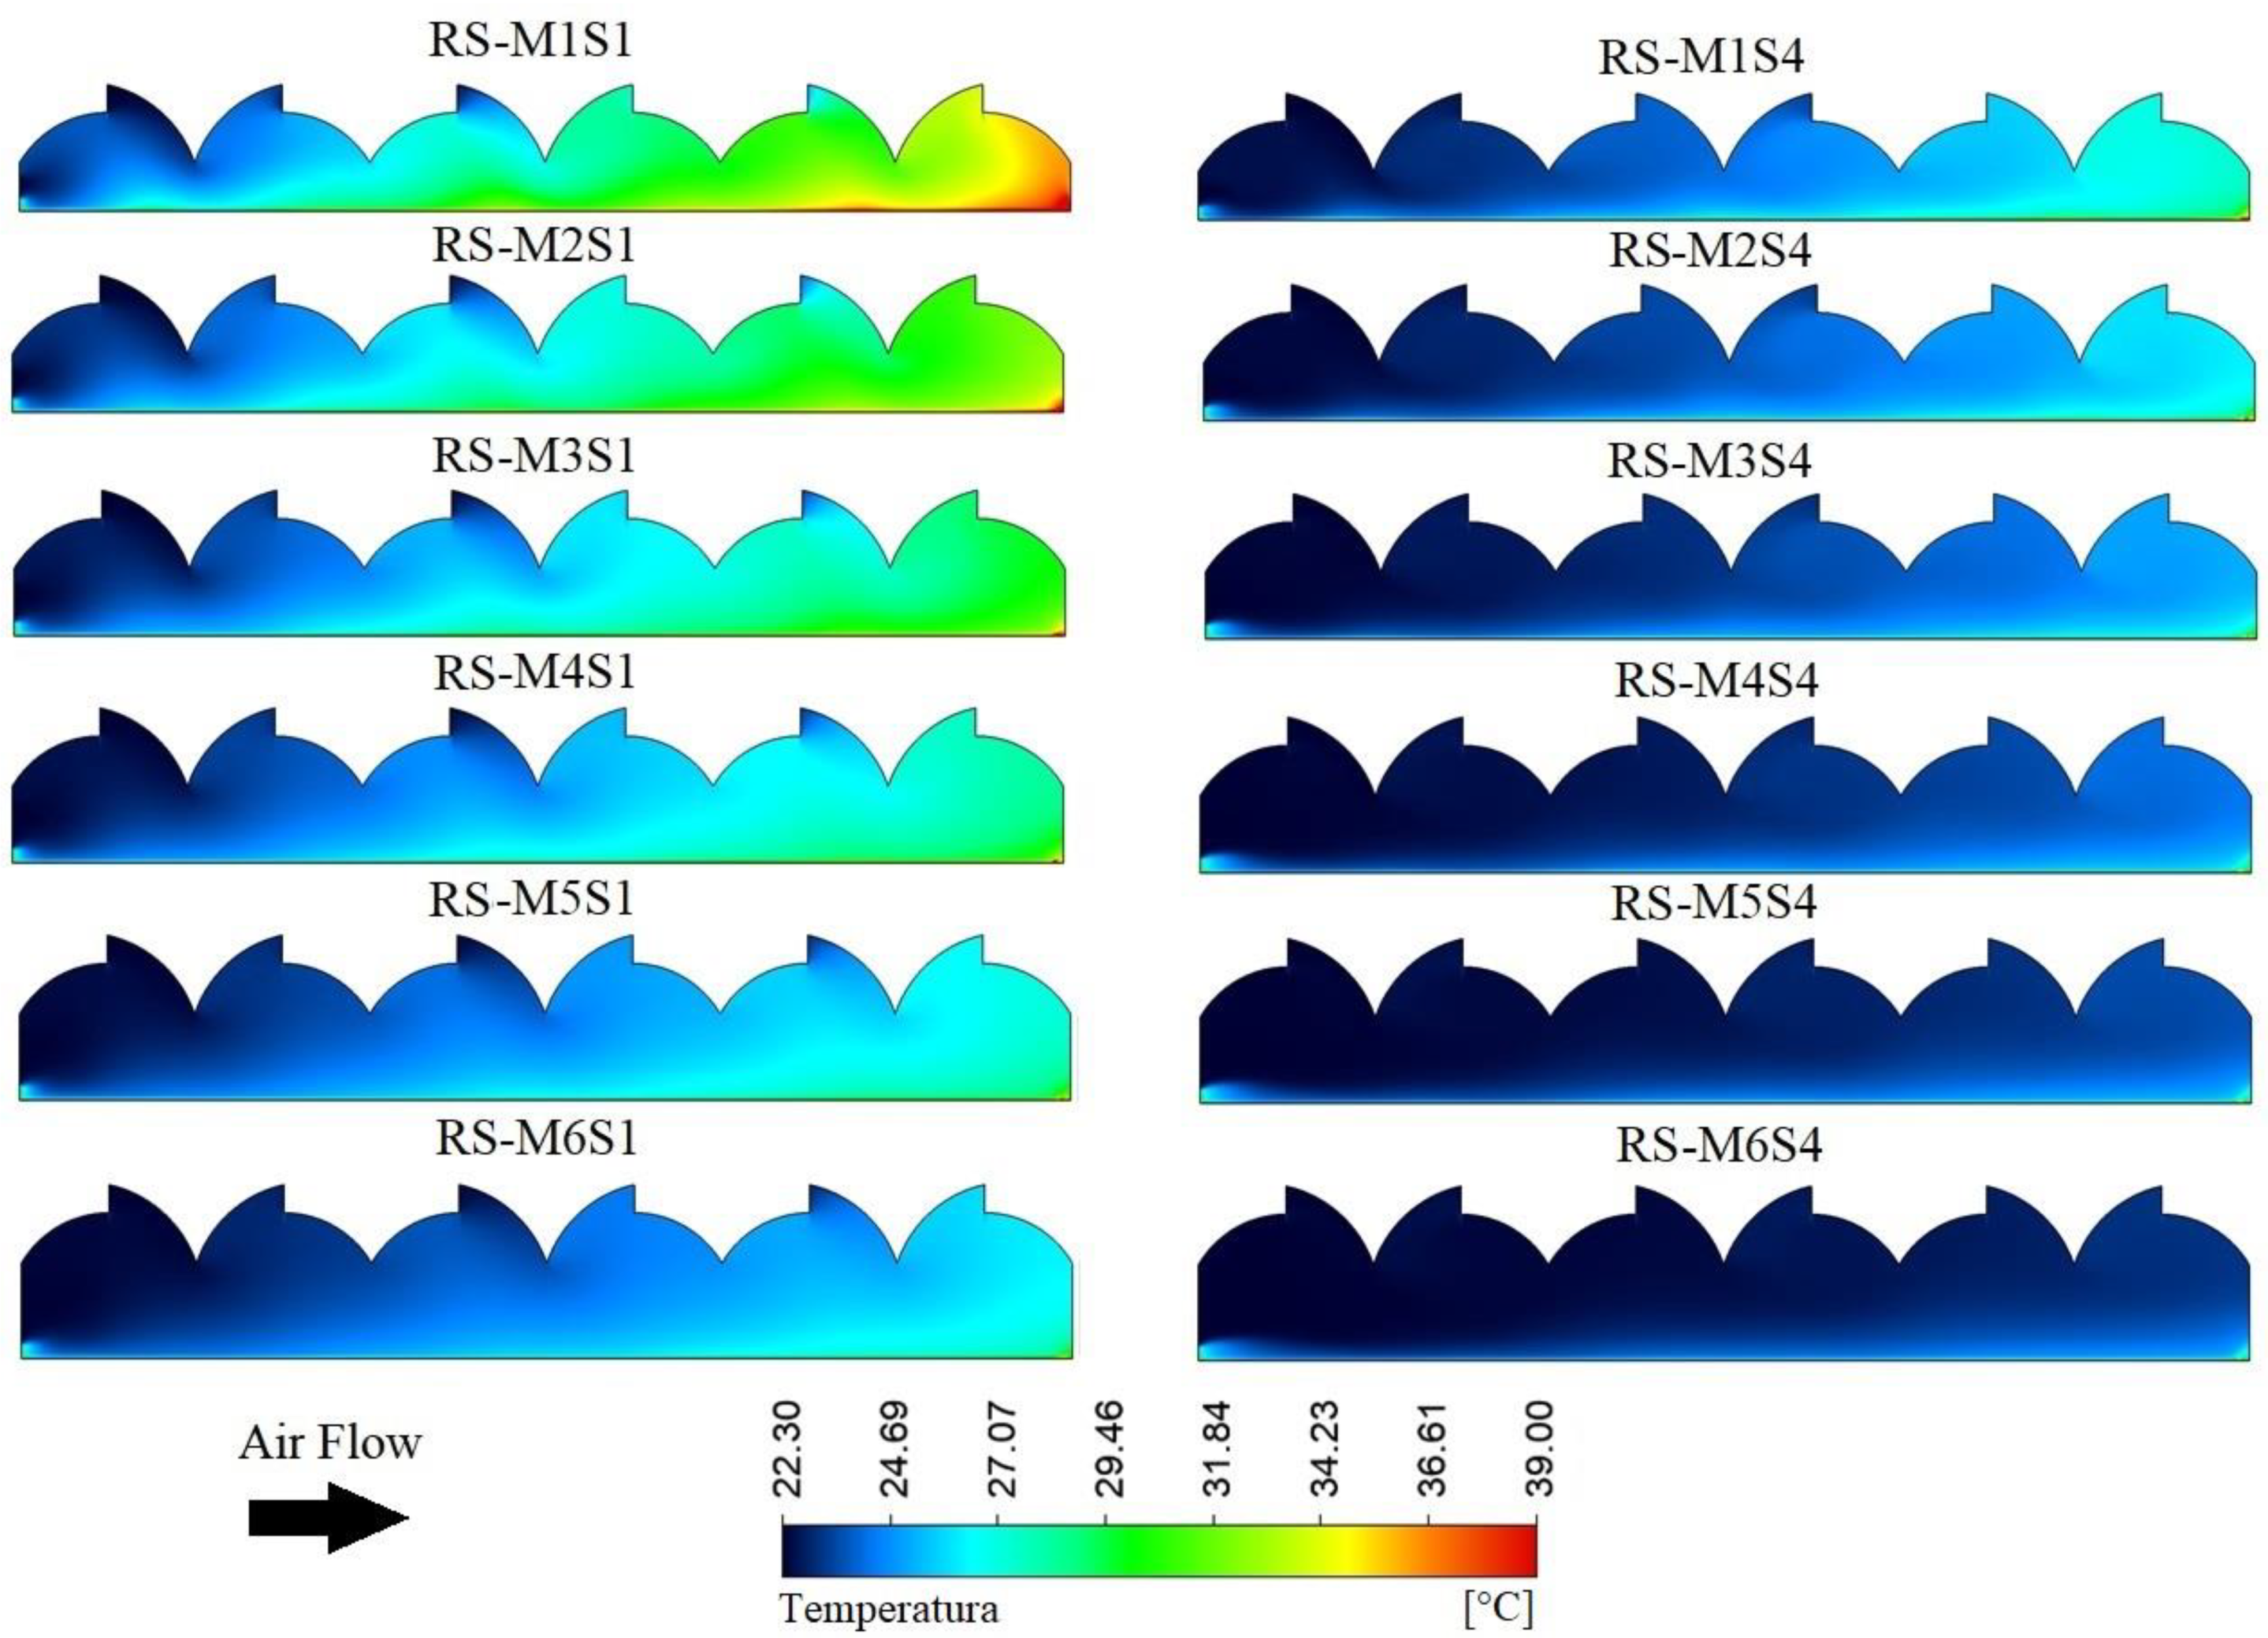
3.3.3. Side Ventilation and Roof (RS)

The spatial distribution of the temperature for this configuration allows us to observe qualitatively that the temperature value in each of the simulated scenarios has a lower magnitude compared to the S and R configurations (Figure 15). For these scenarios, it is observed that the regions of lower temperature coincide with the ventilation areas where the air flow enters, both in the lateral sides and in the roof ventilation areas, which coincides with what was analyzed in the work by Villagran et al. [10].
For scenario S1, it can be observed that the high temperature regions are in the spans located on the leeward side. This high temperature region gradually disappears as the height of the greenhouse increases. In the case of M1, the highest temperature region occurs in spans 4, 5 and 6, with a heat spot in the middle of the area of span 6. However, in M6, this heat patch disappears from the span 6 and only a small region of higher temperature is observed near the ventilation area on the leeward side of the greenhouse. Similar behavior is observed in scenario S4, although in this case the temperature values appear to be qualitatively lower than those obtained in S1.
Numerically, it was found that the temperature value inside the structure presented a maximum value of 29.4 ± 3.8 °C in RS-M1S1, being this value lower by 8.1 and 3.3 °C compared to S and R, respectively. Therefore, the RS ventilation configuration also allows obtaining a higher cooling efficiency under the same climatic conditions, which is a very relevant factor for the management of the microclimate in greenhouses located in the savanna of Bogota [1].
On the other hand, the minimum mean inside air temperature value was 23.2 ± 0.6 °C in RS-M6S4, a value that is lower by 1.7 and 0.1 °C with respect to those obtained in R and S, respectively. Therefore, again it can be observed that the greatest benefits in terms of thermal distribution are obtained for low wind speed conditions. It is also important to note that the temperature values obtained in most of the scenarios are within the range of 25 and 30 °C, ranges where species of commercial and food interest such as Tomatoes tend to develop adequately. As well as some ornamental species of commercial interest for the international market such as the Rose or Carnation [1,85].
Regarding the spatial distribution, it was again found that as the greenhouse height increases and the external wind speed increases, more stable and uniform temperature values are obtained in the cross section of the greenhouse (Figure 16). The thermal gradients for the same moment inside the greenhouse were reduced from 13.2 °C in M1S1 to 1.94 °C in M6S4, the latter value being a recommended limit to guarantee the homogeneity of a naturally ventilated greenhouse [39,86].

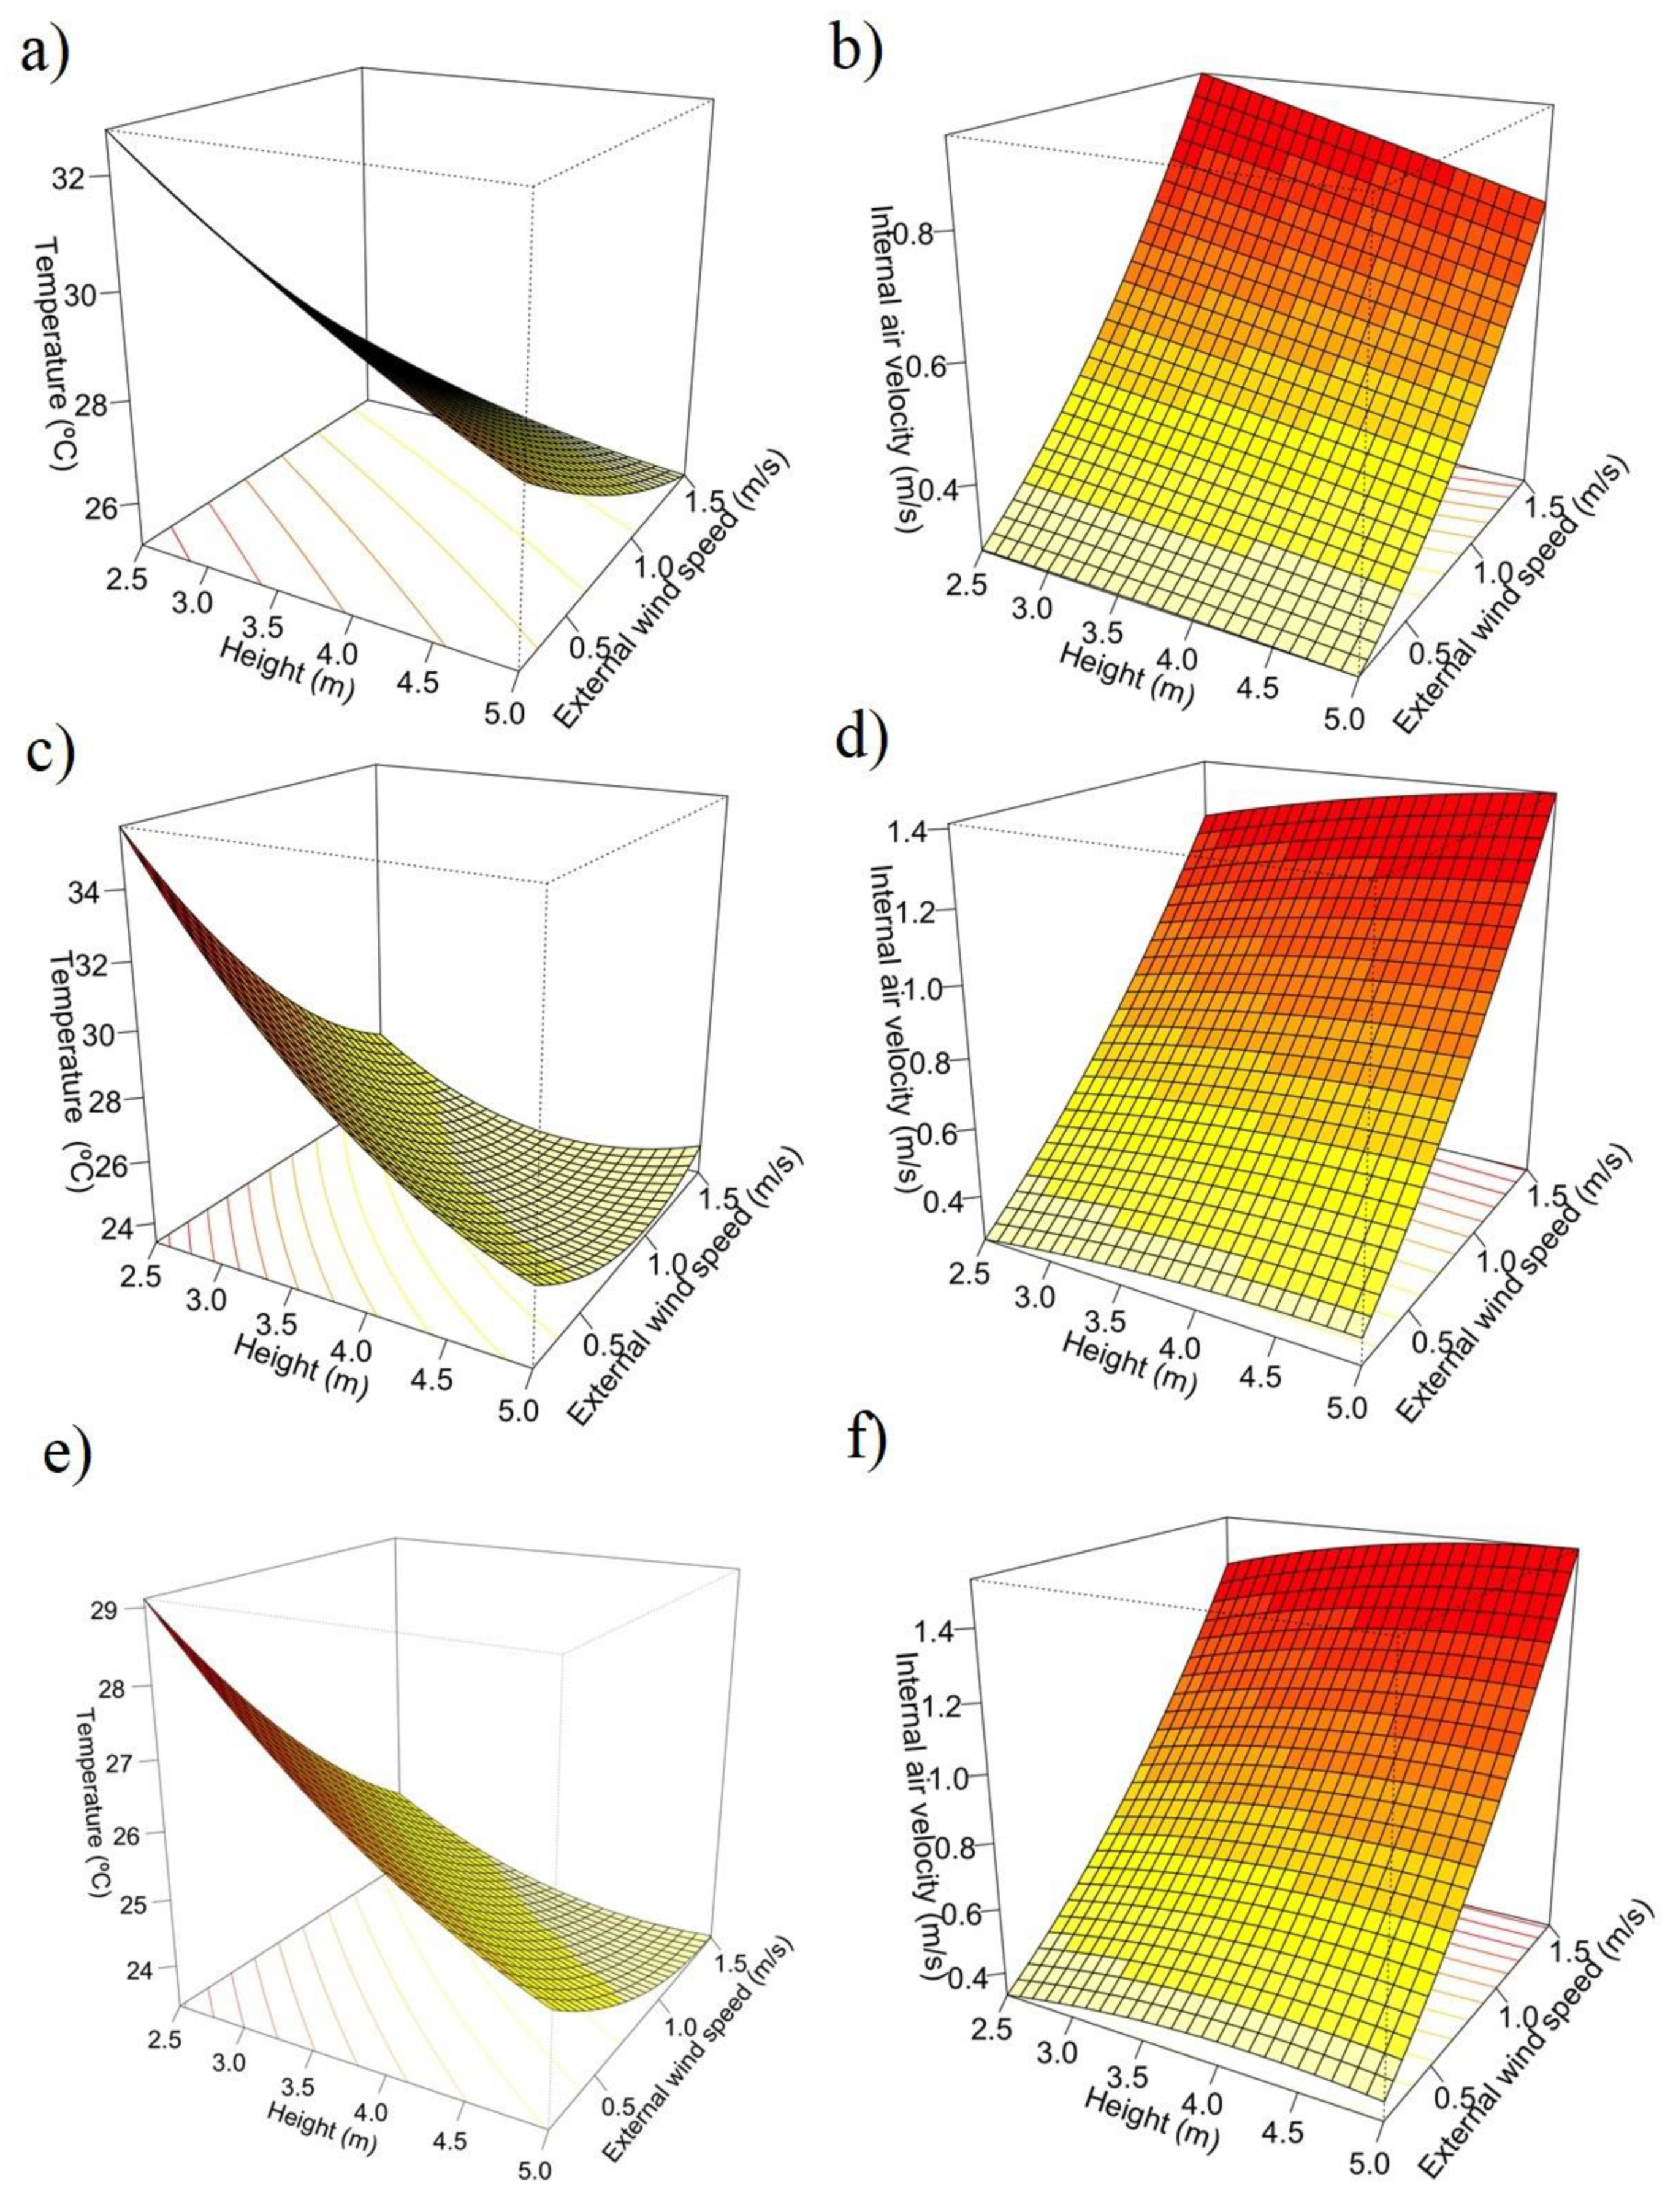
3.4. Response Surface Modeling

Finally, looking for a better and simpler interpretation of the results obtained by CFD simulation, these numerical results of the evaluated scenarios were adjusted to response surface models. This methodology allows observing the behavior of the response variable in scenarios not simulated numerically, if these scenarios are within the limiting ranges of the simulated boundary conditions
The results for the fitted response surface models are summarized in Table 4. The second order model alternative gave the best results for all models. The lack of fit test showed that the models accurately fit the data exception made for the sidewalls scenario and with temperature as the response variable. The adjusted R-squared coefficient of determination indicated varying results whether the outcome variable was the internal air velocity or the temperature. Highest R-squared values were obtained for the models with wind speed as the dependent variable as compared to their temperature pairs under the same scenario.
Despite the varying results for the adjusted R-squared coefficient, all terms included in the models were considered significant. Since most of the results indicated a good fit of the model to the calibration data, we evaluated the effect of varying levels of greenhouse height and external wind speed for each ventilation scenario through response surface plots. The response surface plots indicated a similar behavior for internal temperature and air velocity irrespective of the ventilation scenario (Figure 17). The individual effects of the predictors showed that increasing the greenhouse height effectively resulted in lower temperatures, while the internal air velocity was slightly affected by the greenhouse height. The major effect of the external wind speed on both, the temperature, and the internal air velocity, is clearly depicted in Figure 17. Increasing the greenhouse height under increasing levels of external wind speed resulted in lower temperature values within the greenhouse.
On the other hand, lower greenhouse heights combined with decreased external wind speeds resulted in lower internal air velocity. However, while all scenarios depicted the same trends, differences arise when looking at the scale of variation of the internal temperatures and air velocity. The sidewalls scenario showed that increasing the greenhouse height under increased external wind speeds have a more dramatic effect in terms of lowering the internal temperature of the greenhouse (Figure 17c), compared to roof or combined ventilation (Figure 17a,e).
The option to apply only the roof ventilation decreased the internal wind speed under almost null external wind speed no matter what the greenhouse height is. However, when the external wind speed increases along with the greenhouse height, internal air velocity also increases but the highest internal air velocity is reached with the lowest greenhouse height and the maximum external wind speed (Figure 17b). This results is opposed to the other scenarios where the top internal air velocity was reached when the maximum greenhouse height and external wind speed were evaluated (Figure 17d,f).
The optimal combination of greenhouse height and external wind speed that minimized the temperature and achieved an adequate internal wind speed seemed to be located around the maximum height and external wind speed for all scenarios. These results implied that higher values for both explanatory variables should be considered to find the lowest internal temperature and the highest internal air velocity. However, going beyond and increasing the region of analysis will yield unrealistic results due to greenhouse construction restrictions and maximum local wind speeds.
The results presented here are in line with those reported by Villagran et al. [1], and Bustamante et al. [87], indicating that increased greenhouse heights and the combination of roof and sidewalls ventilation yields improved internal climate conditions, particularly for greenhouse established in high altitude tropical regions.
It is also important to recommend that a future study regarding this greenhouse typology should focus on the structural design of the model evaluated and an economic analysis of the height alternatives proposed. This to be able to dimension the robustness of the structure and an associated cost per m2 of covered area for each of the 6 models proposed, although in Colombia there are currently no regulations in force for the construction of greenhouses, a work of this magnitude can provide economic and structural tools for decision making. This information can be used for the generation of public policy management documents that can promote and regulate the use of greenhouses conceived with design criteria.

4. Conclusions

The numerical simulation tool is still an agile and accurate alternative to determine the renewal indexes and thermal distribution in passive greenhouses. It is also analyze unconstructed scenarios, facilitating decision making for farmers and providing an alternative analysis that can contribute to improve the technical and economic sustainability of protected agriculture.
The use of previously validated CFD models allows generating simulated data series of temperature and air velocity inside a greenhouse and associating them to response variables such as the height of the structure evaluated or others. This facilitated the association of the obtained data to other analysis methodologies such as regression with response surface models obtaining acceptable adjustments in the analyzed variables, therefore, it was possible to generate response surface graphs which facilitates the interpretation of the numerical results as a whole for each ventilation configuration analyzed (S, R, RS).
The natural ventilation of a greenhouse is highly dependent on the behavior of the wind speed of the study region. For the three ventilation configurations analyzed (S, R and RS), it was found that the renewal indexes were maximized as a function of the increase in the external wind speed. Although it should be noted that regardless of the ventilation configuration for the lowest wind speed S1 (0.2 ms−1), none of the greenhouse models exceeded the recommended minimum value of 40 hourly renovations, although these IR values are less critical in the RC configuration. The optimization of the IR in the RS ventilation configuration allowed obtaining a higher cooling efficiency inside the greenhouse and a uniformity in the spatial distribution of the temperature. Maximum temperature values of 29.4 ± 3.8 °C were obtained in RS-M1S1, being this value lower by 8.1 and 3.3 °C with respect to S-M1S1 and R-M1S1 respectively.
The crop production in greenhouse in the future should be with the efficient use of resources, so that numerical simulation techniques will have the goal of adapting the climatic environment in the design and operation of protected agriculture. In addition to the greenhouse dimensions, the position and size of windows are among the other influential factors to be considered in future studies

Author Contributions

Conceptualization, E.V., M.A., J.F.-V.; Methodology, E.V., C.B., J.F.-V., M.A.; Software, E.V.; Validation, E.V., C.B.; Investigation, E.V., C.B.; Writing—original draft preparation, E.V., C.B., J.F.-V., M.A.; Writing—review and editing, E.V., C.B., J.F.-V., M.A. All authors have read and agreed to the published version of the manuscript.

Funding

The present study was funded by the Servicio Nacional de Aprendizaje (SENA), la Asociación Colombiana de Exportadores de Flores (Asocolflores) y al Centro de Innovación de la Floricultura Colombiana (Ceniflores) through the project “Generación de una herramienta de diseño u optimización de ventilación natural de los invernaderos dedicados a la producción de flores de corte en cuatro subregiones de la Sabana de Bogotá, mediante el uso de herramientas de simulación basadas en la técnica Dinámica de Fluidos Computacional (CFD)”.

Data Availability Statement

Not applicable.

Acknowledgments

To the Universidad Jorge Tadeo Lozano for the support for the development of the doctoral research project called “Development of a methodological proposal for the design, evaluation and microclimatic optimization of passive greenhouses through the use of numerical simulation tools”.

Conflicts of Interest

The authors declare no conflict of interest.

References

  1. Villagrán, E.A.; Romero, E.J.B.; Bojacá, C.R. Transient CFD analysis of the natural ventilation of three types of greenhouses used for agricultural production in a tropical mountain climate. Biosyst. Eng. 2019, 188, 288–304. [Google Scholar] [CrossRef]
  2. Sun, H.; Wang, L.; Lin, R.; Zhang, Z.; Zhang, B. Mapping Plastic Greenhouses with Two-Temporal Sentinel-2 Images and 1D-CNN Deep Learning. Remote Sens. 2021, 13, 2820. [Google Scholar] [CrossRef]
  3. Villagran, E.; Leon, R.; Rodriguez, A.; Jaramillo, J. 3D Numerical Analysis of the Natural Ventilation Behavior in a Colombian Greenhouse Established in Warm Climate Conditions. Sustainability 2020, 12, 8101. [Google Scholar] [CrossRef]
  4. Nikolaou, G.; Neocleous, D.; Katsoulas, N.; Kittas, C. Irrigation of Greenhouse Crops. Horticulturae 2019, 5, 7. [Google Scholar] [CrossRef] [Green Version]
  5. Pakari, A.; Ghani, S. Airflow assessment in a naturally ventilated greenhouse equipped with wind towers: Numerical simulation and wind tunnel experiments. Energy Build. 2019, 199, 1–11. [Google Scholar] [CrossRef]
  6. Holcman, E.; Sentelhas, P.C.; Mello, S.D.C. Cherry tomato yield in greenhouses with different plastic covers. Ciência Rural 2017, 47. [Google Scholar] [CrossRef] [Green Version]
  7. Revathi, S.; Sivakumaran, N.; Radhakrishnan, T. Design of solar-powered forced ventilation system and energy-efficient thermal comfort operation of greenhouse. Mater. Today Proc. 2021, 46, 9893–9900. [Google Scholar] [CrossRef]
  8. Salah, A.H.; Hassan, G.E.; Fath, H.; Elhelw, M.; Elsherbiny, S. Analytical investigation of different operational scenarios of a novel greenhouse combined with solar stills. Appl. Therm. Eng. 2017, 122, 297–310. [Google Scholar] [CrossRef]
  9. Jiménez-Lao, R.; Aguilar, F.; Nemmaoui, A.; Aguilar, M. Remote Sensing of Agricultural Greenhouses and Plastic-Mulched Farmland: An Analysis of Worldwide Research. Remote Sens. 2020, 12, 2649. [Google Scholar] [CrossRef]
  10. Munar, E.; Aldana, C. CFD Simulation of the Increase of the Roof Ventilation Area in a Traditional Colombian Greenhouse: Effect on Air Flow Patterns and Thermal Behavior. Int. J. Heat Technol. 2019, 37, 881–892. [Google Scholar] [CrossRef]
  11. Villagrán, E.; Flores-Velazquez, J.; Bojacá, C.; Akrami, M. Evaluation of the Microclimate in a Traditional Colombian Green-house Used for Cut Flower Production. Agronomy 2021, 11, 1330. [Google Scholar] [CrossRef]
  12. Diaz, D.; Bojacá, C.; Schrevens, E. Modeling the suitability of the traditional plastic greenhouse for tomato production across Colombian regions. Acta Hortic. 2018, 857–864. [Google Scholar] [CrossRef]
  13. Fernández-García, M.; Vidal-López, P.; Rodríguez-Robles, D.; Villar-García, J.; Agujetas, R. Numerical Simulation of Multi-Span Greenhouse Structures. Agriculture 2020, 10, 499. [Google Scholar] [CrossRef]
  14. Villagran, E.; Bojacá, C.; Akrami, M. Contribution to the Sustainability of Agricultural Production in Greenhouses Built on Slope Soils: A Numerical Study of the Microclimatic Behavior of a Typical Colombian Structure. Sustainability 2021, 13, 4748. [Google Scholar] [CrossRef]
  15. Flores-Velazquez, J. Analisis de la Ventilación en los Principales Modelos de Invernaderos en Mejico Mediante Dinámica de Fluidos Computacional (CFD). Ph.D. Thesis, University of Almería, Almería, Spain, 2010. [Google Scholar]
  16. Munar, E.A.V.; Aldana, C.R.B. Study of natural ventilation in a Gothic multi-tunnel greenhouse designed to produce rose (Rosa spp.) in the high-Andean tropic. Ornam. Hortic. 2019, 25, 133–143. [Google Scholar] [CrossRef] [Green Version]
  17. Choab, N.; Allouhi, A.; El Maakoul, A.; Kousksou, T.; Saadeddine, S.; Jamil, A. Review on greenhouse microclimate and application: Design parameters, thermal modeling and simulation, climate controlling technologies. Sol. Energy 2019, 191, 109–137. [Google Scholar] [CrossRef]
  18. Bot, G. Physical modeling of greenhouse climate. IFAC Proc. Vol. 1991, 24, 7–12. [Google Scholar] [CrossRef]
  19. Seven, S.A.; Taştan, Ö.F.; Tas, C.E.; Ünal, H.; Ince, I.A.; Menceloglu, Y.Z. Insecticide-releasing LLDPE films as greenhouse cover materials. Mater. Today Commun. 2019, 19, 170–176. [Google Scholar] [CrossRef]
  20. Babaghayou, M.; Mourad, A.-H.I.; Lorenzo, V.; Chabira, S.; Sebaa, M. Anisotropy evolution of low density polyethylene greenhouse covering films during their service life. Polym. Test. 2018, 66, 146–154. [Google Scholar] [CrossRef]
  21. Alsadon, A.; Al-Helal, I.; Ibrahim, A.; Abdel-Ghany, A.; Al-Zaharani, S.; Ashour, T. The effects of plastic greenhouse covering on cucumber (Cucumis sativus L.) growth. Ecol. Eng. 2016, 87, 305–312. [Google Scholar] [CrossRef]
  22. Bournet, P.-E.; Boulard, T. Effect of ventilator configuration on the distributed climate of greenhouses: A review of experimental and CFD studies. Comput. Electron. Agric. 2010, 74, 195–217. [Google Scholar] [CrossRef]
  23. Cemek, B.; Atiş, A.; Küçüktopçu, E. Evaluation of temperature distribution in different greenhouse models using computational fluid dynamics (CFD). Anadolu J. Agric. Sci. 2017, 32, 54. [Google Scholar] [CrossRef] [Green Version]
  24. Ghoulem, M.; El Moueddeb, K.; Nehdi, E.; Boukhanouf, R.; Calautit, J.K. Greenhouse design and cooling technologies for sustainable food cultivation in hot climates: Review of current practice and future status. Biosyst. Eng. 2019, 183, 121–150. [Google Scholar] [CrossRef]
  25. Teitel, M.; Montero, J.; Baeza, E. Greenhouse Design: Concepts and Trends. Acta Hortic. 2012, 952, 605–620. [Google Scholar] [CrossRef]
  26. Akrami, M.; Javadi, A.A.; Hassanein, M.J.; Farmani, R.; Dibaj, M.; Tabor, G.R.; Negm, A. Study of the Effects of Vent Configuration on Mono-Span Greenhouse Ventilation Using Computational Fluid Dynamics. Sustainability 2020, 12, 986. [Google Scholar] [CrossRef] [Green Version]
  27. Benni, S.; Santolini, E.; Barbaresi, A.; Torreggiani, D.; Tassinari, P. Calibration and comparison of different CFD approaches for airflow analysis in a glass greenhouse. J. Agric. Eng. 2017, 48, 49–52. [Google Scholar] [CrossRef] [Green Version]
  28. Kim, R.-W.; Kim, J.-G.; Lee, I.-B.; Yeo, U.-H.; Lee, S.-Y.; Decano-Valentin, C. Development of three-dimensional visualisation technology of the aerodynamic environment in a greenhouse using CFD and VR technology, part 1: Development of VR a database using CFD. Biosyst. Eng. 2021, 207, 33–58. [Google Scholar] [CrossRef]
  29. Villagrán, E.A.; Bojacá, C.R. Effects of surrounding objects on the thermal performance of passively ventilated greenhouses. J. Agric. Eng. 2019, 50, 20–27. [Google Scholar] [CrossRef]
  30. Tong, G.; Christopher, D.M.; Zhang, G. New insights on span selection for Chinese solar greenhouses using CFD analyses. Comput. Electron. Agric. 2018, 149, 3–15. [Google Scholar] [CrossRef]
  31. Molina-Aiz, F.; Valera, D. Configuration by evaluating ventilation efficiency based on computational fluid dynamics. Acta Hortic. 2011, 893, 669–677. [Google Scholar] [CrossRef]
  32. He, K.; Chen, D.; Sun, L.; Huang, Z.; Liu, Z. Effects of Vent Configuration and Span Number on Greenhouse Microclimate under Summer Conditions in Eastern China. Int. J. Vent. 2015, 13, 381–396. [Google Scholar] [CrossRef]
  33. Kacira, M.; Sase, S.; Okushima, L. Effects of Side Vents and Span Numbers on Wind-Induced Natural Ventilation of a Gothic Multi-Span Greenhouse. Jpn. Agric. Res. Q. JARQ 2004, 38, 227–233. [Google Scholar] [CrossRef] [Green Version]
  34. Boulard, T.; Fatnassi, H. Greenhouse Aeration and Climate Optimization Based on CFD Studiess. Plasticulture 2005, 124, 38. [Google Scholar]
  35. Fatnassi, H.; Boulard, T.; Benamara, H.; Roy, J.; Suay, R.; Poncet, C. Increasing the height and multiplying the number of spans of greenhouse: How far can we go? Acta Hortic. 2017, 1170, 137–144. [Google Scholar] [CrossRef]
  36. Xu, F.-Y.; Lu, H.-F.; Chen, Z.; Guan, Z.-C.; Chen, Y.-W.; Shen, G.-W.; Jiang, Z. Selection of a computational fluid dynamics (CFD) model and its application to greenhouse pad-fan cooling (PFC) systems. J. Clean. Prod. 2021, 302, 127013. [Google Scholar] [CrossRef]
  37. Villagran, E.; Henao-Rojas, J.; Franco, G. Thermo-Environmental Performance of Four Different Shapes of Solar Greenhouse Dryer with Free Convection Operating Principle and No Load on Product. Fluids 2021, 6, 183. [Google Scholar] [CrossRef]
  38. Akrami, M.; Salah, A.H.; Javadi, A.A.; Fath, H.E.; Hassanein, M.J.; Farmani, R.; Dibaj, M.; Negm, A. Towards a Sustainable Greenhouse: Review of Trends and Emerging Practices in Analysing Greenhouse Ventilation Requirements to Sustain Maximum Agricultural Yield. Sustainability 2020, 12, 2794. [Google Scholar] [CrossRef] [Green Version]
  39. Villagran, E. Implementation of ventilation towers in a greenhouse established in low altitude tropical climate conditions: Numerical approach to the behavior of the natural ventilation. Rev. Ceres 2021, 68, 10–22. [Google Scholar] [CrossRef]
  40. Tominaga, Y.; Mochida, A.; Yoshie, R.; Kataoka, H.; Nozu, T.; Yoshikawa, M.; Shirasawa, T. AIJ guidelines for practical applications of CFD to pedestrian wind environment around buildings. J. Wind. Eng. Ind. Aerodyn. 2008, 96, 1749–1761. [Google Scholar] [CrossRef]
  41. Villagran, E.; Ramirez, R.; Rodriguez, A.; Pacheco, R.; Jaramillo, J. Simulation of the Thermal and Aerodynamic Behavior of an Established Screenhouse under Warm Tropical Climate Conditions: A Numerical Approach. Int. J. Sustain. Dev. Plan. 2020, 15, 487–499. [Google Scholar] [CrossRef]
  42. Villagran, E.A.; Noreña, J.E.J. Microclimatic behavior of a screen house proposed for horticultural production in low-altitude tropical climate conditions. Comun. Sci. 2020, 11, e3350. [Google Scholar] [CrossRef]
  43. Munar, E.A.V.; Aldana, C.R.B. Numerical evaluation of passive strategies for nocturnal climate optimization in a greenhouse designed for rose production (Rosa spp.). Ornam. Hortic. 2019, 25, 351–364. [Google Scholar] [CrossRef] [Green Version]
  44. Chu, C.-R.; Lan, T.-W.; Tasi, R.-K.; Wu, T.-R.; Yang, C.-K. Wind-driven natural ventilation of greenhouses with vegetation. Biosyst. Eng. 2017, 164, 221–234. [Google Scholar] [CrossRef]
  45. Senhaji, A.; Mouqallid, M.; Majdoubi, H. CFD Assisted Study of Multi-Chapels Greenhouse Vents Openings Effect on Inside Airflow Circulation and Microclimate Patterns. Open J. Fluid Dyn. 2019, 9, 119–139. [Google Scholar] [CrossRef] [Green Version]
  46. Baxevanou, C.; Fidaros, D.; Bartzanas, T.; Kittas, C. Yearly numerical evaluation of greenhouse cover materials. Comput. Electron. Agric. 2018, 149, 54–70. [Google Scholar] [CrossRef]
  47. Rasheed, A.; Lee, J.W.; Kim, H.T.; Lee, H.W. Efficiency of Different Roof Vent Designs on Natural Ventilation of Single-Span Plastic Greenhouse. Prot. Hortic. Plant Fact. 2019, 28, 225–233. [Google Scholar] [CrossRef]
  48. Aguilar-Rodríguez, C.E.; Flores-Velázquez, J.; Rojano, F.; Flores-Magdaleno, H.; Panta, E.R. Simulation of Water Vapor and Near Infrared Radiation to Predict Vapor Pressure Deficit in a Greenhouse Using CFD. Processes 2021, 9, 1587. [Google Scholar] [CrossRef]
  49. Rocha, G.A.O.; Pichimata, M.A.; Villagran, E. Research on the Microclimate of Protected Agriculture Structures Using Numerical Simulation Tools: A Technical and Bibliometric Analysis as a Contribution to the Sustainability of Under-Cover Cropping in Tropical and Subtropical Countries. Sustainability 2021, 13, 10433. [Google Scholar] [CrossRef]
  50. Montaño-Rodríguez, S.; Villagrán-Munar, E.A.; Osorio-Fiaga, D.F.; Bojacá-Aldana, C.R.; Velásquez-Vargas, W.L. Numeric Simulation of Macrotunnel Greenhouse Thermic Behavior Used for Edible Mushrooms under Tropical Weather Conditions. Tecnol. Marcha J. 2020, 32, 78–85. [Google Scholar]
  51. Sun, X.; Yang, H.; Liu, Q.-F.; Liu, Y.-H. Event-triggered control for greenhouse temperature under natural ventilation based on computational fluid dynamics. Syst. Sci. Control. Eng. 2021, 9, 93–101. [Google Scholar] [CrossRef]
  52. Lenth, R.V. Response-Surface Methods inR, Usingrsm. J. Stat. Softw. 2009, 32, 1–17. [Google Scholar] [CrossRef] [Green Version]
  53. Kalita, K.; Shivakoti, I.; Ghadai, R.K. Optimizing process parameters for laser beam micro-marking using genetic algorithm and particle swarm optimization. Mater. Manuf. Process. 2017, 32, 1101–1108. [Google Scholar] [CrossRef]
  54. Kalita, K.; Dey, P.; Joshi, M.; Haldar, S. A Response Surface Modelling Approach for Multi-Objective Optimization of Com-posite Plates. Steel Compos. Struct. 2019, 32, 455–466. [Google Scholar] [CrossRef]
  55. R Core Team. R: A Language and Environment for Statistical Computing; R Foundation for Statistical Computing: Vienna, Austria, 2020. [Google Scholar]
  56. Baeza, E.J.; Pérez-Parra, J.J.; Montero, J.I.; Bailey, B.J.; López, J.C.; Gázquez, J.C. Analysis of the role of sidewall vents on buoyancy-driven natural ventilation in parral-type greenhouses with and without insect screens using computational fluid dynamics. Biosyst. Eng. 2009, 104, 86–96. [Google Scholar] [CrossRef]
  57. Villagrán, E.A.; Gil, R.; Acuña, J.F.; Bojacá, C.R. Optimization of Ventilation and Its Effect on the Microclimate of Acolombian Multispan Greenhouse. Agron. Colomb. 2012, 30, 282–288. [Google Scholar]
  58. Ma, D.; Carpenter, N.; Maki, H.; Rehman, T.U.; Tuinstra, M.R.; Jin, J. Greenhouse environment modeling and simulation for microclimate control. Comput. Electron. Agric. 2019, 162, 134–142. [Google Scholar] [CrossRef]
  59. Molina-Aiz, F.D.; Valera, D.L.; Álvarez, A.J. Measurement and simulation of climate inside Almería-type greenhouses using computational fluid dynamics. Agric. For. Meteorol. 2004, 125, 33–51. [Google Scholar] [CrossRef]
  60. López, A.; Valera, D.L.; Molina-Aiz, F. Sonic Anemometry to Measure Natural Ventilation in Greenhouses. Sensors 2011, 11, 9820–9838. [Google Scholar] [CrossRef] [PubMed]
  61. Kwon, J.-K.; Lee, S.-H.; Seong, J.-H.; Moon, J.-P.; Lee, S.-J.; Choi, B.-M.; Kim, K.-J. Analysis of Natural Ventilation Characteristics of Venlo-type Greenhouse with Continuous Roof Vents. J. Biosyst. Eng. 2011, 36, 444–452. [Google Scholar] [CrossRef] [Green Version]
  62. Reynafarje, X.; Villagrán, E.; Bojacá, C.; Gil, R.; Schrevens, E. Simulation and validation of the airflow inside a naturally ventilated greenhouse designed for tropical conditions. Acta Hortic. 2020, 55–62. [Google Scholar] [CrossRef]
  63. Villagrán-Munar, E.A.; Bojacá-Aldana, C.R.; Acuña-Caita, J.F. Diseño y Evaluación Climatica de Un Invernadero Para Condiciones de Clima Intertropical de Montaña; Universidad Nacional de Colombia: Bogota, Colombia, 2016; p. 138. [Google Scholar]
  64. Mesmoudi, K.; Meguellati, K.; Bournet, P.-E. Thermal analysis of greenhouses installed under semi arid climate. Int. J. Heat Technol. 2017, 35, 474–486. [Google Scholar] [CrossRef] [Green Version]
  65. McCartney, L.; Orsat, V.; Lefsrud, M.G. An experimental study of the cooling performance and airflow patterns in a model Natural Ventilation Augmented Cooling (NVAC) greenhouse. Biosyst. Eng. 2018, 174, 173–189. [Google Scholar] [CrossRef]
  66. ASAE. Heating, Ventilating and Cooling Greenhouses. ANSI/ASAE 2008, 3, 9. [Google Scholar] [CrossRef]
  67. Villagran, E. Two-Dimensional Numerical Study of the Microclimate Generated in Three Screenhouses for the Climatic Conditions of the Colombian Caribbean. Int. J. Heat Technol. 2021, 39, 460–468. [Google Scholar] [CrossRef]
  68. Espejel Trujano, D.; López Cruz, I.L. Determinación de Las Tasas de Ventilación Natural En Un Invernadero Mediante Modelos Teóricos y Gases Trazadores. Rev. Mex. Cienc. Agrícolas 2013, 4, 185–198. [Google Scholar] [CrossRef] [Green Version]
  69. Baeza, E.J.; Pérez-Parra, J.; Lopez, J.C.; Kacira, M.; Gázquez, J.C.; Montero, J.I. Validation of CFD Simulations for Three Dimensional Temperature Distributions of a Naturally Ventilated Multispan Greenhouse Obtained by Wind Tunnel Measurements. Acta Hortic. 2011, 893, 571–580. [Google Scholar] [CrossRef]
  70. Mimar, E.A.V.; Aldana, C.R.B. Microclimate i Simulation in a Greenhouse Used for Roses Production under Conditions of Intertropical Climate. Chil. J. Agric. Anim. Sci. 2019, 35, 137–150. [Google Scholar] [CrossRef]
  71. Kacira, M.; Sase, S.; Okushima, L. Optimization of vent configuration by evaluating greenhouse and plant canopy ventilation rates under wind-induced ventilation. Trans. ASAE 2004, 47, 2059–2067. [Google Scholar] [CrossRef]
  72. Bartzanas, T.; Boulard, T.; Kittas, C. Numerical simulation of the airflow and temperature distribution in a tunnel greenhouse equipped with insect-proof screen in the openings. Comput. Electron. Agric. 2002, 34, 207–221. [Google Scholar] [CrossRef]
  73. Molina-Aiz, F.; Fatnassi, H.; Boulard, T.; Roy, J.; Valera, D. Comparison of finite element and finite volume methods for simulation of natural ventilation in greenhouses. Comput. Electron. Agric. 2010, 72, 69–86. [Google Scholar] [CrossRef]
  74. He, K.; Chen, D.; Sun, L.; Huang, Z.; Liu, Z. Analysis of the Climate inside Multi-span Plastic Greenhouses under Different Shade Strategies and Wind Regimes. Korean J. Hortic. Sci. Technol. 2014, 32, 473–483. [Google Scholar] [CrossRef] [Green Version]
  75. Sase, S. Air movement and climate uniformity in ventilated greenhouses. Acta Hortic. 2006, 719, 313–324. [Google Scholar] [CrossRef]
  76. Baeza, E.; Montero, J.I.; Pérez-Parra, J.; Bailey, B.J.; López, J.C.; Vázquez, J.C. Avances En El Estudio de La Ventilación Natural; Cajamar Caja Rural: Almeria, España, 2012. [Google Scholar]
  77. Kittas, C.; Boulard, T.; Papadakis, G. Natural ventilation of a greenhouse with ridge and side openings: Sensitivity to temperature and wind effects. Trans. ASAE 1997, 40, 415–425. [Google Scholar] [CrossRef]
  78. Gil, R.; Bojacá, C.; Casilimas, H.; Schrevens, E.; Suay, R. Assessment of sidewall and roof vents opening configurations to improve airflow inside greenhouses. Acta Hortic. 2012, 952, 141–146. [Google Scholar] [CrossRef]
  79. Villagrán, E.A.; Gil, R.; Acuña, J.F.; Bojacá, C.R. Agronomía Colombiana; Universidad Nacional de Colombia, Facultad de Agronomía: Bogota, Colombia, 2012; Volume 30. [Google Scholar]
  80. Katsoulas, N.; Bartzanas, T.; Boulard, T.; Mermier, M.; Kittas, C. Effect of Vent Openings and Insect Screens on Greenhouse Ventilation. Biosyst. Eng. 2006, 93, 427–436. [Google Scholar] [CrossRef]
  81. Flores-Velázquez, J.; López-Cruz, I.L.; Mejía-Sáenz, E.; Montero, J.I. Evaluación Del Desempeño Climático de Un Inver-nadero Baticenital Del Centro de México Mediante Dinámica de Fluidos Computacional (CFD). Agrociencia 2014, 48, 131–146. [Google Scholar]
  82. Villagran, E.; Bojacá, C. Experimental evaluation of the thermal and hygrometric behavior of a Colombian greenhouse used for the production of roses (Rosa spp.). Ornam. Hortic. 2020, 26, 205–219. [Google Scholar] [CrossRef]
  83. Saberian, A.; Sajadiye, S.M. The effect of dynamic solar heat load on the greenhouse microclimate using CFD simulation. Renew. Energy 2019, 138, 722–737. [Google Scholar] [CrossRef]
  84. Park, M.J.; Choi, D.K.; Son, J.K.; Yoon, S.-W.; Kim, H.T.; Lee, S.-K.; Kang, D.H. Field Survey and Analysis of Natural Ventilation Characteristics of Multi-span Greenhouse with Different Roof Vent. Prot. Hortic. Plant Fact. 2020, 29, 36–42. [Google Scholar] [CrossRef]
  85. Villagran, E.; Bojacá, C. Analysis of the microclimatic behavior of a greenhouse used to produce carnation (Dianthus caryophyllus L.). Ornam. Hortic. 2020, 26, 190–204. [Google Scholar] [CrossRef]
  86. Zorzeto, T.Q.; Leal, P.A.M.; Nunes, E.F. Homogeneity of Temperature and Relative Humidity of Air in Greenhouse. Environment 2014, 1, 12. [Google Scholar]
  87. Bustamante, N.; Acuña, C.J.F.; Valera, D.L. Effect of the Height of the Greenhouse on the Plant-Climate Relationship as a Development Parameter in Mint (Mentha Spicata) Crops in Colombia. Ing. Investig. 2016, 36, 6–13. [Google Scholar] [CrossRef] [Green Version]
Figure 1. Geometric diagram of the cross section of the greenhouse studied.
Sustainability 13 13631 g001
Figure 2. Overall dimensions of the computational domain.
Sustainability 13 13631 g002
Figure 3. Detail of the cross-sectional grid of the greenhouse evaluated.
Sustainability 13 13631 g003
Figure 4. Air distribution patterns simulated with ventilation configuration S and for the six greenhouse models (M1 to M6) under wind speeds S1 (0.2 ms−1) and S4 (1.6 ms−1).
Sustainability 13 13631 g004
Figure 5. Spatial distribution of air velocity inside the greenhouse for the simulated scenarios under the S configuration.
Sustainability 13 13631 g005
Figure 6. Simulated air distribution patterns with ventilation configuration R and for the six greenhouse models (M1 to M6) under wind speeds S1 (0.2 ms−1) and S4 (1.6 ms−1).
Sustainability 13 13631 g006
Figure 7. Spatial distribution of air velocity inside the greenhouse for the simulated scenarios under the R configuration.
Sustainability 13 13631 g007
Figure 8. Simulated air distribution patterns with the RS ventilation configuration and for the six greenhouse models (M1 to M6) under wind speeds S1 (0.2 ms−1) and S4 (1.6 ms−1).
Sustainability 13 13631 g008
Figure 9. Spatial distribution of air velocity inside the greenhouse for the simulated scenarios under the RS configuration.
Sustainability 13 13631 g009
Figure 10. Calculated values of the simulated renewal indexes for each of the scenarios considered.
Sustainability 13 13631 g010
Figure 11. Simulated thermal distribution patterns with ventilation configuration S and for the six greenhouse models (M1 to M6) under wind speeds S1 (0.2 ms−1) and S4 (1.6 ms−1).
Sustainability 13 13631 g011
Figure 12. Spatial distribution of air temperature inside the greenhouse for the simulated scenarios under the S configuration.
Sustainability 13 13631 g012
Figure 13. Simulated thermal distribution patterns with ventilation configuration R and for the six greenhouse models (M1 to M6) under wind speeds S1 (0.2 ms−1) and S4 (1.6 ms−1).
Sustainability 13 13631 g013
Figure 14. Spatial distribution of air temperature inside the greenhouse for the simulated scenarios under the R configuration.
Sustainability 13 13631 g014
Figure 15. Simulated thermal distribution patterns with the RS ventilation configuration and for the six greenhouse models (M1 to M6) under wind speeds S1 (0.2 ms−1) and S4 (1.6 ms−1).
Sustainability 13 13631 g015
Figure 16. Spatial distribution of air temperature inside the greenhouse for the scenarios simulated under the RS configuration.
Sustainability 13 13631 g016
Figure 17. Effect of greenhouse height and external wind speed on internal air velocity and temperature for the roof (a,b), sidewalls (c,d), and roof + sidewalls (e,f) ventilation scenarios.
Sustainability 13 13631 g017
Table 1. Physical and optical properties used in the CFD simulation.
PropertySoilAirPolyethylene
Density (ρ, kg m−3)13501.225923
Thermal conductivity (k, W m−1 K−1)1.30.02420.4
Specific heat (Cp, J K−1 kg−1)8001006.432300
Absorptivity0.900.190.06
Scattering coefficient−1500
Refractive index1.9211.53
Emissivity0.950.90.7
Table 2. Geometric details of the analyzed greenhouse models.
ModelH1 (m)SV (m)Scheme
Model 1 (M1)2.51.2 Sustainability 13 13631 i001
Model 2 (M1)3.01.7
Model 3 (M3)3.52.2
Model 4 (M4)4.02.7
Model 5 (M5)4.53.2
Model 6 (M6)5.03.7
Table 3. Coding of the 72 simulated scenarios.
Scenarios
S-M1S1S-M4S1R-M1S1R-M4S1RS-M1S1RS-M4S1
S-M1S2S-M4S2R-M1S2R-M4S2RS-M1S2RS-M4S2
S-M1S3S-M4S3R-M1S3R-M4S3RS-M1S3RS-M4S3
S-M1S4S-M4S4R-M1S4R-M4S4RS-M1S4RS-M4S4
S-M2S1S-M5S1R-M2S1R-M5S1RS-M2S1RS-M5S1
S-M2S2S-M5S2R-M2S2R-M5S2RS-M2S2RS-M5S2
S-M2S3S-M5S3R-M2S3R-M5S3RS-M2S3RS-M5S3
S-M2S4S-M5S4R-M2S4R-M5S4RS-M2S4RS-M5S4
S-M3S1S-M6S1R-M3S1R-M6S1RS-M3S1RS-M6S1
S-M3S2S-M6S2R-M3S2R-M6S2RS-M3S2RS-M6S2
S-M3S3S-M6S3R-M3S3R-M6S3RS-M3S3RS-M6S3
S-M3S4S-M6S4R-M3S4R-M6S4RS-M3S4RS-M6S4
Table 4. Response surface models and goodness of fit measures applied to the three ventilation scenarios and considering internal wind speed and temperature as dependent variables.
Scenario—Ventilation TypeModelAdjusted R-SquaredLack of Fit Test
Roof (R) I A V ~ H 1 + E W S + H 1 2 + E W S 2 + H 1 : E W S 0.6405F = 0.6145; p = 0.891
T ~ H 1 + E W S + H 2 + E W S 2 + H 1 : E W S 0.5663F = 1.0693; p = 0.378
Side (S) I A V ~ H 1 + E W S + H 1 2 + E W S 2 + H 1 : E W S 0.8908F = 0.5115; p = 0.954
T ~ H 1 + E W S + H 1 2 + E W S 2 + H 1 : E W S 0.5893F = 2.2616; p = 0.002
Roof + Side (RS) I A V ~ H 1 + E W S + H 1 2 + E W S 2 + H 1 : E W S 0.8986F = 0.6915; p = 0.822
T ~ H 1 + E W S + H 1 2 + E W S 2 + H 1 : E W S 0.5114F = 0.2596; p = 0.999
IAV: internal air velocity; T: temperature; H1: greenhouse height; EWS: external wind speed.
Publisher’s Note: MDPI stays neutral with regard to jurisdictional claims in published maps and institutional affiliations.

