Article

Rotating Microtab Implementation on a DU91W250 Airfoil Based on the Cell-Set Model

by
Alejandro Ballesteros-Coll
1,
Koldo Portal-Porras
1,
Unai Fernandez-Gamiz
1,*,
Ekaitz Zulueta
2 and
Jose Manuel Lopez-Guede
2
1
Department of Nuclear and Fluid Mechanics, University of the Basque Country (UPV/EHU), Nieves Cano 12, 01006 Vitoria-Gasteiz, Spain
2
Automatic Control and System Engineering Department, University of the Basque Country (UPV/EHU), Nieves Cano 12, 01006 Vitoria-Gasteiz, Spain
*
Author to whom correspondence should be addressed.
Sustainability 2021, 13(16), 9114; https://doi.org/10.3390/su13169114
Submission received: 15 June 2021 / Revised: 9 August 2021 / Accepted: 11 August 2021 / Published: 14 August 2021

Abstract

:
Flow control device modeling is an engaging research field for wind turbine optimization, since in recent years wind turbines have grown in proportions and weight. The purpose of the present work was to study the performance and effects generated by a rotating microtab (MT) implemented on the trailing edge of a DU91W250 airfoil through the novel cell-set (CS) model for the first time via CFD techniques. The CS method is based on the reutilization of an already calculated mesh for the addition of new geometries on it. To accomplish that objective, the required region is split from the main domain, and new boundaries are assigned to the mentioned construction. Three different MT lengths were considered: h = 1%, 1.5% and 2% of the airfoil chord length, as well as seven MT orientations (β): from 0° to −90° regarding the horizontal axis, for five angles of attack: 0°, 2°, 4°, 6° and 9°. The numerical results showed that the increases of the β rotating angle and the MT length (h) led to higher aerodynamic performance of the airfoil, CL/CD = 164.10 being the maximum ratio obtained. All the performance curves showed an asymptotic trend as the β angle reduced. Qualitatively, the model behaved as expected, proving the relationship between velocity and pressure. Taking into consideration resulting data, the cell-set method is appropriate for computational testing of trailing edge rotating microtab geometry.

1. Introduction

Wind energy has become a key source of electricity generation in the pursuit of a clean and sustainable energy model [1]. Improvement of wind turbines is currently required in order to compete in energy production and cost against traditional energies. With that objective, active and passive flow control devices have been introduced in wind turbine blades with the intention of enhancing or optimizing their performance. Aramendia-Iradi et al. [2] comprehensively reviewed the available active and passive flow control devices for wind turbine blades, while González-Salcedo et al. [3] only studied the passive flow control devices.
There are many experimental studies on wind turbines and their flow control devices. For example, Soto-Valle et al. [4] experimentally studied the effect of adding different shaped vortex generators (VGs) to an airfoil. With respect to microtabs, Bach et al. [5] studied the effect of active microtabs on a NACA0018 airfoil, Gerontakos and Lee [6] added an oscillating microtab to a NACA0015 airfoil, and Kamps et al. [7] added a passive flexible microtab to the trailing edge of a NACA0010 airfoil.
Nevertheless, numerical simulations by means of computational fluid dynamics (CFD) are becoming an increasingly used tool for the optimization of these devices. For that reason, some authors, such as Castellani et al. [8] and Astolfi et al. [9], combined both numerical and experimental results to analyze and improve the performance of wind turbines. Cooperman et al. [10] provided experimental and numerical data to fully characterize the dynamic effects of deploying microtabs for active load control of wind turbine blades. The potential and capabilities of MTs were firstly presented by Gruschwitz and Schrenk [11].
Regarding numerical simulations, numerous authors have successfully implemented both active and passive microtabs on diverse airfoils. For example, Liu et al. [12] analyzed different active microtab configurations on a NACA0012 airfoil. Concerning passive microtabs, Friedmann et al. [13] added different passive microtabs to a NACA0012 airfoil, showing a slight increase of the aerodynamic performance.
Other authors have combined microtabs with other passive flow control devices. Lee and Su [14] and Bofeng et al. [15] implemented a microtab with a Gurney flap on its lower surface and Dam et al. [16] combined a microflap with a microtab. This combination showed a significant improvement of the lift coefficient and lift-to-drag ratio. Additionally, Bofeng et al. [15] showed a reduction of the vortexes created on the trailing edge.
In all the above-mentioned studies, researchers used the fully resolved mesh model. To avoid the high computational cost of this meshing model, some authors have used alternative models, such as the jBAY model (see [17,18,19]), which requires a specific formulation for each scenario. The novel cell-set (CS) model implemented in this study does not need specific formulae and is a versatile and flexible solution when a large number of different scenarios have to be contemplated. Ibarra-Udaeta et al. [20] and Portal-Porras et al. [21] used the CS model to construct vortex generators and sub-boundary layer vortex generators, respectively. Ballesteros-Coll et al. [22] used the CS model to generate a Gurney flap on the trailing edge of a DU91W250 airfoil and implemented a microtab on the trailing edge of a DU91W(2)250 airfoil [23]. All of them demonstrated a good performance with this novel flow control device implementation model.
The aim of this study was to observe the effect of the implementation of rotating microtabs with different lengths on a DU91W250 airfoil, using the CS modeling technique. The main contribution of the current manuscript is divided into two points: Firstly, a large number of different scenarios of the DU91W250 airfoil with a rotating tab implemented on its trailing edge are exposed. These could be taken as a reference for rotating tab design or for blade profile design too. Secondly, the CS method is considered to be appropriate for computational testing of trailing edge rotating microtab geometry, since no specific formulae are required and the number of simulations to be run is high.
The remainder of the manuscript is divided as follows: Firstly, an introduction to the cell-set model is given. Then, the numerical setup and the simulated scenarios are defined. Hereafter, the obtained results are presented and explained. Finally, the main conclusions obtained from this study are provided.

2. Materials and Methods

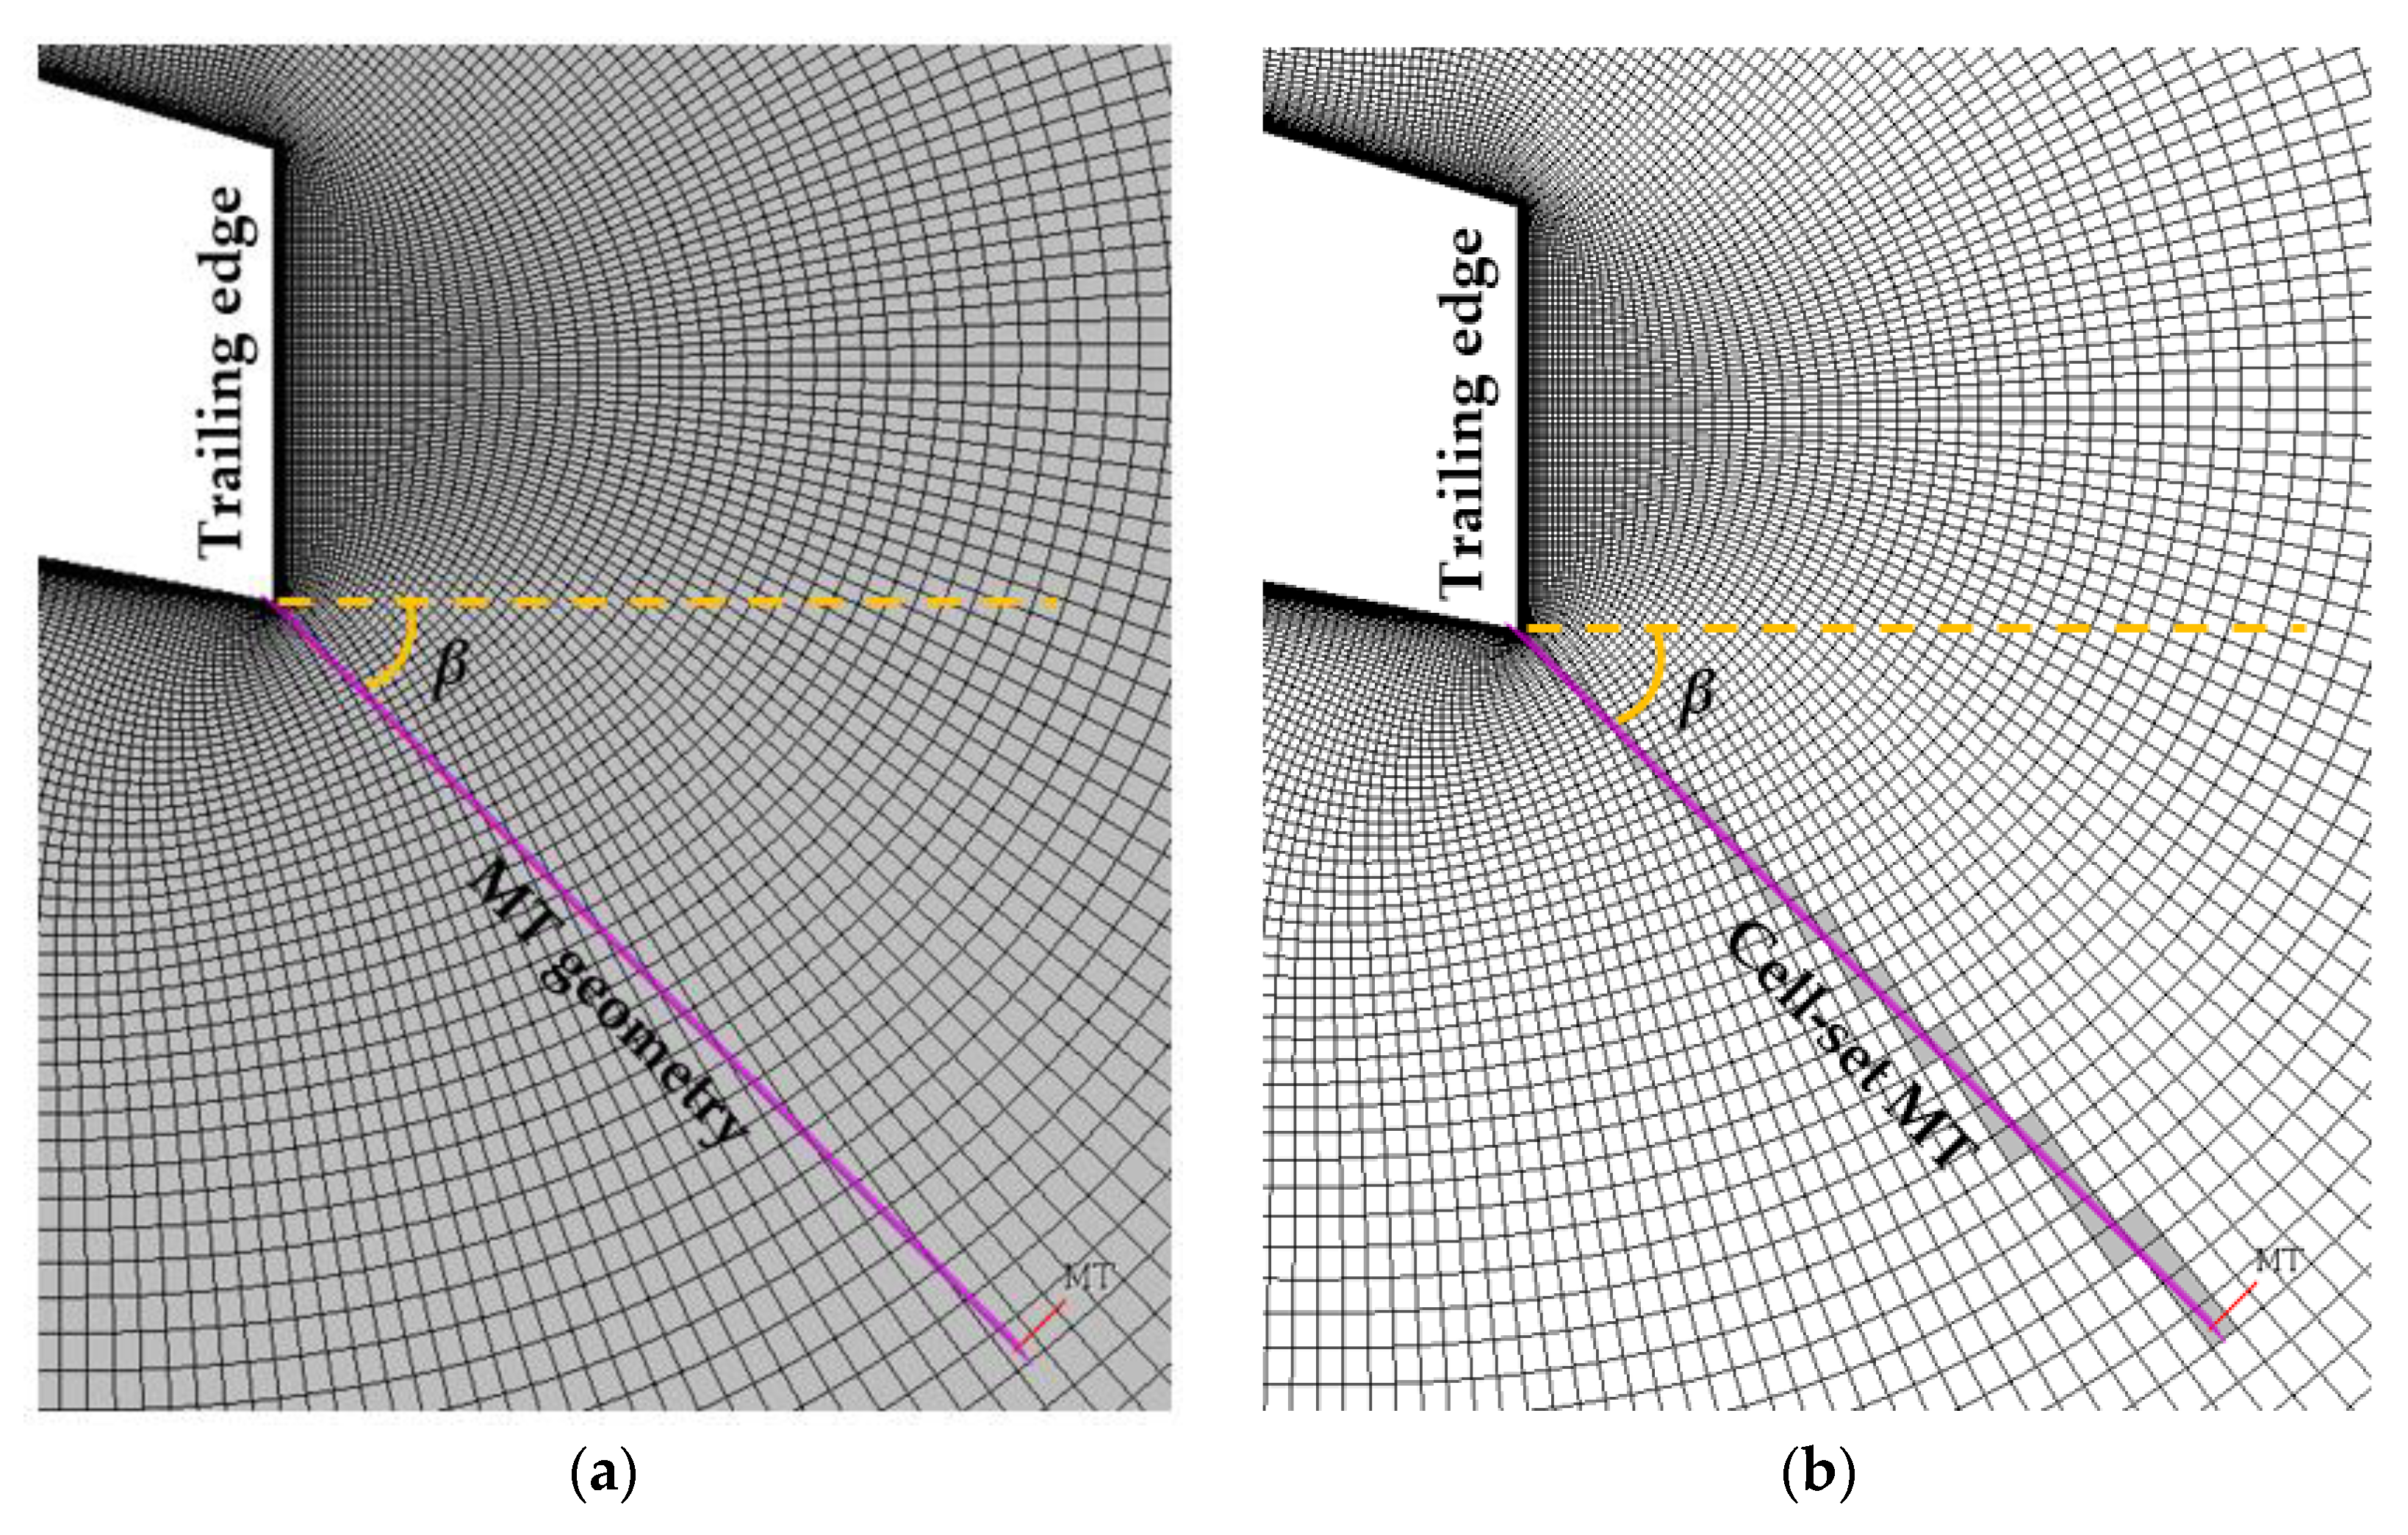
2.1. Introduction to the Cell-Set Model

A novel method for flow control device modeling is presented in this study: the cell-set (CS) model. The method was firstly introduced in Ballesteros-Coll et al. [22] where the CS model was validated against fully mesh data for the implementation and optimization of a Gurney flap (GF) on the DU91W250 and DU97W300 airfoils. A recent study carried out by Ballesteros-Coll et al. [23] illustrates the performance of the CS method for active MT implementation with variable length. The model reached a global relative error of e g   = 3.784% in comparison with the fully mesh model. In the present work, the CS model was applied for a rotative MT implementation.
The CS generation process is structured as follows (see Figure S1): Firstly, the required geometry has to be defined in the fluid region of the computational domain. Secondly, the structured elements, which are around the mentioned geometry, are selected by means of the ID of each cell. Thirdly, the fluid region is split into two different parts: the CS region, which has an approximated shape of the required geometry, and the remaining cells of the fluid region. Finally, a wall boundary condition is attributed to the CS region. Hence, the equations that are applied to the generated structure are the ones that are employed for the calculation of the whole computational domain.
Figure 1 illustrates the CS model implementation for the rotating MT on the trailing edge area of the DU91W250 aerodynamic profile. As the picture shows, the initial geometry of the MT is materialized onto a stepped pattern of cells. Particularly, Figure 1 shows the case of a rotating MT orientated at β = −45°, where β is the angle between the X horizontal axis and the MT.
The major benefit of using the CS model for flow control device modeling is its flexibility, as it permits direct modifications of the dimensions and location of the constructed cells without having to recalculate the mesh.

2.2. Numerical Setup

Computational fluid dynamics (CFD) tools were used to study the performance of the rotating CS MT on the DU91W250 airfoil, which is a profile extracted from a broadly referenced NREL horizontal axis wind turbine (HAWT), as Jonkman et al. state in their report [24]. All the numerical simulations were performed through Siemens STARCCM+ v14 CFD software [25].
All the scenarios were run in the same mesh, as the grid for different lengths and angles for the MT can be reused in the CS model. A two-dimensional O-mesh was employed for the airfoil meshing. The DU91W250 airfoil has a chord length of c = 1m, and thus, the radius of the mesh was set at R = 32 × c, in accordance with the work of Sørensen et al. [24]. The domain consists of 207,740 cells for the clean mesh, and the number of cells that have to be used for the CS implementation ranges between 99 and 126, depending on the MT length and orientation. In agreement with the studies by Thompson et al. [25] and Vinokur et al. [26], the chordwise and normal direction double sided stretching was executed by means of double sided tanh functions. The surface of the airfoil was set as a nonslip surface, and the first cell height was normalized with the airfoil chord length: Δ z / c = 1.35 × 10 6 . The grid of the mesh was designed to reach dimensionless distances on the airfoil wall (y+ < 1), and the maximum skewness angle was 23°. In work carried out by Fernandez-Gamiz et al. [27], a mesh dependency study of the present mesh was performed, obtaining a dependency below 4% for the calculation of lift and drag ratios. For the mesh resolution, the mesh parameters of the current study were selected based on the Richardson’s extrapolation; see Aramendia et al. [28].
Regarding the setup of the air physics, the equations that governed the computational domain were the Reynolds-averaged Navier–Stokes (RANS) equations. A Reynolds number of Re = 2 × 10 6 was introduced, and the simulations were performed fully turbulent. For this particular case, the shear stress transport (SST) developed by Menter [29] was established. A combination of k-ε and k-ω turbulences was accomplished with the SST method, where k-ε was used for the cells that distant from the wall and k-ω when the calculation had to be done close to the wall. Flow interaction among blades was not considered in this study.
The discretization of the mesh was carried out by means of a linear upwind second order design, and the pressure and velocity coupling was determined with the upwind algorithm.
A free stream velocity value of U = 30   m / s was used for all the numerical simulations. The air density value was set at ρ = 1.2041   kg / m 3 , and a dynamic viscosity value of μ = 1.85508   · 10 5 Pa·s was defined.
The aerodynamic performance of the airfoil was used to represent part of the numerical results obtained. This is also known as the lift-to-drag ratio of the aerodynamic profile, which establishes the relationship between the lift and drag ratios (CL and CD coefficients, calculated by Equations (1) and (2), respectively).
C L = L 1 2 ρ U 2 c
C D = D 1 2 ρ U 2 c
In addition, with the purpose of determining critical orientations of the tab, pressure distribution along the streamwise direction of the airfoil was calculated by means of the pressure coefficient; see Equation (3):
c p = p p 1 2 ρ U 2 = p p p 0 p
The parameters p and p refer to the static pressure at the point at which the pressure coefficient is being calculated and to the freestream static pressure, respectively. Equally important is the parameter p 0 , which is associated with the stagnation pressure in the freestream.

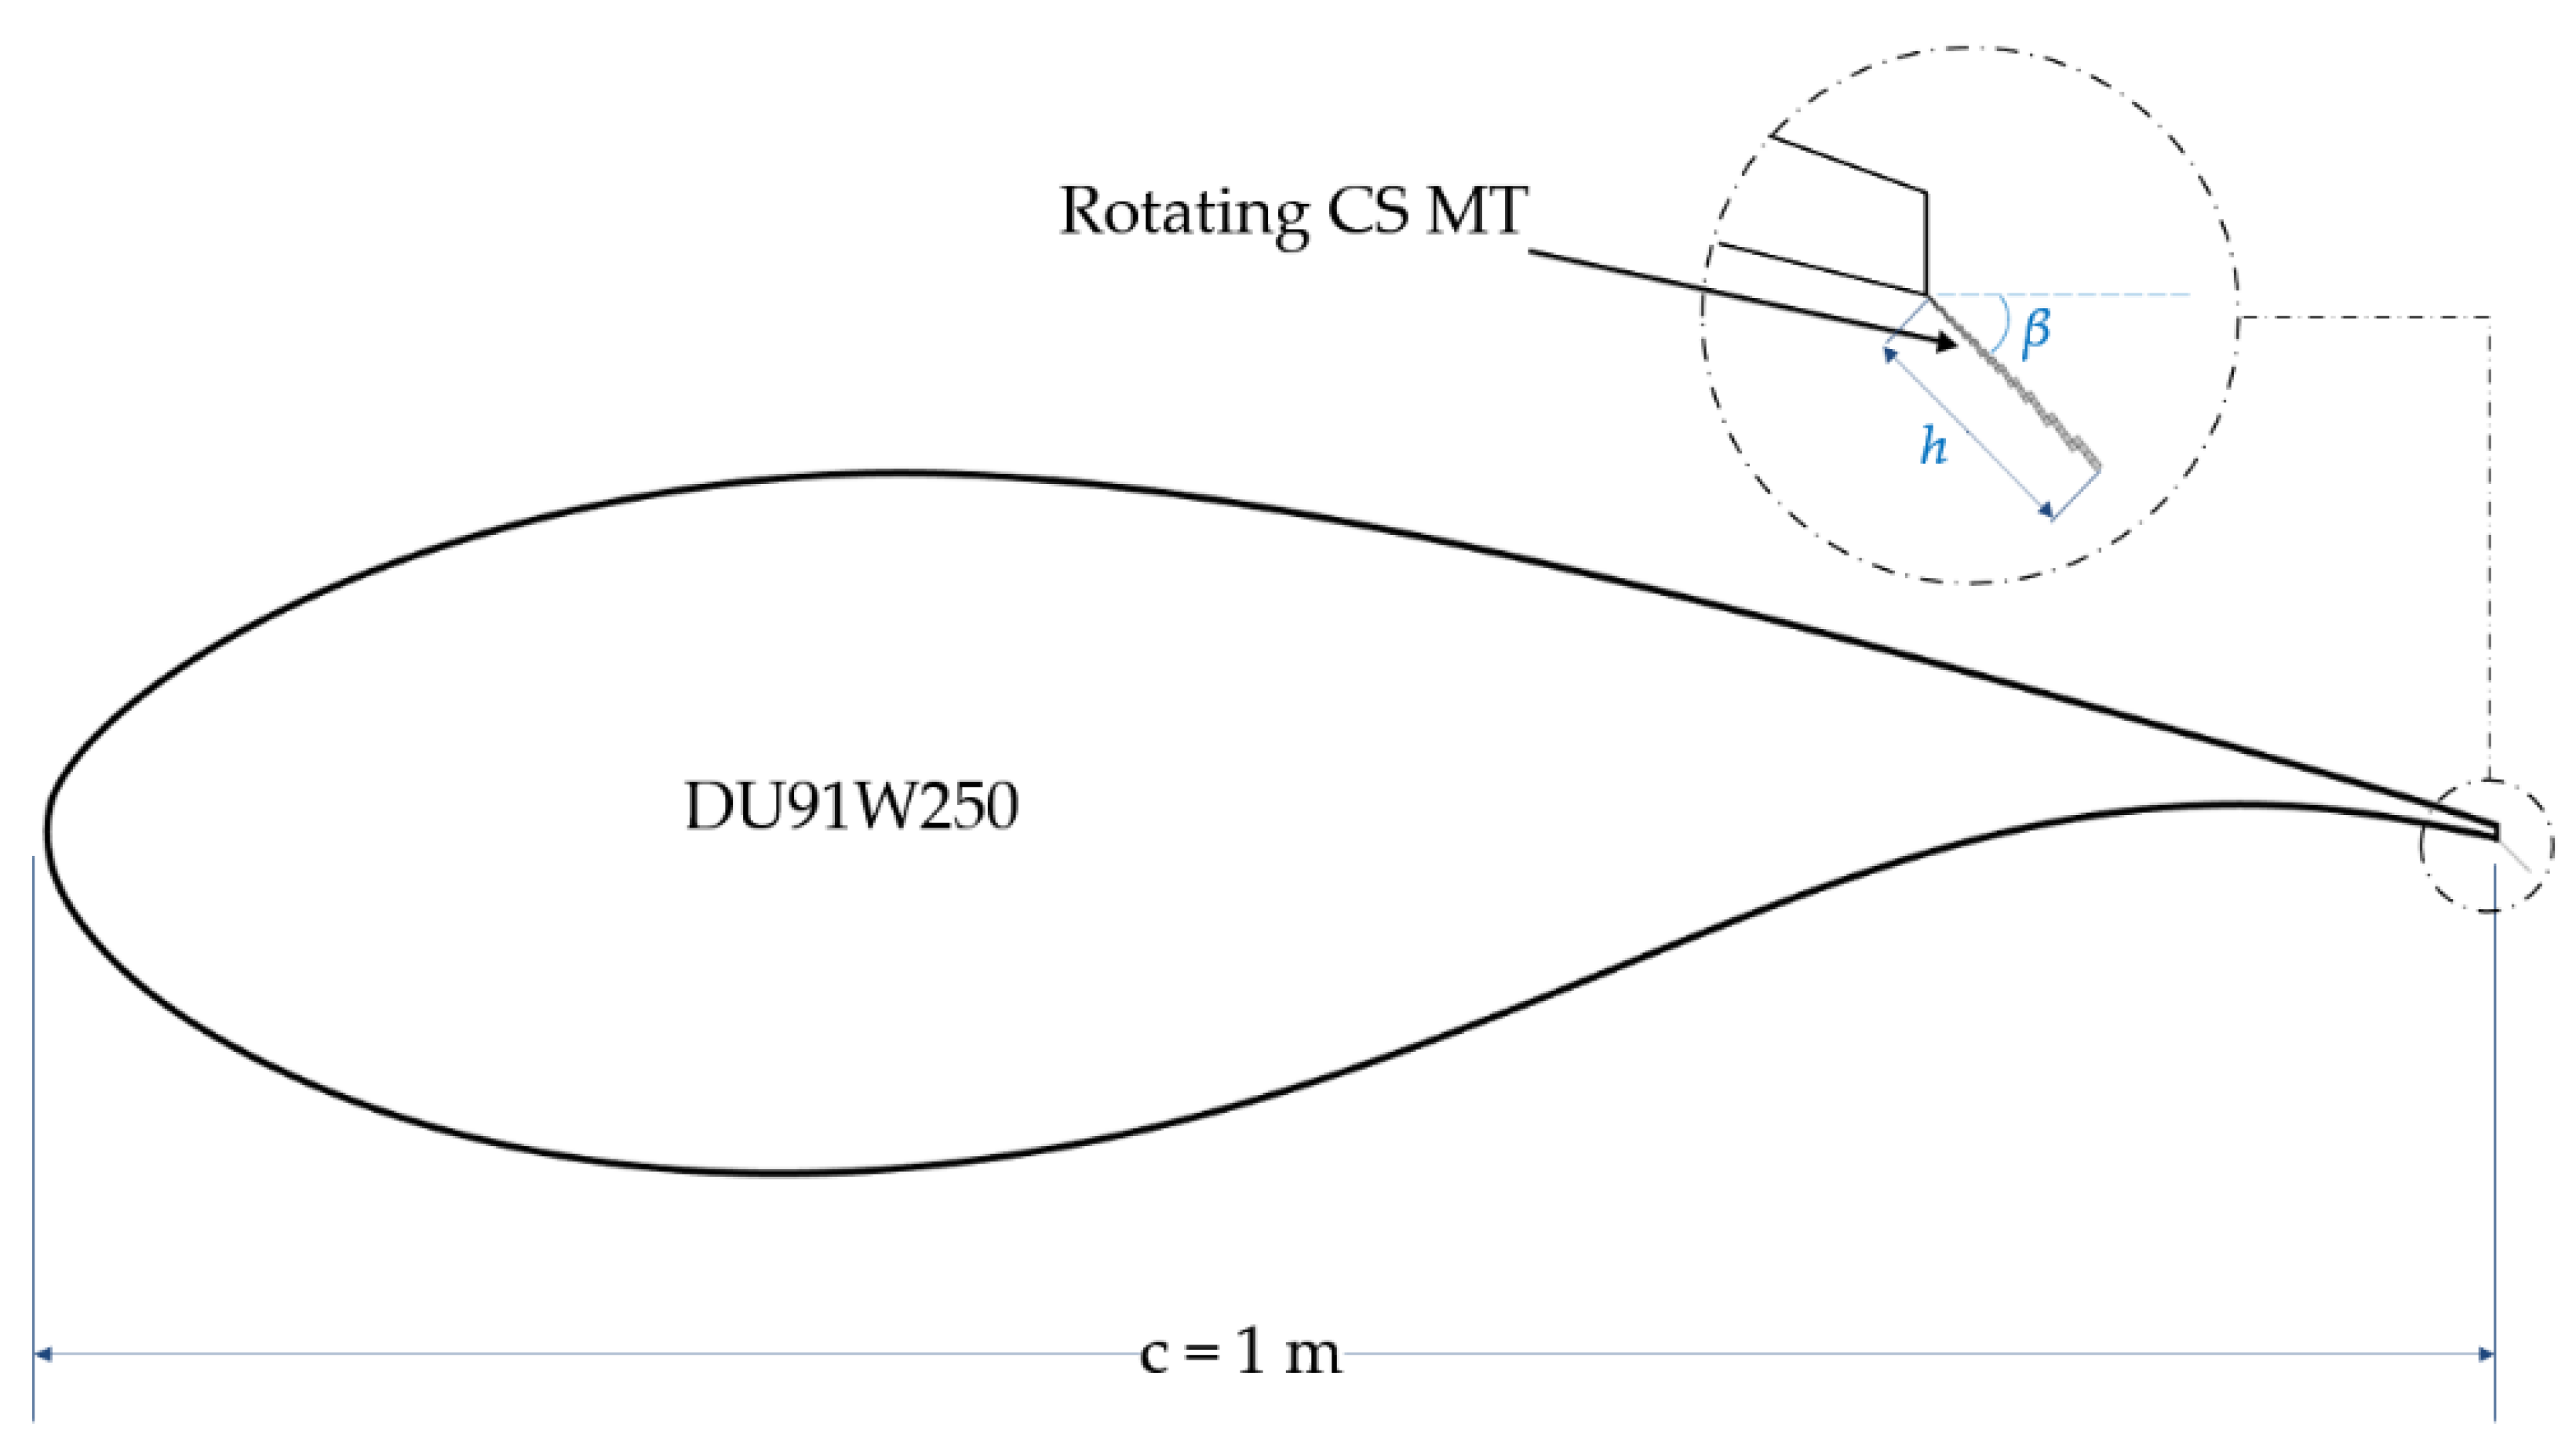
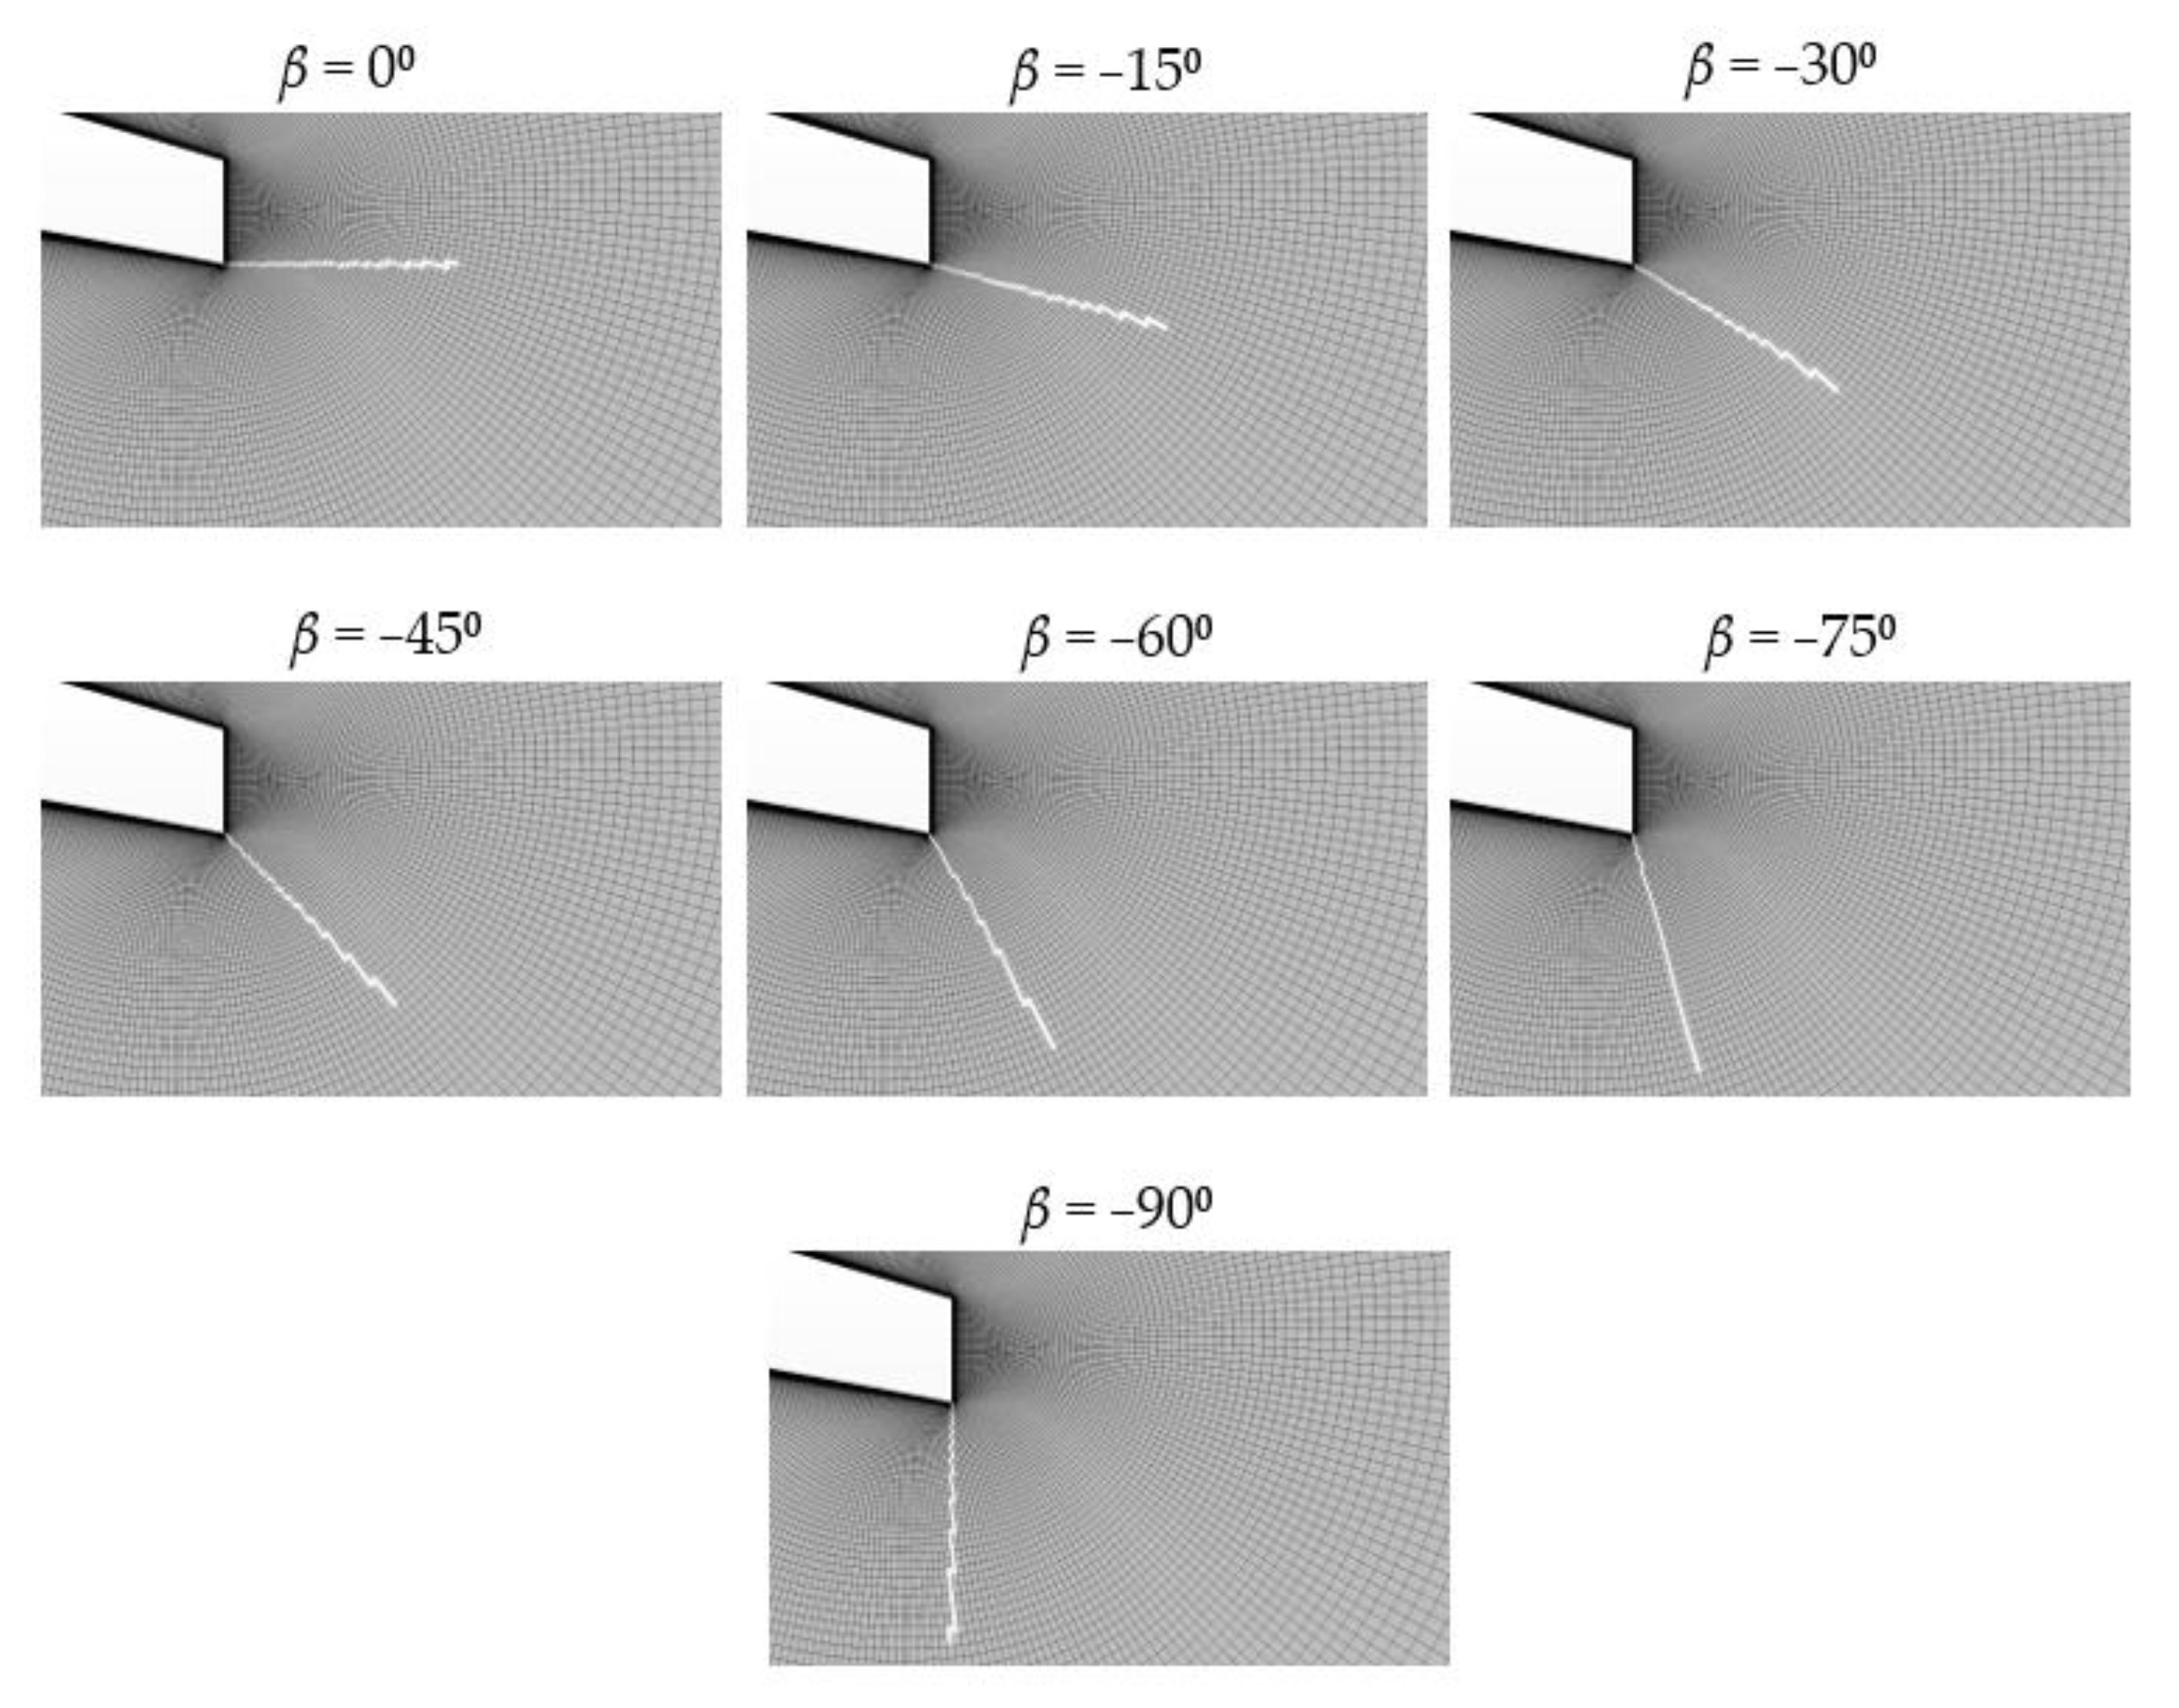
2.3. Rotating MT Configurations

The numerical simulations were performed with different MT lengths (h) and angles (β), resulting in a total of 110 scenarios, 5 of which are for the clean airfoil without flow control devices, and the remaining 105 scenarios are for the cases with a CS MT implemented; see Table A1. As the sketch of Figure 2 illustrates, the rotating tabs are located in the lower edge of the trailing edge of the airfoil. β represents the angle between the X horizontal axis and the MT, while h is the length of the MT, which is defined with a percentage of the airfoil chord length (c).
The β angle varied from β = 0° (aligned with the X axis) to β = −90° (aligned with the Y axis) with a step of 15° between β angles, making a total of 7 orientations for the table. Additionally, the MT length parameter (h) acquired the values of 1%, 1.5% and 2% of c. Each β and h configuration was simulated at 5 different angles of attack (AoAs): 0°, 2°, 4°, 6° and 9°. Figure 3 depicts the way the CS model is constructed around the desired geometry for all the values of β with a length set at h = 1% of c. Note that CS MT, which is orientated at β = −75°, has almost no stepped pattern as the MT geometry fits in the mesh design.

3. Results

This section is divided into three different subsections: Firstly, the aerodynamic performance for all the cases is outlined, wherein the influence of the angle of attack and the length and orientation of the CS MT are taken into consideration. Secondly, a qualitative analysis of the velocity field is detailed. Thirdly, the pressure distribution along the DU91W250 airfoil is explained for different orientations of the tab.

3.1. Aerodynamic Performance

The influence of the CS MT implementation is represented by means of the lift-to-drag ratio of the airfoil. Figure 4 shows nine curves per plot: The clean performance curve is represented with blue lines and asterisk markers, while the experimental curve is black with asterisk markers. This experimental curve was extracted from the wind tunnel data obtained by Timmer [30] for the DU91W250 airfoil. The clean curve refers to the numerically simulated DU91W250 profile scenario without flow control devices. The remaining seven curves with square markers refer to the different orientations of the MT (variation of the β angle), which is implemented by means of the CS method. There are three plots, one for each MT length (h). X horizontal axes of the plots denote the angle of attack (AoA) in degrees, and the Y vertical axes concern the aerodynamic performance values, which are dimensionless.
The plots of Figure 4 clearly represent the behavior of the airfoil when the CS MT rotates. Clean and β = 0° curves show similar performance values for the three length cases (configurations: 1.X, 2.X, 9.X and 16.X from Table A1). This could be caused as a result of a counteraction generated by the stepped pattern of cells constructed at β = 0°.
It can be seen that, as the value of β increases (from 0° to −90°), the performance curves are notably enhanced. This effect is increased in larger MT lengths. Nevertheless, from β = −60° to β = 90° the curves start to stabilize, reaching similar values in the β = 75° and β = −90° cases.
In the same way, the effect of the AoA produces similar performance curves for the three MT lengths, where the maximum CL/CD values are reached at 6° of AoA with the MT orientated at β = 90° for the three MT lengths, the one with h = 2% of c being the configuration that reached the highest aerodynamic performance.
Another perspective of the matter is illustrated in Figure 5. There are four curves per plot: The clean value is constant for each plot as the change of the β angle does not affect the profile without flow control devices. Its values are represented with a straight and continuous black line. The purple curve with square markers refers to the values obtained with the MT length h = 2% of c, and the yellow and orange curves with square markers are related to the h = 1.5% of c and h = 1% of c, respectively. There is one plot per AoA.
From this perspective, the X axis represents the rotation of the MT, while the Y axis remains, showing the aerodynamic performance of the DU91W250 airfoil.
The effect of the MT rotation behaves in similar ways for the whole range of AoA studied. Despite the β = 0° cases, for all the other configurations, the performance curves are over the clean performance values, h = 2% of c being the case that reaches the highest CL/CD values, followed by the h = 1.5% case, which produces intermediate performance values between the h = 1% and h = 2% cases, and eventually the h = 1% configuration that reaches the lowest values for every AoA studied. The maximum CL/CD ratio was reached with the rotating tab orientated at β = −90°. The AoA = 6° and β = −90° case (see Figure 5d) was the one that achieved the highest ratio value of CL/CD = 164.10 (case 22.6 of Table A1).
On the other hand, it can be clearly interpreted that as the tab goes from a vertical orientation (β = −90°) to a horizontal orientation (β = 0°), the curves show an asymptotic tendency of the performance values that approach the ratios of the clean profile.

3.2. Velocity Field Analysis

This section exposes a qualitative analysis of the velocity field around the trailing edge area of the DU91W250 airfoil when a rotating MT based on the CS model is implemented. This is an interesting method to understand the effects generated by the rotation of the MT and to notice the evolution of the velocity field. As mentioned before, the configuration of MT with an orientation β = −90° and h = 2% of c reached the highest aerodynamic performance values when the AoA value was set at 6°. Therefore, Figure 6 shows a progression of images where a line integral convolution of the velocity vector field is represented for a fixed value of AoA = 6°. A different β value is dedicated to each picture with the purpose of describing the rotation of the MT. All the images show a h = 2% of c MT length.
The images represented in Figure 6 illustrate that the wake varies considerably when the tab rotates, covering a smaller area of low velocities when the tab is orientated at β = 0° and gradually increasing that low velocity area as the β angle approximates to −90° (Table A1 cases: 16.6 and 22.6, respectively). The evidence suggests that conceptually, the MT orientated at β = −90° should work as a Gurney flap (GF); see Aramendia et al. [30]. Furthermore, when the MT reaches β = −90°, two counter rotating vortexes are generated on the rear part of the trailing edge, which is one of the most characteristic effects generated by a GF.
In addition, for the orientation range of β = −45° to β = −90° a low velocity area is generated in the inner part, in front of the CS MT and near the pressure side of the airfoil. This area grows as the tab approaches a vertical orientation.

3.3. Pressure Distributions

In regard to the effects generated by the rotation of the CS MT on the velocity field around the trailing edge area, the pressure distribution of the whole DU91W250 aerodynamic profile was studied, as there is a direct relationship between the velocity and the pressure of the air. Figure 7 is composed of two plots, where the subplot located in the right part is a detailed view of the trailing edge area of the airfoil.
The plots consist of eight curves where the continuous black curve represents the shape of the DU91W250 airfoil and the remaining seven curves with round markers show the pressure coefficient values along the profile for different β angles of CS MT. The c p dimensionless values were extracted from the same case studied in the previous subsection of velocities. The horizontal axis refers to the direction of the X axis of the airfoil, starting at the leading edge of the profile with 0 m.
Two main effects on the pressure distribution were noticed: On the one hand, concerning the subplot of Figure 7 and the results obtained in the previous subsection, the variation of the velocity field for different β angles is now reflected in a gradual change of a pressure gap in the trailing edge. This alteration is caused by the implementation of the CS MT, and it is a phenomenon that commonly appears when an MT or a GF is implemented [28,31,32]. When β = 0°, the pressure gap is non-existent (case 16.6 from Table A1). However, once the β angle starts to increase, the gap of c p is amplified to the point where at β = −90° it reaches its maximum. The greatest change in pressure is given when the tab passes from being at β = 0° to β = −15° (Table A1: from case 16.6 to 17.6).
On the other hand, it was observed that the rotation of the CS MT does not only affect the pressures near the trailing edge area but also the pressure coefficients of the whole airfoil. Lower β values produce a smaller pressure change between the suction and pressure sides of the DU91W250 airfoil. On the contrary, the more vertical the tab orientation, the higher the pressure difference among the pressure and suction sides of the airfoil.
Thus, the CS model is a versatile and adjustable solution to set and calculate a wide variety of scenes when a rotating MT has to be implemented.

4. Conclusions

The current study was focused on the application of the novel cell-set method for the implementation of a rotating microtab on the trailing edge of a DU91W250 aerodynamic profile. This is the first application of the CS model for rotating tab implementation. The work was performed through two-dimensional numerical simulations with CFD code. The obtained conclusions are as follows:
  • The cell-set model is a very flexible and adaptive method to model flow control devices such as microtabs, flaps, vortex generators or Gurney flaps. Basically, the procedure to implement the cell-set model consists of building a set of cells taking the desired geometry as a reference and generating a new region, which is split from the main fluid domain. This model permits the user to conduct straightforward modifications to the geometries to be meshed without having to re-mesh the computational domain. Subsequently, mesh calculation times are saved by using this method.
    Furthermore, the cell-set method is considered to be appropriate for computational testing of trailing edge rotating microtab geometry, as the dimensions and location can be changed freely.
  • As may seem obvious, all the results that are obtained with the cell-set model involve a relative error compared with the results of a fully mesh model for the same geometry, since for most cases, the created shape of cells is a stepped pattern. Considering that the transversal section of a microtab is simple compared with other flow control devices, the cell-set model is a suitable solution for microtab modeling in two-dimensional simulations.
  • In terms of aerodynamic performance of the DU91W250 airfoil with a rotating microtab implemented on it, the following conclusions were deduced:
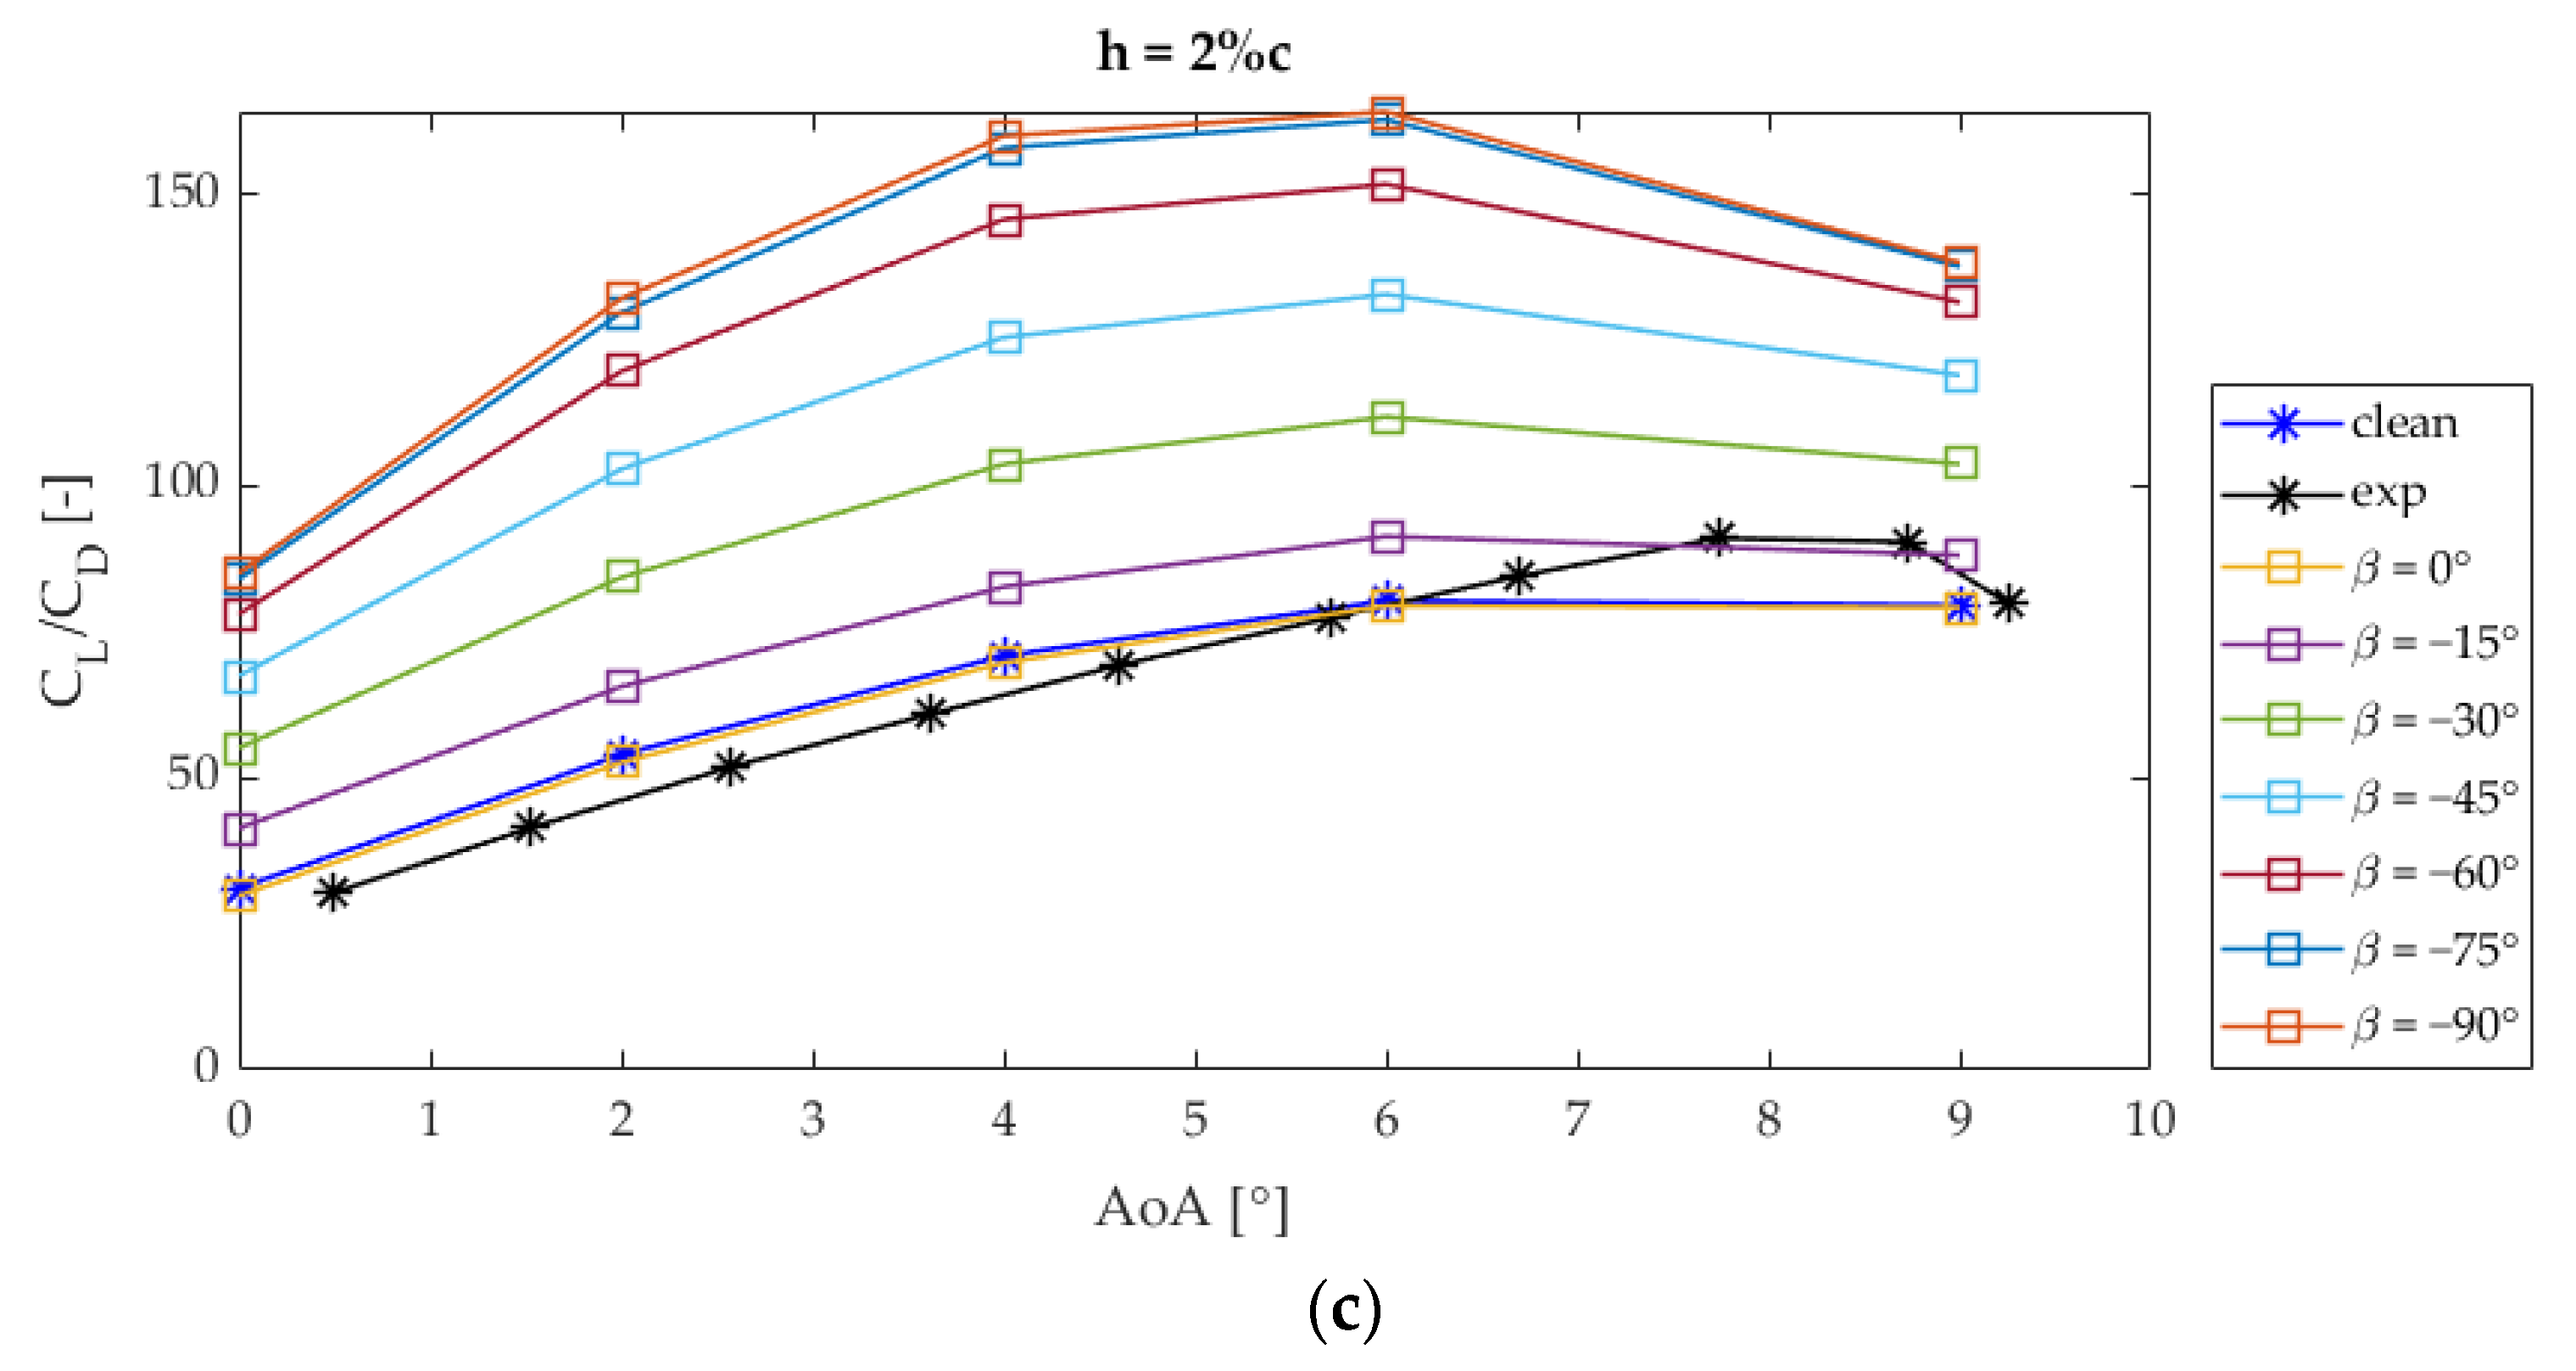
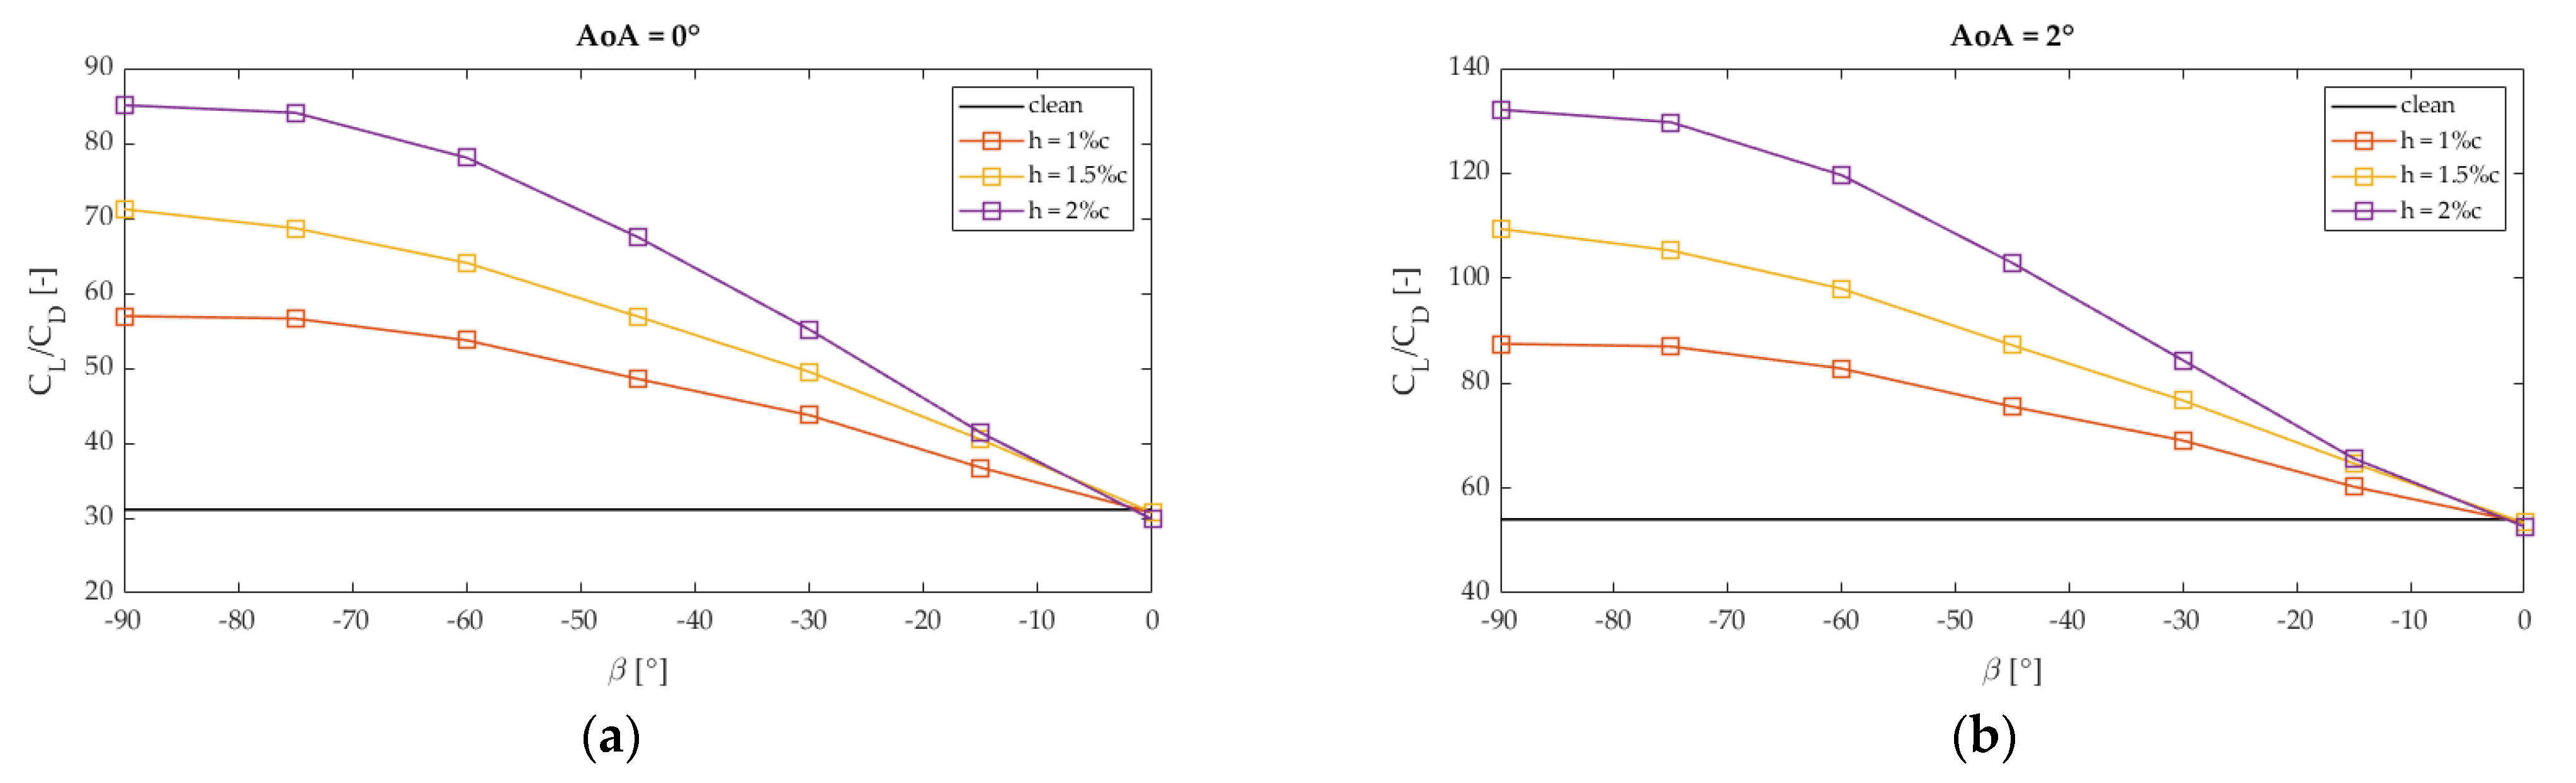
    All the studied microtab lengths generate similar performance curve shapes when the angle of attack is changed and when the tab rotates.
    Clean and β = 0° aerodynamic performance curves show similar values for the studied microtab lengths.
    An increase of the rotating angle β produces an enhancement of the CL/CD ratios, and this effect is more noticeable for larger microtab lengths than for the shorter ones. It was observed that from β = −60° to β = −90°, the curves start to stabilize, reaching very similar performance ratios.
    All the configurations except the β = 0° cases produce higher CL/CD ratios than the clean DU91W250 profile. A maximum performance ratio of CL/CD = 164.10 was reached with the β = −90° and h = 2% microtab configuration, at 6° of angle of attack.
    All the performance curves illustrated an asymptotic trend to the clean horizontal lines when the microtab went from a vertical (β = −90°) to a horizontal (β = 0°) orientation.
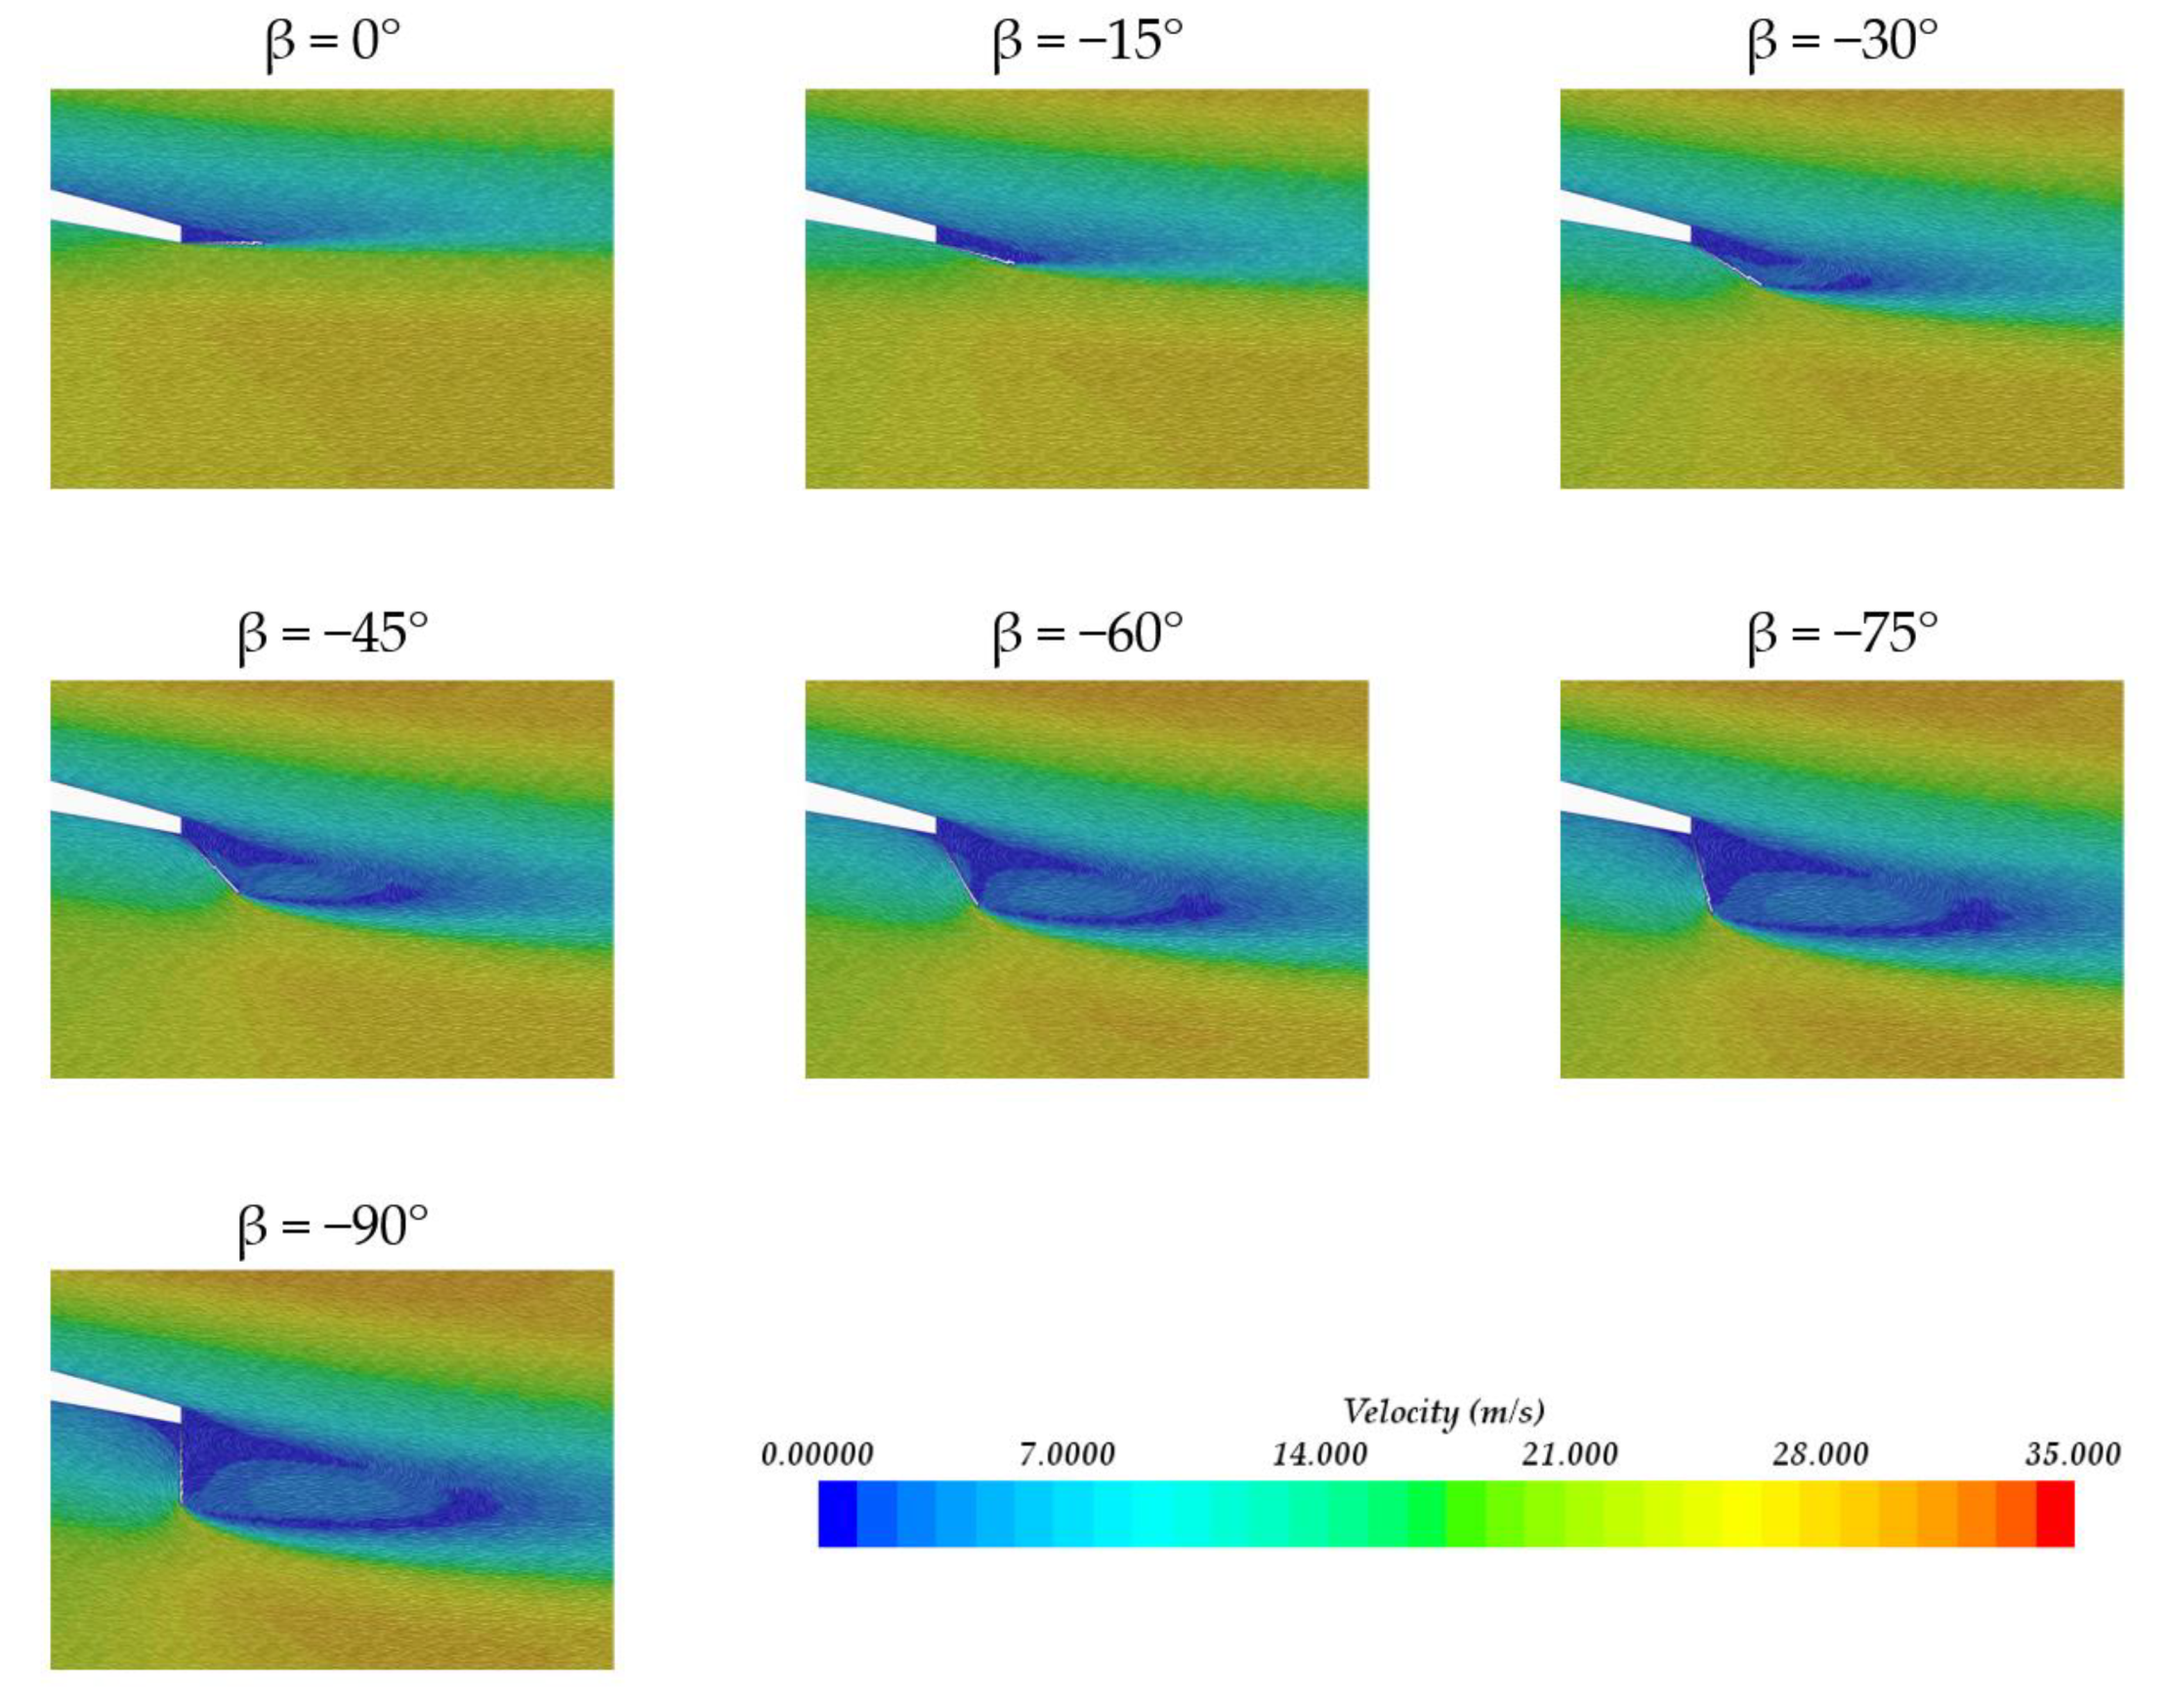
  • The velocity field around the trailing edge area was qualitatively analyzed for the optimum case among the studied configurations (AoA = 6° and h = 2%) with different β angles in order to visualize the effect of the microtab rotation. The generated wake shows a progressive evolution as the microtab rotates: The low velocity area is smaller for tab orientations near β = 0°, and it gradually increases as the β angle approximates −90°. At this point, the rotating tab behaves as a Gurney flap located on the pressure side of the airfoil, since both would have the same orientation.
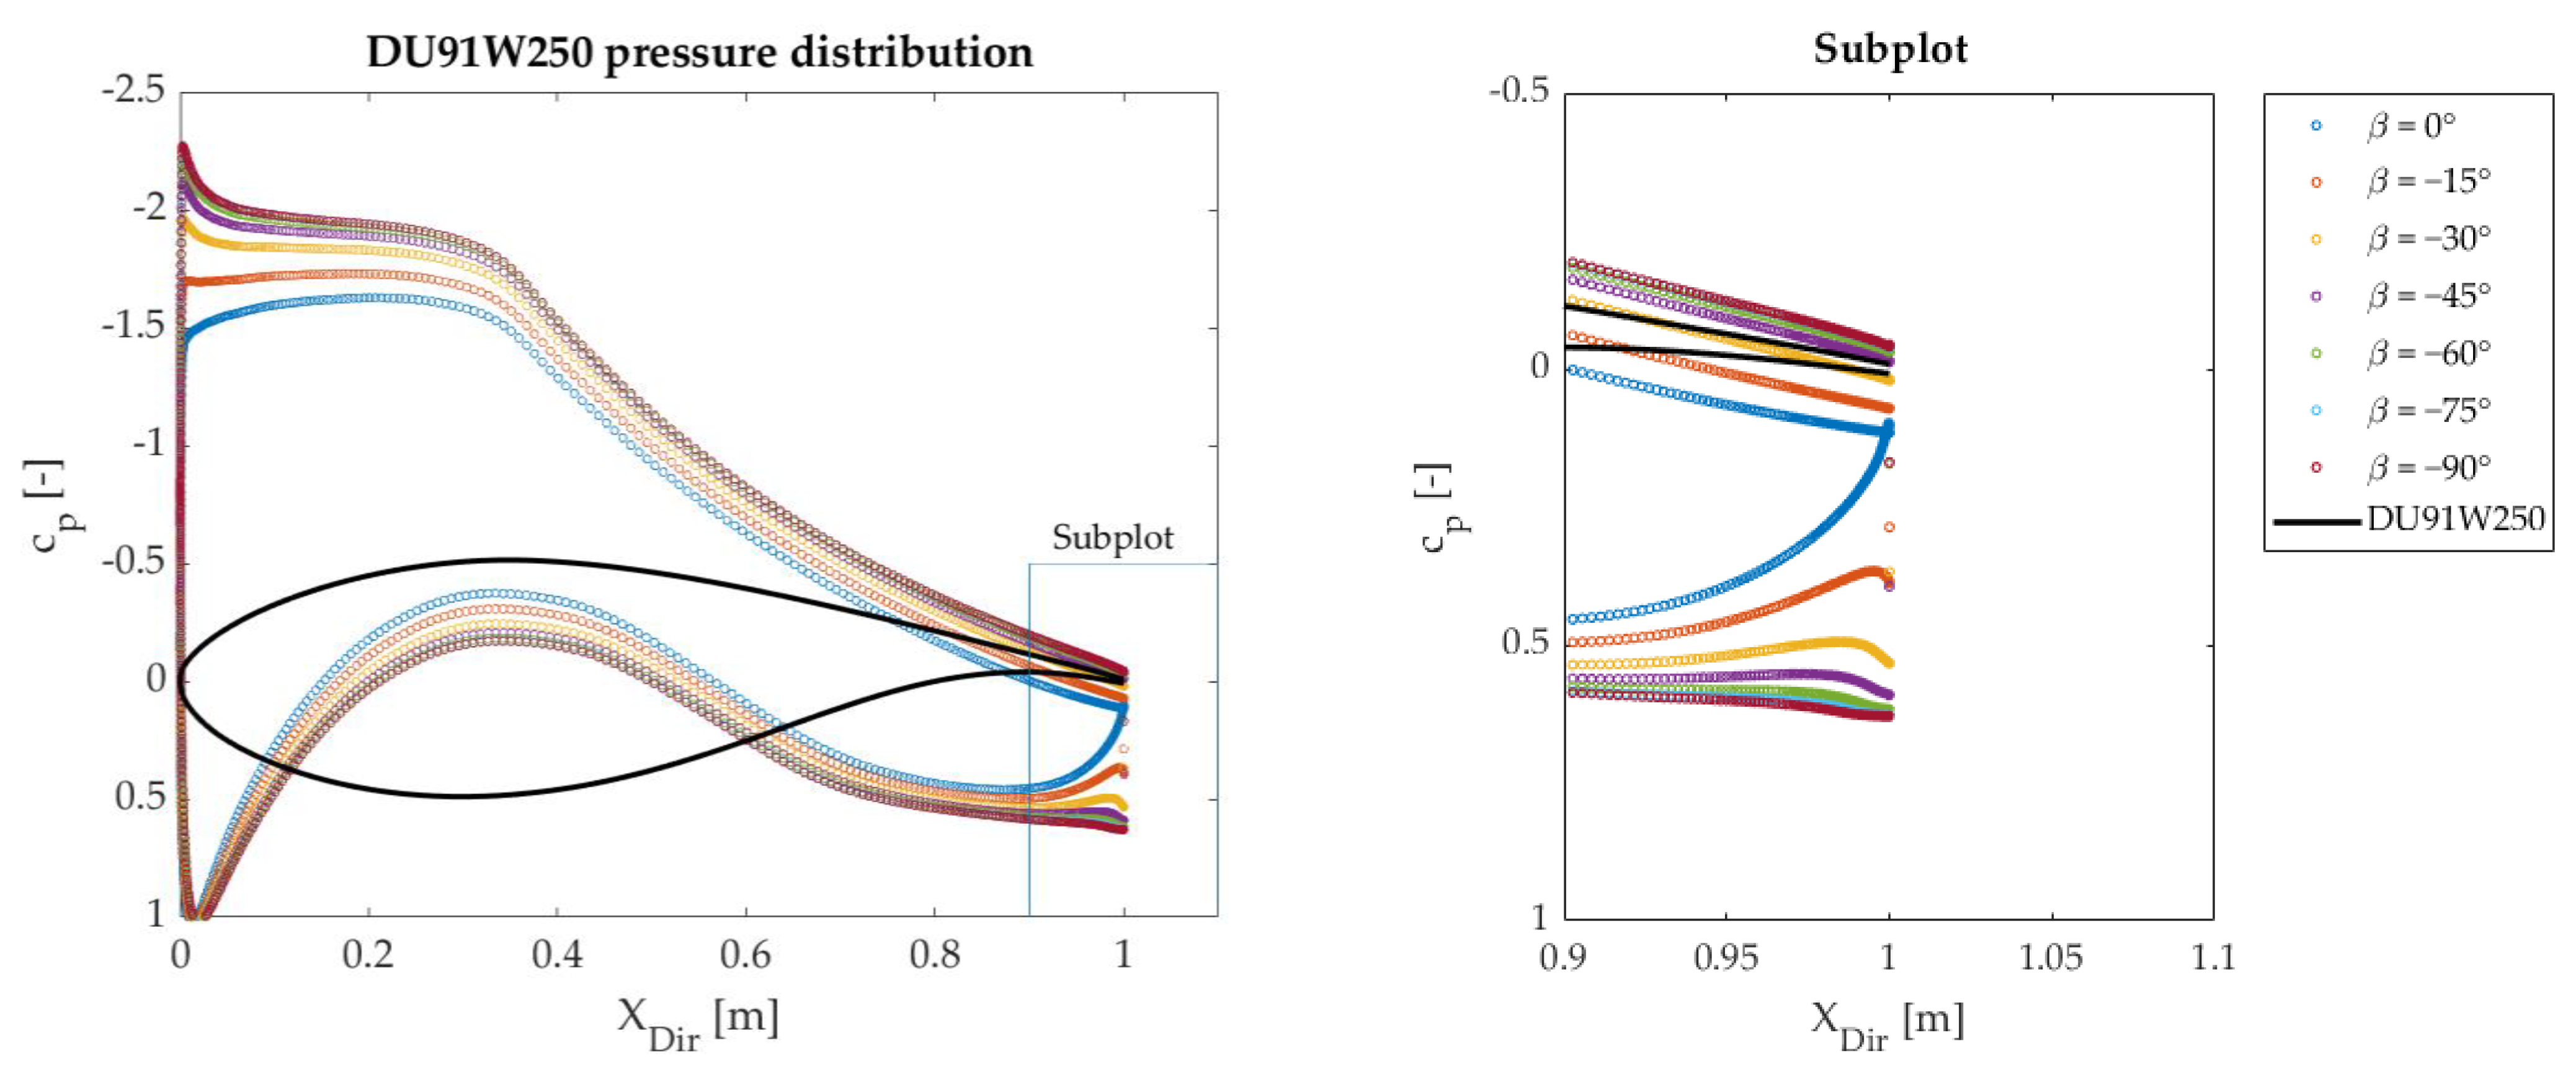
  • Pressure distributions along the streamwise direction of the DU19W250 airfoil were studied for the optimum case. The variation of β involves a gradual change of the pressure gap in the trailing edge. The most noticeable pressure change was achieved when passing from at β = 0° to β = −15°. The pressure distribution was altered along the whole profile: Low β values involved lower pressure differences between suction and pressure sides of the airfoil.
  • Future studies are being developed on the cell-set matter. Passive and active flow control device modeling is a source of high interest in terms of wind turbine optimization. In addition, three-dimensional airfoil scenarios are being considered for coming studies on the cell-set matter.

Supplementary Materials

The following are available online at https://www.mdpi.com/article/10.3390/su13169114/s1, Figure S1: Cell-set model implementation flowchart.

Author Contributions

Conceptualization, A.B.-C.; methodology, A.B.-C. and K.P.-P.; software, E.Z.; and J.M.L.-G.; validation, A.B.-C., U.F.-G. and K.P.-P.; formal analysis, A.B.-C. and K.P.-P.; investigation, K.P.-P. and A.B.-C.; resources, E.Z.; and J.M.L.-G.; data curation, E.Z.; writing—original draft preparation, A.B.-C. and K.P.-P.; writing—review and editing, A.B.-C., K.P.-P. and U.F.-G.; visualization, E.Z.; supervision, U.F.-G.; project administration, U.F.-G.; funding acquisition, U.F.-G. All authors have read and agreed to the published version of the manuscript.

Funding

The authors were supported by the government of the Basque Country through research grants ELKARTEK 21/10: BASQNET: Estudio de nuevas técnicas de inteligencia artificial basadas en Deep Learning dirigidas a la optimización de procesos industriales.

Institutional Review Board Statement

Not applicable.

Informed Consent Statement

Not applicable.

Data Availability Statement

The data presented in this study are available on request from the corresponding author.

Acknowledgments

The authors are grateful for the support provided by the SGIker of UPV/EHU. This research was developed under the frame of the Joint Research Laboratory on Offshore Renewable Energy (JRL-ORE).

Conflicts of Interest

The authors declare no conflict of interest.

Nomenclature

DefinitionUnit
MTMicrotab-
CSCell-set-
GFGurney Flap-
CFDComputational fluid dynamics-
VGVortex generator-
RANSReynolds-averaged Navier–Stokes-
HAWTHorizontal axis wind turbine-
NRELNational Renewable Energy Laboratory-
cAirfoil chord lengthm
βMicrotab angle°
hMicrotab length% of c
SSTShear stress transport-
ReReynolds number-
ρ Local air densitykg/m3
µ Dynamic viscosityPa∙s
U Freestream velocitym/s
p Freestream static pressurePa
p 0 Freestream stagnation pressurePa
AoAAngle of attackdeg
e g Global relative error%
CLLift coefficient-
CDDrag coefficient-
CL/CDLift-to-drag ratio-
c p Pressure coefficient-

Appendix A

Table A1. MT configuration scenarios. The X of each case number refers to the angle of attack. As there are five angles of attack per configuration, the X values are: X = 0 (AoA = 0°); X = 2 (AoA = 2°); X = 4 (AoA = 4°); X = 6 (AoA = 6°); X = 9 (AoA = 9°).
CS MT Configuration
Case No.Caseβ (°)h (%c)
1.XDU91W250_clean_AoAXno MTno MT
2.XDU91W250_CSMT_b0_h1_AoAX01
3.XDU91W250_CSMT_b15_h1_AoAX−151
4.XDU91W250_CSMT_b30_h1_AoAX−301
5.XDU91W250_CSMT_b45_h1_AoAX−451
6.XDU91W250_CSMT_b60_h1_AoAX−601
7.XDU91W250_CSMT_b75_h1_AoAX−751
8.XDU91W250_CSMT_b90_h1_AoAX−901
9.XDU91W250_CSMT_b0_h15_AoAX01.5
10.XDU91W250_CSMT_b15_h15_AoAX−151.5
11.XDU91W250_CSMT_b30_h15_AoAX−301.5
12.XDU91W250_CSMT_b45_h15_AoAX−451.5
13.XDU91W250_CSMT_b60_h15_AoAX−601.5
14.XDU91W250_CSMT_b75_h15_AoAX−751.5
15.XDU91W250_CSMT_b90_h15_AoAX−901.5
16.XDU91W250_CSMT_b0_h2_AoAX02
17.XDU91W250_CSMT_b15_h2_AoAX−152
18.XDU91W250_CSMT_b30_h2_AoAX−302
19.XDU91W250_CSMT_b45_h2_AoAX−452
20.XDU91W250_CSMT_b60_h2_AoAX−602
21.XDU91W250_CSMT_b75_h2_AoAX−752
22.XDU91W250_CSMT_b90_h2_AoAX−902

References

  1. IEA—International Energy Agency. Available online: https://www.iea.org (accessed on 23 December 2020).
  2. Aramendia-Iradi, I.; Fernandez-Gamiz, U.; Sancho-Saiz, J.; Zulueta-Guerrero, E. State of the Art of Active and Passive Flow Control Devices for Wind Turbines. DYNA 2016, 91, 512–516. [Google Scholar]
  3. González-Salcedo, Á.; Croce, A.; Arce León, C.; Nayeri, C.N.; Baldacchino, D.; Vimalakanthan, K.; Barlas, T. Blade Design with Passive Flow Control Technologies. In Handbook of Wind Energy Aerodynamics; Stoevesandt, B., Schepers, G., Fuglsang, P., Yuping, S., Eds.; Springer International Publishing: Cham, Switzerland, 2020; pp. 1–57. ISBN 978-3-030-05455-7. [Google Scholar]
  4. Soto-Valle, R.; Bartholomay, S.; Manolesos, M.; Nayeri, C.; Paschereit, C.O. Airfoil Shaped Vortex Generators applied on a Research Wind Turbine. In AIAA Scitech 2021 Forum; American Institute of Aeronautics and Astronautics: Reston, VA, USA, 2021. [Google Scholar]
  5. Bach, A.B.; Holst, D.; Nayeri, C.N.; Paschereit, C.O. Transitional Effects of Active Micro-Tabs for Wind Turbine Load Control. In Proceedings of the ASME Turbo Expo 2013: Turbine Technical Conference and Exposition, San Antonio, TX, USA, 3–7 June 2013; pp. 10–1115. [Google Scholar]
  6. Gerontakos, P.; Lee, T. Dynamic Stall Flow Control via a Trailing-Edge Flap. AIAA J. 2006, 44, 469–480. [Google Scholar] [CrossRef]
  7. Kamps, L.; Brücker, C.; Geyer, T.F.; Sarradj, E. Airfoil Self Noise Reduction at Low Reynolds Numbers Using a Passive Flexible Trailing Edge. In Proceedings of the 23rd AIAA/CEAS Aeroacoustics Conference; American Institute of Aeronautics and Astronautics, Denver, CO, USA, 5–9 June 2017. [Google Scholar]
  8. Castellani, F.; Astolfi, D.; Piccioni, E.; Terzi, L. Numerical and Experimental Methods for Wake Flow Analysis in Complex Terrain. J. Phys. Conf. Ser. 2015, 625, 012042. [Google Scholar] [CrossRef] [Green Version]
  9. Astolfi, D.; Castellani, F.; Berno, F.; Terzi, L. Numerical and Experimental Methods for the Assessment of Wind Turbine Control Upgrades. Appl. Sci. 2018, 8, 2639. [Google Scholar] [CrossRef] [Green Version]
  10. Cooperman, A.; Chow, R.; Johnson, S.; van Dam, C. Experimental and Computational Analysis of a Wind Turbine Airfoil with Active Microtabs. In 49th AIAA Aerospace Sciences Meeting including the New Horizons Forum and Aerospace Exposition; Aerospace Sciences Meetings; American Institute of Aeronautics and Astronautics: Reston, VA, USA, 2011. [Google Scholar]
  11. Gruschwitz, E.; Schrenk, O. A Simple Method for Increasing the Lift of Airplane Wings by Means of Flaps; NASA: Washington, DC, USA, 1933. [Google Scholar]
  12. Liu, L.; Padthe, A.K.; Friedmann, P.P. Computational Study of Microflaps with Application to Vibration Reduction in Helicopter Rotors. AIAA J. 2011, 49, 1450–1465. [Google Scholar] [CrossRef] [Green Version]
  13. Friedmann, P.; Padthe, A.; Liu, L. Numerical Evaluation of Microflaps for On Blade Control of Noise and Vibration. In Proceedings of the 52nd AIAA/ASME/ASCE/AHS/ASC Structures, Structural Dynamics and Materials Conference, American Institute of Aeronautics and Astronautics, Denver, CO, USA, 4–7 April 2011. [Google Scholar]
  14. Lee, T.; Su, Y.Y. Lift Enhancement and Flow Structure of Airfoil with Joint Trailing-Edge Flap and Gurney Flap. Exp. Fluids 2011, 50, 1671–1684. [Google Scholar] [CrossRef]
  15. Bofeng, X.; Junheng, F.; Qing, L.; Chang, X.; Zhenzhou, Z.; Yue, Y. Aerodynamic Performance Analysis of a Trailing-Edge Flap for Wind Turbines. J. Phys. Conf. Ser. 2018, 1037, 022020. [Google Scholar] [CrossRef] [Green Version]
  16. van Dam, C.P.; Chow, R.; Zayas, J.R.; Berg, D.E. Computational Investigations of Small Deploying Tabs and Flaps for Aerodynamic Load Control. J. Phys. Conf. Ser. 2007, 75, 012027. [Google Scholar] [CrossRef] [Green Version]
  17. Errasti, I.; Fernández-Gamiz, U.; Martínez-Filgueira, P.; Blanco, J. Source Term Modelling of Vane-Type Vortex Generators under Adverse Pressure Gradient in OpenFOAM. Energies 2019, 12, 605. [Google Scholar] [CrossRef] [Green Version]
  18. Florentie, L.; Hulshoff, S.J.; van Zuijlen, A.H. Adjoint-Based Optimization of a Source-Term Representation of Vortex Generators. Comput. Fluids 2018, 162, 139–151. [Google Scholar] [CrossRef]
  19. Chillon, S.; Uriarte-Uriarte, A.; Aramendia, I.; Martínez-Filgueira, P.; Fernandez-Gamiz, U.; Ibarra-Udaeta, I. JBAY Modeling of Vane-Type Vortex Generators and Study on Airfoil Aerodynamic Performance. Energies 2020, 13, 2423. [Google Scholar] [CrossRef]
  20. Ibarra-Udaeta, I.; Portal-Porras, K.; Ballesteros-Coll, A.; Fernandez-Gamiz, U.; Sancho, J. Accuracy of the Cell-Set Model on a Single Vane-Type Vortex Generator in Negligible Streamwise Pressure Gradient Flow with RANS and LES. J. Mar. Sci. Eng. 2020, 8, 982. [Google Scholar] [CrossRef]
  21. Portal-Porras, K.; Fernandez-Gamiz, U.; Aramendia, I.; Teso-Fz-Betoño, D.; Zulueta, E. Testing the Accuracy of the Cell-Set Model Applied on Vane-Type Sub-Boundary Layer Vortex Generators. Processes 2021, 9, 503. [Google Scholar] [CrossRef]
  22. Ballesteros-Coll, A.; Fernandez-Gamiz, U.; Aramendia, I.; Zulueta, E.; Lopez-Guede, J.M. Computational Methods for Modelling and Optimization of Flow Control Devices. Energies 2020, 13, 3710. [Google Scholar] [CrossRef]
  23. Ballesteros-Coll, A.; Fernandez-Gamiz, U.; Aramendia, I.; Zulueta, E.; Ramos-Hernanz, J.A. Cell-Set Modelling for a Microtab Implementation on a DU91W(2)250 Airfoil. Energies 2020, 13, 6723. [Google Scholar] [CrossRef]
  24. Jonkman, J.; Butterfield, S.; Musial, W.; Scott, G. Definition of a 5-MW Reference Wind Turbine for Offshore System Development; NREL/TP-500-38060; NREL: Golden, CO, USA, 2009; p. 947422. [Google Scholar]
  25. Siemens Star CCM+ Version 14.02.012. Available online: https://www.plm.automation.siemens.com/global/en/ (accessed on 3 February 2020).
  26. Sørensen, N.N.; Mendez, B.; Munoz, A.; Sieros, G.; Jost, E.; Lutz, T.; Papadakis, G.; Voutsinas, S.; Barakos, G.N.; Colonia, S.; et al. CFD Code Comparison for 2D Airfoil Flows. J. Phys. Conf. Ser. 2016, 753, 082019. [Google Scholar] [CrossRef] [Green Version]
  27. Thompson, J.F.; Warsi, Z.U.A.; Mastin, C.W. Numerical Grid Generation: Foundations and Applications; Elsevier Science (North-Holland Publishing Co.): New York, NY, USA, 1985; ISBN 978-0-444-00985-2. [Google Scholar]
  28. Vinokur, M. On One-Dimensional Stretching Functions for Finite-Difference Calculations. J. Comput. Phys. 1983, 50, 215–234. [Google Scholar] [CrossRef] [Green Version]
  29. Fernandez-Gamiz, U.; Zulueta, E.; Boyano, A.; Ramos-Hernanz, J.; Lopez-Guede, J. Microtab Design and Implementation on a 5 MW Wind Turbine. Appl. Sci. 2017, 7, 536. [Google Scholar] [CrossRef]
  30. Aramendia, I.; Fernandez-Gamiz, U.; Zulueta, E.; Saenz-Aguirre, A.; Teso-Fz-Betoño, D. Parametric Study of a Gurney Flap Implementation in a DU91W(2)250 Airfoil. Energies 2019, 12, 294. [Google Scholar] [CrossRef] [Green Version]
  31. Menter, F.R. Two-Equation Eddy-Viscosity Turbulence Models for Engineering Applications. AIAA J. 1994, 32, 1598–1605. [Google Scholar] [CrossRef] [Green Version]
  32. Timmer, W.A.; van Rooij, R. Summary of the Delft University Wind Turbine Dedicated Airfoils. J. Sol. Energy Eng. 2003, 125, 488–496. [Google Scholar] [CrossRef]
Figure 1. Cell-set model implementation of a rotating microtab on the trailing edge of the DU91W250 airfoil. β represents the angle between the X horizontal axis and the MT. (a) Definition of the required MT geometry; (b) cell-set construction based on the MT geometry.
Sustainability 13 09114 g001
Figure 2. Sketch of the DU91W250 airfoil and a detailed view of the rotating CS MT location: β is the angle between the X horizontal axis and the MT and h is the length of the MT.
Sustainability 13 09114 g002
Figure 3. Different MT (h = 1% of c) orientations (trailing edge area of the DU91W250 airfoil).
Sustainability 13 09114 g003
Figure 4. Lift-to-drag ratios (CL/CD) for different MT configurations implemented in the DU91W250 aerodynamic profile, each plot refers to one CS MT length: (a) h = 1%c = 1 cm; (b) h = 1.5%c = 1.5 cm; (c) h = 2%c = 2 cm.
Sustainability 13 09114 g004aSustainability 13 09114 g004b
Figure 5. Aerodynamic performance values from the perspective of the tab rotation for the DU91W250 airfoil. Each plot is devoted to one angle of attack (AoA) of the range studied: (a) AoA = 0°; (b) AoA = 2°; (c) AoA = 4°; (d) AoA = 6°; (e) AoA = 9°.
Sustainability 13 09114 g005aSustainability 13 09114 g005b
Figure 6. Progressive velocity field representation around the trailing edge area of the DU91W250 airfoil for different values of CS MT orientation (β). Case configuration: h = 2% of c and AoA = 6°.
Sustainability 13 09114 g006
Figure 7. Pressure coefficient ( c p ) distribution of the DU91W250 airfoil with different β angles. Case configuration: h = 2% of c and AoA = 6°.
Sustainability 13 09114 g007
Publisher’s Note: MDPI stays neutral with regard to jurisdictional claims in published maps and institutional affiliations.

