
Analyzing Continuance of Cloud Computing in Higher Education Institutions: Should We Stay, or Should We Go?


1
Faculty of Computer Science and Information Technology, Universiti Putra Malaysia, Serdang 43400, Malaysia
2
Faculty of Information Science and Technology, Universiti Kebangsaan Malaysia, Bangi 43600, Malaysia
*
Author to whom correspondence should be addressed.
Sustainability 2021, 13(9), 4664; https://doi.org/10.3390/su13094664
Submission received: 28 March 2021
/
Revised: 12 April 2021
/
Accepted: 13 April 2021
/
Published: 22 April 2021
(This article belongs to the Special Issue Technology and Innovation Management in Education)
Abstract
:Higher Education Institutions (HEIs) consider resource optimization as an essential concern. Cloud computing (CC) in the fourth industrial revolution became the de-facto standard for delivering IT resources and services. CC is now a mainstream technology, andHEIs across the globe are rapidly transitioning to this model; hence, maintaining the retention of the customers of such technologies is challenging for cloud service providers. Current research concerning CC focused on adoption and acceptance. However, there is still a scarcity of research concerning such technology’s continued use in an organizational setting. Drawing on the prior literature in organizational-level continuance, this paper established a positivist quantitative-empirical study to bridge the research gap and assess the precursors for a continuance of cloud technology in HEIs. Subsequently, this study developed a conceptual framework by integrating the IS success model and the IS discontinuance model through the lens of the TOE framework. The data were collected from the decision-makers of Malaysian HEIs that have adopted CC services, and analyzed using Structural equation Modelling (SEM) based on Partial Least Squares (PLS). The results indicate that the continuance intention can be predicted by technology, organizational, environmental, and other contextualized factors, explaining 85.2% of the dependent variables’ variance. The paper closes with a discussion of the research limitations, contribution, and future directions.
1. Introduction
Cloud Computing (CC), as the current generation in computing technology of Fourth Industrial Revolution (IR 4.0), has emerged as the main standard of service and resource delivery [1]. Currently most organisations are moving towards CC technology to decrease operational costs [2]. CC is taking its position to enable better agility in organisations and drive digital innovation. The increasing uptake of individuals by Higher Education Institutions (HEIs) creates a need for better IT infrastructure that facilitates the provision of affordable education [3,4]. Considering the fast pace of change in IT technology, resource management is a critical concern for HEIs [5]. Such is the case because systems installed on the premises can work optimally only if adequate initial capital and necessary resources are provided; such systems also require a comprehensive maintenance plan [6,7]. CC powers the upcoming generation in computing and has become the primary standard for resource and service delivery [1]. The cloud is a potent substitute for HEIs to facilitate cost optimisation, quality enhancement, and sustainability of education [8] by offering the necessary infrastructure, storage, and software as a service [5]. Hence, both private and public organisations, including HEIs, have been quick to adopt the cloud concept [5,9,10].
While CC is a subscription-based model, a new set of challenges have emerged: (a) HEIs can switch vendors if they perceive greater benefits elsewhere, and (b) discontinuance use threatens the lasting utility of cloud services. Organizational continuance decisions are often made by Information Systems (IS) executive decision makers or others in the organization who may not be intense users of the service in question [11], in which a strong influence may be attributed to factors that are insignificant for individual users (e.g., lowering organiza tional costs) [12]. Generally, continuance research has been undertaken at the individual user level; however, theoretical research organizational continuance is still scarce [11,13]. Precisely, current research trends on CC have sought to study the technology’s acceptance or adoption; however, little research attention has been given to the continuance use, particularly at organizational-level setting [14,15,16,17]. In the context of HEIs, past research has also reported that evidence on continuance of CC at individual and organizational level is scarce [10,18,19,20,21,22]. Therefore, answering to the following research questions was an apparent motivation for this research to be conducted: (i) What constructs influence the organizational-level continuance of CC in HEIs? and (ii) How to ensure the continuance use of CC in HEIs? The corresponding research objectives are (i) to identify the constructs that influence the continuance use of CC in HEIs, (ii) to propose a model for CC continuance use in HEIs, and (iii) to statistically evaluate the CC continuance model for HEIs.
Therefore, this study aimed to develop a theoretical model to explain the continuance of CC in HEIs. A proposed model was developed by extending and contextualizing the IS continuance (ISC) model through integrating constructs from the IS discontinuance (ISD) model, IS success (ISS) model, and Technology-Organization-Environment (TOE) framework. Consequently, the key contributions of this research are as follows:
- Among the significant contributions of this study is the overall body of knowledge concerning the IS domain and continuance phenomena. Practically, there is much concern for reducing expenditure associated with IT [5,23,24]. IS services provide client organizations (i.e., HEIs) to choose the desired services they want to continue discontinuing using [9,10]. Hence, research assessing the continuance of IS (i.e., CC) is of critical importance from both theoretical and practical aspects.
- Additionally, a conceptual model is formulated to offer a clear direction in which the HEIs can make decisions concerning the use of CC services; questions like “should we stay, or go” can quickly be addressed. Furthermore, the study findings will help both ICT decision-makers make appropriate decisions concerning CC to enhance resource optimization at the organisational level and cloud service providers to commission and market CC projects. Case in point, the research model results provide specific weights to individual constructs, which may serve as guiding aspects for cloud service providers to target their efforts towards customer retention.
- Besides, the weights may also be used by the customers (i.e., HEIs) to perform regular evaluations concerning a specific CC service’s continuance. Moreover, the current study contributes to the existing literature in the best available organisational level continuance frameworks for the HEI scenario.
- Finally, the research model offers new explanations for the continuance of novel technologies at organizational level. Evaluating the model’s constructs, formatively and reflectively, would provide little addition to the practical contribution of such research.
Figure 1 illustrates the study research operational framework that comprises a series of iterative processes which were revisited numerous times. The subsequent section comprises a concise literature review. Theoretical models are then identified and analyzed, and a conceptual model for assessing continuance of CC in HEIs is proposed. Subsequently, the method is elaborated, followed by an analysis and discussion of the study results. Lastly, the researchers discussed how this study contributes to research, assesses the implications, and suggests directions for future research.
2. Background and Related Work
There is a diverse definition of the term CC in the literature. This paper uses the definition of CC that is comparable to the one provided by the NIST [1], which considers CC as a collection of aspects shared by all CC services. Therefore, concerning this paper, CC is associated with the shared services and applications subscribed by the institutions. In this context, application activities and shared data servers are accessed.
The use of CC in HEIs is being understood as a transformative technical advancement [5]. Such is the case because CC benefits from fast-paced IT adoption, which is more pronounced for research; such an aspect is favourable compared to traditional software systems. Furthermore, the use of CC towards facilitating the implementation of learning theory concerning social-aspects, and cooperative learning [25]. CC resources may be employed to devise e-learning platforms, infrastructure, and other educational services using centralised data storage, software virtualisation, and other aspects [26,27]. Considering the abovementioned aspects, it can be said that CC is crucial for HEIs. Several educational institutes depend on technology for the optimising cost, increasing competition, enhancing learner satisfaction, and fulfilling the requirements of the learners and teachers [28].
According to the World Economic Forum, as of mid-April 2020, 191 countries announced or implemented school or university closures, impacting 1.57 billion students due to COVID-19 pandemic. Many HEIs started offering courses online to ensure quarantine measures did not disrupt education. Technologies such as CC are playing a crucial role in keeping our society functional in a time of lockdowns and quarantines. As these technologies may have a long-lasting impact beyond COVID-19 [29], investigating the continuance use of such technology is crucial.
Cloud Computing in Higher Education Institutions
Several studies had been published concerning CC domain, and the rate of such publication increased over the past years. Acording to a ystematic literarue review on CC adoption in HEIs, many researchers have tried to evaluate the use of CC in HEIs considering an individual-level perspective or an organisational-level perspective [10,30]. Nevertheless, the literature has gaps, especially in the context of the post-adoption (i.e., continuance use) of CC at both organisational and individual levels. Figure 2 depicts the Gap analysis using a taxonomy of research literature on the adoption of CC in HEIs.
Over the last 30 years, numerous researchers have attempted to assess the continuance of IS. The studies have discussed the practical and theoretical contribution, of which several highlighted the multidimensional nature of the aspects underlying the success of IS. Additionally, various studies have contributed to the knowledge concerning the continuance of CC in varying scenarios [11,15,16,31,32,33,34,35,36,37]. However, the factors that drive institutions to continue or discontinue CC subscriptions remain adequately discovered [11,12,14,31], especially in the case of HEIs [10,19]. Considering that most cloud services are subscription-based [1], this is a surprising finding. Hence, the present research objective was to assess the main constructs that are considered by the HEIs while making a decision to continue or terminate the use of CC services. Table 1 shows the synthesized evidence concerning CC’s continuance, derived from studies that have adapted various IS theories and empirically analysed CC in different contexts from an individual or organizational viewpoint in the pre-adoption or post-adoption (i.e., continuance use) phase.
Nevertheless, there is a lack of empirical research about CC continuance determinants in the HEI context. Hence, this research’s primary contribution is to formulate, analyze, and evaluate a conceptual model to measure the continuance of CC service in HEIs. In addition to the context-specific contribution, this study also narrows the gap in the organizational IS continuance research.
3. Theoretical and Conceptual Background
This section discusses the theoretical and conceptual aspects of the study and emphasizes the existing literature about the organizational level continuance to extend and contextualize the ISC model for a better understanding of the determinants affecting the continuance of CC in HEIs.
3.1. IS Continuance Model
The expectation-confirmation theory (ECT) [46] was used to formulate the ISC model [47]. There has been widespread use of this model, especially in the marketing domain, to ascertain the effects of user satisfaction on their intention to continue using the technology [48,49]. As depicted in Figure 3, the ISC model uses several post-consumption factors to determine IS continuance behaviour; these factors are Satisfaction and Perceived Usefulness.
Bhattacherjee [47] made numerous conceptual modifications to fine-tune the ECT theory to suit the ISC model. These modifications start with variables concerning the pre-consumption precursors of confirmation, which are expectation and perceived performance. Precisely, both precursors were eliminated from the model. The researcher’s intention concerning this step was that the influence of the precursorƒs was included using other constructs (namely, Satisfaction (SAT) and Confirmation (CON)). The next change is perceived usefulness as an ex-post expectation factor, whereas ex-post expectation is crucial in the context of IS products and services since expectations are not static over time. In line with the previous studies on initial IS use (i.e., [50,51]), Bhattacherjee [47] suggested that perceived usefulness may potentially affect subsequent IS continuance decisions. Consequently, the model considers Perceived Usefulness as a new aspect of determining SAT. The third modification addresses the relationship between perceived usefulness and intention, as initially formulated in TAM [50], whereby the ISC model proposes that it could be applicable not only in the initial use scenario but also from the continuance perspective. Therefore, perceived usefulness is expected to affect directly the intention to continue an IS and to have indirect effect via SAT. The literature indicates that the ISC model has mostly been applied for assessing continuance use of IS at an individual level. However, the model has been extended to investigate the post-adoption phase at the organizational level [15], in which it also provides a high level of external validity.
The main concern of the ISC model is the individual’s continued use of technology; however, this study intends to address continuance at an organisational level. Nevertheless, the model has been extended to assess the continuance use in an organisational setting (e.g., [15]). The TOE framework suggests that the crucial difference between individual and organizational continuance use decisions of a technology arises from the fact that organisational continuance of technology decisions is driven not only by technological factors associated with individual beliefs (e.g., SAT), but also by organisation factors. Hence, this study extends and contextualizes the ISC model suitable to address the research problem. The ISC model has to be upgraded to the organisational continuance level by including constructs that address organisational and environmental perspectives [15]. Given the fact that researchers should choose an appropriate theory that applies to the research context (for this study, it is organizational continuance use), the Perceived Usefulness defined by the ISC model is replaced by Net Benefits (NB) with logical reasoning. Although perceived usefulness is the most relevant technological factor of the ISC model that determines post-adoption decision and several studies [15,52] have used it as the baseline model, the theory of planned behaviour (TPB) [53] indicates that the NB should be understood as behavioural belief (the same as perceived usefulness) [54]. Therefore, NB derived from the IS success model is used in place of perceived usefulness since the former is a better fit given the scope of this study (i.e., organizational level).
3.2. IS Success Model
A positive impacts arisen from an IS are the “acid test” [32]; in which the question that needs to be answered is whether IS have been advantageous for the organisation [55,56,57]. Other pertinent questions concern IS’s retention decision, changing of the IS, and the future impact of the IS [11]. Therefore, the continuance decision of an IS is informed by the IS success. Extensive research has been undertaken using the IS success model (ISS) [58], and its updated version [59] and have become a reference to such research to explore the IS success [60,61]. This study has adopted the ISS model for the following reasons: firstly, this model has been applied widely in several different research scenarios [11,15,32,62,63]; secondly, the comprehensive dimensions of the model makes the communication of results straightforward; thirdly, since this model is the prominent framework for measuring the IS success, it has a high degree of external validity.
According to DeLone and McLean, the researcher must select the dimensions that define success according to the research problem and setting. Hence, in the current study, two dimensions were eliminated, namely, service quality and use. The ‘use’ construct has been criticized in the literature for many reasons [32,64,65,66,67], especially the way it completes an intermediate action between of impact and quality. However, itself does not indicate a determinant of success [68]. Furthermore, in the context of IS success, the ‘system use’ has been determined in the literature as an unsuitable predictor of system performance [11]. The service quality factor was eliminated because: firstly, it is associated with the overall idea of IS success, whereby the system and its quality are understood as a “functional” aspect, while effects are understood as the “technical” aspects in the context of “operational” IS (in this study, the system can be a service or a collection of services); secondly, for evaluating the services provided by a service provider, the view of service quality is involved. In light of these reasons, other constructs, namely, System Quality (SQ), Information Quality (IQ), and Net Benefits (NB), have been introduced into this study’s research model.
3.3. IS Discontinuance Model
To fit the research setting and address the organizational level continuance of CC in HEIs, additional constructs that effect organization persistence were added. As a result, Technical Integration (TI) as a technology variable as well as SI and CP as an organizational variables and were added [12]. Those constructs are associated with an organisation’s commitment to subscription-based services like CC [11].
In terms of TI, this study sought to assess if a system’s technological features affected continuance decisions. In line with the objective of this study, an assessment of the level to which HEIs may potentially benefit from the sophistication offered by the features of CC services was performed. Nevertheless, the benefits provided by the technological features of the technology are not guaranteed in many cases. For example, an organisation may lack the technical know-how required to fully benefit from the technology [69,70,71], thereby the organization cannot integrate the technology. Consequently, there is a chance that the organisation may discontinue the adopted CC services [11,39].
Regarding SI, this, as a representative of behavioural persistence, the literature has often designated it as “sunk cost” [72]. The sunk cost perspective gains relevance when the acquisition cost may be understood as capital expenditure (CapX). Research concerning SI has evaluated the effect of CapX in the determination of software pricing while considering a switch to different software [73] and the effect of other decisions concerning IS outsourcing [74]. In the case of cloud technology, SI is a crucial variable since technological entry barriers are low and overhead costs are not significant [75]. Considering these factors, it is inappropriate to compare CC services to any other utility service that can be used on-demand [75,76]. Nevertheless, it is essential to understand that numerous CC services usually have significant investment expenditure. As a result, SI is an essential factor in the continuance of CC for HEIs.
3.4. TOE Framework
Based on the TOE framework [79], constructs that influence the continuance of CC can be divided into contextual aspects, namely, technological, organisational, and environmental context. Nevertheless, it should be noted that the TOE framework does not have information included regarding these constructs. Regarding the effects of the technological context on the continuance of CC, there are technology-related constructs that contribute to the organization’s decision to adopt a novel IS [80]. The organisational context concerns how numerous factors influence IS adoption behaviour. Lastly, the environmental context concerns the factors that are beyond the direct control of the organisation (e.g., RP, supply chains, competitive ). Based on these considerations, it is evident that the TOE framework plays an important role in identifying non-technology-level factors that have not been studied in previous research (e.g., aspects concerning external circumstances) [81].
Besides to the technological and organisational constructs obtained from the ISC, ISS, and ISD, additional related constructs associated with organisational and environmental persistence were identified. According to [11], the decision to discontinue an adopted system might also be influenced by environmental or institutional pressures and further investigation will have to take additional perspectives to understand organizational level continuance. Consequently, COL was added as an organisational factor [82,83,84,85]. At the same time, CP [15,86] and RP [86,87,88] were identified as environmental factors. COL is an essential aspect of HEIs, and CC services facilitate effective communication among the stakeholders [82,83], especially in the digital natives [89,90]. Table 2 shows a mapping analysis matrix that depicts the theories and constructs derived from the literature [91,92].
4. Research Model and Hypotheses Development
Among the immense research on IS adoption and continuance, this study focuses on continuance of CC in the context of HEIs since it is crucial to address the gap given the rapidly advancing CC domain and the unique nature of the HEIs. A comprehensive theory concerning continuance at the organisational level remains to be formulated [11]. Hence, based on the theoretical and conceptual background discussed previously, this study employs an approach that extends and contextualizes the ISC model [47] by incorporating constructs from organisational-level IS continuance theories. The ISS model [58,59] that comprises SQ, IQ and NB have been used in concurrence with the ISD model [12] that comprises SI, TI, and CP. To ensure that the developed model is relevance and coherence, additional constructs were identified from the literature to predict the continuance of CC in an educational context (i.e., COL and regulatory policy). The TOE framework [79] was used to construct our research model based on three contexts; technological context (i.e., NB, SQ, IQ and TI), organisational context (i.e., SI and COL), and environmental context (i.e., regulatory policy and CP) [18,19]. Furthermore, we advanced the research hypothesis to set the research agenda, suggest research direction for further assessment, and obtain requisite knowledge on continuance of CC. Figure 4 presents the proposed research model, which is grounded at the organizational level of analysis [96], and the smallest unit of analysis is a CC user.
Based on a positivist research paradigm, the priori assumptions have been made by formulating hypotheses, which would be validated using statistical analysis. The propositions address the correlations between the dependent constructs (i.e., CCCU) and independent constructs derived from the ISC, ISS, ISD, and TOE framework.
The correlations among the constructs of the ISC model developed by Bhattacherjee [47] (i.e, perceived usefulness, satisfaction, CON, and continuance intention) are adapted and contextualized to investigate the continuance of CC in HEIs. To fit the research context of our study, perceived usefulness was replaced by NB because the former represents an individual’s cognitive belief of IS usefulness [50,97]. whereas in the organizational level context, NB is associated with the belief to which IS facilitates the fulfilment of organisational objectives. This definition is in alignment with other definitions pertinent to an organisational level [97,98]. Hence, we propose:
Hypothesis 1 (H1).
An institution’s satisfaction level with initial CC adoption positively influences its CCCU.
Hypothesis 2a (H2a).
An institution’s extent of CON positively influences its satisfaction with CC use.
Hypothesis 2b (H2b).
An institution’s extent of CON positively influences its NB from CC use.
Hypothesis 3a (H3a).
An institution’s NB from CC use positively influence its satisfaction with CC use.
Hypothesis 3b (H3b).
An institution’s NB from CC use positively influence its CCCU.
The correlations among the constructs adopted from the ISS model [59] (i.e., IQ, SQ, and continuance intention) are adapted to the context of this study, that is continuance of CC in HEIs. Besides, these correlations between satisfaction as well as IQ, and SQ have been studied by many researchers [41,99,100,101,102,103,104,105]. Therefore, it follows:
Hypothesis 4a (H4a).
SQ positively influences an institution’s satisfaction with CC use.
Hypothesis 4b (H4b).
SQ positively influences an institution’s CCCU.
Hypothesis 5a (H5a).
IQ positively influences an institution’s satisfaction with CC use.
Hypothesis 5b (H5b).
IQ positively influences an institution’s CCCU.
The correlations among the constructs adopted from the ISD model [12] (i.e., SI, TI, and discontinue intention) have been adapted to examine the continuance of CC in HEIs context. Hence, we propose:
Hypothesis 6 (H6).
TI positively influences an institution’s CCCU.
Hypothesis 7 (H7).
SI positively influences an institution’s CCCU.
Currently, COL is a significant determinant of HEI success. CC facilitates and offers new methods of collaboration between stakeholders in HEIs [82,83]. Current generation of learners in HEIs being described as digital natives needs the Internet to perform routine tasks [89,90] and engage in collective online activities (e.g., studying in groups, socialising, and so on) [106]. To fulfil learners’ needs, decision makers in HEIs must have an understanding of the numerous methods through which content and knowledge can be disseminated [107]. Thus, it is crucial to understand student expectations and how the use of technology can help fulfil those expectations by integrating technology (e.g., collaboration tools) with the teaching methods [108]. In this context, we predict:
Hypothesis 8 (H8).
The COL characteristics of CC services positively influence an institution’s CCCU.
RP is very likely to affect organisations’ decisions regarding continuance of a specific technology. Among the several reasons, one is that the policies set forth by the government have a defining role comprising the creation of laws pertaining to the use of specific technologies, such as CC [88,109,110]. Various studies in the literature have examined how RP has impacted CC adoption in numerous research scenarios [86,87,88]. Considering this context, we predict:
Hypothesis 9 (H9).
RP positively influences an institution’s CCCU.
CP is created as a result of a competitor’s ability to gain better KPIs as a consequence of using CC services (e.g., high-performance) [15,77,78]. Several researchers have proven the significant of CP as a construct to predict CC use in different research environments [15,94,110,111,112,113]. Considering this context, we predict:
Hypothesis 10 (H10).
CP positively impacts an institution’s CCCU.
The proposed model is intended to be used to assess organisational level continuance of CC in HEIs. However, institutions are the main part of the CC ecosystem, where other several actors are concerned (e.g., government institutions, public agencies, and researchers). The research model can be used by CC actors concerned with HEIs as a baseline for stakeholder cooperation, which is crucial for creating better services and delivering better products.
5. Methodology
The positivist philosophical paradigm along with quantitative data approach are used in this study because they warrant measuring the responses in a cost-effective and timely manner [114]. Moreover, the quantitative survey is used to collect data in order to compare the independent and dependent variables conceptually related to each other. Based on the Creswell and Creswell [114] assumption, the causal relationship between variables is feasible only when quantitative data in non-experimental correlation research approach is utilized. Since the research is based on the theoretical aspect of continuance, the development of the research instrument was in line with the suggested guidelines (i.e., scale development, item formulation, and instrument testing) [115,116]. After creating the model, a set of survey items was derived from the literature. Subsequently, content validity testing was performed to assess the degree to which an item was reflected in the corresponding construct; furthermore, as per the suggestions provided by Kelley [117], McKenzie, Wood [118], this study comprised expert review assessment to determine representativeness, comprehensiveness, and clarity. After these steps, pilot testing was done to determine the reliability and validity of the formulated instrument. Most scholars opine that a sample size of about 20–40 is appropriate [119,120,121,122,123]; hence, the pilot testing conducted in this study gathered 38 validated questionnaires filled up by ICT decision-makers from public universities in Malaysia [19]. Instrument formulation and data collection were the two primary systematic techniques adopted in this study; these are described in the following subsections.
5.1. Instrument Development
This study employs formative and reflective measures to validate the research model, as specified in Table 3. The questionnaire scales were adapted from the related validated studies in the literature, that is, the ISS model [58,59], the ISC model [47], the ISD model [12], and the TOE framework [79] (refer to Appendix A, Table A1). The evaluation of the instrument’s readability, style and formatting consistency, feasibility, and clarity of language [124] were performed through interviews with academic researchers (n = 2) who have expertise in questionnaire design. Experts’ feedback on the overall design and measurement scale was sought for enhancing questionnaire usability.
The questionnaire is divided into three parts: the first part comprises the preamble; the second part is the demographics section; lastly, there is a section comprising the constructs concerning CC use in HEIs. The approach used for the first section was key informant approach [134] where two questions were used to finalise the choice of participants: first, it was determined whether the participant’s institution had adopted CC services; and second, information was obtained about the participants who did not have any participation in the ICT adoption decision. The candidates who were eligible to participate in the study continued to the next two questions.
The next section comprised demographic information related to faculty, the age of the institution, years since CC adoption, student population, and CC service model type. A variable associated with the service provider was also ascertained based on the response of the candidates regarding their service providers (e.g., Google, Salesforce, Microsoft, and Amazon, among other providers). It should be noted that the service provider aspect did not have any impact on the predicted variable.
The third part of the questionnaire comprised items that individually addressed the research questions, especially those that determined data regarding the constructs that facilitated organisations to continue using the services. The items were measured using a 5-point Likert scale ranging from “strongly disagree” to “strongly agree”. Furthermore, SATelements were evaluated using a 5-point Likert scale but with other options i.e., 1 = very dissatisfied to 5 = very satisfied; 1 = very displeased to 5 = very pleased; 1 = very frustrated to 5 = very contented; and 1 = absolutely terrible to 5 = absolutely delighted).
5.2. Sample Size
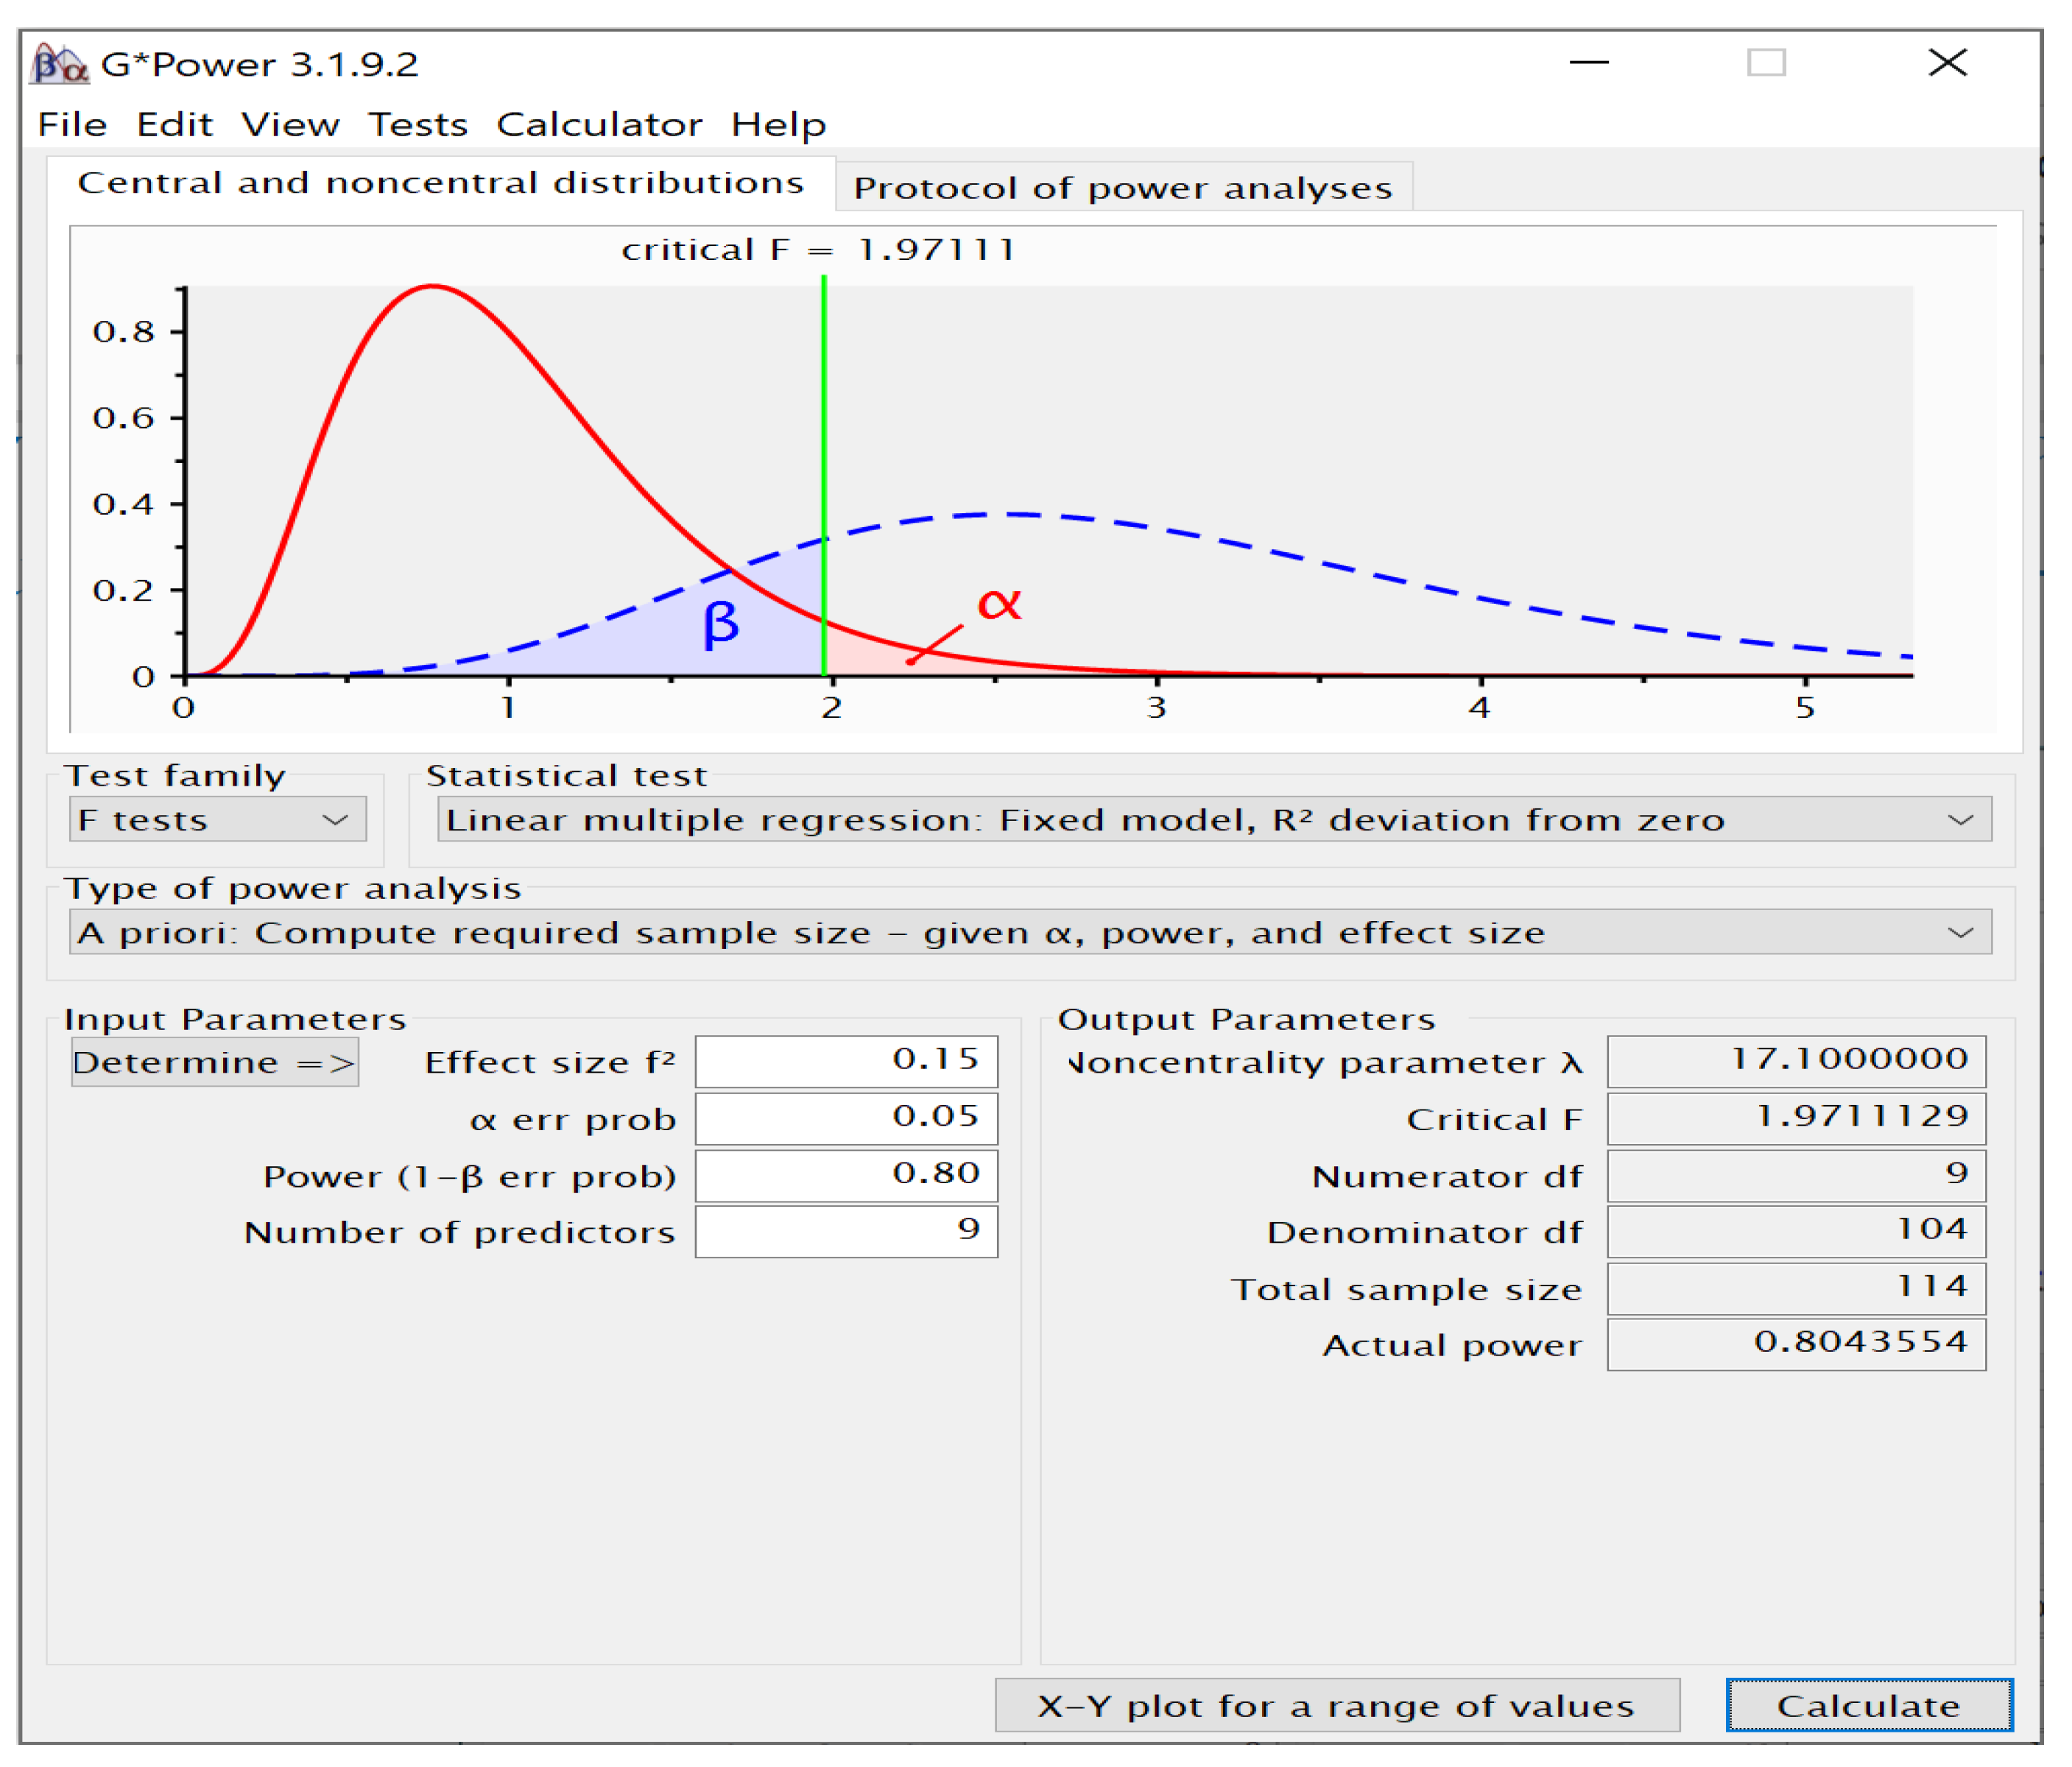
The respondent count was determined on the basis of the requirements of G*power software was used to determine if the sample was appropriately sized [135]. As per the suggestions of Vidaver-Cohen [136] (f2 = 0.15 concerning effect size, α = 0.05 concerning type one error, and β = 0.20 concerning type two error) and 9 direct predictor constructs, the indicative sample was 114 (refer to Figure 5).
Following the rule specified above, along with the statistical analysis approach determined for the study, the sample size was kept at N = 140, which is appropriate for validating model parameters.
5.3. Sampling and Data Collection
Daniel [137] opined that "in purposive sampling researcher purposely selects the elements because they satisfy specific inclusion and exclusion criteria for participation in the study". Purposive sampling is appropriate for the first few stages of the study wherein the subjects are not fully apprised concerning the event being studied [138]. Hence, purposive sampling was the approach chosen for this study. It is crucial that, in the organisational context, a continuance decision is unanimous; hence, the approach of having an individual representing an organisation, as chosen in the research (or a team), seems logical [11]. The survey used for the research had individuals contribute concerning the characteristics of their organisations. Therefore, it was critical to make sure that the chosen individual has the necessary knowledge and authority to report on such matters; hence, the key informant [134] technique was chosen for this study. In the context of the first section of the questionnaire, the candidates were told that the research intended to recruit crucial-decision makers from the organisations. Additionally, the candidates were informed to withdraw from the survey process if they had no role in making the decision to continue using CC services.
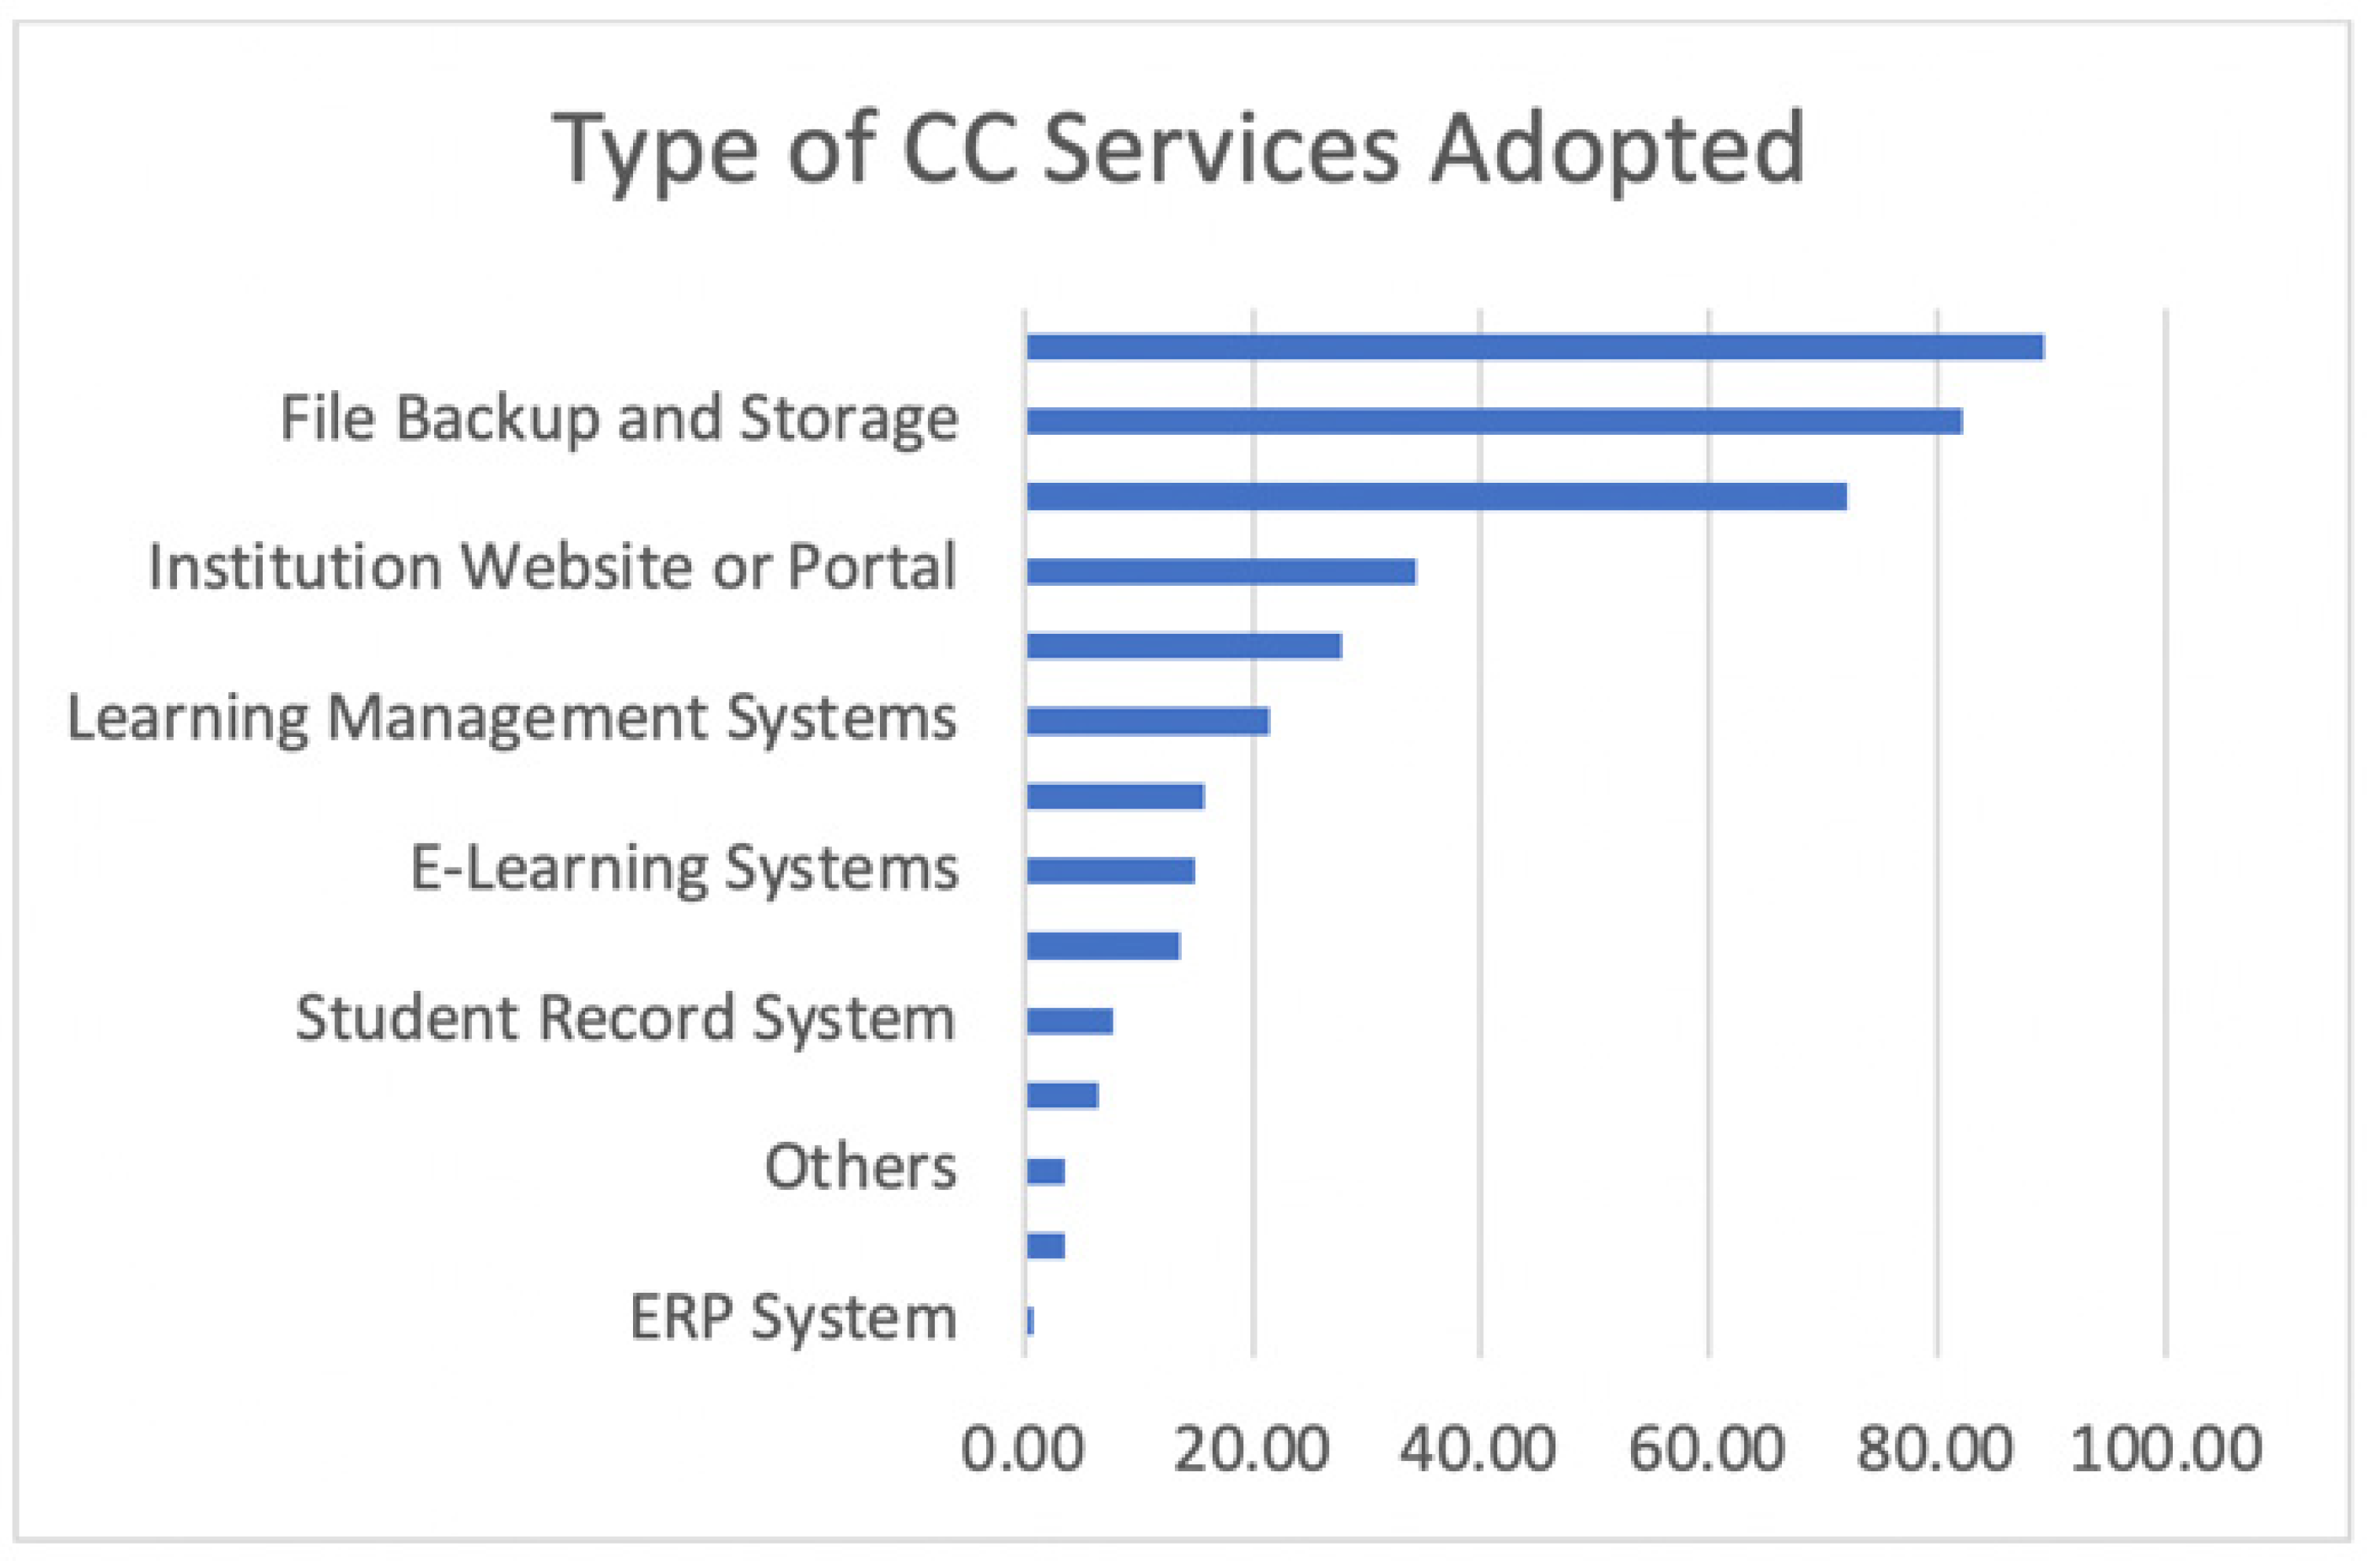
It was determined to use descriptive statistics to evaluate the data obtained using the first two sections of the survey questionnaire. The participants were contacted using both offline and online distribution media. Data collection was performed over eight months. Google Online Forms were used to formulate the questionnaire; subsequently, the questionnaire link was sent to the respondents (423) using email. Reminders were sent one month after the questionnaire was mailed; the intention was to encourage the candidates to participate. Furthermore, participants from several Malaysian public universities were handed the questionnaire using a face-to-face setup. At the same time, the Public University ICT Directors Council (known as MAPITA or Majlis Pengarah-Pengarah ICT IPTA), which consists of the ICT directors representing the twenty Malaysian public universities, was contacted. Finally, 172 respondents were part of the study of which, 140 were chosen for the final stage. The other 32 were determined to be outliers and were, therefore, not included in the research. Hence, the net response to the study was 33.1%. Demographic information related to the institutions and the candidates is specified in Table 4, in which the most services used from CC service providers are Google and Microsoft while Amazon and Salesforce.com are the less used. Figure 6 depicts the CC services adopted by the HEIs. It can be observed that email (89.29) was the most frequently subscribed service. Storage and backup (82.14%) were the next most popular service. The third and fourth spots were occupied by office productivity suite (72.14%) and institute portal (34.29%).
5.4. Ethical Consideration
All the participants were informed in the self-administered online survey that their participation is voluntarily, and their responses will be confidential and used for research purposes only, while keeping their identity anonymous. The survey was sent online, and a number of 140 ICT decision makers gave their consent to participate in the study.
6. Data Analysis and Results
The guidelines suggested by Hair, Ringle [139] and the two-step technique recommended by Chin [140] were adhered while reporting the PLS estimates. Both measurement and path models were assessed using parameter configurations for the 5000 samples and 115 cases [139]. The mean replacement algorithm in SmartPLS was used to replace the missing values.
6.1. Measurement Model Test
The first step to assess a research model relies on the measurement model, to ensure the appropriateness of measuring every construct. The PLS algorithm was employed to assess the measurement model. Following Hair Jr, Hult [141], the measurement model was assessed in a series of tests for both reflective and formative measurement model and are as explained in the sections to follow.
Reflective measures, namely, SAT, Con, SI, TI, CP, RP, and Col were evaluated by testing internal consistency, discriminant validity, and convergent validity [141]. The results obtained from the reflective measurement model (i.e., reliability, validity, correlations, and factor loading) are summarized in Table 5, Table 6 and Table 7 and explained below.
Composite reliability (CR) and Cronbach’s alpha (CA) were employed for the entire set of reflective constructs to evaluate their reliability. As can be observed in Table 5, the values of CA and CR are higher than 0.70, which meet the necessary conditions; hence, internal consistency reliability was adequate. Item loadings were examined to determine the index reliability for model measurement. These indicator loadings determine the degree to which the variance of an indicator is explained by its corresponding construct. As reflected in Table 5, all items’ loadings values exceed the threshold value (i.e., 0.708), with only one item (i.e., CON1) being below the threshold. Nevertheless, it is appropriate to retain the indicators with a threshold lower than 0.708 in the case where the minimum value of AVE (i.e., 0.5) is met [141,142].
Discriminant Validity (DV) and Convergent Validity (CV) are used to assess the constructs’ validity, as explained ahead. The average variance extracted (AVE) is used to assess the convergent validity of all constructs, which exceeded the threshold value (i.e., 0.5) [143], indicating a good internal quality of the model [144] (refer to Table 5). The discriminant validity of the research instrument was determined using the criterion of Fornell and Larcker [143], which states that discriminant validity is applicable when the AVE exceeds the correlation squared of all other constructs. As shown in Table 6, the square roots of each construct are higher than the correlation values with all other constructs; hence, the discriminant validity of the research instrument is confirmed. Another way to assess the discriminant validity is to analyse the indicators’ loading and cross-loadings [145]. Barclay, Higgins [145] indicated that each indicator’s loading on its construct should be higher than its cross-loading on all other constructs. Table 7 indicates that all measures met this criterion, confirming an appropriate degree of indicator reliability.
To address the issue of common method bias (CMB), this research conducted Harman’s single factor test [146], the most widely used test in the literature. Harman’s single factor test was conducted using SPSS v26.0 software. The analysis indicated that a single factor accounted 38.63% of the total variance, which is less than the recommended value (i.e., 50%). Hence, the CMB concerning the dataset was determined to be insignificant.
Formative measures, namely, SQ, IQ, and NB, were evaluated using the 3-step process suggested by Hair Jr, Hult [141]. The results obtained from the formative measurement model (i.e., collinearity, validity, and indicator relevance and significance) and summarized in Table 8. Hair Jr, Hult [141] defines convergent validity (CV) as the "extent to which a measure correlates positively with other measures of the same construct". Put differently, formative constructs should have a high correlation with reflective measures concerning the same construct. Table 8 indicates adequate convergent validity for all the constructs. The path strength ranging was between 0.75 to 0.86, which exceeds the suggested threshold value of 0.70 [147]. Hence, informatively measured constructs have sufficient degree of convergent validity.
In the second step, the measurement model is assessed for collinearity concerns, which can be conducted by determining the values of variance inflation factors (VIF) specific to every indicator. Given the non-interchangeable nature of formative indicators, a high degree of correlation between the indicators is not expected for formative measurement models. Furthermore, if two formative indicators have a high degree of correlation, there are labelled as having collinearity [141]. Following the guidelines of Hair Jr, Hult [141], Table 8 indicates that every indicator concerning the formative constructs fulfils the VIF test (i.e., below the threshold value of 5). Hence, collinearity is not a concern regarding estimation of the PLS path model since doesn’t represent any critical concern for any formative construct.
The final step of assessing the formative measurement model comprised the assessment of the relevance and significance of the indicators by assessing the outer weight (i.e., relative importance) and outer loading (i.e., absolute importance) of the indicators; subsequently, bootstrapping was employed to determine their significance [141]. Table 8 indicates the results of the bootstrapping process where the significance levels concerning the outer weights show that every formative indicator is significant except for indicators (IQ4, IQ6), (NB2, NB3, NB4, NB6, NB8, NB9, NB11), and (SQ6, SQ8, SQ9, SQ10). However, Hair Jr, Hult [141] indicates that insignificant indicators can be retained on the bases of content validity. Hence, preliminary research of the concepts supports the relevance of these indicators for determining their corresponding constructs (i.e., Service Quality, IQ, and NB) [11,39,41,58,59,93]. This technique is referred to as relative contribution [141].
6.2. Structural Model Test
In continuance with the initial step of the research model evaluation, the assessment of the structural model was crucial. Numerous characteristics were required to evaluate the structural model, in line with the recommendations of Hair Jr, Hult [141]. The PLS algorithm process was used for assessment, along with the bootstrapping re-sampling function. The structural model was evaluated based on the assessment of seven primary criteria: (1) collinearity issue, (2) coefficient of determination (R2), (3) path coefficients, (4) hypotheses testing, (5) effect size, (6) predictive relevance, and (7) importance-performance matrix analysis (IPMA).
6.2.1. Collinearity Assessment
The initial step should evaluate the structural model to check for the presence of collinearity issues. Hair, Ringle [139] and Hair Jr, Hult [141] explain that if the VIF value concerning an exogenous latent variable exceeds 5, there is a substantial degree of collinearity. In the case where collinearity exceeds the required threshold, it is required to remove constructs, combine two or more predictors into a single construct, or to create constructs of a higher order to address the collinearity issues. In the context of this study, the VIF values are below the threshold of 5 and, therefore, the degree of collinearity is acceptable (refer to Table 9).
6.2.2. Explained Variance (R2)
The coefficient of determination (R2) is a measure of the predictive accuracy of the model. This measure indicates the degree of variance concerning the endogenous constructs (i.e., dependent variables) accounted for by the entire set of exogenous constructs (i.e., independent variables) associated with it. Smart PLS was used to compute the value of R2 corresponding to the dependent constructs. The results indicated that the total R2 predicted for CCCU was 0.852, which means that about 85.2% of the variance of the organizationorganizational continuance of CC intention is explained by its independent constructs (i.e., Conf, SAT, NB, IQ, SQ, TE, SI, COL, CP, and RP). In addition, Conf, NB, IQ, and SQ can explain 76.4% of the variance of its dependent construct, i.e., SAT. Finally, 43.9% of the variance concerning NB is accounted for by CON. The R2 values of the predicted variables used in the model are specified in Table 10, in which all the dependent constructs have achieved a moderate or substantial explanatory power.
6.2.3. Path Coefficient (β)
The objective of using the path coefficient is to determine the relevance associated with the path relations specific to a structural model [148]. Hence, in the present study, the path coefficients (β) were determined using the PLS algorithm, which is the direct effect of independent constructs on dependent constructs. Figure 7 depicts the path coefficients between constructs in the research model. A majority of the path coefficients have values exceeding 0.100, indicating the impacts of the model’s contructs.
6.2.4. Hypothesis Testing
The study hypotheses were assessed using the path coefficients resulted from PLS with p-values and the t-statistics resulted from bootstrapping (Table 11). The PLS-SEM technique was used to ascertain the impact of the independent constructs on CCCU. The acceptable t-values corresponding to significance levels p < 0.001, p < 0.01, and p < 0.05 are 3.091, 2.326, and 1.645, respectively. A hypothesis is accepted if the path coefficient associating the dependent and the independent constructs is significant. Another way to accept or reject a hypothesis is employing the path assessment results (β, p-value, and t-value), which are also used to determine the influence of the association between the dependent and independent variables. Table 11 and Figure 8 specify the results concerning the path coefficients and the significant relations comprising the structural model.
Hypotheses H1, H3b, H4b, H5b, H6, H7, H8, H9, and H10 suggest that CCCU is positively influenced by SAT, NB, SQ, IQ, TI, SI, COL, RP, and CP, respectively. According to results in Table 11 and the research model in Figure 8, CCCU was found to be positively and significantly influenced by SAT (β = 0.516, t-value = 5.776, p < 0.01), NB (β = 0.367, t-value = 4.489, p < 0.01), SQ (β = 0.431, t-value = 4.063, p < 0.01), TI (β = 0.245, t-value = 4.906, p < 0.01), SI (β = 0.237, t-value = 3.894, p < 0.01), COL (β = 0.143, t-value = 2.653, p < 0.01), RP (β = 0.109, t-value = 2.298, p < 0.05), and CP (β = 0.106, t-value = 2.015, p < 0.05). Hence, hypotheses H1, H3b, H4b, H6, H7, H8, H9, and H10 are accepted. In contrast to that, hypothesis H5b (IQ -> CCCU) was not supported for CCCU in HEIs (β = −0.043, t-value = 00.624, p = not significant).
Hypotheses H2a, H3a, H4a, and H5a suggest that HEIs’ SAT is positively influenced by Conf, NB, SQ, and IQ, respectively. Considering the results of the PLS path model, SAT was positively and significantly influenced by CON (β = 0.300, t-value = 3.086, p < 0.01), SQ (β = 0.208, t-value = 2.144, p < 0.05), and IQ (β = 0.389, t-value = 5.014, p < 0.01); thus, hypotheses H2a, H4a, and H5a are accepted On the other hand, the effect of NB on HEI SAT was not significant (β = −0.116, t-value = 0.998, p = not significant), thereby leading to the rejection of hypothesis H3a.
Hypothesis H2b implies that there is a positive influence of CON on NB in the context of CC adoption continuance in HEIs. In agreement with the hypothesis, the research model depicted in Figure 8 indicated a significant impact of CON on NB (β = 0.663, t-value = 14.94, p < 0.01). The results indicate a statistically significant association between CON and NB, which leads to the acceptance of this hypothesis.
In general, it can be concluded from the empirical evidence that SAT, NB, SQ, TI, SI, Col, RP, and CP are the most influential constructs for continuance of CC in HEI. The effect of NB in influencing the HEI intention was not supported. Additionally, the assessment indicated that NB did not influence SAT to a statistically significant degree.
6.2.5. Assessment of Effect Size (f2)
Effect size (f2) measures the effect of a particular construct on an endogenous variable (i.e., the independent variable), which must be assessed during the evaluation of the structural model using Cohen’s f2. The suggested criteria [149] in measuring f2 is 0.02 < f2 ≤ 0.15 for a small effect size, while the range for a medium effect size changes to 0.15 < f2 ≤ 0.35; lastly, f2 should be higher than 0.35 in the case of large effect size. The effective size analysis outcomes specified in Table 12 are in line with the categorization technique suggested by Cohen [149] and by the method suggested by Hair Jr, Hult [141], revealing that, in the context of the constructs influencing the continuance of CC in HEIs, SQ was ascertained to have a large effect size. At the same time, SAT, SI, NB, and TI were ascertained to have a medium effect size, while the remaining constructs had a relatively smaller effect. In case of NB as a dependent construct, CON was found to have a large effect size. Similarly, if SAT is the dependent variable, IQ and CON had a medium effect, while NB and SI had a small effect size.
6.2.6. Assessment of Predictive Relevance
The Q2 statistic proposed by Stone-Geisser [150,151] helps to determine the predictive power of a set of manifest constructs. We evaluated the predictive relevance of the model by employing the blindfolding processes to get cross-validity redundancy [149]. According to Hair Jr, Hult [141], Fornell [152], the model can have predictive relevance for a cretin endogenous constructs if the value of Q2 is higher than zero. As shown in Table 11, the three values of Q2 corresponding to the endogenous constructs (i.e., CCCU, SAT, and NB) are 0.624, 0.530, and 0.214 respectively, thereby indicating that the model has the required predictive relevance. Furthermore, Hair Jr, Hult [141] also indicate that, in the context of predictive relevance, the values 0.35, 0.15, and 0.02 correspond to the exogenous construct having a large, medium, and small predictive relevance, respectively, for a chosen endogenous construct. Table 11 reveals a medium q2 effect size for CON (0.272) on NB, whereas the rest of the constructs exhibits small q2 effect size.
6.2.7. Importance-Performance Matrix Analysis
The Importance-Performance Map Analysis (IPMA) broadens the outcomes of the PLS-SEM by considering the performance of every construct [141,153]. In other words, IPMA is useful to further explain and discuss the findings for managerial implications. It may potentially be employed to pinpoint improvement areas concerning management actions (or the specific focus of the model) by comparing the total effects (i.e., importance) comprising the structural model to the average latent variable scores (i.e., performance) related to a particular endogenous construct.
As seen in the Important-Performance map (Figure 9), the IPMA of CCCU indicates that that SAT has high performance, but it is not an important construct in the prediction of CCCU. Hence, ICT decision-makers should not focus much on CCCU, as it will possibly overkill in business when bringing impact to CCCU in the case of HEIs. The constructs which are more important are Col, RP, SI, TE, NB, and SQ. Col, RP, SI, TI, and NB are already high in performance, but SQ is slightly lower, so the decision-makers in HEIs should focus on this issue in the CC service to enhance the cloud service quality. In terms of CP, it is very important for leaders of HEIs to shape the intention by surfing and diagnosing the substantial competitive advantage that has been achieved by competitors. This can also be the basis for influencing the CON, as when the awareness of the CP becomes clear; then, the decision-makers in HEIs would passively continue using the CC service. On the other hand, CON has little in the context of continuance of CC in HEIs because it is of low importance and low performance. Thus, ICT decision-makers should not focus much on CON, as it has low priority when bringing the impact of continuance of CC in HEIs.
The results obtained from conducting IPMA are presented in Table 13. From the results, we can conclude that SAT has the highest performance score, followed by the constructs of COL, TE, NB, RP and SI.
7. Discussion
The research contributes to the body of knowledge concerning the continuance phenomenon, which itself does not find much mention in IS literature. From a conceptual perspective specific to the noteworthy proliferation of cloud technology, we assert that cloud services’ continuance phenomenon in the education context should be covered in IS domain. Practically, there is much concern for reducing expenditure associated with IT [5,23,24]. IS services provide client organizations (i.e., HEIs) to choose the desired services they want to continue [9,10]. Hence, research assessing the continuance of IS (i.e., CC) is of critical importance than ever before.
Our research assessed the effects of ten constructs derived from the literature. Based on the research model, the decision to continue using a CC service in HEIs is influenced by Sat, NB, Conf, SQ, IQ, TI, SI, Col, RP and CP. These ten constructs accounted for about 85.2% of the model variance, which is higher than other studies in the literature that evaluated the determinants of the continuance of CC (e.g., [11,17]). Obal [17] conducted a study to understand the determinants of disruptive technology continuance adoption, in which their model could explain 72.5% of the variance. Walther, Sedera [11] analysed the continuance of enterprise cloud systems and found that their model could explain 55.9% of the variance in the dependent variable. The observations from prior studies and the current study are contrasted on several factors.
In conclusion, SATis the highest positive influential construct on the dependent variable (i.e., CCCU), followed by TI, NB, and SQ. At the same time, IQ was determined to be a non-significant construct. On the other hand, IQ was observed to have the maximum positive impact on SATas a dependent variable, whereas no significant effect was observed by NB. Considering NB as a dependent variable, CON was observed to have the maximum positive effect. The non-significant effect of IQ on CCCU as well as NB on SATare should be investigated in future research.
Empirical evidence suggests the presence of a correlation between the direct effects on the dependent variable. As per the results, (β = 0.516, t-value = 25.776, p < 0.01), hypothesis H1 can be accepted. The results of the correlation between SAT and CCCU are in agreement with those obtained by Dai, Teo [154], Al-Emran, Arpaci [155], Obal [17], Jia, Guo [15], Hadji and Degoulet [42], Tan and Kim [38], Schlagwein and Thorogood [35] and Liao, Palvia [95], which indicate that institution’s SATmay potentially enhance continuance of CC in HEIs.
According to the empirical results, institution’s SATof CC services is effected positively by the institution’s CON (i.e., H2a) (β = 0.300, t-value = 3.086, p < 0.01), SQ (i.e., H4a) (β = 0.208, t-value = 2.144, p < 0.05), and IQ (i.e., H5a) (β = 0.389, t-value = 5.014, p < 0.01). The results of the correlation between CON and SATare in agreement with the observations by Dai, Teo [154], Al-Emran, Arpaci [155], Jia, Guo [15], Hadji and Degoulet [42], Tan and Kim [38], Schlagwein and Thorogood [35] and Liao, Palvia [95], according to which institution’s SATis positively influenced by the institution’s CON of CC use. Moreover, the results concerning the association of IQ and SQ on SATare in line with the findings of Hadji and Degoulet [42], and Flack [41].
While Conf, SQ, and IQ had a positive influence on the SATas a dependent variable, NB showed no significant effect (β = 0.116, t-value = 0.998), hence, this hypothesis (i.e., H3a) was not supported. DeLone and McLean [58], Delone and McLean [59] indicate that NB is the degree to which information systems provide benefits to organisations, groups, or individuals. NB did not have a significant effect on Sat, and this observation warrants further assessment.
Hypothesis H2b proposed that CON positively affects NB concerning organisational continuance of CC services in HEIs. As per Bhattacherjee [47], Briggs, Reinig [125], Rushinek and Rushinek [126], CON reflects the degree to which users of an organization are content about the outcomes being in line, or exceeding, their expectations and requirements, or the scenario where the outcomes are not as per the expectation. The results of this study indicate (β = 0.663, t-value = 14.94, p < 0.01) that NB is significantly affected by Conf. Therefore, the hypothesis H2b is accepted. This observation is consistent with those from previous studies by Hadji and Degoulet [42] and Liao, Palvia [95].
As per the results of our study, NB (β = 0.367, t-value = 4.489, p < 0.01) and SQ (β = 0.431, t-value = 4.063, p < 0.01) have a positive impact on CCCU. Hence, hypotheses H3b and H4b are accepted. This is consistent with previous research works by [59], Flack [41], and Walther, Sedera [11], where SQ and NB are considered to be significant constructs that affect CCCU positively. DeLone and McLean [58], Delone and McLean [59] assert that NB reflect the degree to which organisations, groups, and individuals benefit from using of information systems. At the same time, SQ reflects the features (like timeliness, reliability, or easy use) regarding the desired service or system.
IQ is described as the set of desired features concerning system output (e.g., relevance, format, or comprehensiveness) [58,59]. The findings of this study (β = −0.043, t-value = 00.624, p = not significant) indicated that the effect of IQ (i.e., H5b) on CCCU is not supported. The result is in agreement with those obtained by Walther, Sedera [11]. This observation might be due to a) only the research by Fitzgerald and Russo [156] has assessed the correlation (positive) between IQ and continuance use at an organisational level, b) an alternative could be a high overall IQ, where the quality is granted from the IS function, and c) further potential aspects may relate to the general importance of IQ, whereas low IQ is perceived to be less significant for routine business (e.g., low system reliability).
As suggested by Furneaux and Wade [12], organizational CCCU is positively influenced by TI and SI. Each of these construct is associated with the organisational commitment to a subscription-based technology (e.g., CC) [11]. The results of the measurement model indicated a significant and positive correlation between CCCU and the specified constructs (i.e., TI and SI). On the basis of the observations concerning TI (β = 0.245, t-value = 4.906, p < 0.01) and SI (β = 0.237, t-value = 3.894, p < 0.01), the corresponding hypotheses H6 and H7 are accepted.
Hypothesis H8 proposed that there is a positive impact of Col on CCCU in HEIs. Campion, Medsker [131], Baas [132] indicated that Col is the degree to which CC services facilitate collaboration and cooperation between the stakeholders of an organization. In the digital native’s context, collaboration is at the core of the HEIs, where CC has a crucial role in facilitating effective collaboration [82,83,89,90]. As indicated by the study results, Col has a significant positive impact on CCCU in HEIs since the β, t-values are 0.143 and 2.653, respectively, which are significant at p < 0.01 level. Hence, hypothesis H8 was accepted.
The measurement model output indicates the positive impact of RP on CCCU in HEIs. The β and t-values for this construct are 0.109 and 2.298 respectively, which are significant at p < 0.05 level. Using these results, the hypothesis H9 can be accepted. The results are in line with those obtained from previous studies [86,87,94]. In the context of this research, RP effect is the degree to which the continuance of CC decision is supported, pressured or protected by the government policy [88,109,110].
Hypothesis H10 specifies that there is a positive effect of CP on CCCU in HEIs. According to Jia, Guo [15], Bughin, Chui [77], Lin and Change [78], CP is created as a result of a competitor’s ability to gain better KPIs as a consequence of using CC services (e.g., high-performance). The results of the present study indicated that CP has a significant positive effect on organizational CCCU in the HEI. The β and t-values specific to this construct are 0.106 and 2.015, which are both significant at the p < 0.05 level. Hence, there is a considerable impact of CP on CCCU in HEIs; the result is in agreement with those from other studies [15,94,110,111,112,113].
Therefore, the observations from the study indicated that this research model can be employed for the organisational continuance of CC in HEIs context. Additionally, the contextualized, extended framework of ISC, ISS, ISD, and TOE may be adopted to better explain the intention of the decision-makers concerning the continuance of CC services.
8. Research Contribution and Implications
This research contributes to the continuance phenomenon in the IS literature, supports the findings by providing evidence from the literature, and reveals implications for cloud service providers and HEIs. The contributions of the research are discussed subsequently from both practical and theoretical standpoints.
8.1. Theoretical Contribution
The theoretical discussion concerning continuance finds little attention in the literature; therefore, this study contributes to this regard. Theoretically, given the presently accelerated CC adoption rate, we assert that continuance of CC should be a crucial topic of discussion in the IS literature. The present trends indicate a trimming of IT-specific capital expenditure [9,23] and engage in the education-as-a-service (EaaS) model [5,10,157] since the cloud makes available the infrastructure, services, and the platform (i.e., IaaS, SaaS, and PaaS). Furthermore, the switching cost is also lesser than other technological models because of several cloud service providers’ competition and availability. Hence, the IS continuance phenomenon assumes greater importance and warrants further research.
The current research assessed the effects of the constructs derived from the literature. Using the predominant frameworks regarding organisational level continuance (i.e., the ISS model and the ISD model), we built upon, extended, and provided context to the ISC model to better understand CC continuance in HEIs. The TOE framework [79] was used to construct our research model based on three contexts; technological context, organisational context, and environmental context [18,19]. Previous research indicates that the explained variance corresponding to an extended research model indicates better improvement than a single theoretical model [158,159]. The continuance of CC decision in HEIs was observed by assessing Conf, Sat, NB, SQ, IQ, TI, SI, Col, RP, and CP.
Furthermore, the research model of the present study accounted for 85.2% of the variance, which is higher than previous studies in the same domain. For instance, Sabi, Uzoka [160] and Tashkandi and Al-Jabri [161] evaluated the use of CC in HEIs and their model accounted for 44.7% and 47.9% of the variance concerning the dependent variables (i.e., endogenous constructs). As per Hair, Ringle [162], R2 values of 0.75, 0.50, or 0.25 for endogenous constructs are understood as significant, moderate, and weak, respectively.
Moreover, the proposed research model could be used to assess the continuance of other disruptive technologies in the education sector. Finally, this study adds to the literature one of the finest organisational-level continuance models for the HEI context and related other domains (e.g., continuance of CC in SMEs and government agencies).
8.2. Practical Implications
Considering the practical implication perspective, this study explains the potential effect on practitioners, CC service providers, and decision-makers. First, cloud technology is among a core topic in the contemporary computing era, in which the observed findings related to the model’s constructs may be valuable for the practitioners. Case in point, the specific weightings linked to the model’s constructs can serve as a set of guidelines that may be used by software vendors to retain their clients. Furthermore, the weights may also be utilized by the clients to pilot routine evaluations concerning the continuance of a particular CC services. Additionally, the model measures the constructs from the reflective and formative perspectives, providing additional benefits from a practical viewpoint.
Second, the constructs of the model may be employed for a longitudinal evaluation that facilitates client organizations to identify the “pain-points”. Considering the fact that a majority of the CC service models are subscription-based [1], our study formulated and evaluated a conceptual model to determine the influential constructs considered by HEIs when making decisions specific to CC continuance. At the same time, cloud service providers should specify clear instructions or a navigation platform that facilitates easy and smooth operation of services for the users in HEIs. Thus, effort in this direction can facilitate higher usage of cloud technology.
Finally, this study suggests the potential effects on decision-makers. The findings of the study will facilitate IT decision-makers to optimize resource use in HEIs, or when commissioning and marketing CC projects. Additionally, the decision-makers could utilize this framework for the evaluation of other IT/IS adoption processes.
9. Limitations and Future Studies
The limitations of this study highlight the emphasis areas for subsequent research. First, just like organisational studies, there is a chance that the results accumulate bias as a result of using individual views opposed to shared opinions within the HEIs. This drawback may be overcome if the constructs are employed for longitudinal assessments rather than one-time cross-sectional studies. Such change may facilitate client organisations to understand the main “pain-points”. This limitation may be addressed using another approach, i.e., to include factual data, such as uptime percentage or cost savings, into the dataset; this action also addresses the common method variance issue. Second, this research model is developed for organisational-level continuance use; however, CC ecosystems comprise using constructs like the availability of IT infrastructure and computer advancement [163,164]. It is suggested that researchers consider additional viewpoints to comprehend continuance at the organisational level. Third, this research framework is built upon and contextualised the ISC model using previous literature concerning organisational-level continuance, which has better applicability to HEIs. Nevertheless, significant contextualization is needed for further contributions. For example, in HEIs, the subject of using CC is students, professors or other faculties. The decision makers may consider users’ attitude to predict the continuance of CC. In addition, the size of institutions may influence strength of a relationship between dependent an independent variable. Furthermore, there is a risk even after the CC service is adopted and the actual performance can be measured; in this regard, risk awareness worth further consideration [165]. Lastly, this study comprised data collected only from the public Malaysian universities. Hence, subsequent studies may choose to collect data from broad population or other countries to validate the results of the present study.
The present world scenario relies on modern technologies that evolve at a rapid pace; in which individuals and organisations must follow that pace; hence, there is a need for assessment for their success and sustainability. In this regard, researchers are always expected to investigate the innovations by assessing the continuance of complementary technologies. In this context, the fourth industrial revolution (IR 4.0) offers a dialectical, complex, and intriguing opportunity concerning many aspects of modern life, where the society would evolve for better. Case in point, education in the IR 4.0 arena (Education 4.0) depends on advanced technologies like artificial intelligent (AI) [166], big data analysis [167,168], augmented reality (AR) [169], Internet of things (IoT) [170,171], mobile devices [172], CC [10,157], and 3D printing [173]. These aspects can change education, teaching methodology, research, and service and effectively transition the work area from task to human-centred. Numerous IR 4.0 technologies have already been adopted and in use in several sectors; hence, further investigation concerning the continuance of the complementary technologies may be of interest to the researchers. Finally, research on how complementary technologies could enhance teaching and learning to attain sustainability in HEIs worth further investigation [174].
Among tons of studies on IS adoption and IS continuance research, this study chose a small niche on the continuance of CC in HEIs, which is an important gap worth addressing for the booming of CC and the unique nature of HEIs. A comprehensive theory concerning continuance at the organisational level remains to be formulated [11]. To bridge this gap in an organisational context, the present study employed a positivist quantitative-empirical research framework to evaluate the precursors determining continuance of CC in HEIs. Based on previous validated theoretical models relating to organisational-level continuance (i.e., IS success and discontinuance), the present study built upon and contextualised the ISC model (i.e., SAT and CON) through the following constructs: NB, SQ, IQ, TI, SI, COL, CP, and RP. The TOE framework was used to construct our research model based on three contexts; technological context, organisational context, and environmental context [18,19]. The results obtained from a pilot study based on the developed model, conducted through a survey with ICT decision-makers in HEIs indicated that the instrument is valid and reliable [19]. Data collection was performed by involving the ICT decision-makers from the Malaysian public universities that had used CC services. SEM based on the PLS was used for data analysis in this study. The observations indicated that continuance intention may be predicted using technological, environmental, and organisational constructs, as well as other contextualised constructs that together account for 85.2% of the variance of the dependent variable. The findings from previous studies and the current study are contrasted considering numerous factors.
In conclusion, SAT exerted the maximum positive effect on the dependent variable (i.e., CCCU), followed by TI, NB, and SQ. At the same time, IQ did not have a significant effect on the dependent variable. On the other hand, IQ exerted the maximum positive impact on the SAT construct, while the NB construct did not significantly impact. Considering NB as a dependent variable, CON was observed to have the maximum positive effect. The non-significant effect of IQ on continuance of CC and NB on SAT warrant additional investigation.
Author Contributions
Conceptualization, Y.A.M.Q. and R.A. (Rusli Abdullah); methodology, Y.A.M.Q.; data collection, Y.A.M.Q. and R.A. (Rusli Abdullah); analysis, Y.A.M.Q. and S.A.; writing—original draft preparation, Y.A.M.Q.; supervision, R.A. (Rusli Abdullah), Y.Y.J. and R.A. (Rodziah Atan); project administration, R.A. (Rusli Abdullah); reviewing, R.A. (Rusli Abdullah) and S.A.; writing—reviewing and editing, Y.Y.J.; validation, R.A. (Rodziah Atan); editing, R.A. (Rusli Abdullah); funding acquisition, Y.A.M.Q. and R.A. (Rusli Abdullah). All authors have read and agreed to the published version of the manuscript.
Funding
This research was funded by Research Management Center (RMC), Universiti Putra Malaysia (UPM), UPM Journal Publication Fund (9001103).
Institutional Review Board Statement
Not applicable.
Informed Consent Statement
Not applicable.
Data Availability Statement
Not applicable.
Conflicts of Interest
The authors declare no conflict of interest.
Abbreviations
| CC | Cloud Computing |
| HEIs | Higher Education Institutions |
| SEM | Structural Equation Modelling |
| PLS | Partial Least Squares |
| IR 4.0 | Fourth Industrial Revolution |
| IT | Information Technology |
| ICT | Information and Communication Technology |
| IS | Information Systems |
| ISC | IS Continuance Model |
| ISS | IS Success Model |
| ISD | IS Discontinuance Model |
| TOE | Technology-Organization-Environment |
| CCCU | Cloud Computing Continuance Use |
| CP | Competitive Pressure |
| COL | Collaboration |
| CON | Confirmation |
| IQ | Information Quality |
| NB | Net Benefits |
| RP | Regulatory Policy |
| SI | System Investment |
| SQ | System Quality |
| IQ | Information Quality |
| SAT | Satisfaction |
| TI | Technical Integration |
Appendix A

Table A1.
Constructs and their Measurement Items.
| Constructs | Reflective/Formative | Measurement Items | Theories | ||
|---|---|---|---|---|---|
| Items | Adapted Source | Previous Studies | |||
| CC Continuous Intention | Reflective | (1 = Strongly Disagree to 7 = Strongly Agree) CCA1: Our institution intends to continue using the cloud computing service rather than discontinue. CCA2: Our institution’s intention is to continue using the cloud computing service rather than use any another means (traditional software). CCA3: If we could, our institution would like to discontinue the use of the cloud computing service. (reverse coded). | [47] | [15,17,38] | ECM & ISD |
| Satisfaction (SAT) | Reflective | How do you feel about your overall experience with your current cloud computing service (SaaS, IaaS, or PaaS)? SAT1: Very dissatisfied (1)–Very satisfied (7) SAT2: Very displeased (1)–Very pleased (7) SAT3: Very frustrated (1)–Very contented (7) SAT4: Absolutely terrible (1)–Absolutely delighted (7). | [47] | [15,17,38] | ECM |
| Confirmation (Con) | Reflective | (1 = Strongly Disagree to 7 = Strongly Agree) CON1. Our experience with using cloud computing services was better than what we expected. CON2. The benefits with using cloud computing services were better than we expected. CON3. The functionalities provided by cloud computing services for team projects was better than what I expected. CON4. Cloud computing services support our institution more than expected. CON5. Overall, most of our expectations from using cloud computing services were confirmed. | [47] | [15,38] | ECM |
| Net Benefits (NB) | Formative | Our cloud computing service… NB1. … increases the productivity of end-users. NB2. … increases the overall productivity of the institution. NB3. … enables individual users to make better decisions. NB4. … helps to save IT-related costs. NB5. … makes it easier to plan the IT costs of the institution. NB6. … enhances our strategic flexibility. NB7. … enhances the ability of the institution to innovate. NB8. … enhances the mobility of the institution’s employees. NB9. … improves the quality of the institution’s business processes. NB10. … shifts the risks of IT failures from my instituting to the provider. NB11. … lower the IT staff requirements within the institution to keep the system running. NB12. … improves outcomes/outputs of my institution. | [58,59] | [11,39,41,93] | ECM |
| NB13. … has brought significant benefits to the institution. | [54] | ||||
| Technical Integration (TE) | Reflective | TI1. The technical characteristics of the cloud computing service make it complex. TI2. The cloud computing service depends on a sophisticated integration of technology components. TI3. There is considerable technical complexity underlying the cloud computing service. | [12] | [11,39] | ISD |
| System Quality (SQ) | Formative | Our cloud computing service… SQ1. … operates reliably and stable. SQ2. … can be flexibly adjusted to new demands or conditions. SQ3. … effectively integrates data from different areas of the company. SQ4. … makes information easy to access (accessibility). SQ5. … is easy to use. SQ6. … provides information in a timely fashion (response time). SQ7. … provides key features and functionalities that meet the institution requirements. SQ8. … is secure. SQ9. … is easy to learn. SQ10. … meets different user requirements within the institution. SQ11. … is easy to upgrade from an older to a newer version. SQ12. … is easy to customize (after implementation, e.g., user interface). | [58,59] | [11,39,41,93] | ISS |
| SQ13. Overall, our cloud computing system is of high quality. | [54] | ||||
| Information Quality (IQ) | Formative | Our cloud computing service… IQ1. … provides a complete set of information. IQ2. … produces correct information. IQ3. … provides information which is well formatted. IQ4. … provides me with the most recent information. IQ5. … produces relevant information with limited unnecessary elements. IQ6. … produces information which is easy to understand. | [58,59] | [11,39,41,93] | |
| IQ7. In general, our cloud computing service provides our institution with high-quality information. | [54] | ||||
| System Investment (SI) | Reflective | SI1. Significant organizational resources have been invested in our cloud computing service. SI2. We have committed considerable time and money to the implementation and operation of the cloud-based system. SI3. The financial investments that have been made in the cloud-based system are substantial. | [12] | [11,39] | ISD |
| Collaboration (Col) | Reflective | Col1. Interaction of our institution with employees, industry and other institutions is easy with the continuance use of cloud computing service. Col2. Collaboration between our institution and industry raise by the continuance use of cloud computing service. Col3. The continuance uses of cloud computing service improve collaboration among institutions. Col4. If our institution continues using cloud computing service, it can communicate with its partners (institutions and industry). Col5. Communication with the institution’s partners (institutions and industry) is enhanced by the continuance use of cloud computing service | [131,132] | [82,83,84,85] | TOE |
| Regulatory Policy (RP) | Reflective | RP1. Our institution is under pressure from some government agencies to continue using cloud computing service. RP2. The government is providing us with incentives to continue using cloud computing service. RP3. The government is active in setting up the facilities to enable cloud computing service. RP4. The laws and regulations that exist nowadays are sufficient to protect the use of cloud computing service. RP5. There is legal protection in the use of cloud computing service. | [94,112,113] | [86,87,88] | TOE |
| Competitive Pressure (CP) | Reflective | CP1. Our Institution thinks that continuance use of cloud computing service has an influence on competition among other institutions. CP2. Our institution will lose students to competitors if they don’t keep using cloud computing service. CP3. Our institution is under pressure from competitors to continue using cloud computing service. CP4. Some of our competitors have been using cloud computing service | [110,111] | [15,86] | TOE |
References
- Mell, P.M.; Grance, T. The NIST Definition of Cloud Computing; NIST Special Publication 800-145; National Institute of Standards and Technology: Gaithersburg, MA, USA, 2011; Volume 800, pp. 1–7. [Google Scholar] [CrossRef]
- Saad Ali, S.; Al Nawaiseh, A.J.; Helmy, Y.; Moawad, I.F.; Khali, D. A Proposed Model Based on Cloud Computing Technology to Improve Higher Education Institutions Performance. Int. J. Adv. Res. Eng. Technol. 2020, 11, 612–628. [Google Scholar]
- Alexander, B. Social networking in higher education. In The Tower and The Cloud; University of California: Berkeley, CA, USA, 2008; pp. 197–201. [Google Scholar]
- Katz, N. The tower and the cloud. In Higher Education in the Age of Cloud Computing; EDUCAUSE: Louisville, CO, USA, 2008; Volume 9. [Google Scholar]
- Sultan, N. Cloud computing for education: A new dawn? Int. J. Inf. Manag. 2010, 30, 109–116. [Google Scholar] [CrossRef]
- Son, I.; Lee, D.; Lee, J.-N.; Chang, Y.B. Market perception on cloud computing initiatives in organizations: An extended resource-based view. Inf. Manag. 2014, 51, 653–669. [Google Scholar] [CrossRef]
- Salim, S.A.; Sedera, D.; Sawang, S.; Alarifi, A.H.E.; Atapattu, M. Moving from Evaluation to Trial: How do SMEs Start Adopting Cloud ERP? Australas. J. Inf. Syst. 2015, 19. [Google Scholar] [CrossRef]
- Vaquero, L.M. EduCloud: PaaS versus IaaS Cloud Usage for an Advanced Computer Science Course. IEEE Trans. Educ. 2011, 54, 590–598. [Google Scholar] [CrossRef]
- González-Martínez, J.A.; Bote-Lorenzo, M.L.; Gómez-Sánchez, E.; Cano-Parra, R. Cloud computing and education: A state-of-the-art survey. Comput. Educ. 2015, 80, 132–151. [Google Scholar] [CrossRef]
- Qasem, Y.A.M.; Abdullah, R.; Jusoh, Y.Y.; Atan, R.; Asadi, S. Cloud Computing Adoption in Higher Education Institutions: A Systematic Review. IEEE Access 2019, 7, 63722–63744. [Google Scholar] [CrossRef]
- Walther, S.; Sedera, D.; Urbach, N.; Eymann, T.; Otto, B.; Sarker, S. Should We Stay, or Should We Go? Analyzing Continuance of Cloud Enterprise Systems. J. Inf. Technol. Theory Appl. 2018, 19, 4. [Google Scholar]
- Furneaux, B.; Wade, M.R. An Exploration of Organizational Level Information Systems Discontinuance Intentions. MIS Q. 2011, 35, 573. [Google Scholar] [CrossRef]
- Alismaili, S.Z.; Li, M.; Shen, J.; Huang, P.; He, Q.; Zhan, W. Organisational-Level Assessment of Cloud Computing Adoption: Evidence from the Australian SMEs. J. Glob. Inf. Manag. (JGIM) 2020, 28, 73–89. [Google Scholar] [CrossRef]
- Al-Sharafi, M.A.; Arshah, R.A.; Abu-Shanab, E.A. Questionnaire Development Process to Measure the SMEs’ Continuous Use behavior towards Cloud Computing Services. In Proceedings of the 2019 8th International Conference on Software and Computer Applications, Penang, Malaysia, 19–21 February 2019; pp. 50–55. [Google Scholar]
- Jia, Q.; Guo, Y.; Barnes, S.J. Enterprise 2.0 post-adoption: Extending the information system continuance model based on the technology-Organization-environment framework. Comput. Hum. Behav. 2017, 67, 95–105. [Google Scholar] [CrossRef] [Green Version]
- Ashtari, S.; Eydgahi, A. Student perceptions of cloud applications effectiveness in higher education. J. Comput. Sci. 2017, 23, 173–180. [Google Scholar] [CrossRef]
- Obal, M. What drives post-adoption usage? Investigating the negative and positive antecedents of disruptive technology continuous adoption intentions. Ind. Mark. Manag. 2017, 63, 42–52. [Google Scholar] [CrossRef]
- Qasem, Y.A.; Abdullah, R.; Jusoh, Y.Y.; Atan, R. Conceptualizing a model for Continuance Use of Cloud Computing in Higher Education Institutions. In AMCIS 2020 TREOs; Association for Information Systems: Atlanta, GA, USA, 2020. [Google Scholar]
- Qasem, Y.A.M.; Abdullah, R.; Yaha, Y.; Atana, R. Continuance Use of Cloud Computing in Higher Education Institutions: A Conceptual Model. Appl. Sci. 2020, 10, 6628. [Google Scholar] [CrossRef]
- Chen, S.-C.; Li, S.-H.; Liu, S.-C.; Yen, D.; Ruangkanjanases, A. Assessing Determinants of Continuance Intention towards Personal Cloud Services: Extending UTAUT2 with Technology Readiness. Symmetry 2021, 13, 467. [Google Scholar] [CrossRef]
- Cheng, Y.-M. Can tasks and learning be balanced? A dual-pathway model of cloud-based e-learning continuance intention and performance outcomes. Kybernetes 2021. [Google Scholar] [CrossRef]
- Hung, M.-C.; Talley, P.C.; Kuo, K.-M.; Chiu, M.-L. Exploring Cloud-Based Bookstore Continuance from a Deconstructed Task–Technology Fit Perspective. J. Theor. Appl. Electron. Commer. Res. 2020, 16, 23. [Google Scholar] [CrossRef]
- Berman, S.J.; Kesterson-Townes, L.; Marshall, A.; Srivathsa, R. How cloud computing enables process and business model innovation. Strat. Leadersh. 2012, 40, 27–35. [Google Scholar] [CrossRef]
- Stahl, E.; Duijvestijn, L.; Fernandes, A.; Isom, P.; Jewell, D.; Jowett, W.; Stockslager, T. Performance Implications of Cloud Computing; Red Paper: New York, NY, USA, 2012. [Google Scholar]
- Thorsteinsson, G.; Page, T.; Niculescu, A. Using Virtual Reality for Developing Design Communication. Stud. Inform. Control. 2010, 19, 93–106. [Google Scholar] [CrossRef]
- Pocatilu, P.; Alecu, F.; Vetrici, M. Using cloud computing for E-learning systems. In Proceedings of the 8th WSEAS International Conference on Data Networks, Communications, Computers, Baltimore, MD, USA, 7–9 November 2009. [Google Scholar]
- Talib, A.M.; Atan, R.; Abdullah, R.; Murad, M.A.A. Multi Agent System Architecture Oriented Prometheus Methodology Design to Facilitate Security of Cloud Data Storage. J. Softw. Eng. 2011, 5, 78–90. [Google Scholar] [CrossRef] [Green Version]
- Sasikala, S.; Prema, S. Massive Centralized Cloud Computing (MCCC) Exploration in Higher Education; Bharathidasan University: Tiruchirappall, India, 2011. [Google Scholar]
- Xiao, Y.; Fan, Z. Tech Trends Getting Us through the COVID-19 Pandemic; Digital Trade, World Economic Forum LLC: New York, NY, USA, 2020. [Google Scholar]
- Al-Sharafi, M.A.; Al Ajmi, Q.; Al-Emran, M.; Qasem, Y.A.; Aldheleai, Y.M. Cloud computing adoption in higher education: An integrated theoretical model. In Recent Advances in Technology Acceptance Models and Theories; Springer: Berlin/Heidelberg, Germany, 2021; pp. 191–209. [Google Scholar]
- Esteves, J.; Bohórquez, V.W. An Updated ERP Systems Annotated Bibliography: 2001–2005; Instituto de Empresa Business School Working Paper No. WP: 07-04; Instituto de Empresa Business School: Madrid, Spain, 2007. [Google Scholar]
- Gable, G.G.; Sedera, D.; Chan, T. Re-conceptualizing information system success: The IS-impact measurement model. J. Assoc. Inf. Syst. 2008, 9, 18. [Google Scholar] [CrossRef]
- Sedera, D.; Gable, G.G. Knowledge Management Competence for Enterprise System Success. J. Strat. Inf. Syst. 2010, 19, 296–306. [Google Scholar] [CrossRef] [Green Version]
- Walther, S.; Plank, A.; Eymann, T.; Singh, N.; Phadke, G. Success factors and value propositions of software as a service providers—A literature review and classification. In AMCIS 2012 Proceedings; Association for Information Systems: Atlanta, GA, USA, 2012. [Google Scholar]
- Schlagwein, D.; Thorogood, A. Married for Life? A Cloud Computing Client-Provider Re-Lationship Continuance Model; Association for Information Systems: Atlanta, GA, USA, 2014. [Google Scholar]
- Ratten, V. Continuance use intention of cloud computing: Innovativeness and creativity perspectives. J. Bus. Res. 2016, 69, 1737–1740. [Google Scholar] [CrossRef]
- Ding, Y. Looking forward: The role of hope in information system continuance. Comput. Hum. Behav. 2019, 91, 127–137. [Google Scholar] [CrossRef]
- Tan, X.; Kim, Y. User acceptance of SaaS-based collaboration tools: A case of Google Docs. J. Enterp. Inf. Manag. 2015, 28, 423–442. [Google Scholar] [CrossRef]
- Walther, S.; Sarker, S.; Urbach, N.; Sedera, D.; Eymann, T.; Otto, B. Exploring organizational level continuance of cloud-based enterprise systems. In ECIS 2015 Completed Research Papers; Association for Information Systems: Atlanta, GA, USA, 2015. [Google Scholar]
- Ghobakhloo, M.; Tang, S.H. Information system success among manufacturing SMEs: Case of developing countries. Inf. Technol. Dev. 2015, 21, 573–600. [Google Scholar] [CrossRef]
- Flack, C.K. IS Success Model for Evaluating Cloud Computing for Small Business Benefit: A Quantitative Study. Ph.D. Thesis, Kennesaw State University, Kennesaw, GA, USA, 2016. [Google Scholar]
- Hadji, B.; Degoulet, P. Information system end-user satisfaction and continuance intention: A unified modeling approach. J. Biomed. Inform. 2016, 61, 185–193. [Google Scholar] [CrossRef] [PubMed]
- Huang, Y.-M. The factors that predispose students to continuously use cloud services: Social and technological perspectives. Comput. Educ. 2016, 97, 86–96. [Google Scholar] [CrossRef]
- Tripathi, S. Understanding the determinants affecting the continuance intention to use cloud computing. J. Int. Technol. Inf. Manag. 2017, 26, 124–152. [Google Scholar]
- Li, Y.; Crossler, R.E.; Compeau, D. Regulatory Focus in the Context of Wearable Continuance. In Proceedings of the Americas Conference on Information Systems, Cancun, Mexico, 15–17 August 2019. [Google Scholar]
- Oliver, R.L. A cognitive model of the antecedents and consequences of satisfaction decisions. J. Mark. Res. 1980, 17, 460–469. [Google Scholar] [CrossRef]
- Bhattacherjee, A. Understanding Information Systems Continuance: An Expectation-Confirmation Model. MIS Q. 2001, 25, 351–370. [Google Scholar] [CrossRef]
- Chou, S.W.; Chen, P.Y. The influence of individual differences on continuance intentions of enterprise resource planning (ERP). Int. J. Human Comput. Stud. 2009, 67, 484–496. [Google Scholar] [CrossRef]
- Lin, W.-S. Perceived fit and satisfaction on web learning performance: IS continuance intention and task-technology fit perspectives. Int. J. Human Comput. Stud. 2012, 70, 498–507. [Google Scholar] [CrossRef]
- Davis, F.D. Perceived usefulness, perceived ease of use, and user acceptance of information technology. MIS Q. 1989, 13, 319–340. [Google Scholar] [CrossRef] [Green Version]
- Karahanna, E.; Straub, D.W. The psychological origins of perceived usefulness and ease-of-use. Inf. Manag. 1999, 35, 237–250. [Google Scholar] [CrossRef]
- Thong, J.Y.; Hong, S.-J.; Tam, K.Y. The effects of post-adoption beliefs on the expectation-confirmation model for information technology continuance. Int. J. Human Comput. Stud. 2006, 64, 799–810. [Google Scholar] [CrossRef]
- Ajzen, I. The theory of planned behavior. Organ. Behav. Hum. Decis. Process. 1991, 50, 179–211. [Google Scholar] [CrossRef]
- Wixom, B.H.; Todd, P.A. A Theoretical Integration of User Satisfaction and Technology Acceptance. Inf. Syst. Res. 2005, 16, 85–102. [Google Scholar] [CrossRef]
- Lokuge, S.; Sedera, D. Deriving information systems innovation execution mechanisms. In Proceedings of the 25th Australasian Conference on Information Systems (ACIS), Auckland, New Zealand, 8–10 December 2014. [Google Scholar]
- Lokuge, S.; Sedera, D. Enterprise systems lifecycle-wide innovation readiness. In PACIS 2014 Proceedings; AIS Electronic Library (AISeL): Chengdu, China, 2014; pp. 1–14. [Google Scholar]
- Melville, N.; Kraemer, K.; Gurbaxani, V. Information technology and organizational performance: An integrative model of IT business value. MIS Q. 2004, 28, 283–322. [Google Scholar] [CrossRef] [Green Version]
- Delone, W.H.; McLean, E.R. Information Systems Success: The Quest for the Dependent Variable. Inf. Syst. Res. 1992, 3, 60–95. [Google Scholar] [CrossRef] [Green Version]
- Delone, W.H.; McLean, E.R. The DeLone and McLean Model of Information Systems Success: A Ten-Year Update. J. Manag. Inf. Syst. 2003, 19, 9–30. [Google Scholar] [CrossRef]
- Urbach, D.-W.-I.N.; Smolnik, S.; Riempp, G. The State of Research on Information Systems Success. Bus. Inf. Syst. Eng. 2009, 1, 315–325. [Google Scholar] [CrossRef] [Green Version]
- Adrian, C.; Abdullah, R.; Atan, R.; Jusoh, Y.Y. Factors influencing to the implementation success of big data analytics: A systematic literature review. In Proceedings of the 2017 International Conference on Research and Innovation in Information Systems (ICRIIS), Langkawi, Malaysia, 16–17 July 2017. [Google Scholar]
- Wang, Y.-S. Assessing e-commerce systems success: A respecification and validation of the DeLone and McLean model of IS success. Inf. Syst. J. 2008, 18, 529–557. [Google Scholar] [CrossRef]
- Urbach, N.; Smolnik, S.; Riempp, G. An empirical investigation of employee portal success. J. Strat. Inf. Syst. 2010, 19, 184–206. [Google Scholar] [CrossRef]
- Barki, H.; Huff, S.L. Change, attitude to change, and decision support system success. Inf. Manag. 1985, 9, 261–268. [Google Scholar] [CrossRef]
- Gelderman, M. The relation between user satisfaction, usage of information systems and performance. Inf. Manag. 1998, 34, 11–18. [Google Scholar] [CrossRef]
- Seddon, P.B. A Respecification and Extension of the DeLone and McLean Model of IS Success. Inf. Syst. Res. 1997, 8, 240–253. [Google Scholar] [CrossRef]
- Yuthas, K.; Young, S.T. Material matters: Assessing the effectiveness of materials management IS. Inf. Manag. 1998, 33, 115–124. [Google Scholar] [CrossRef]
- Burton-Jones, A.; Gallivan, M.J. Toward a deeper understanding of system usage in organizations: A multilevel perspective. MIS Q. 2007, 31, 657–679. [Google Scholar] [CrossRef] [Green Version]
- Chan, T.; Gable, G.; Sedera, D. ERP success: Does organisation size matter? In Proceedings of the 7th Pacific Asia Conference on Information Systems; University of South Australia: Adelaide, SA, Australia, 2003. [Google Scholar]
- Sedera, D.; Gable, G.; Chan, T. Knowledge management for ERP success. In Proceedings of the Seventh Pacific Asia Conference on Information Systems, PACIS 2003, Adelaide, SA, Australia, 10–13 July 2003. [Google Scholar]
- Abolfazli, S.; Sanaei, Z.; Tabassi, A.; Rosen, S.; Gani, A.; Khan, S.U. Cloud Adoption in Malaysia: Trends, Opportunities, and Challenges. IEEE Cloud Comput. 2015, 2, 60–68. [Google Scholar] [CrossRef]
- Arkes, H.R.; Blumer, C. The psychology of sunk cost. Organ. Behav. Hum. Decis. Process. 1985, 35, 124–140. [Google Scholar] [CrossRef]
- Ahtiala, P. The optimal pricing of computer software and other products with high switching costs. Int. Rev. Econ. Financ. 2006, 15, 202–211. [Google Scholar] [CrossRef] [Green Version]
- Benlian, A.; Vetter, J.; Hess, T. The role of sunk cost in consecutive IT outsourcing decisions. Z. Betr. 2012, 82, 181. [Google Scholar]
- Armbrust, M.; Fox, A.; Griffith, R.; Joseph, A.D.; Katz, R.; Konwinski, A.; Lee, G.; Patterson, D.; Rabkin, A.; Stoica, I.; et al. A view of cloud computing. Commun. ACM 2010, 53, 50–58. [Google Scholar] [CrossRef] [Green Version]
- Wei, Y.; Blake, M.B. Service-Oriented Computing and Cloud Computing: Challenges and Opportunities. IEEE Internet Comput. 2010, 14, 72–75. [Google Scholar] [CrossRef]
- Bughin, J.; Chui, M.; Manyika, J. Clouds, big data, and smart assets: Ten tech-enabled business trends to watch. McKinsey Q. 2010, 56, 75–86. [Google Scholar]
- Lin, H.-F. Understanding the determinants of electronic supply chain management system adoption: Using the technology–organization–environment framework. Technol. Forecast. Soc. Chang. 2014, 86, 80–92. [Google Scholar] [CrossRef]
- Tornatzky, L.G.; Fleischer, M.; Chakrabarti, A.K. Processes of technological innovation. In Lexington Books; Rowman & Littlefield Group, Inc.: Mitchellville, MD, USA, 1990. [Google Scholar]
- Oliveira, T.; Martins, M.F. Literature review of information technology adoption models at firm level. Electron. J. Inf. Syst. Eval. 2011, 14, 110–121. [Google Scholar]
- Chau, P.Y.K.; Tam, K.Y. Factors Affecting the Adoption of Open Systems: An Exploratory Study. MIS Q. 1997, 21, 1–24. [Google Scholar] [CrossRef]
- Yadegaridehkordi, E.; Iahad, N.A.; Ahmad, N. Task-Technology Fit Assessment of Cloud-Based Collabo-rative Learning Technologies. In Remote Work and Collaboration: Breakthroughs in Research and Practice; IGI Global: Hershey, PA, USA, 2017; p. 371. [Google Scholar]
- Yadegaridehkordi, E.; Iahad, N.A.; Ahmad, N. Task-technology fit and user adoption of cloud-based collaborative learning technologies. In Proceedings of the 2014 International Conference on Computer and Information Sciences (ICCOINS), Kuala Lumpur, Malaysia, 3–5 June 2014. [Google Scholar]
- Gupta, P.; Seetharaman, A.; Raj, J.R. The usage and adoption of cloud computing by small and medium businesses. Int. J. Inf. Manag. 2013, 33, 861–874. [Google Scholar] [CrossRef]
- Chong, A.Y.-L.; Lin, B.; Ooi, K.-B.; Raman, M. Factors affecting the adoption level of c-commerce: An empirical study. J. Comput. Inf. Syst. 2009, 50, 13–22. [Google Scholar]
- Oliveira, T.; Thomas, M.; Espadanal, M. Assessing the determinants of cloud computing adoption: An analysis of the manufacturing and services sectors. Inf. Manag. 2014, 51, 497–510. [Google Scholar] [CrossRef]
- Senyo, P.K.; Effah, J.; Addae, E. Preliminary insight into cloud computing adoption in a developing country. J. Enterp. Inf. Manag. 2016, 29, 505–524. [Google Scholar] [CrossRef]
- Klug, W.; Bai, X. The determinants of cloud computing adoption by colleges and universities. Int. J. Bus. Res. Inf. Technol. 2015, 2, 14–30. [Google Scholar]
- Cornu, B. Digital natives: How do they learn? How to teach them. UNESCO Inst. Inf. Technol. Educ. 2011, 52, 2–11. [Google Scholar]
- Oblinger, D.; Oblinger, J.L.; Lippincott, J.K. Educating the Net Generation; c2005. 1 v.(various pagings): Illustrations; EDUCAUSE: Boulder, CO, USA, 2005. [Google Scholar]
- Wymer, S.A.; Regan, E.A. Factors influencing e-commerce adoption and use by small and medium businesses. Electron. Mark. 2005, 15, 438–453. [Google Scholar] [CrossRef]
- Qasem, Y.A.; Abdullah, R.; Atan, R.; Jusoh, Y.Y. Mapping and Analyzing Process of Cloud-based Education as a Service (CEaaS) Model for Cloud Computing Adoption in Higher Education Institutions. In Proceedings of the 2018 Fourth International Conference on Information Retrieval and Knowledge Management (CAMP), Kota Kinabalu, Malaysia, 26–28 March 2018. [Google Scholar]
- Walther, S.; Sedera, D.; Sarker, S.; Eymann, T. Evaluating Operational Cloud Enterprise System Success: An Organizational Perspective. In ECIS 2013 Proceedings; Association for Information Systems: Atlanta, GA, USA, 2013. [Google Scholar]
- Wang, M.W.; Lee, O.-K.; Lim, K.H. Knowledge management systems diffusion in Chinese enterprises: A multi-stage approach with the technology-organization-environment framework. In PACIS 2007 Proceedings; Association for Information Systems: Atlanta, GA, USA, 2007. [Google Scholar]
- Liao, C.; Palvia, P.; Chen, J.-L. Information technology adoption behavior life cycle: Toward a Technology Continuance Theory (TCT). Int. J. Inf. Manag. 2009, 29, 309–320. [Google Scholar] [CrossRef]
- Rousseau, D.M. Issues of level in organizational research: Multilevel and cross-level perspectives. Res. Organ. Behav. 1985, 7, 1–37. [Google Scholar]
- Walther, S. An Investigation of Organizational Level Continuance of Cloud-Based Enterprise Systems. Ph.D. Thesis, University of Bayreuth, Bayreuth, Germany, 2014. [Google Scholar]
- Petter, S.; DeLone, W.; McLean, E. Measuring information systems success: Models, dimensions, measures, and interrelationships. Eur. J. Inf. Syst. 2018, 17, 236–263. [Google Scholar] [CrossRef]
- Robey, D.; Zeller, R.L. Factors Affecting the Success and Failure of an Information System for Product Quality. Interfaces 1978, 8, 70–75. [Google Scholar] [CrossRef]
- Aldholay, A.; Isaac, O.; Abdullah, Z.; Abdulsalam, R.; Al-Shibami, A.H. An extension of Delone and McLean IS success model with self-efficacy: Online learning usage in Yemen. Int. J. Inf. Learn. Technol. 2018, 35, 285–304. [Google Scholar] [CrossRef]
- Xu, J.D.; Benbasat, I.; Cenfetelli, R.T. Integrating Service Quality with System and Information Quality: An Empirical Test in the E-Service Context. MIS Q. 2013, 37, 777–794. [Google Scholar] [CrossRef]
- Spears, J.L.; Barki, H. User Participation in Information Systems Security Risk Management. MIS Q. 2010, 34, 503. [Google Scholar] [CrossRef] [Green Version]
- Lee, S.; Shin, B.; Lee, H.G. Understanding post-adoption usage of mobile data services: The role of supplier-side variables. J. Assoc. Inf. Syst. 2009, 10, 2. [Google Scholar] [CrossRef] [Green Version]
- Alshare, K.A.; Freeze, R.D.; Lane, P.L.; Wen, H.J. The impacts of system and human factors on online learning systems use and learner satisfaction. Decis. Sci. J. Innov. Educ. 2011, 9, 437–461. [Google Scholar] [CrossRef]
- Benlian, A.; Koufaris, M.; Hess, T. Service Quality in Software-as-a-Service: Developing the SaaS-Qual Measure and Examining Its Role in Usage Continuance. J. Manag. Inf. Syst. 2011, 28, 85–126. [Google Scholar] [CrossRef]
- Oblinger, D. Boomers gen-xers millennials. Educ. Rev. 2003, 500, 37–47. [Google Scholar]
- Monaco, M.; Martin, M. The Millennial Student: A New Generation of Learners. Athl. Train. Educ. J. 2007, 2, 42–46. [Google Scholar] [CrossRef]
- White, B.J.; Brown, J.A.E.; Deale, C.S.; Hardin, A.T. Collaboration using cloud computing and traditional systems. Issues Inf. Syst. 2009, 10, 27–32. [Google Scholar]
- Nkhoma, M.Z.; Dang, D.P.; De Souza-Daw, A. Contributing factors of cloud computing adoption: A technology-organisation-environment framework approach. In Proceedings of the European Conference on Information Management & Evaluation, Gdansk, Poland, 12–13 September 2013. [Google Scholar]
- Zhu, K.; Dong, S.; Xu, S.X.; Kraemer, K.L. Innovation diffusion in global contexts: Determinants of post-adoption digital transformation of European companies. Eur. J. Inf. Syst. 2006, 15, 601–616. [Google Scholar] [CrossRef]
- Zhu, K.; Kraemer, K.L.; Xu, S. The Process of Innovation Assimilation by Firms in Different Countries: A Technology Diffusion Perspective on E-Business. Manag. Sci. 2006, 52, 1557–1576. [Google Scholar] [CrossRef] [Green Version]
- Alam, S.S.; Ali, Y.; Jani, M.F.M. An empirical study of factors affecting electronic commerce adoption among smes in malaysia/veiksnių, turinčių įtakos elektorinei prekybai, studija: Malaizijos pavyzdys. J. Bus. Econ. Manag. 2011, 12, 375–399. [Google Scholar] [CrossRef] [Green Version]
- Ifinedo, P. Internet/e-business technologies acceptance in Canada’s SMEs: An exploratory investigation. Internet Res. 2011, 21, 255–281. [Google Scholar] [CrossRef]
- Creswell, J.W.; Creswell, J.D. Research Design: Qualitative, Quantitative, and Mixed Methods Approaches; SAGE Publications: Thousand Oaks, CA, USA, 2017. [Google Scholar]
- Moore, G.C.; Benbasat, I. Development of an instrument to measure the perceptions of adopting an information technology innovation. Inf. Syst. Res. 1991, 2, 192–222. [Google Scholar] [CrossRef] [Green Version]
- Wu, K.; Vassileva, J.; Zhao, Y. Understanding users’ intention to switch personal cloud storage services: Evidence from the Chinese market. Comput. Hum. Behav. 2017, 68, 300–314. [Google Scholar] [CrossRef]
- Kelley, D.L. Measurement Made Accessible: A Research Approach Using Qualitative, Quantitative and Quality Improvement Methods; Sage Publications: Thousand Oaks, CA, USA, 1999. [Google Scholar]
- McKenzie, J.F.; Wood, M.L.; Kotecki, J.E.; Clark, J.K.; Brey, R.A. Establishing content validity: Using qualitative and quantitative steps. Am. J. Health Behav. 1999, 23, 311–318. [Google Scholar] [CrossRef]
- Hertzog, M.A. Considerations in determining sample size for pilot studies. Res. Nurs. Health 2008, 31, 180–191. [Google Scholar] [CrossRef] [PubMed]
- Saunders, M.N. Research Methods for Business Students, 5th ed.; Pearson Education: Bangalore, India, 2011. [Google Scholar]
- Sekaran, U.; Bougie, R. Research Methods For Business, A Skill Building Approach; John Willey & Sons Inc.: New York, NY, USA, 2003. [Google Scholar]
- Tellis, W. Introduction to case study. Qual. Rep. 1997, 3, 1–14. [Google Scholar] [CrossRef]
- Whitehead, A.L.; Julious, S.A.; Cooper, C.L.; Campbell, M.J. Estimating the sample size for a pilot randomised trial to minimise the overall trial sample size for the external pilot and main trial for a continuous outcome variable. Stat. Methods Med. Res. 2009, 25, 1057–1073. [Google Scholar] [CrossRef] [PubMed]
- Haladyna, T.M. Developing and validating multiple-choice test items; Routledge: New York, NY, USA, 2004. [Google Scholar]
- Briggs, R.O.; Reinig, B.A.; de Vreede, G.-J. The yield shift theory of satisfaction and its application to the IS/IT domain. J. Assoc. Inf. Syst. 2008, 9, 267. [Google Scholar] [CrossRef]
- Rushinek, A.; Rushinek, S.F. What makes users happy? Commun. ACM 1986, 29, 594–598. [Google Scholar] [CrossRef]
- Oliver, R.L. Measurement and evaluation of satisfaction processes in retail settings. J. Retail. 1981, 57, 25–48. [Google Scholar]
- Swanson, E.B.; Dans, E. System life expectancy and the maintenance effort: Exploring their equilibration. MIS Q. 2000, 24, 277–297. [Google Scholar] [CrossRef] [Green Version]
- Gill, T.G. Early Expert Systems: Where Are They Now? MIS Q. 1995, 19, 51. [Google Scholar] [CrossRef]
- Keil, M.; Mann, J.; Rai, A. Why software projects escalate: An empirical analysis and test of four theoretical models. MIS Q. 2000, 24, 631–664. [Google Scholar] [CrossRef]
- Campion, M.A.; Medsker, G.J.; Higgs, A.C. Relations between work group characteristics and effectiveness: Implications for designing effective work groups. Pers. Psychol. 1993, 46, 823–847. [Google Scholar] [CrossRef]
- Baas, P. Task-Technology Fit in the Workplace: Affecting Employee Satisfaction and Productivity; Erasmus Universiteit: Rotterdam, The Netherlands, 2010. [Google Scholar]
- Doolin, B.; Troshani, I. Organizational Adoption of XBRL. Electron. Mark. 2007, 17, 199–209. [Google Scholar] [CrossRef]
- Segars, A.H.; Grover, V. Strategic Information Systems Planning Success: An Investigation of the Construct and Its Measurement. MIS Q. 1998, 22, 139. [Google Scholar] [CrossRef]
- Faul, F.; Erdfelder, E.; Buchner, A.; Lang, A.-G. Statistical power analyses using G*Power 3.1: Tests for correlation and regression analyses. Behav. Res. Methods 2009, 41, 1149–1160. [Google Scholar] [CrossRef] [Green Version]
- Vidaver-Cohen, D. Moral Climate in Business Firms: A Conceptual Framework for Analysis and Change. J. Bus. Ethic 1998, 17, 1211–1226. [Google Scholar] [CrossRef]
- Daniel, J. Sampling Essentials: Practical Guidelines for Making Sampling Choices; Sage Publications: Thousand Oaks, CA, USA, 2011. [Google Scholar]
- Sibona, C.; Walczak, S. Purposive Sampling on Twitter: A Case Study. In Proceedings of the 2012 45th Hawaii International Conference on System Sciences, Maui, HI, USA, 4–7 January 2012. [Google Scholar]
- Hair, J.F.; Ringle, C.M.; Sarstedt, M. PLS-SEM: Indeed a Silver Bullet. J. Mark. Theory Pr. 2011, 19, 139–152. [Google Scholar] [CrossRef]
- Chin, W.W. How to Write Up and Report PLS Analyses. In Handbook of Partial Least Squares; Springer: Berlin/Heidelberg, Germany, 2009; pp. 655–690. [Google Scholar]
- Hair, J.F., Jr.; Hult, G.T.M.; Ringle, C.; Sarstedt, M. A Primer on Partial Least Squares Structural Equation Modeling (PLS-SEM); Sage Publications: Thousand Oaks, CA, USA, 2016. [Google Scholar]
- Ramayah, T.; Cheah, J.; Chuah, F.; Ting, H.; Memon, M.A. Partial Least Squares Structural Equation Modeling (PLS-SEM) Using SmartPLS 3.0: An Updated and Practical Guide to Statistical Analysis; Pearson: Singapore, 2016. [Google Scholar]
- Fornell, C.; Larcker, D.F. Evaluating structural equation models with unobservable variables and measurement error. J. Mark. Res. 1981, 18, 39–50. [Google Scholar] [CrossRef]
- Jung, T. AMOS and Research Methods; Wunan: Taipei, Taiwan, 2008. [Google Scholar]
- Barclay, D.; Higgins, C.; Thompson, R. The partial least squares (PLS) approach to casual modeling: Personal computer adoption ans use as an Illustration. Technol. Stud. 1995, 2, 285–309. [Google Scholar]
- Podsakoff, P.M.; MacKenzie, S.B.; Lee, J.Y.; Podsakoff, N.P. Common method biases in behavioral research: A critical review of the literature and recommended remedies. J. Appl. Psychol. 2003, 88, 879–903. [Google Scholar] [CrossRef]
- Klassen, R.D.; Whybark, D.C. The impact of environmental technologies on manufacturing performance. Acad. Manag. J. 1999, 42, 599–615. [Google Scholar]
- Chin, W.W. The partial least squares approach to structural equation modeling. Mod. Methods Bus. Res. 1998, 295, 295–336. [Google Scholar]
- Cohen, J. Statistical Power Analysis for the Behavioral Sciences; Academic Press: Cambridge, MA, USA, 2013. [Google Scholar]
- Stone, M. Cross-Validatory Choice and Assessment of Statistical Predictions. J. R. Stat. Soc. Ser. B Stat. Methodol. 1974, 36, 111–133. [Google Scholar] [CrossRef]
- Geisser, S. A predictive approach to the random effect model. Biometrika 1974, 61, 101–107. [Google Scholar] [CrossRef]
- Fornell, C. Partial least squares. In Advanced Methods of Marketing Research; Basil Black-Well Ltd.: Cambridge, MA, USA, 1994. [Google Scholar]
- Hair, J.F., Jr.; Sarstedt, M.; Ringle, C.M.; Gudergan, S.P. Advanced Issues in Partial Least Squares Structural Equation Modeling; Sage Publications: Thousand Oaks, CA, USA, 2017. [Google Scholar]
- Dai, H.M.; Teo, T.; Rappa, N.A.; Huang, F. Explaining Chinese university students’ continuance learning intention in the MOOC setting: A modified expectation confirmation model perspective. Comput. Educ. 2020, 150, 103850. [Google Scholar] [CrossRef]
- Al-Emran, M.; Arpaci, I.; Salloum, S.A. An empirical examination of continuous intention to use m-learning: An integrated model. Educ. Inf. Technol. 2020, 25, 2899–2918. [Google Scholar] [CrossRef]
- Fitzgerald, G.; Russo, N.L. The turnaround of the London Ambulance Service Computer-Aided Despatch system (LASCAD). Eur. J. Inf. Syst. 2005, 14, 244–257. [Google Scholar] [CrossRef]
- Qasem, Y.A.; Abdullah, R.; Atan, R.; Jusoh, Y.Y. Cloud-Based Education As a Service (CEAAS) System Requirements Specification Model of Higher Education Institutions in Industrial Revolution 4.0. Int. J. Recent Technol. Eng. (IJRTE) 2019, 8, 1386–1392. [Google Scholar]
- Zhou, T.; Lu, Y.; Wang, B. Integrating TTF and UTAUT to explain mobile banking user adoption. Comput. Hum. Behav. 2010, 26, 760–767. [Google Scholar] [CrossRef]
- Asadi, S.; Pourhashemi, S.O.; Nilashi, M.; Abdullah, R.; Samad, S.; Yadegaridehkordi, E.; Aljojo, N.; Razali, N.S. Investigating influence of green innovation on sustainability performance: A case on Malaysian hotel industry. J. Clean. Prod. 2020, 258, 120860. [Google Scholar] [CrossRef]
- Sabi, H.M.; Uzoka, F.-M.E.; Langmia, K.; Njeh, F.N.; Tsuma, C.K. A cross-country model of contextual factors impacting cloud computing adoption at universities in sub-Saharan Africa. Inf. Syst. Front. 2018, 20, 1381–1404. [Google Scholar] [CrossRef]
- Tashkandi, A.N.; Al-Jabri, I.M. Cloud computing adoption by higher education institutions in Saudi Arabia: An exploratory study. Clust. Comput. 2015, 18, 1527–1537. [Google Scholar] [CrossRef]
- Hair, J.F.; Ringle, C.M.; Sarstedt, M. Partial least squares structural equation modeling: Rigorous applications, better results and higher acceptance. Long Range Plan. 2013, 46, 1–12. [Google Scholar] [CrossRef]
- Yoo, Y.; Henfridsson, O.; Lyytinen, K. Research commentary—the new organizing logic of digital innovation: An agenda for information systems research. Inf. Syst. Res. 2010, 21, 724–735. [Google Scholar] [CrossRef]
- Nylén, D.; Holmström, J. Digital innovation strategy: A framework for diagnosing and improving digital product and service innovation. Bus. Horiz. 2015, 58, 57–67. [Google Scholar] [CrossRef] [Green Version]
- Benlian, A.; Hess, T. Opportunities and risks of software-as-a-service: Findings from a survey of IT execu-tives. Decis. Support Syst. 2011, 52, 232–246. [Google Scholar] [CrossRef]
- Chen, X.; Xie, H.; Zou, D.; Hwang, G.-J. Application and theory gaps during the rise of Artificial Intelligence in Education. Comput. Educ. Artif. Intell. 2020, 1, 100002. [Google Scholar] [CrossRef]
- Daniel, B. Big Data and analytics in higher education: Opportunities and challenges. Br. J. Educ. Technol. 2015, 46, 904–920. [Google Scholar] [CrossRef]
- Picciano, A.G. The Evolution of Big Data and Learning Analytics in American Higher Education. Online Learn. 2012, 16, 9–20. [Google Scholar] [CrossRef] [Green Version]
- Wu, H.-K.; Lee, S.W.-Y.; Chang, H.-Y.; Liang, J.-C. Current status, opportunities and challenges of augmented reality in education. Comput. Educ. 2013, 62, 41–49. [Google Scholar] [CrossRef]
- Maksimovic, M. Green Internet of Things (G-IoT) at engineering education institution: The classroom of tomorrow. Green Internet Things 2017, 16, 270–273. [Google Scholar]
- Fortino, G.; Rovella, A.; Russo, W.; Savaglio, C. Towards cyberphysical digital libraries: Integrating IoT smart objects into digital libraries. In Management of Cyber Physical Objects in the Future Internet of Things; Springer: Cham, Switzerland, 2016; pp. 135–156. [Google Scholar]
- Bernacki, M.L.; Greene, J.A.; Crompton, H. Mobile technology, learning, and achievement: Advances in understanding and measuring the role of mobile technology in education. Contemp. Educ. Psychol. 2020, 60, 101827. [Google Scholar] [CrossRef]
- Ford, S.; Minshall, T. Invited review article: Where and how 3D printing is used in teaching and education. Addit. Manuf. 2019, 25, 131–150. [Google Scholar] [CrossRef]
- Yassin, A.; Razak, N.A.; Qasem, Y.; Mohammed, M.S. Intercultural Learning Challenges Affecting International Students’ Sustainable Learning in Malaysian Higher Education Institutions. Sustainability 2020, 12, 7490. [Google Scholar] [CrossRef]
Figure 1.
Research operational framework.

Figure 2.
Gap analysis using taxonomy of research literature on the adoption CC in HEIs.

Figure 3.
Expectation–confirmation model of IS continuance (Bhattacherjee [47]).
Figure 3.
Expectation–confirmation model of IS continuance (Bhattacherjee [47]).

Figure 4.
Proposed Model.

Figure 5.
G*power interface and settings.

Figure 6.
Summary of adopted CC service types.

Figure 7.
Path coefficient.

Figure 8.
The structural model results.

Figure 9.
IPMA Map.

Table 1.
The literature on CC Continuance.
| Source | Level of Analysis | Adoption Phase | Theoretical Perspective | Type | |||||||
|---|---|---|---|---|---|---|---|---|---|---|---|
| IND | ORG | PRE | POST | ISC | ISS | ISD | TOE | OTH | EMP | THEO | |
| [35] | √ | √ | √ | √ | |||||||
| [38] * | √ | √ | √ | √ | |||||||
| [39] | √ | √ | √ | √ | √ | ||||||
| [40] | √ | √ | √ | √ | √ | ||||||
| [36] ** | √ | √ | √ | √ | √ | ||||||
| [41] | √ | √ | √ | √ | |||||||
| [42] | √ | √ | √ | √ | √ | ||||||
| [43] | √ | √ | √ | √ | |||||||
| [15] | √ | √ | √ | √ | √ | ||||||
| [44] | √ | √ | √ | √ | |||||||
| [17] * | √ | √ | √ | √ | √ | √ | |||||
| [11] | √ | √ | √ | √ | √ | ||||||
| [45] | √ | √ | √ | √ | |||||||
| SUM | 5 | 9 | 2 | 13 | 6 | 5 | 2 | 2 | 3 | 12 | 1 |
| This Research | √ | √ | √ | √ | √ | √ | |||||
Legend: ORGA = Organizational Level; IND = Individual Level; PRE = Pre-Adoption; POST = Post-Adoption; TECH = Technological Constructs; ORGA = Organizational Constructs; ENV = Environmental Constructs; OTH = Others; THEO = Theoretical/Conceptual; EMP = Empirical. * Study examines adopters’ and non-adopters’ intention to increase the level of sourcing; thus, it is categorized as adoption. ** Study examines adopters’ intention at individual and organizational levels; thus, it is categorized as an individual.
Table 2.
Mapping analysis matrix of model constructs from ISC, ISS, ISD, and TOE.
| Theory/ Model | Technology/Dependent Variable | Source | Constructs/Independent Variables | |||||||||
|---|---|---|---|---|---|---|---|---|---|---|---|---|
| Technology | Organization | Environment | ||||||||||
| SAT | CON | NB | TI | SQ | IQ | SI | COL | RP | CP | |||
| ISD | Organizational level information System discontinuance intentions | [12] | √ | √ | √ | |||||||
| ISC | Information system continuance | [47] | √ | √ | ||||||||
| ISS | Information system success | [58,59] | √ | √ | √ | √ | ||||||
| ECM & TOE | Enterprise 2.0 post-adoption | [15] | √ | √ | √ | |||||||
| TAM | Continuance intention to use CC | [44] | ||||||||||
| ISC & OTH | Disruptive technology continuous adoption intentions | [17] | √ | √ | ||||||||
| ISS | CC evaluation | [41] | √ | √ | √ | |||||||
| ISS & ISD | Cloud-Based Enterprise Systems | [39] | √ | √ | √ | √ | √ | |||||
| ISC | SaaS-based collaboration tools | [38] | √ | √ | ||||||||
| ISC | CC client-provider relationship | [35] | √ | √ | ||||||||
| ISC | Operational Cloud Enterprise System | [93] | √ | √ | √ | |||||||
| OTH | Usage and adoption of CC by SMEs | [84] | √ | |||||||||
| TOE | Knowledge management systems diffusion | [94] | √ | |||||||||
| TCT | Information technology adoption behaviour life cycle | [95] | √ | √ | ||||||||
| ISC | Wearable Continuance | [45] | √ | √ | √ | |||||||
Table 3.
Constructs and their definitions.
| Constructs | Definition | References | Previous Studies |
|---|---|---|---|
| NB (Formative) | The degree to which information systems provide benefits to organizations, groups, or individuals | [54,58,59] | [11,39,41,93] |
| SQ (Formative) | The features (such as timeliness, reliability, or easy use) regarding the desired service or system | [54,58,59] | [11,39,41,93] |
| IQ (Formative) | The set of desired features concerning system output (e.g., relevance, format, or comprehensiveness) | [54,58,59] | [11,39,41,93] |
| CON (Reflective) | The degree to which users of an organization are content about the outcomes being in line, or exceeding, their expectations and requirements, or the scenario where the outcomes are not as per the expectation | [47,125,126] | [15,38] |
| Satisfaction (Reflective) | A psychological feeling resulting from not achieving the expectations of user, compared to the previous experience | [47,127] | [15,17,38] |
| TI (Reflective) | The degree to which an IS relies on intricate connections with varies technological elements | [12,128] | [11,39] |
| SI (Reflective) | The resources required for an institution to maintain and continue using an IS | [12,129,130] | [11,39] |
| COL (Reflective) | The degree to which CC services facilitate collaboration and cooperation between the stakeholders of an organization | [131,132] | [82,83,84,85] |
| RP (Reflective) | The degree to which the continuance of CC decision is supported, pressured, or protected by the government policy | [88,109,110] | [86,87] |
| CP (Reflective) | The result of a competitor’s ability to gain better KPIs as a consequence of using CC services (e.g., high-performance) | [110,111,133] | [15,86] |
| Continuance Intention(Reflective) | The degree to which decision-makers would continue using an IS in organizations | [12,47] | [15,17,38] |
Table 4.
Characteristics of the study sample.
| Characteristics | Frequency | Percentage | Characteristics | Frequency | Percentage |
|---|---|---|---|---|---|
| Experience | Technology Selection Responsible | ||||
| <1 | 0 | 0.00 | CIO | 117 | 83.57 |
| 1–5 | 21 | 15.00 | ICT Director | 118 | 84.29 |
| 6–10 | 43 | 30.71 | Institution Administration | 35 | 25.00 |
| 11–15 | 43 | 30.71 | IT Department | 119 | 85.00 |
| 15–20 | 9 | 6.43 | Faculties/Schools | 15 | 10.71 |
| >20 | 24 | 17.14 | Institution Council | 8 | 5.71 |
| Profession | Government/Ministry | 13 | 9.29 | ||
| VC/Deputy VC | 5 | 3.57 | Availability of CC Service Models | ||
| CEO/ICT Director | 15 | 10.71 | SaaS | 139 | 99.29 |
| Administrator | 4 | 2.86 | PaaS | 38 | 27.14 |
| HoD/Division/Section/Unit | 65 | 46.43 | IaaS | 25 | 17.86 |
| IT officer | 36 | 25.71 | Cloud Service Provider | ||
| ICT Support | 2 | 1.43 | Amazon | 5 | 3.57 |
| Others | 13 | 9.29 | Oracle | 7 | 5.00 |
| Qualification | Microsoft | 109 | 77.86 | ||
| Diploma | 1 | 0.71 | Salesforce.com | 0 | 0.00 |
| Bachelor | 78 | 55.71 | 119 | 85.00 | |
| Master | 39 | 27.86 | Others | 18 | 12.86 |
| Ph.D | 22 | 15.71 | Type of CC Service Adopted | ||
| Age of the Institution | 125 | 89.29 | |||
| <5 years | 0 | 0.00 | E-Learning Systems | 21 | 15.00 |
| 5–10 years | 5 | 3.57 | Learning Management Systems | 30 | 21.43 |
| 11–20 years | 44 | 31.43 | MOOC | 39 | 27.86 |
| 21–50 years | 61 | 43.57 | Institution Website or Portal | 48 | 34.29 |
| >50 years | 30 | 21.43 | File Backup and Storage | 115 | 82.14 |
| Time Since Adoption | Office Productivity Suite | 101 | 72.14 | ||
| <1 | 2 | 1.43 | Online Collaboration or Conferencing | 19 | 13.57 |
| 1–3 | 32 | 22.86 | File Sharing | 22 | 15.71 |
| 3–5 | 61 | 43.57 | Student Record System | 11 | 7.86 |
| >5 | 43 | 30.71 | ERP System | 1 | 0.71 |
| Project Management System | 5 | 3.57 | |||
| Virtual Lab Environment | 9 | 6.43 | |||
| Others | 5 | 3.57 | |||
Table 5.
Quantitative assessment of the reflective measurement model (reliability and convergent validity).
Table 5.
Quantitative assessment of the reflective measurement model (reliability and convergent validity).
| Constructs | Indicators | Outer Loadings | Composite Reliability (CR) | Cronbach’s Alpha (CA) | AVE |
|---|---|---|---|---|---|
| CCCU | CCCU1 | 0.872 | 0.91 | 0.85 | 0.771 |
| CCCU2 | 0.92 | ||||
| CCCU3 | 0.84 | ||||
| COL | Col1 | 0.846 | 0.93 | 0.905 | 0.726 |
| Col2 | 0.804 | ||||
| Col3 | 0.894 | ||||
| Col4 | 0.849 | ||||
| Col5 | 0.866 | ||||
| CP | CP1 | 0.735 | 0.896 | 0.845 | 0.684 |
| CP2 | 0.879 | ||||
| CP3 | 0.885 | ||||
| CP4 | 0.8 | ||||
| CON | Conf1 | 0.699 | 0.896 | 0.854 | 0.634 |
| Conf2 | 0.757 | ||||
| Conf3 | 0.851 | ||||
| Conf4 | 0.852 | ||||
| Conf5 | 0.812 | ||||
| RP | RP1 | 0.732 | 0.901 | 0.864 | 0.647 |
| RP2 | 0.858 | ||||
| RP3 | 0.84 | ||||
| RP4 | 0.754 | ||||
| RP5 | 0.83 | ||||
| SAT | Sat1 | 0.789 | 0.917 | 0.879 | 0.734 |
| Sat2 | 0.883 | ||||
| Sat3 | 0.901 | ||||
| Sat4 | 0.85 | ||||
| SI | SI1 | 0.911 | 0.931 | 0.89 | 0.819 |
| SI2 | 0.881 | ||||
| SI3 | 0.923 | ||||
| TI | TI1 | 0.873 | 0.893 | 0.821 | 0.736 |
| TI2 | 0.842 | ||||
| TI3 | 0.859 |
Table 6.
Fornell-Larcker criterion analysis.
| CCCU | COL | CP | Conf | RP | SAT | SI | TI | |
|---|---|---|---|---|---|---|---|---|
| CCCU | 0.878 | - | - | - | - | - | - | - |
| COL | 0.671 | 0.852 | - | - | - | - | - | - |
| CP | −0.392 | −0.318 | 0.827 | - | - | - | - | - |
| Conf | −0.381 | −0.605 | 0.331 | 0.796 | - | - | - | - |
| RP | 0.47 | 0.502 | −0.635 | −0.442 | 0.804 | - | - | - |
| SAT | 0.431 | 0.658 | −0.332 | −0.699 | 0.434 | 0.857 | - | - |
| SI | 0.775 | 0.598 | −0.444 | −0.437 | 0.441 | 0.446 | 0.905 | - |
| TI | 0.671 | 0.447 | −0.284 | −0.257 | 0.287 | 0.356 | 0.502 | 0.858 |
Table 7.
Loading and cross-loading of measures.
| CCCU | COL | Conf | CP | RP | SAT | SI | TI | |
|---|---|---|---|---|---|---|---|---|
| CCCU1 | 0.872 | 0.636 | −0.371 | −0.37 | 0.494 | 0.41 | 0.705 | 0.536 |
| CCCU2 | 0.92 | 0.57 | −0.31 | −0.358 | 0.4 | 0.373 | 0.681 | 0.601 |
| CCCU3 | 0.84 | 0.561 | −0.324 | −0.304 | 0.342 | 0.352 | 0.655 | 0.63 |
| COL1 | 0.559 | 0.846 | −0.508 | −0.195 | 0.383 | 0.565 | 0.499 | 0.388 |
| COL2 | 0.531 | 0.804 | −0.556 | −0.288 | 0.425 | 0.561 | 0.505 | 0.363 |
| COL3 | 0.559 | 0.894 | −0.542 | −0.233 | 0.421 | 0.544 | 0.496 | 0.386 |
| COL4 | 0.601 | 0.849 | −0.505 | −0.298 | 0.44 | 0.516 | 0.504 | 0.366 |
| COL5 | 0.602 | 0.866 | −0.476 | −0.335 | 0.466 | 0.619 | 0.543 | 0.398 |
| CON1 | −0.286 | −0.447 | 0.699 | 0.325 | −0.421 | −0.468 | −0.278 | −0.166 |
| CON2 | −0.362 | −0.531 | 0.757 | 0.259 | −0.401 | −0.536 | −0.415 | −0.24 |
| CON3 | −0.236 | −0.404 | 0.851 | 0.192 | −0.239 | −0.57 | −0.34 | −0.186 |
| CON4 | −0.311 | −0.497 | 0.852 | 0.256 | −0.339 | −0.573 | −0.353 | −0.182 |
| CON5 | −0.318 | −0.52 | 0.812 | 0.29 | −0.363 | −0.622 | −0.346 | −0.24 |
| CP1 | −0.283 | −0.214 | 0.203 | 0.735 | −0.615 | −0.206 | −0.317 | −0.219 |
| CP2 | −0.303 | −0.212 | 0.302 | 0.879 | −0.517 | −0.264 | −0.369 | −0.225 |
| CP3 | −0.405 | −0.342 | 0.298 | 0.885 | −0.52 | −0.332 | −0.433 | −0.291 |
| CP4 | −0.281 | −0.26 | 0.284 | 0.8 | −0.464 | −0.279 | −0.329 | −0.185 |
| RP1 | 0.348 | 0.381 | −0.398 | −0.534 | 0.732 | 0.347 | 0.292 | 0.234 |
| RP2 | 0.367 | 0.406 | −0.371 | −0.449 | 0.858 | 0.402 | 0.387 | 0.195 |
| RP3 | 0.349 | 0.379 | −0.383 | −0.513 | 0.84 | 0.377 | 0.344 | 0.191 |
| RP4 | 0.28 | 0.338 | −0.283 | −0.513 | 0.754 | 0.262 | 0.286 | 0.21 |
| RP5 | 0.489 | 0.48 | −0.34 | −0.544 | 0.83 | 0.345 | 0.426 | 0.299 |
| SAT1 | 0.278 | 0.494 | −0.49 | −0.328 | 0.389 | 0.789 | 0.314 | 0.245 |
| SAT2 | 0.413 | 0.605 | −0.633 | −0.283 | 0.378 | 0.883 | 0.42 | 0.341 |
| SAT3 | 0.425 | 0.642 | −0.633 | −0.27 | 0.4 | 0.901 | 0.453 | 0.293 |
| SAT4 | 0.343 | 0.5 | −0.627 | −0.27 | 0.323 | 0.85 | 0.325 | 0.335 |
| SI1 | 0.718 | 0.504 | −0.344 | −0.378 | 0.38 | 0.334 | 0.911 | 0.461 |
| SI2 | 0.663 | 0.582 | −0.453 | −0.438 | 0.42 | 0.476 | 0.881 | 0.461 |
| SI3 | 0.722 | 0.543 | −0.395 | −0.393 | 0.399 | 0.406 | 0.923 | 0.442 |
| TI1 | 0.62 | 0.409 | −0.21 | −0.219 | 0.295 | 0.267 | 0.412 | 0.873 |
| TI2 | 0.537 | 0.377 | −0.263 | −0.241 | 0.221 | 0.346 | 0.403 | 0.842 |
| TI3 | 0.565 | 0.362 | −0.192 | −0.273 | 0.217 | 0.31 | 0.478 | 0.859 |
Table 8.
Quantitative assessment of the formative measurement model.
| Constructs | Indicators | Convergent Validity | Outer Weights | Loadings | VIF | t-Value Weights | Sig |
|---|---|---|---|---|---|---|---|
| NB | NB1 | 0.75 | 0.170 | 0.763 | 2.413 | 2.444 | 0.015 |
| NB2 | - | 0.161 | 0.785 | 2.585 | 1.845 | 0.065 | |
| NB3 | - | −0.052 | 0.731 | 3.331 | 0.754 | 0.451 | |
| NB4 | - | 0.075 | 0.705 | 2.642 | 0.894 | 0.371 | |
| NB5 | - | 0.164 | 0.636 | 1.622 | 2.699 | 0.007 | |
| NB6 | - | 0.146 | 0.742 | 2.947 | 1.942 | 0.052 | |
| NB7 | - | 0.241 | 0.771 | 2.501 | 2.634 | 0.008 | |
| NB8 | - | 0.052 | 0.719 | 2.965 | 0.837 | 0.403 | |
| NB9 | - | 0.123 | 0.748 | 3.890 | 1.206 | 0.228 | |
| NB10 | - | 0.137 | 0.580 | 1.480 | 2.234 | 0.026 | |
| NB11 | - | 0.018 | 0.751 | 3.052 | 0.243 | 0.808 | |
| NB12 | - | 0.176 | 0.619 | 1.484 | 3.284 | 0.001 | |
| SQ | SQ1 | 0.704 | 0.162 | 0.752 | 2.032 | 2.404 | 0.016 |
| SQ2 | - | 0.151 | 0.654 | 1.850 | 2.436 | 0.015 | |
| SQ3 | - | 0.156 | 0.733 | 1.921 | 2.776 | 0.006 | |
| SQ4 | - | 0.117 | 0.653 | 1.598 | 2.19 | 0.029 | |
| SQ5 | - | 0.155 | 0.756 | 2.087 | 2.358 | 0.018 | |
| SQ6 | - | −0.003 | 0.670 | 2.151 | 0.048 | 0.962 | |
| SQ7 | - | 0.261 | 0.738 | 1.803 | 3.980 | 0.000 | |
| SQ8 | - | 0.044 | 0.445 | 1.394 | 0.780 | 0.435 | |
| SQ9 | - | 0.031 | 0.599 | 1.751 | 0.495 | 0.621 | |
| SQ10 | - | 0.025 | 0.574 | 1.571 | 0.507 | 0.612 | |
| SQ11 | - | 0.119 | 0.687 | 1.828 | 2.077 | 0.038 | |
| SQ12 | - | 0.201 | 0.727 | 1.723 | 3.382 | 0.001 | |
| IQ | IQ1 | 0.867 | −0.119 | 0.712 | 2.977 | 1.047 | 0.295 |
| IQ2 | - | 0.289 | 0.783 | 4.026 | 2.082 | 0.037 | |
| IQ3 | - | 0.428 | 0.874 | 2.407 | 3.960 | 0.000 | |
| IQ4 | - | 0.249 | 0.769 | 4.158 | 1.626 | 0.104 | |
| IQ5 | - | 0.406 | 0.863 | 3.848 | 3.163 | 0.002 | |
| IQ6 | - | −0.089 | 0.647 | 3.134 | 0.727 | 0.467 |
Table 9.
Lateral collinearity assessment (inner VIF values).
| Constructs | CCCU (VIF) | NB (VIF) | SAT (VIF) |
|---|---|---|---|
| COL | 2.702 | - | - |
| CP | 2.087 | - | - |
| Conf | - | 1 | 1.822 |
| IQ | 3.644 | - | 2.486 |
| NB | 4.480 | - | 3.826 |
| RP | 2.102 | - | |
| SAT | 4.291 | - | - |
| SI | 2.441 | - | - |
| SQ | 4.928 | - | 3.574 |
| TI | 1.657 | - | - |
Table 10.
Model Fit Indicator (R2 values for the dependent variables).
| Endogenous Construct | R Square | Level of Explanatory Power |
|---|---|---|
| CCCU | 0.852 | substantial |
| NB | 0.439 | moderate |
| SAT | 0.764 | substantial |
Table 11.
Summary of results for the structural model.
| Hypothesis | Relationship | Path Coefficients (β) | t-Value | Decision | R2 | f2 | Q2 | q2 |
|---|---|---|---|---|---|---|---|---|
| H2b | CON -> NB | 0.663 | 14.94 ** | Supported | 0.439 | 0.784 | 0.214 | 0.138 |
| H5a | IQ -> SAT | 0.389 | 5.014 ** | Supported | 0.764 | 0.259 | 0.53 | 0.074 |
| H2a | CON -> SAT | 0.300 | 3.086 ** | Supported | 0.211 | 0.000 | ||
| H3a | NB -> SAT | 0.116 | 0.998 | Rejected | 0.015 | 0.048 | ||
| H4a | SQ -> SAT | 0.208 | 2.144 * | Supported | 0.051 | 0.272 | ||
| H1 | SAT -> CCCU | 0.516 | 5.776 ** | Supported | 0.852 | 0.42 | 0.624 | 0.015 |
| H5b | IQ -> CCCU | −0.043 | 0.624 | Rejected | 0.003 | 0.064 | ||
| H10 | CP -> CCCU | 0.106 | 2.015 * | Supported | 0.036 | 0.089 | ||
| H9 | RP -> CCCU | 0.109 | 2.298 * | Supported | 0.037 | −0.005 | ||
| H8 | COL -> CCCU | 0.143 | 2.653 ** | Supported | 0.05 | 0.077 | ||
| H7 | SI -> CCCU | 0.237 | 3.894 ** | Supported | 0.154 | 0.048 | ||
| H6 | TI -> CCCU | 0.245 | 4.906 ** | Supported | 0.247 | 0.005 | ||
| H3b | NB -> CCCU | 0.367 | 4.489 ** | Supported | 0.201 | 0.008 | ||
| H4b | SQ -> CCCU | 0.431 | 4.063 ** | Supported | 0.258 | 0.008 |
Note: ** significant level = % 1 (p < 0.01). * significant level = % 5 (p < 0.05).
Table 12.
The effect size (f2) results.
| CCCU (R2 = 0.852) | NB (R2 = 0.439) | SAT (R2 = 0.764) | ||||
|---|---|---|---|---|---|---|
| f2 Effect Size | Category | f2 Effect Size | Category | f2 Effect Size | Category | |
| COL | 0.036 | small | ||||
| CP | 0.05 | small | ||||
| Conf | 0.784 | large | 0.211 | medium | ||
| IQ | 0.003 | small | 0.259 | medium | ||
| NB | 0.201 | medium | 0.015 | small | ||
| RP | 0.037 | small | ||||
| SAT | 0.154 | medium | ||||
| SI | 0.258 | medium | 0.051 | small | ||
| SQ | 0.42 | large | ||||
| TI | 0.247 | medium | ||||
Table 13.
IPMA Result.
| Constructs | Important (Total Effect) | Performances (Index Values) |
|---|---|---|
| CP | 0.314 | 33.713 |
| Col | 0.364 | 67.06 |
| Conf | −0.141 | 34.73 |
| IQ | 0.468 | 49.097 |
| NB | 1.05 | 63.517 |
| RP | 0.32 | 63.186 |
| SI | 0.606 | 62.744 |
| SQ | 1.157 | 58.015 |
| Sat | −1.413 | 68.17 |
| TE | 0.602 | 64.764 |
Note: Total Effects (Important) and CCCU (Performance).
Publisher’s Note: MDPI stays neutral with regard to jurisdictional claims in published maps and institutional affiliations. |
© 2021 by the authors. Licensee MDPI, Basel, Switzerland. This article is an open access article distributed under the terms and conditions of the Creative Commons Attribution (CC BY) license (https://creativecommons.org/licenses/by/4.0/).
Share and Cite
MDPI and ACS Style
Qasem, Y.A.M.; Abdullah, R.; Jusoh, Y.Y.; Atan, R.; Asadi, S. Analyzing Continuance of Cloud Computing in Higher Education Institutions: Should We Stay, or Should We Go? Sustainability 2021, 13, 4664. https://doi.org/10.3390/su13094664
AMA Style
Qasem YAM, Abdullah R, Jusoh YY, Atan R, Asadi S. Analyzing Continuance of Cloud Computing in Higher Education Institutions: Should We Stay, or Should We Go? Sustainability. 2021; 13(9):4664. https://doi.org/10.3390/su13094664
Chicago/Turabian StyleQasem, Yousef A. M., Rusli Abdullah, Yusmadi Yah Jusoh, Rodziah Atan, and Shahla Asadi. 2021. "Analyzing Continuance of Cloud Computing in Higher Education Institutions: Should We Stay, or Should We Go?" Sustainability 13, no. 9: 4664. https://doi.org/10.3390/su13094664
Note that from the first issue of 2016, this journal uses article numbers instead of page numbers. See further details here.