
Interior Design with Consumers’ Perception about Art, Brand Image, and Sustainability


1
College of Engineering, Keimyung University, Daegu 42601, Korea
2
School of Health and Consumer Sciences, South Dakota State University, Brookings, SD 57007, USA
3
School of Hospitality & Tourism Management, Purdue University, West Lafayette, IN 47907, USA
*
Author to whom correspondence should be addressed.
Sustainability 2021, 13(8), 4557; https://doi.org/10.3390/su13084557
Submission received: 31 March 2021
/
Revised: 15 April 2021
/
Accepted: 15 April 2021
/
Published: 20 April 2021
(This article belongs to the Special Issue New Trends and Patterns in Consumer Behavior and Sustainable Consumption)
Abstract
:In this study, the main research purpose was to determine whether artistic components of interior design in a store lead consumers to have different perceptions of the store. There were three main research questions. The first was whether consumers perceived the artistic components in a store visually. Second, based on the first research question, this study explored whether the artistic displays at the show window, around the furniture, and around the stairs were associated with consumers’ perceptions of the store as environmental-friendly. The third research question explored how the consumers’ perceptions of artistic and environment-friendly components were associated with the conventional marketing performance of the store. The 2 Stages Probit Least Squares (2SPLS) method was utilized to answer the first and second research questions and the 2 Stage Least Squares (2SLS) method was utilized for the third research question. Findings indicated that consumers had significant emotional responses from seeing artistic components in a store. In addition, these perceived art elements were associated with marketing performances, including pro-environmental perception, store differentiation, brand image, and consumer satisfaction. The practical implications were included in the discussion.
1. Introduction
In terms of art perception, there have been various trials to understand how people perceive and recognize art [1,2,3]. In this literature, the main baseline was that any art was meaningful when recognized by viewers. Augustin et al. [1] explained that the viewers’ perception of art was initiated during a timeline when the viewer was exposed to the art. Specifically, Leder et al. [2] explained that the art perception was made when the viewer experienced the aesthetics of the art. Norman [3] explained that the art perception was an intuitive experience. As such, understanding viewers’ perceptions of art works is a long-time research topic that is still being investigated, now with the use of advanced technology such as Even-Related Potential (ERP) from brain functioning [4]. In addition to the foundational research about how viewers perceive an art as the artistic object, there is another topic of how people perceive an object as art in situations such as art shown through a monitor, public places, and museums [5,6,7]. This literature expanded the foundational question about art perception to be linked with physical surroundings such as a certain place. All the above implies that viewers’ art perception continues to be a research topic of interest and the viewers’ perceptions are associated with the place where the art is viewed.
Based on the above literature, this study expanded the research question toward viewers’ art perception in commercial places such as stores. Art was infused into the consumer products in modern commercialized society [8] rather than just in museums or galleries. In other words, art objects were recently exposed to consumers in commercial areas as part of the marketing performances [9,10,11]. Therefore, a question should be asked in commercial places, such as how consumers perceive art in a store. This study begins with how artistic components in a store are perceived as art by consumers.
The above concepts and literature [1,3] focused on finding purely art-viewers’ perceptions of the art. However, considering that the viewers in this study were more likely consumers in a store, marketing concepts such as sensory and emotional responses were assumed to be associated with the consumers’ perceptions of the art in a store. In marketing concepts, sensory and emotional responses have important roles in consumers’ perceptions in a store and to their behavior [12,13,14,15]. Specifically, in a store, a combination of a certain level of stimulus to consumers’ sensory and emotional responses was assumed to evoke a meaningful perception [14]. In other words, consumers perceive the stimuli, such as artistic components, in a store when they get enough artistic stimuli to evoke emotional responses.
Along with the above initial research question, there was a practical question in this study. The question was how consumers’ perceptions of art via seeing artistic components of a store influenced the consumers’ psychological responses to the stores’ marketing performances. As the initial question included the emotional responses as an exogeneous covariate of the consumers’ perceptions [16], the emotional responses were still assumed to be an exogenous covariate to the consumers’ psychological responses to the marketing performance. Specifically, the marketing performances were divided into two facets: pro-environment marketing performance and conventional marketing performance.
Pro-environmental consumer behavior was introduced a couple of decades ago [17] and became a trend in the current market and society [18]. In the case of pro-environmental consumer behavior, how sustainability was perceived was critical to the consumer’s behavior [19]. It implied that the consumers’ perception of sustainability of a store was associated with pro-environmental consumer behavior. Therefore, in this study, the first marketing performance (i.e., pro-environmental consumer behavior) to be checked was the perception of a store as an environment-friendly store. The second marketing performance to be checked was whether consumers perceived the conventional marketing performance, including store differences, brand image, and consumers’ satisfaction. All these were also known to be marketing performance related with consumers’ perception and the store’s artistic components [20,21].
In summary, in this study, the main research purpose was to check whether artistic components in a store lead the consumers to have different perceptions of the store with these consequent research questions. First, it was checked whether consumers perceived the artistic components in a store (i.e., at the show window, around the furniture, and around the stairs) via one of the senses (i.e., sight). As explained above, it was checked whether emotional responses to the store (i.e., exogeneous factor of perception) were associated with the perception of artistic components at certain places. Second, by confirming the first research question, this study checked whether each artistic display at the show window, around the furniture, and around the stairs was associated with the consumers’ perception of the store as an environment-friendly store (i.e., pro-environmental marketing performance). Based on the responses to the first and second research questions, the third research question checked how the consumers’ perception of artistic and environment-friendly components were associated with conventional marketing performance of the store (i.e., shop differentiation, brand image, and consumers’ satisfaction).
By answering the above three research questions, this study had two important contributions to the field. First, this study investigated how artistic components in a store were perceived as sustainable components to consumers. It implied the potential of the use of artistic components in a store for sustainable marketing. Second, this study investigated the position of the artistic components, such as at the show window, around the furniture, and around the stairs. To respond to the research questions, this study utilized perceived art scores of in-store components (i.e., at the show window, around the furniture, and around the stairs) as endogenous factors to be associated with other exogeneous variables (i.e., emotional responses to the store). Therefore, for the first two research questions, the 2 Stages Probit Least Squares (2SPLS) model was utilized, and for the third research question, the 2 Stage Least Squares (2SLS) model was utilized. The expected result contributed to the practical field in industry by explaining how to emphasize the artistic and sustainable components in actual stores.
2. Conceptual Background and Literature Review
2.1. Artification in a Store
Art became a part of consumers’ culture in South Korea recently. According to the Ministry of Culture, Sports and Tourism in South Korea [22], the annual number of art viewers who attended art events in South Korea increased from 65.8% in 2006 to 81.8% in 2019. Specifically, regardless of the region (i.e., urban and suburban) or art type (i.e., movie, music, drawings), the increasing trend was observed across the entire country in the same period. This implies that art fulfilled the emotional needs of art consumers.
The trend was expanded to the places where consumers spent their time, such as shopping malls and individual stores. Diverse commercial areas, such as shopping malls and individual stores, adopted the artistic components as part of their attractive marketing performance [11,23,24] because surroundings and environments of a store influence consumers’ decision making [25]. Specifically, brand management such as brand name, symbol, and consumers’ perception (i.e., branding or brand equity) were associated with brand’s image and value. For instance, Aaker [26,27] introduced a set of assets of brand value using a name of brand equity. It implied that artistic components of branding (e.g., artistic symbol of a brand store) were associated with brand image and store value. In addition, Keller [20] explained that the brand equity was a combination of brand image and consumers’ awareness. It implied that consumers’ awareness for the brand management (e.g., surroundings and environments of a store) were an important part in evaluating brand image. As a result, artification can be a strategy to increase consumer satisfaction, brand image, and store value [28,29,30].
It was the adoption of artification that led to stores becoming art galleries. Artification is the process of changing the non-art into art [31,32]. Therefore, artification of a store meant that a non-art store changed to an art store. Through using artification, some commercial stores that were not directly related to art might produce better performance [33]. Consequently, the adoption of artification escalated the brand image as well as the perception of brand by consumers [34]. Luxury brands such as Louis Vuitton and Prada were the first commercial entities to adopt artification in their stores. Then, by following the luxury brands, some lifestyle brand shops (e.g., Nike, Starbucks, and Apple) also adopted artification in their stores [21]. Recent literature found that there were cognitive and emotional responses to the artification store (e.g., [15,35,36]). This literature suggested the innovative strategy of artification allowed commercial places to become both commercial areas and art galleries [29,37].
Placement of the art was an important strategy in terms of store management and marketing performance [16] (p. 93). Attractive visual displays and placement (e.g., art placement at windows, furniture, and stairs) were well known to be effective at causing consumer responses. Jain, Takayanagi, and Malthouse [38] explained that show windows had five types of effects on consumer behavior: social, hedonic, informational, image, and good feeling. As such, well-designed art at a certain placement can be a factor for differentiating one shop from another.
2.2. Emotional Responses as Exogeneous Factors of Consumers’ Perceptions
Emotional responses of consumers were considered exogeneous factors to the consumer’s attitude, behavior, and perception [16]. Specifically, based on the experiential hierarchy of effects, hedonic consumption such as shopping behavior was influenced by emotional contagion [39,40]. This means that the emotional response evoked by the consumers’ perception in the store led to the consumers’ perception of the marketing performance. Therefore, the emotional affection was assumed to be an exogenous factor to the perception of marketing performance.
As the emotional atmosphere of a store influences consumer behavior [25], many stores have begun to utilize attractive appliances that are more likely to be considered artistic [10,41]. In addition, inversely, the adaption of artistic components in a store was revealed to be associated with consumers’ cognitive and emotional responses [37,42]. As a result, consumers’ perceptions of art are assumed to be influenced by emotional affection in hedonic consumption (e.g., shopping) before the perception of marketing performance. Therefore, in this study, the emotional responses were utilized as an exogenous factor for 2-stages modeling.
2.3. Artification as a Marketing Performance Including Pro-Environmental Marketing
The important role of artification in marketing performance is to increase the probability of consumers’ perceptions, which was conceptualized as sensory threshold or sensory adaptation [14,43]. Sensory threshold means a certain level of stimuli that a consumer needs to recognize the stimuli; and sensory adaption means that a consumer is getting used to the stimuli. Therefore, sensory marketing has been an important strategy in marketing performance [15] with utilizing various sensory units (e.g., haptics, smell, audition, taste, and vision). Specifically, vision was already known to be associated with place [44] and aesthetic perception [8,45].
Therefore, the artification at a place in a store (e.g., at the show window, around the furniture, and around the stairs) was expected to be a factor in causing an effective marketing performance (e.g., store differentiation, brand image, and consumer satisfaction). For instance, the show window was associated with the consumers’ sight [38] as introduced above. Consumers’ visual sensory (i.e., sight) was an important part of marketing attraction because sight was strongly associated with color recognition [16] and color was associated with enhancing mood [46]. This implies that any art at a certain place in a store can be associated with the consumers’ response in a store. Therefore, the consumers’ perception of any artification in a store was the evidence of the existence of sensory stimuli.
The sensory feature of art in a store was expected to be associated with a pro-environmental and sustainable business. In the literature, consumers’ sensory perception related to sustainability was frequently reported in food sciences and labeling issues. For instance, Hwang, Lee, Jo, Cho, and Moon [47] found that consumers’ sensory evaluation was associated with the pro-environmental information shown to consumers. Specifically, labels of products were the key media to deliver the pro-environmental information [48]. Considering that concerns about sustainability in a specific industry were related to consumer behavior [49], it was also adopted in interior design in store management. Specifically, a display in a store, called visual merchandising (VMD), represented the stores’ uniqueness and good quality of management [28,50]. Therefore, the well-managed display of artistic elements with pro-environmental information in a store was receiving important attention in the management of the store [51]. As such, consumers’ perception of the pro-environmental elements in artistic displays of a store might act as a predictor for marketing performance of a store. Furthermore, the consumers’ sensory perceptions were associated with the sustainable business itself [52].
2.4. Hypotheses and Empirical Models
As discussed above in the literature review, utilization of art in a store (i.e., artification) was a useful strategy to promote the brand image, store value, and consumers’ satisfaction [28,29,30]. Specifically, brand image and value were brand assets [25] so that the artistic expression in brand name and symbol in store might be used as a marketing tool. In addition, the brand assets should be based on the consumers’ awareness about brand image and value [20] so that the artistic expression should be recognized by the consumers. It was the final goal of this study to check whether the artification was associated with marketing performance. Therefore, the last hypotheses were the questions about the association between artification and marketing performances (H3, H4, and H5).
Before checking the last hypotheses (H3, H4, and H5), the first step should be taken. The first step was to check whether consumers perceived the artistic components in a store or not. The consumers’ awareness, specifically emotional responses, were assumed to be initiated with the consumers’ perception when the consumers’ behavior were in the realm of hedonic consumption [16]. Therefore, the first hypotheses were the questions about the association between perception of art and emotional responses to a store (H1a, H1b, and H1c). In between the first hypotheses (H1a, H1b, and H1c) and the last hypotheses (H3, H4, and H5), in this study, the role of pro-environmental elements was investigated because sensory evaluation was associated with both consumers’ perception [14,43] and pro-environmental information [47,48]. Therefore, the intermediate hypotheses were the questions about the intermediating role of pro-environmental perception of a store (H2a, H2b, and H2c).
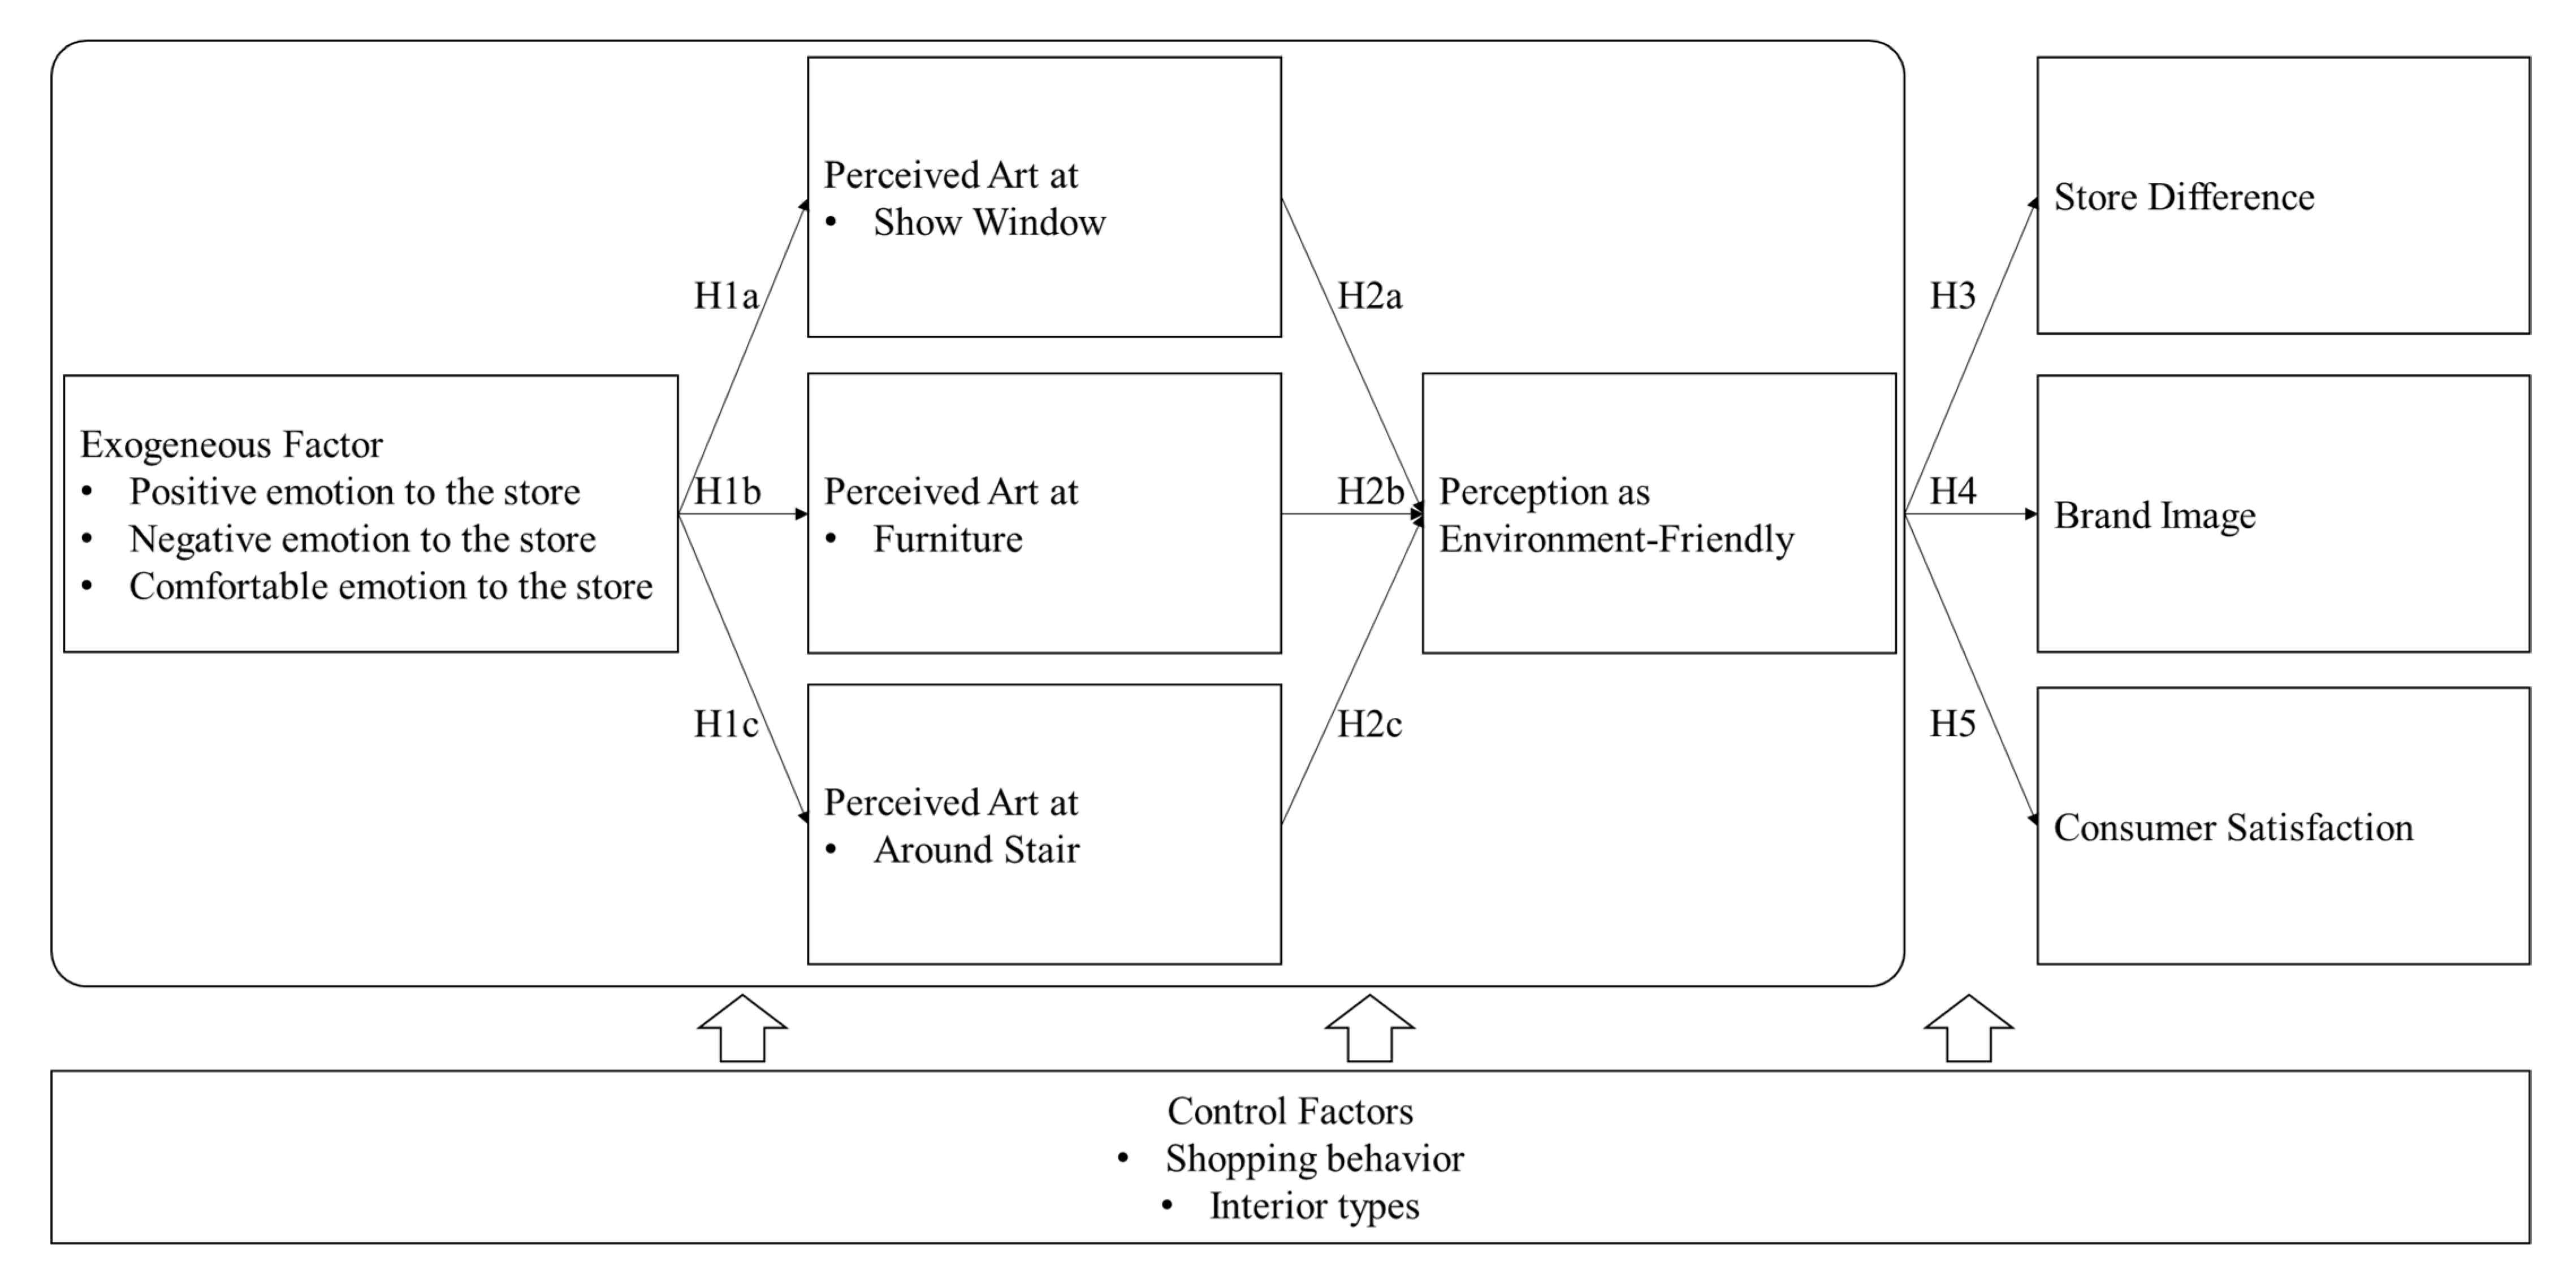
After all, this research investigated these associations after controlling socio-demographic predictors and shopping behavior: (a) association among emotional responses to the store and consumers’ perception (i.e., result of sight) of artistic components in the show window, around the furniture, and around the stairs (H1a, H1b, and H1c); (b) association between artistic display in the store’s interior (i.e., in the show window, around the furniture, and around the stairs) and the consumers’ perception of environment-friendly store (H2a, H2b, and H2c); and (c) the association among control variables, artistic display, the consumers’ perception of the store as environment-friendly, and the marketing performance of the store such as store differentiation, brand image, and consumer satisfaction (H3, H4, and H5). The first associations (H1a, H1b, and H1c) are the foundational line to check the other associations (H2a, H2b, H2c, H3, H4, and H5). The empirical model used to fulfil the research purpose is shown in Figure 1.
Based on the empirical model, the hypotheses were:
Hypothesis 1a (H1a).
Control variables (i.e., gender, age, education, marital status, income level, emotional response to the store, shopping behavior, and interior type) are significantly associated with the perception of the art display at the show window.
Hypothesis 1b (H1b).
Control variables (i.e., gender, age, education, marital status, income level, emotional response to the store, shopping behavior, and interior type) are significantly associated with the perception of the art display around the furniture.
Hypothesis 1c (H1c).
Control variables (i.e., gender, age, education, marital status, income level, emotional response to the store, shopping behavior, and interior type) are significantly associated with the perception of the art display around the stairs.
Hypothesis 2a (H2a).
The perception of the art in the show window is significantly associated with the consumers’ perception of the store as environment-friendly.
Hypothesis 2b (H2b).
The perception of the art around the furniture is significantly associated with the consumers’ perception of the store as environment-friendly.
Hypothesis 2c (H2c).
The perception of the art around the stairs is significantly associated with the consumers’ perception of the store as environment-friendly.
Hypothesis 3 (H3).
The precedents (i.e., control variables, perception of art in the show window, perception of art around the furniture, perception of art around the stairs, and the consumers’ perception of the store as environment-friendly) are associated with the consumers’ perceived store differences.
Hypothesis 4 (H4).
The precedents (i.e., control variables, perception of art in the show window, perception of art around the furniture, perception of art around the stairs, and the consumers’ perception of the store as environment-friendly) are associated with the consumers’ perceived brand image.
Hypothesis 5 (H5).
The precedents (i.e., control variables, perception of art in the show window, perception of art around the furniture, perception of art around the stairs, and the consumers’ perception of the store as environment-friendly) are associated with the consumers’ perceived satisfaction.
3. Data and Methodology
3.1. Data Collection
Data was collected through a random sampling method by employing an online survey agency in South Korea. The total sample collected was 648. To ensure diversity of consumers’ responses to the store interior design, there were two kinds of store interior designs (due to the copyright issue, the pictures were only allowed to be used for survey) shown to the respondents. The 648 respondents were randomly assigned one of two interior designs. In addition, in order to exclude an exogenous effect due to different brand and different store places, pictures of two interior designs from the same store and same brand (the selected brand name was KUHO and the store was located at a shopping street in Seoul, South Korea (i.e., Itaewon)) were used.
Table 1 shows the demographic features of the total sample of 648 across all regions in South Korea with these features: the average age of respondents was around 40 (M = 39.51, SD = 10.76); around half of the sample were female (52.47%); the majority of respondents completed college-level education or higher (79.78%); about half were married (52.31%); and over half of the respondents had an intermediate level of monthly income, between 2 million won (the currency for the study was Korean won, where 1000 won was approximately equivalent to 1 U.S. dollar) and 8 million won (78.40%).
3.2. Analytics
For H1a, H1b, H1c, H2a, H2b, and H2c, probit models with continuous endogenous covariates (Two Stage Probit Least Squared, 2SPLS) were utilized. As the empirical model showed, the perception of artistic display at each place (i.e., show window, furniture, and stairs) was assumed to be an instrument variable for measuring the perception of the store as environment-friendly. The 2SPLS model was known to be a good fit with the binary dependent variables (i.e., perceived the shop as environment-friendly or not) that covariates (i.e., perception of artistic display in the show window, around the furniture, and around the stairs) were endogenous [53]. The 2SPLS functions for H1 and H2 are shown below:
where ArtScore in Function (1) denotes how a respondent perceived a certain place (i.e., show window, furniture, and stairs) as an artistic place at a store, which would be used as a predictor in Function (2); i was the three types of artistic places such as show window, furniture, and stairs; Xj indicates all control variables including socio-demographic variables, shopping behavior, and interior types; Eco means the binary answer whether a respondent perceived the interior as environment-friendly or not; EcoBehave was a control variable for Function (2) with measuring how a respondent considered oneself as an environment-friendly person; and ui and vi were the estimation errors. Within the 2SPLS, Function (1) was estimated first, and Function (2) was estimated next. Therefore, Function (1) made the results for H1 and Function (2) brought the results for H2. In addition, three types of artistic display (i) at each Function made the three variations of hypotheses (i.e., a, b, and c in each H1 and H2).
For Hypothesis 3, 2 Stages Least Squares (2SLS) was utilized per each criterion (i.e., store differences, brand image, and consumer satisfaction). The 2SLS function utilized two-steps feasible Generalized Method of Moments (GMM) so that the exogenous factors (i.e., emotional responses to the store) can be estimated when the second stage of estimation was executed [54]. Function (1) was utilized as the baseline (i.e., the first stage in 2SLS) for estimating the perceived artistic value at each placement, and Function (3) (below) was connected to Function (1) for H3, H4, and H5 as below:
where ArtScorei was the estimated artistic value in each placement from Function (1); MP means the marketing performance; k indicates the three types of marketing performance including shop differentiation (H3), brand image (H4), and consumer satisfaction (H5); eik means the error term in the function. As i included three types (i.e., show window, furniture, and stairs) and k included three types (i.e., shop differentiation, brand image, and consumer satisfaction), the total 2SLS were executed with nine models.
3.3. Measurement
Store differentiation was measured with four questions: (a) Do you agree that the current store has enjoyable interior design? (b) Do you agree that the current store has different uniqueness from other stores? (c) Do you agree that the current store provokes your curiosity? (d) Do you agree that the current store makes you have a unique experience? Responses for all four questions were based on a 5-point Likert scale from 1 (strongly not agree) to 5 (strongly agree). The sum of the four questions was utilized as the scale for shop differentiation. Therefore, the higher the number, the higher the store differentiation. As shown in Table 2, the reliability (Cronbach’s alpha) of four items was 0.85, which was higher than the criteria [55,56]. In addition, the construct validity was secured by checking goodness of model fit with confirmatory factor analysis (CFA). The root mean of squared error of approximation (RMSEA) was 0.035; standardized root mean square residual (SRMR) was 0.010; comparative fit index (CFI) was 0.999; and Tucker Lewis index (TLI) was 0.996. All indicators showed that the construct validity was secured, that RMSEA should be lower than 0.060 or 0.080; SRMR should be 0.08; and CFI and TLI should be over 0.90 [57,58,59]. Among 648 samples, the average store differentiation was 13.04 (SD = 3.04).
Brand image was assessed with five items: (a) Do you agree that the current store’s interior reflects the brand image? (b) Do you agree that the current store’s interior increases the favor of the brand? (c) Do you agree that the current store’s interior increases brand awareness? (d) Do you agree that the current store’s interior increases the brand’s value? (e) Do you agree that the current store’s interior increases the image of the brand? Responses to all five questions were based on a 5-point Likert scale from 1 (strongly not agree) to 5 (strongly agree). The total sum of the five questions was utilized as the scale for brand image. Therefore, the higher the number, the higher the brand image. As shown in Table 2, the Cronbach’s alpha of five items was 0.93, which was higher than the criteria. In addition, the construct validity was secured by checking goodness of model fit with confirmatory factor analysis. The RMSEA was 0.044; SRMR was 0.008; CFI was 0.998; and TLI was 0.995. Among 648 samples, the average brand image was 16.73 (SD = 3.91).
Consumer satisfaction was assessed with six items: (a) Are you satisfied with the current store? (b) Will you recommend the current store to your friend? (c) Will you keep shopping at the current store in the future? (d) Do you feel less wasteful when you shop tableat the current store? (e) Will you visit another store with the same brand? (f) Will you purchase a product from the same brand? Responses to all six questions were based on a 5-point Likert scale from 1 (strongly not agree) to 5 (strongly agree). The total sum of the six questions was utilized as the scale for consumer satisfaction. Therefore, the higher the number, the higher the consumer satisfaction. As shown in Table 2, the Cronbach’s alpha of six items was 0.94, which was higher than the criteria. In addition, the CFA confirmed the construct validity: RMSEA was 0.067; SRMR was 0.015; CFI was 0.996; and TLI was 0.987. Among 648 samples, the average consumer satisfaction was 18.98 (SD = 4.59).
Perception of the environment was asked with one question: Does this store seem to be environment-friendly? Among 648 respondents, 25.46% answered that they felt the store was environment-friendly based on the images in the store. Respondents were asked to answer with a dichotomous answer: yes or no. Perceived artistic display at a certain placement (i.e., show window, furniture, and stairs) was asked with a single question per placement: (a) Can you feel the artistic expression from the show window? (b) Can you feel the artistic expression from the furniture and its surroundings? (c) Can you feel the artistic expression from the stairs and its surroundings? Answers to each question were based on a 5-point Likert scale from 1 (strongly not agree) to 5 (strongly agree). Therefore, the higher the number, the higher the perception of artistic display at the placement. In terms of show window, the artistic perception score was 3.47 (SD = 1.00); in terms of furniture and its surroundings, the artistic perception score was 3.48 (SD = 0.94); in terms of stairs and its surroundings, the artistic perception score was 3.94 (SD = 0.90).
Emotional responses were adopted from previous literature [21] and one question was asked with 13 possible items: At the current store, do you feel (a) good; (b) annoyed; (c) satisfied; (d) depressed; (e) curious; (f) bored; (g) excited; (h) nervous; (i) aroused; (j) relaxed; (k) comfortable; (l) timid; and (m) focused? As the 13 items were not indicating the same directional emotions, exploratory factor analysis (EFA) was utilized to find an appropriate number of emotions. By utilizing EFA, three factors were found: (a) positive emotional responses with good, curious, excited, aroused, and focused; (b) negative emotional responses with annoyed, depressed, bored, nervous, and timid; and (c) comfort emotional responses with satisfied, relaxed, and comfortable (See Appendix A Table A1, Table A2 and Table A3). Responses for all 13 questions were based on a 5-point Likert scale from 1 (strongly not agree) to 5 (strongly agree). In terms of positive emotional response to the store, five items were utilized. Therefore, the higher the number, the higher the positive emotional response. As shown in Table 2, the Cronbach’s alpha of five items was 0.80, which was higher than the criteria. In addition, the construct validity was secured by checking goodness of model fit with CFA. The RMSEA was 0.000; SRMR was 0.005; CFI was 1.000; and TLI was 1.000. In terms of negative emotional response to the store, five items were utilized. Therefore, the higher the number, the higher the negative emotional response. As shown in Table 2, the Cronbach’s alpha of five items was 0.77, which was higher than the criteria. In addition, the construct validity was secured by checking goodness of model fit with CFA. The RMSEA was 0.000; SRMR was 0.008; CFI was 1.000; and TLI was 1.000. In terms of comfortable emotional response to the store, three items were utilized. Therefore, the higher the number, the higher the comfortable emotional response. As shown in Table 2, the Cronbach’s alpha of five items was 0.80, which was higher than the criteria. In addition, the construct validity was secured by checking goodness of model fit with CFA. The RMSEA was 0.000; SRMR was 0.000; CFI was 1.000; and TLI was 1.000. Positive emotion showed an average of 15.07 (SD = 3.19); negative emotion showed an average of 10.39 (SD = 3.07); comfortable emotion showed an average of 9.53 (SD = 2.19).
Shopping behavior was assessed with five items: Do you agree with these sentences? (a) I tend to spend time to purchase the better product with lower price; (b) I feel that I am free when I shop; (c) I feel that I become a special one when I shop; (d) Shopping itself is enjoyable and exciting; and (e) I am enjoying brand-new products. Answers to all five questions were based on a 5-point Likert scale from 1 (strongly not agree) to 5 (strongly agree). The total sum of the five questions were utilized in this study as the scale for shopping behavior. Therefore, the higher the number, the more friendly the shopping behavior. As shown in Table 2, the Cronbach’s alpha of five items was 0.77, which was higher than the criteria. In addition, the CFA confirmed the construct validity: RMSEA was 0.051; SRMR was 0.017; CFI was 0.995; and TLI was 0.983. Among 648 respondents, the shopping behavior was measured with an average of 17.67 (SD = 3.14).
Interior type was binary coded. As respondents were randomly assigned to one of two interior types, the frequency was almost half, and half for each type (50.77%; 49.23%) as shown in Table 2. The interior type was given for checking the diversity of artistic display on Functions 1 and 2, and the interior type was used as control variable in the functions. Demographic variables included gender (male = 0; female = 1), age and age square term, education level (high school or lower = 1; college level = 2; graduate degree or higher = 3), marital status (single = 0; married = 1), and income level (lower than 2 million won = 1; over 8 million won = 5). These socio-demographic factors were used as a control variable because this study utilized a random sampling survey. Finally, environmental behavior of respondents was asked with a single question: Do you agree that you prefer using environment-friendly products in daily life? As the pre-existing environmental behavior may cause a sampling error in Function (1), the single item was utilized in Function (1) as a control variable. Answers for the question were based on a 5-point Likert scale from 1 (strongly not agree) to 5 (strongly agree). Among 648 respondents, the environmental behavior was measured with an average of 3.42 (SD = 0.84).
4. Results
4.1. Responses to Hypotheses 1a, 1b, and 1c
Table 3 shows the results for Hypotheses 1a, 1b, and 1c. Three models showed R2 as much as 0.25, 0.31, and 0.20, respectively, for Model 1a (H1a), Model 1b (H1b), and Model 1c (H1c). Their model fits were significantly meaningful (F = 14.17, p < 0.001; F = 18.68, p < 0.001; F = 10.44, p < 0.001, respectively, for Models 1a, 1b, and 1c). The details of the results are shown in Table 3.
As shown in the above Table 3, having an emotional response to the store causes consumers to perceive the artistic components from each placesdment (i.e., show window, furniture, and stairs). Consumers perceived the show window as an artistic place when they felt a positive emotion from the store (b = 0.12, p < 0.001). The negative and comfortable emotional responses were not significantly associated with the artistic value in the show window (b = −0.02, p = 0.10; b = 0.01, p = 0.60, respectively, for negative emotion and comfortable emotion). The interior type decreased the artistic scores at the window when it was Type B (b = −0.58, p < 0.001).
Consumers perceived the furniture as an artistic place when they felt a positive emotion from the store (b = 0.11, p < 0.001). On the contrary, when consumers felt a negative emotion from the store, they were less likely to perceive the artistic component from the window (b = −0.02, p < 0.05). Interestingly, socio-demographic factors were associated with the perceived art around the furniture. For instance, the perceived art score around the furniture increased (b = 0.21, p < 0.01) when a respondent was female; the perceived art score around the furniture decreased (b = −0.27, p < 0.01) when a respondent was married. The association between age and the perceived art score around the furniture was quadratic; artistic score decreased until 50 years old (considering the quadratic function of age and age2, the turning point was calculated by differential calculation such as: −[Age’s b]/(2 × [Age2’s b]) = −(−0.08)/2 × (0.0008) = 50.) (age’s b = −0.08, p < 0.01) but increased after 50 (age2’s b = 0.0008, p < 0.05). Compared to the lowest income group (i.e., those who earned a monthly income lower than 200 million won), all other higher income groups showed a negative association with perceived art around the furniture. The interior type increased the artistic scores around the furniture when it was Type B (b = 0.32, p < 0.001).
Consumers perceived around the stairs as an artistic place when they felt a positive emotion from the store (b = 0.08, p < 0.001). On the other hand, when consumers felt negative emotions from the store, consumers were less likely to perceive the artistic component from the show window (b = −0.04, p < 0.001). Interestingly, gender and shopping behavior were associated with the perceived art around the stairs. For instance, the perceived art score around the stairs increased (b = 0.21, p < 0.01) when a respondent was female; the perceived art score around the stairs increased (b = 0.03, p < 0.05) when a respondent was a more friendly shopping person. The interior type increased the artistic scores around the stairs when it was Type B (b = 0.17, p < 0.05).
4.2. Responses to Hypotheses 2a, 2b, and 2c
Table 4 shows the 2SPLS results by using an estimated art score from Function (1) (Models 1a, 1b, and 1c) as a predictor for the perception that the store was an environment-friendly shop. Model fits for three models were significant (χ2 = 248.35, p < 0.001; χ2 = 240.51, p < 0.001; χ2 = 308.73, p < 0.001, respectively, for Models 2a, 2b, and 2c), which means that all three models were well fit with datasets. In addition, the usage of 2SPLS was statistically justified by seeing significant exogeneity chi-squares (χ2 = 45.03, p < 0.001; χ2 = 36.51, p < 0.001; χ2 = 44.02, p < 0.001, respectively, for Models 2a, 2b, and 2c). When the exogeneity chi-squares were significant, the two stages with exogeneous variables (e.g., emotional responses to perception of artistic in each place of window, furniture, and stairs) were statistically preferred [53]. The details of the findings are shown below in Table 4.
As shown in Table 4, all estimated artistic scores at three places (i.e., show window, furniture, and stairs) showed a significantly positive association with the perception of the shop as environment-friendly. Specifically, when a respondent perceived the show window as an artistic place of the store, the person was more likely to perceive the store as environment-friendly (b = 0.74, p < 0.001). A respondent was more likely to perceive the store as environment-friendly (b = 0.85, p < 0.001) when the respondent perceived the furniture as an artistic place in the store. A respondent was more likely to perceive the store as environment-friendly (b = 0.91, p < 0.001) when the respondent perceived the stairs as an artistic place in the store. As Function (2) indicated, the estimated artistic score of each place included the exogeneous factors of emotional responses (i.e., positive, negative, and comfortable responses) to the store. Therefore, the significant association between artistic scores and the environment-friendly perception should be considered with the external effect of emotional responses.
Among the control factors, gender (i.e., being female) was shown to be negatively associated with the perception of the store as environment-friendly (b = −0.22, p < 0.05; b = −0.34, p < 0.0; b = −0.32, p < 0.01, respectively, for show window, furniture, and stairs). Marital status (i.e., married) was significantly and positively associated with the perception of environment-friendly when the artistic score was noticed from the furniture (b = 0.31, p < 0.05). In addition, when the artistic score was noticed from around the stairs, higher income people were less likely to perceive the store as environment-friendly compared to the lowest income people.
4.3. Responses to Hypotheses 3, 4, and 5
Table 5 show the results for H3 (i.e., store differentiation) with three types of perceived artistic placement (i.e., show window, furniture, and stairs). All three models showed good model fit with significant F-values (F = 11.45, p < 0.001; F = 12.72, p < 0.001; F = 7.68, p < 0.001). All three models showed no issues about the under-identification for 2SLS estimation (LM Statistic = 108.54, p < 0.001; LM Statistic = 114.99, p < 0.001; LM Statistic = 76.32, p < 0.001, respectively, for Models 3a, 3b, and 3c). When the null hypothesis for LM Statistic was rejected, the under-identification was assumed to not exist [54]. There was an issue of over-identification when the null hypothesis of the Sargan-Hansen test was rejected [54]. Model 3a and Model 3b showed the Sargan-Hansen statistic as much as 0.001 (p = 0.99) and 0.89 (p = 0.64), respectively. However, Model 3c showed the Sargan-Hansen statistic as much as 11.09 (p < 0.01). Therefore, Model 3c might have an issue of over-identification. However, for consistency across all models, the 2SLS estimation was kept in this study.
As shown in Table 5, perceived artistic value at the show window, furniture, and stairs was positively associated with the perceived store differentiation (b = 5.04, p < 0.001; b = 5.34 p < 0.001; b = 6.19, p < 0.001, respectively, for show window, furniture, and stairs). This means that exogeneous factors (i.e., emotional responses) through the show window, furniture, and stairs increased the store differentiation. Perception of the store as environment-friendly increased store differentiation when respondents perceived artistic value at the show window and around the stairs (b = 1.34, p < 0.01; b = 1.15, p < 0.05, respectively). Females were sensitive to feeling store differentiation. Being female showed a negative association with store differentiation when it was Model 3b and Model 3c (b = −1.28, p < 0.001; b = −1.40, p < 0.01). Demographic factors were associated only when respondents perceived the artistic value at the furniture. For instance, store differentiation increased until the respondents’ age (considering the quadratic function of age and age2, the turning point was calculated by differential calculation such as: −[Age’s b]/(2 × [Age2’s b]) = −(0.49)/2 × (−0.0047) = 51.58) of 51.58; however, store differentiation decreased after that point. Married people felt higher store differentiation (b = 1.91, p < 0.001); and compared to the lowest income people, other income people had a higher level of store differentiation.
Table 6 shows the result for H4 (i.e., brand image) with three types of perceived artistic placement (i.e., show window, furniture, and stairs). All three models showed good model fit with significant F-values (F = 11.00, p < 0.001; F = 12.33, p < 0.001; F = 7.86, p < 0.001). All three models showed no issues about the under-identification for 2SLS estimation (LM Statistic = 108.54, p < 0.001; LM Statistic = 114.99, p < 0.001; LM Statistic = 76.32, p < 0.001, respectively, for Models 3a, 3b, and 3c). In terms of over-identification, there was no issue across all three models as well because null hypotheses were all accepted. The Sargan-Hansen statistics for all three models were 4.77 (p = 0.09), 2.11 (p = 0.35), and 4.24 (p = 0.12), respectively, for Models 4a, 4b, and 4c.
As shown in Table 6, perceived artistic value in the show window, around the furniture, and around the stairs was positively associated with the perceived brand image (b = 5.50, p < 0.001; b = 5.93 p < 0.001; b = 7.15, p < 0.001, respectively, for show window, furniture, and stairs). This means that exogeneous factors (i.e., emotional responses) through the show window, furniture, and stairs increased the brand image. Perception of the store as environment-friendly increased brand image when respondents perceived artistic value at the show window and around the stairs (b = 1.61, p < 0.01; b = 1.38, p < 0.05, respectively). Females were sensitive to brand image. Being female showed a negative association with brand image when it was Model 4b and Model 4c (b = −0.85, p < 0.05; b = −1.02, p < 0.05). Demographic factors were associated only when respondents perceived the artistic value at furniture. For instance, brand image increased until the respondents’ age (considering the quadratic function of age and age2, the turning point was calculated by differential calculation such as: −[Age’s b]/(2×[Age2’s b]) = −(0.48)/2 × (−0.0047) = 51.06.) of 51.06; however, brand image decreased after the point. Married people felt higher brand image (b = 1.87, p < 0.01); and compared to the lowest income people, other income people have a higher level of brand image.
Table 7 shows the results for H5 (i.e., consumer satisfaction) with three types of perceived artistic placement (i.e., show window, furniture, and stairs). All three models showed good model fit with significant F-values (F = 13.43, p < 0.001; F = 15.15, p < 0.001; F = 9.45, p < 0.001). All three models showed no issues about under-identification for 2SLS estimation (LM Statistic = 108.54, p < 0.001; LM Statistic = 114.99, p < 0.001; LM Statistic = 76.32, p < 0.001, respectively, for Models 3a, 3b, and 3c). In the case of over-identification, there were few issues across all three models. The Sargan-Hansen statistics for all three models were 7.09 (p < 0.05), 3.94 (p = 0.14), and 8.51 (p < 0.05), respectively, for Models 5a, 5b, and 5c. However, the indicator warned of the possibility of, but did not perfectly prove, the existence of over-identification. As a result, for consistency across all models, the 2SLS estimations were kept in this study.
As shown in Table 7, perceived artistic value at the show window, furniture, and stairs was positively associated with perceived consumer satisfaction (b = 7.07, p < 0.001; b = 7.63, p < 0.001; b = 9.06, p < 0.001, respectively, for show window, furniture, and stairs). This means that exogeneous factors (i.e., emotional responses) through the show window, furniture, and stairs increased consumer satisfaction. Perception of the store as environment-friendly increased consumer satisfaction when respondents perceived artistic value at the show window and around the stairs (b = 2.03, p < 0.01; b = 1.73, p < 0.05, respectively). Females were sensitive to consumer satisfaction. Being female showed a negative association with brand image when it was Model 5b and Model 5c (b = −1.79, p < 0.001; b = −1.99, p < 0.01). Demographic factors were associated only when respondents perceived the artistic value around the furniture. For instance, consumer satisfaction increased until the respondents’ age (considering the quadratic function of age and age2, the turning point was calculated by differential calculation such as: −[Age’s b]/(2 × [Age2′s b]) = −(0.78)/2 × (−0.01) = 39.00.) of 39.00; however, consumer satisfaction decreased after that point. Married people felt higher consumer satisfaction (b = 2.68, p < 0.001); and compared to the lowest income people, other income people had a higher level of consumer satisfaction.
5. Discussion, Implication, and Limitation
From the first hypotheses (H1a, H1b, and H1c), the pre-existing marketing concepts were confirmed, experiential hierarchy of effects and emotional contagion [38,39]. Specifically, the experiential hierarchy of effects was expected to be observed when positive emotions influenced a consumer (e.g., hedonic consumption). As shown in the results, positive emotions (i.e., good, curious, excited, aroused, and focused) about the shop influenced the consumers’ perception of artistic components in the shop, regardless of where the artistic components were placed (e.g., show window, furniture, and stairs). On the other hand, the negative emotions (i.e., annoyed, depressed, bored, nervous, and timid) was associated only with the perceptions of artistic components around the stairs.
The finding that positive emotions were prevalent in all places, but the negative emotions affected only one place can be explained by experiential hierarchy of effects. Hierarchies of effects have three categories: high involvement, low involvement, and experiential [16]. In terms of high involvement effects, emotions mediate the perception to behavior; in terms of low involvement effects, emotions were the output of perception and behavior. However, in terms of experiential effects, emotions were the precedents of behavior and perception, as an exogeneous factor in this study. As the consumers who saw the stores were more likely to be hedonic consumers, the experiential effects worked, and the positive emotion affected the perception of art in this study.
The abovementioned implies that artistic components in a store should be considered with positive emotional surroundings. As the stores were expected to increase the hedonic pleasures, the artistic components should be aligned with the pleasure. Therefore, previous literature that showed that color is associated with enhanced mood [46] and artification is associated with the sensory threshold [14] were supported by the finding. Additionally explained by the finding is that comfort emotions (i.e., satisfied, relaxed, and comfortable) are not significantly associated with the perception of artistic components at any place. This means that the artistic components should not be just comfort, but it should be one of the stimuli to make consumers feel good, curious, excited, and focused. This provides practical implications to the industry for adjusting their store’s interior.
From the second hypotheses (H2a, H2b, and H2c), perception of artistic components that were imposed with the exogeneous factor (i.e., emotional responses to the store) had a positive effect on perceiving the shop as environment-friendly. This means that perceived art imposed with positive emotion accelerates the perception of pro-environmental recognition in the store. The results aligned with the above explanation in the introduction and background that sensory evaluation of consumers is associated with pro-environmental information [47].
The abovementioned is possibly explained with three concepts that were explained in the introduction and background: sensory evaluation of consumers, aesthetic perception, and emotional contagion. Consumers’ senses, such as sight, are known to be associated with emotion in the market [16,38,46], which is eventually associated with aesthetic perception [12,13,14,15]. All three concepts of sensory evaluation, emotional contagion, and aesthetic perception were combined and allowed consumers to recognize the artistic components’ meaning of the pro-environmental features. On the contrary, if the display and in-store places did not evoke a positive emotion or if the display and in-store places were not attractive with artistic components, then a consumer’s senses did not work appropriately to recognize the artistic components as well as the pro-environmental information on it. Therefore, the implication from the findings suggests professionals in the industry should utilize the artistic displays in a store for better delivery of pro-environmental messages.
Finally, from the last hypotheses (H3, H4, and H5), the perception of artistic components and the perception of pro-environmental features of the store eventually promoted the store’s marketing performance, such as store differentiation, brand image, and consumer satisfaction. In this case, the emotional responses to the store were still imposed to the perception of art and the perception of pro-environmental features of the store. First, the store was differentiated from others because there was an artistic perception by the consumers’ sensory responses. As explained above, three concepts (i.e., sensory evaluation, emotional contagion, and aesthetic perception) still worked on this finding. The sensory evaluation through artistic components was recognized as an experience of hedonics (i.e., experiential hierarchy of effects) so that the artistic components promoted the brand image and sales [60,61]. As a result, the artistic components in the shop acted like a marketing strategy. It influenced the consumers’ positive responses, which was ultimately consumer satisfaction [62]. Therefore, Hagtvedt and Patrick [34] insisted the practical effect of art infusion was that artistic features were injected into consumer products.
The final finding provides a practical implication for the industry that perception of art and perception of pro-environment are eventually good for business sustainability. Therefore, in the long run, professionals in stores should know the potential of artistic components and pro-environmental messages in a store.
Demographics showed some interesting findings as well. First, females were significantly sensitive in eleven of fifteen models (i.e., Models 1b, 1c, 2a, 2b, 2c, 3b, 3c, 4b, 4c, 5b, and 5c). In Model 1b and Model 1c, females showed a positive association with the perception of artistic components about the store. On the other hand, for the other nine models (i.e., Models 2a, 2b, 2c, 3b, 3c, 4b, 4c, 5b, and 5c), females showed a negative association with the perception of pro-environmental features of the store and the perception of marketing performance. This implies that professionals in a store should be cautious about choosing art that is more attractive to females. Second, furniture was sensitive with age changes. All marketing performance (i.e., store differentiation, brand image, and consumer satisfaction) increased until certain ages (i.e., 50 years old for store differentiation and brand image, and 40 years old for consumer satisfaction) but decreased from certain ages. This implies that store managers should be cautious of older adults because they felt negative feelings from decorations around furniture.
However, this study utilized the virtual shops to the consumers and measured the subjective responses from survey participants. Specifically, in this study, a survey method showing several pictures of a few stores were utilized as the sensory stimuli for consumers’ perception. It is the first limitation of the study because consumers’ sensory adaption would be more realistic when the exposure happens in a real case instead of visual picture. In addition, the study was delimited to focusing on perceptions of consumers, such as perceived art, perceived environment-friendly, and perceived emotion. It indicated that objective reaction of consumers (e.g., physiological responses) was not considered. In future research, comprehensive experiments (i.e., subjective survey and physiological test) are suggested within the actual stores to confirm the study’s findings. However, this study still had some meaningful contributions to academia and industry. Based on this study’s results, professionals in the industry may understand the basic logic of how consumers recognize the store differentiation and how consumers were satisfied by having artistic components in a store. Second, the misunderstanding that artistic components were only shown in luxury or extravagant consumer goods was resolved. Artistic components not only belong to expensive brands but also belong to lifestyle brands. Third, this study tried to find the connection among pre-existing concepts such as emotional contagion, sensory evaluation, aesthetic perception, and sustainability. Fourth, the study was conducted for the off-line stores so that the off-line stores can find a solution to survive in this online-dominated market. Finally, this study investigated the importance of pro-environmental messaging in a store and suggested that the sustainability through the store was executable and valuable in the real market.
Author Contributions
Conceptualization, J.K.; methodology, W.H.; software, W.H.; validation, J.K.; formal analysis, W.H.; investigation, J.K.; resource, J.K., W.H.; writing—original draft preparation, J.K., W.H.; writing—review and editing, J.K., W.H.; visualization, J.K. Both authors have read and agreed to the published version of the manuscript.
Funding
This research received no external funding.
Institutional Review Board Statement
Ethical review and approval were waived for this study because the study utilized the indirect and unharmful survey method through online survey.
Informed Consent Statement
Not applicable.
Data Availability Statement
Data sharing is not applicable to this article.
Conflicts of Interest
The authors declare no conflict of interest.
Appendix A

Table A1.
EFA results for emotional responses to the store.
| Variance | Difference | Proportion | Cumulative | |
|---|---|---|---|---|
| Factor 1 | 2.98 | 0.12 | 0.23 | 0.23 |
| Factor 2 | 2.86 | 0.27 | 0.22 | 0.45 |
| Factor 3 | 2.59 | 0.20 | 0.65 |
Table A2.
EFA results for emotional responses to the store: Factor loadings.
| Factor 1 | Factor 2 | Factor 3 | |
|---|---|---|---|
| Good | 0.51 | ||
| Annoyed | 0.80 | ||
| Satisfaction | 0.62 | ||
| Depressed | 0.81 | ||
| Curiosity | 0.72 | ||
| Boring | 0.71 | ||
| Excited | 0.76 | ||
| Nervous | 0.61 | ||
| Aroused | 0.73 | ||
| Relax | 0.89 | ||
| Comfortable | 0.87 | ||
| Timid | 0.65 | ||
| Focused | 0.59 |
Note. As a result, there are three factors found: (a) positive emotional responses with good, curiosity, excited, aroused, and focused; (b) negative emotional responses with annoyed, depressed, boring, nervous, and timid; and (c) comfort emotional responses with satisfaction, relax, and comfortable.
Table A3.
EFA factor correlations.
| Factor 1 | Factor 2 | Factor 3 | |
|---|---|---|---|
| Factor 1 | 0.69 | −0.33 | 0.64 |
| Factor 2 | 0.38 | 0.92 | 0.06 |
| Factor 3 | −0.61 | 0.21 | 0.76 |
References
- Augustin, M.D.; Leder, H.; Hutzler, F.; Carbon, C.C. Style follows content: On the microgenesis of art perception. Art Pcyhol. 2008, 128, 127–138. [Google Scholar] [CrossRef] [PubMed]
- Leder, H.; Belke, B.; Oeberst, A.; Augustin, D. A model of aesthetic appreciation and aesthetic judgements. Br. J. Psychol. 2004, 95, 489–508. [Google Scholar] [CrossRef] [PubMed]
- Norman, D.A. Emotional Design: Why We Love (or Hate) Everyday Things; Basic Books: New York, NY, USA, 2004. [Google Scholar]
- Augustin, M.D.; Defranceschi, B.; Fuchs, H.K.; Carbon, C.C.; Hutlzer, F. The neural time course of art perception: An ERP study on the processing of style versus content in art. Neuropsychologia 2011, 49, 2071–2081. [Google Scholar] [CrossRef] [PubMed]
- Carbon, C.C. Art perception in the museum: How we spend time and space in art exhibitions. I-Perception 2017, 8. [Google Scholar] [CrossRef] [Green Version]
- Wolz, S.; Carbon, C.C. What’s wrong with an art fake? Cognitive and emotional variables influenced by authenticity status of artworks. Leonardo 2014, 47, 467–473. [Google Scholar] [CrossRef]
- Zebracki, M. Beyond public artopia: Public art as perceived by its publics. GeoJournal 2013, 78, 303–317. [Google Scholar] [CrossRef] [Green Version]
- Hagtvedt, H.; Patrick, V.M. Art infusion: The influence of visual art on the perception and evaluation of consumer products. J. Mark. Res. 2008, 45, 379–389. [Google Scholar] [CrossRef]
- Hollenbeck, C.R.; Peters, C.; Zinkhan, G.M. Retail spectacles and brand meaning: Insights from a brand museum case study. J. Retail. 2008, 84, 334–353. [Google Scholar] [CrossRef]
- Kozinets, R.V. Can consumers escape the market? Emancipatory illuminations from burning man. J. Consum. Res. 2002, 29, 20–38. [Google Scholar] [CrossRef]
- Moore, C.M.; Doherty, A.M.; Doyle, S.A. Flagship stores as a market entry method: The perspective of luxury fashion retailing. Eur. J. Mark. 2010, 44, 139–161. [Google Scholar] [CrossRef]
- Bazerman, M.H.; Moore, D.A. Judgement in Managerial Decision Making, 8th ed.; Wiley & Sons Inc.: Hoboken, NJ, USA, 2012. [Google Scholar]
- Crilly, N.; Moultrie, J.; Clarkson, P.J. Seeing things: Consumer response to the visual domain in product design. Des. Stud. 2004, 25, 547–577. [Google Scholar] [CrossRef] [Green Version]
- Kardes, F.R.; Cronley, M.L.; Cline, T.W. Consumer Behavior, 2nd ed.; Cengage: Stamford, CT, USA, 2015; p. 100. [Google Scholar]
- Krishna, A. An integrative review of sensory marketing: Engaging the senses to affect perception, judgement and behavior. J. Consum. Psychol. 2012, 22, 332–351. [Google Scholar] [CrossRef] [Green Version]
- Solomon, M.R. Consumer Behavior: Buying Having, and Being, 12th ed.; Pearson: Hoboken, NJ, USA, 2017; pp. 78, 265. [Google Scholar]
- Mainieri, T.; Barnett, E.G.; Valdero, T.R.; Unipan, J.B.; Oskamp, S. Green buying: The influence of environmental concern on consumer behavior. J. Soc. Psychol. 1997, 137, 189–204. [Google Scholar] [CrossRef]
- Gazzola, P.; Pavione, E.; Pezzetti, R.; Grechi, D. Trends in the fashion industry. The perception of sustainability and circular economy: A gender/generation quantitative approach. Sustainability 2020, 12, 2809. [Google Scholar] [CrossRef] [Green Version]
- Toppinen, A.; Toivonen, R.; Valkeapää, A.; Rämö, A. Consumer perceptions of environmental and social sustainability of wood products in the Finnish market. Scand. J. Res. 2013, 28, 775–783. [Google Scholar] [CrossRef]
- Keller, K.L. Conceptualizing, measuring and managing customer-based brand equity. J. Mark. 1993, 57, 1–22. [Google Scholar] [CrossRef]
- Vukadin, A.; Lemoine, J.; Badot, O. Store ratification and retail performance. J. Mark. Manag. 2019, 35, 634–661. [Google Scholar] [CrossRef]
- Ministry of Culture, Sports and Tourism. 2020+National Culture and Art Activity Survey. 2020. Available online: https://www.mcst.go.kr/kor/s_policy/dept/deptView.jsp?pSeq=1831&pDataCD=0406000000&pType= (accessed on 5 March 2021).
- Riot, E.; Chamaret, C.; Rigaud, E. Murakami on the bag: Louis Vuitton’s decommoditization strategy. Int. J. Retail Distrib. Manag. 2013, 41, 919–939. [Google Scholar] [CrossRef]
- Schiuma, G. The Value of Arts for Business; Cambridge University Press: London, UK, 2011. [Google Scholar]
- Kotler, P. Atmospherics as a marketing tool. J. Retail. 1974, 49, 48–64. [Google Scholar]
- Aaker, D.A. Managing Brand Equity; The Free Press: New York, NY, USA, 1991. [Google Scholar]
- Aaker, D.A. Building Strong Brands; The Free Press: New York, NY, USA, 1996. [Google Scholar]
- Bitner, M.J. Servicescapes: The impact of physical surrounding on customers and employees. J. Mark. 1992, 56, 57–71. [Google Scholar] [CrossRef]
- Joy, A.; Wang, J.J.; Chan, T.-S.; Sherry, J.F.; Cui, G. M(Art)Worlds: Consumer perceptions of how luxury brand stores become art institutions. J. Retail. 2014, 90, 347–364. [Google Scholar] [CrossRef]
- Puccinelli, N.; Goodstein, R.; Grewal, D.; Price, R.; Raghubir, P.; Stewart, D. Customer experience management in retailing; Understanding the buying process. J. Retail. 2009, 85, 15–30. [Google Scholar] [CrossRef]
- Kapferer, J.-N. The artification of luxury: From artisans to artists. Bus. Horiz. 2014, 57, 371–380. [Google Scholar] [CrossRef]
- Naukkarinen, O. Variations in artification. Contemp. Aesthet. 2012, 4, 5. [Google Scholar]
- Saito, Y. Everyday aesthetics and artification. Contemp. Aesthet. 2012, 4, 5. [Google Scholar]
- Hagtvedt, H.; Patrick, V.M. Art and the brand: The role of visual art in enhancing brand extendibility. J. Consum. Psychol. 2008, 18, 212–222. [Google Scholar] [CrossRef]
- De Angelis, M.; Amatulli, C.; Zaretti, M. The artification of luxury: How art can affect perceived durability and purchase intention of luxury products. In Sustainable Luxury and Craftsmanship: Environmental Footprints and Eco-Design of Products and Processes; Gardetti, M., Coste-Manière, I., Eds.; Springer: Berlin/Heidelberg, Germany, 2020; pp. 61–84. [Google Scholar]
- Lagier, J. Comment l’esthétique peut-elle contribuer à la réussite d’une stratégie marketing? [How can aesthetics contribute to a marketing strategy success?]. Décis. Mark. 2009, 54, 63–67. [Google Scholar] [CrossRef]
- Koronaki, E.; Kyrousi, A.G.; Panigyrakis, G.G. The emotional value of arts-based initiatives: Strengthening the luxury brand-consumer relationship. J. Bus. Res. 2018, 85, 406–413. [Google Scholar] [CrossRef]
- Jain, V.; Takayanagi, M.; Malthouse, E.C. Effects of show windows on female consumers’ shopping behaviour. J. Consum. Mark. 2014, 31, 380–390. [Google Scholar] [CrossRef]
- Barone, M.J.; Miniard, P.W.; Romeo, J.B. The influence of positive mood on brand extension evaluations. J. Consum. Res. 2000, 26, 386–401. [Google Scholar] [CrossRef]
- Howard, D.J.; Gengler, C. Emotional contagion effects on product attitudes. J. Consum. Res. 2001, 28, 189–201. [Google Scholar] [CrossRef]
- Vukadin, A.; Wongkitrungrueng, A.; Assarut, N. When art meets mall: Impact on shopper responses. J. Prod. Brand Manag. 2018, 27, 277–293. [Google Scholar] [CrossRef]
- Peluso, A.M.; Pino, G.; Amatulli, C.; Guido, G. Luxury advertising and recognizable artworks: New insights on the “art infusion” effect. Eur. J. Mark. 2017, 51, 2192–2206. [Google Scholar] [CrossRef] [Green Version]
- Schiffman, L.G.; Wisenblit, J. Consumer Behavior, 11th ed.; Pearson: Hoboken, NJ, USA, 2015; p. 90. [Google Scholar]
- Meyers-Levy, J. The influence of a brand name’s association set size and word frequency on brand memory. J. Consum. Res. 1989, 16, 197–207. [Google Scholar] [CrossRef]
- Raghubir, P.; Greenleaf, E.A. Ratios in proportion: What should the shape of the package be? J. Mark. 2006, 70, 95–107. [Google Scholar] [CrossRef]
- Singh, S. Impact of color on marketing. Manag. Decis. 2006, 44, 783–789. [Google Scholar] [CrossRef]
- Hwang, J.; Lee, S.; Jo, M.; Cho, W.; Moon, J. The effect of sustainability-related information on the sensory evaluation and purchase behavior towards salami products. Food Sci. Anim. Resour. 2021, 41, 95–109. [Google Scholar] [CrossRef]
- Siegrist, M.; Visschers, V.H.M.; Hartman, C. Factors influencing changes in sustainability perception of various food behaviors: Results of a longitudinal study. Food Qual. Prefer. 2015, 46, 33–39. [Google Scholar] [CrossRef]
- Stampa, E.; Schipmann-Schwarze, C.; Hamm, U. Consumer perceptions, preferences, and behavior regarding pasture-raised livestock products: A review. Food Qual. Prefer. 2020, 82, 103872. [Google Scholar] [CrossRef]
- Jeon, J.O.; Park, H.H. A study on the development of fashion VMD cognition measurement instrument. J. Mark. Manag. Res. 2005, 10, 117–139. [Google Scholar]
- Oh, M.; Shin, J. Effects of eco-friendly visual merchandising on green consumer behavior. J. Korean Data Anal. Soc. 2018, 20, 2519–2532. [Google Scholar] [CrossRef]
- Jang, H.; Lee, S. Applying effective sensory marketing to sustainable coffee shop business management. Sustainability 2019, 11, 6430. [Google Scholar] [CrossRef] [Green Version]
- StataCorp. Stata 16 Base Reference Manual; Stata Press: College Station, TX, USA, 2019. [Google Scholar]
- Baum, C.F.; Schaffer, M.E.; Stillman, S. IVREG2: Stata module for extended instrumental variables/2SLS and GMM estimation. In Statistical Software Components S425401; Revised 26 June 2020; Boston College Department of Economics: Boston, MA, USA, 2002. [Google Scholar]
- Nunnally, J.C. Assessment of reliability. In Psychometric Theory, 2nd ed.; McGraw-Hill: New York, NY, USA, 1978. [Google Scholar]
- Sullivan, G.M. A primer on the validity of assessment instruments. J. Grad. Med Educ. 2011, 3, 119–120. [Google Scholar] [CrossRef] [Green Version]
- Brown, T.A. Confirmatory Factor Analysis for Applied Research, 2nd ed.; Guilford Press: New York, NY, USA, 2015. [Google Scholar]
- Kline, R.B. Principles and Practice of Structural Equation Modeling, 3rd ed.; Guilford Press: New York, NY, USA, 2011. [Google Scholar]
- MacCallum, R.C.; Browne, M.W.; Sugawara, H.M. Power analysis and determination of sample size for covariance structure modeling. Psychol. Methods 1996, 1, 130–149. [Google Scholar] [CrossRef]
- Hetsroni, A.; Tukachinsky, R.H. The use of fine art in advertising: A survey of creatives and content analysis of advertisements. J. Curr. Issues Res. Advert. 2005, 27, 93–107. [Google Scholar] [CrossRef]
- Joy, A.; Sherry, J.F. Speaking of art as embodied imagination: A multisensory approach to understanding aesthetic experience. J. Consum. Res. 2003, 30, 259–282. [Google Scholar] [CrossRef]
- Crader, S.; Zaichkowsky, J.L. The art of marketing. In Brick & Mortar Shopping in the 21st Century; Lowrey, T.M., Ed.; Taylor & Francis Group/Lawrence Erlbaum Associates: New York, NY, USA, 2008; pp. 87–106. [Google Scholar]
Figure 1.
Empirical model of the study.

Table 1.
Descriptive information of total sample (N = 648).
| Mean | S.D. | Frequency | % | |
|---|---|---|---|---|
| Age | 39.51 | 10.76 | ||
| Female (=1) | 340 | 52.47 | ||
| Education | ||||
| Completed high school or lower | 131 | 20.22 | ||
| College | 466 | 71.91 | ||
| Graduate level or higher | 51 | 7.87 | ||
| Married (=1) | 309 | 52.31 | ||
| Income per month | ||||
| <2 million won | 62 | 9.57 | ||
| 2 million to 4 million won | 229 | 35.34 | ||
| 4 million to 6 million won | 184 | 28.40 | ||
| 6 million to 8 million won | 95 | 14.66 | ||
| >8 million won | 78 | 12.04 |
Table 2.
Statistical summary of variables.
| Items | Range | Cron. Alpha | RMSEA (CFA) | Mean | SD | Frequency | % | |
|---|---|---|---|---|---|---|---|---|
| Shop differentiation | 4 | 4 to 20 | 0.85 | 0.035 | 13.04 | 3.04 | ||
| Brand image | 5 | 5 to 25 | 0.92 | 0.044 | 16.73 | 3.91 | ||
| Consumer satisfaction | 6 | 6 to 30 | 0.94 | 0.067 | 18.98 | 4.59 | ||
| Artistic score: Show window | 1 | 1 to 5 | 3.47 | 1.00 | ||||
| Artistic score: Furniture | 1 | 1 to 5 | 3.48 | 0.94 | ||||
| Artistic score: Around stairs | 1 | 1 to 5 | 3.94 | 0.90 | ||||
| Environment-friendly | 1 | Yes = 1 | 165 | 25.46 | ||||
| Positive emotion | 5 | 5 to 25 | 0.80 | 0.000 | 15.07 | 3.19 | ||
| Negative emotion | 5 | 5 to 25 | 0.77 | 0.000 | 10.39 | 3.07 | ||
| Comfortable | 3 | 3 to 15 | 0.80 | 0.000 | 9.53 | 2.19 | ||
| Shopping behavior | 5 | 5 to 25 | 0.77 | 0.051 | 17.67 | 3.14 | ||
| Environmental behavior | 1 | 1 to 5 | 3.42 | 0.84 | ||||
| Interior type | 1 | A = 1; B = 2 | (A) 329 | 50.77% |
Table 3.
Regression results: Estimating artistic display in the show window, around the furniture, and around the stairs.
Table 3.
Regression results: Estimating artistic display in the show window, around the furniture, and around the stairs.
| Model 1a: Window | Model 1b: Furniture | Model 1c: Stairs | |
|---|---|---|---|
| Coef. (S.E.) | Coef. (S.E.) | Coef. (S.E.) | |
| Emotional response to store | |||
| Positive | 0.12 (0.01) *** | 0.11 (0.01) *** | 0.08 (0.01) *** |
| Negative | −0.02 (0.01) | −0.02 (0.01) * | −0.04 (0.01) *** |
| Comfortable | 0.01 (0.02) | 0.03 (0.02) | 0.03 (0.02) |
| Store behavior | 0.02 (0.01) | 0.01 (0.01) | 0.03 (0.01) * |
| Demographic factors | |||
| Female (=1) | 0.08 (0.07) | 0.21 (0.06) ** | 0.21 (0.07) ** |
| Age | −0.04 (0.03) | −0.08 (0.03) ** | −0.03 (0.03) |
| Age2 | 0.00 (0.00) | 0.00 (0.00) * | 0.00 (0.00) |
| Education (ref. ≤ high school) | |||
| College | −0.08 (0.09) | −0.00 (0.08) | 0.03 (0.09) |
| Graduate or higher | −0.21 (0.15) | −0.04 (0.14) | 0.12 (0.14) |
| Married (=1) | −0.06 (0.09) | −0.27 (0.09) ** | −0.03 (0.09) |
| Income (ref. ≤ 2 million won) | |||
| 2 million to 4 million won | −0.08 (0.13) | −0.38 (0.12) ** | 0.11 (0.12) |
| 4 million to 6 million won | −0.09 (0.14) | −0.40 (0.12) ** | 0.10 (0.13) |
| 6 million to 8 million won | −0.11 (0.15) | −0.29 (0.14) * | 0.12 (0.14) |
| Over 8 million won | −0.10 (0.16) | −0.36 (0.14) * | 0.19 (0.15) |
| Interior type | −0.58 (0.07) *** | 0.32 (0.07) *** | 0.17 (0.07) * |
| Constant | 3.44 (0.68) *** | 3.15 (0.61) *** | 2.55 (0.64) *** |
| R2 | 0.25 | 0.31 | 0.20 |
| F | 14.17 *** | 18.68 *** | 10.44 *** |
Note. * p < 0.05; ** p < 0.01; *** p < 0.001. The coefficient for Age2 for Model 1b was 0.0008. S.E. denotes Standard Error.
Table 4.
2 Stages Probit Least Squares Result: Perceive the store as environment-friendly.
| Model 2a | Model 2b | Model 2c | |
|---|---|---|---|
| Coef. (S.E.) | Coef. (S.E.) | Coef. (S.E.) | |
| Art placement | |||
| Estimated art in show window | 0.74 (0.08) *** | ||
| Estimated art around furniture | 0.85 (0.09) *** | ||
| Estimated art around stairs | 0.91 (0.09) *** | ||
| Environmental behavior | 0.12 (0.07) | 0.09 (0.07) | 0.05 (0.07) |
| Store behavior | 0.03 (0.02) | −0.03 (0.02) | 0.01 (0.02) |
| Female (=1) | −0.22 (0.10) * | −0.34 (0.11) ** | −0.32 (0.10) ** |
| Age | −0.07 (0.05) | −0.04 (0.05) | −0.06 (0.04) |
| Age2 | 0.00 (0.00) * | 0.00 (0.00) | 0.00 (0.01) |
| Education (ref. ≤ high school) | |||
| College | 0.23 (0.13) | 0.20 (0.14) | 0.12 (0.13) |
| Graduate or higher | 0.31 (0.22) | 0.22 (0.22) | 0.04 (0.21) |
| Married (=1) | 0.11 (0.15) | 0.31 (0.16)* | 0.10 (0.14) |
| Income (ref. ≤ 2 million won) | |||
| 2 million to 4 million won | −0.13 (0.18) | 0.11 (0.19) | −0.29 (0.18) |
| 4 million to 6 million won | −0.27 (0.20) | −0.02 (0.21) | −0.38 (0.19) * |
| 6 million to 8 million won | −0.49 (0.23) * | −0.37 (0.24) | −0.61 (0.22) ** |
| Over 8 million won | −0.37 (0.23) | −0.16 (0.24) | −0.55 (0.22) * |
| Interior type | 0.68 (0.11) *** | −0.02 (0.12) | 0.04 (0.11) |
| Constant | −4.38 (1.06) *** | −4.64 (1.10) *** | −3.62 (.98) *** |
| Wald χ2 (Model) | 248.35 *** | 240.51 *** | 308.73 *** |
| Wald χ2 (Exogeneity) | 45.03 *** | 36.41 *** | 44.02 *** |
Note. * p < 0.05; ** p < 0.01; *** p < 0.001. The coefficient for Age2 for Model 2a was 0.0013. S.E. denotes Standard Error.
Table 5.
Store differentiation explained by artistic perception and environment-friendly.
| Model 3a | Model 3b | Model 3c | |
|---|---|---|---|
| Coef. (S.E.) | Coef. (S.E.) | Coef. (S.E.) | |
| Art placement | |||
| Estimated art in show window | 5.04 (0.44) *** | ||
| Estimated art around furniture | 5.34 (0.45) *** | ||
| Estimated art around the stairs | 6.19 (0.68) *** | ||
| Environment-friendly | 1.34 (0.44) ** | 0.31 (0.43) | 1.15 (0.51) * |
| Environmental behavior | 0.01 (0.22) | −0.21 (0.21) | −0.42 (0.26) |
| Store behavior | −0.06 (0.06) | −0.03 (0.06) | −0.11 (0.08) |
| Female (=1) | −0.57 (0.35) | −1.28 (0.34) *** | −1.40 (0.42) ** |
| Age | 0.33 (0.15) * | 0.49 (0.15) ** | 0.31 (0.18) |
| Age2 | −0.00 (0.00) | −0.00 (0.00) ** | −0.00 (0.00) |
| Education (ref. ≤ high school) | |||
| College | 0.35 (0.46) | 0.02 (0.43) | −0.29 (0.53) |
| Graduate or higher | 0.64 (0.76) | −0.08 (0.71) | −1.14 (0.87) |
| Married (=1) | 0.77 (0.49) | 1.91 (0.48) *** | 0.67 (0.57) |
| Income (ref. ≤ 2 million won) | |||
| 2 million to 4 million won | 0.25 (0.64) | 1.91 (0.48) *** | −0.99 (0.75) |
| 4 million to 6 million won | 0.34 (0.69) | 1.75 (0.63) ** | −0.72 (0.80) |
| 6 million to 8 million won | 0.66 (0.76) | 1.48 (0.72) * | −0.70 (0.89) |
| Over 8 million won | 0.59 (0.78) | 1.92 (0.75) * | −1.01 (0.82) |
| Interior type | 1.92 (0.41) *** | −2.72 (0.38) *** | −2.15 (0.44) *** |
| Constant | −15.07 (3.97) *** | −13.86 (3.70) *** | −10.23 (4.44) * |
| Uncentered R2 | 0.89 | 0.91 | 0.86 |
| F | 11.45 *** | 12.72 *** | 7.68 *** |
| LM Statistic | 108.54 *** | 114.99 *** | 76.32 *** |
| Sargan-Hansen Statistic | 0.001 | 0.89 | 11.09 ** |
Note. * p < 0.05; ** p < 0.01; *** p < 0.001. The coefficient for Age2 for Model 3b was −0.0047. S.E. denotes Standard Error.
Table 6.
Brand image explained by artistic perception and environment-friendly.
| Model 4a | Model 4b | Model 4c | |
|---|---|---|---|
| Coef. (S.E.) | Coef. (S.E.) | Coef. (S.E.) | |
| Art placement | |||
| Estimated art in show window | 5.50 (0.53) *** | ||
| Estimated art around furniture | 5.93 (0.54) *** | ||
| Estimated art around the stairs | 7.15 (0.83) *** | ||
| Environment-friendly | 1.61 (0.52) ** | 0.47 (0.52) | 1.38 (0.62) * |
| Environmental behavior | 0.50 (0.26) | 0.26 (0.25) | 0.01 (0.32) |
| Store behavior | −0.09 (0.07) | −0.06 (0.07) | −0.16 (0.09) |
| Female (=1) | −0.07 (0.42) | −0.85 (0.41) * | −1.02 (0.52) * |
| Age | 0.30 (0.18) | 0.48 (0.18) ** | 0.29 (0.22) |
| Age2 | −0.00 (0.00) | −0.00 (0.00) * | −0.00 (0.00) |
| Education (ref. ≤ high school) | |||
| College | 0.46 (0.55) | 0.11 (0.52) | −0.23 (0.64) |
| Graduate or higher | 0.78 (0.91) | 0.01 (0.86) | −1.19 (1.06) |
| Married (=1) | 0.59 (0.59) | 1.87 (0.59) ** | 0.51 (0.70) |
| Income (ref. ≤ 2 million won) | |||
| 2 million to 4 million won | 1.13 (0.77) | 2.81 (0.76) *** | −0.27 (0.92) |
| 4 million to 6 million won | 0.76 (0.83) | 2.55 (0.81) ** | −0.45 (0.98) |
| 6 million to 8 million won | 1.07 (0.91) | 2.00 (0.88) * | −0.46 (1.08) |
| Over 8 million won | 1.31 (0.94) | 2.79 (0.91) ** | −0.52 (1.12) |
| Interior type | 4.01 (0.50) *** | −1.10 (0.46) * | −0.54 (0.54) |
| Constant | −17.39 (4.78) *** | −16.49 (4.49) *** | −13.35 (5.40) |
| Uncentered R2 | 0.91 | 0.91 | 0.87 |
| F | 11.00 *** | 12.33 *** | 7.86 *** |
| LM Statistic | 108.54 *** | 114.99 *** | 76.32 *** |
| Sargan-Hansen Statistic | 4.77 | 2.11 | 4.24 |
Note. * p < 0.05; ** p < 0.01; *** p < 0.001. The coefficient for Age2 for Model 4b was −0.0047. S.E. denotes Standard Error.
Table 7.
Consumer satisfaction explained by artistic perception and environment-friendly.
| Model 5a | Model 5b | Model 5c | |
|---|---|---|---|
| Coef. (S.E.) | Coef. (S.E.) | Coef. (S.E.) | |
| Art placement | |||
| Estimated art in show window | 7.07 (0.65) *** | ||
| Estimated art around furniture | 7.63 (0.66) *** | ||
| Estimated art around the stairs | 9.06 (1.00) *** | ||
| Environment-friendly | 2.03 (0.64) ** | 0.55 (0.63) | 1.73 (0.75) * |
| Environmental behavior | 0.41 (0.32) | 0.10 (0.30) | −0.21 (0.38) |
| Store behavior | 0.05 (0.09) | 0.09 (0.09) | −0.03 (0.11) |
| Female (=1) | −0.78 (0.52) | −1.79 (0.50) *** | −1.99 (0.63) ** |
| Age | 0.64 (0.22) * | 0.78 (0.22) *** | 0.52 (0.26) * |
| Age2 | −0.01 (0.00) * | −0.01 (0.00) ** | −0.01 (0.00) |
| Education (ref. ≤ high school) | |||
| College | 0.31 (0.67) | −0.14 (0.63) | −0.59 (0.78) |
| Graduate or higher | 0.58 (1.11) | −0.41 (1.05) | −1.95 (1.29) |
| Married (=1) | 1.04 (0.72) | 2.68 (0.71) *** | 0.93 (0.85) |
| Income (ref. ≤ 2 million won) | |||
| 2 million to 4 million won | 1.32 (0.94) | 3.48 (0.93) *** | −0.46 (1.11) |
| 4 million to 6 million won | 1.19 (1.01) | 3.49 (0.98) *** | −0.35 (1.19) |
| 6 million to 8 million won | 1.54 (1.11) | 2.73 (1.07) * | −0.42 (1.32) |
| Over 8 million won | 1.80 (1.14) | 3.71 (1.10) ** | −0.52 (1.36) |
| Interior type | 5.20 (0.60) *** | −1.37 (0.55) * | −0.62 (0.66) |
| Constant | −29.86 (5.82) *** | −28.74 (5.45) *** | −24.23 (6.57) *** |
| Uncentered R2 | 0.89 | 0.90 | 0.85 |
| F | 13.43 *** | 15.15 *** | 9.45 *** |
| LM Statistic | 108.54 *** | 114.99 *** | 76.32 *** |
| Sargan-Hansen Statistic | 7.09 * | 3.94 | 8.51 * |
Note. * p < 0.05; ** p < 0.01; *** p < 0.001. S.E. denotes Standard Error.
Publisher’s Note: MDPI stays neutral with regard to jurisdictional claims in published maps and institutional affiliations. |
© 2021 by the authors. Licensee MDPI, Basel, Switzerland. This article is an open access article distributed under the terms and conditions of the Creative Commons Attribution (CC BY) license (https://creativecommons.org/licenses/by/4.0/).
Share and Cite
MDPI and ACS Style
Kim, J.; Heo, W. Interior Design with Consumers’ Perception about Art, Brand Image, and Sustainability. Sustainability 2021, 13, 4557. https://doi.org/10.3390/su13084557
AMA Style
Kim J, Heo W. Interior Design with Consumers’ Perception about Art, Brand Image, and Sustainability. Sustainability. 2021; 13(8):4557. https://doi.org/10.3390/su13084557
Chicago/Turabian StyleKim, Jeongah, and Wookjae Heo. 2021. "Interior Design with Consumers’ Perception about Art, Brand Image, and Sustainability" Sustainability 13, no. 8: 4557. https://doi.org/10.3390/su13084557
Note that from the first issue of 2016, this journal uses article numbers instead of page numbers. See further details here.