Article

Multidimensional Conditions of the First Wave of the COVID-19 Epidemic in the Trans-Industrial Region. An Example of the Silesian Voivodeship in Poland

by
Robert Krzysztofik
*,
Iwona Kantor-Pietraga
and
Tomasz Spórna
Institute of Social and Economic Geography and Spatial Management, University of Silesia in Katowice, 41-200 Sosnowiec, Poland
*
Author to whom correspondence should be addressed.
Sustainability 2021, 13(8), 4109; https://doi.org/10.3390/su13084109
Submission received: 7 March 2021 / Revised: 4 April 2021 / Accepted: 6 April 2021 / Published: 7 April 2021
(This article belongs to the Collection Impact of COVID-19 on the Environment, Energy and Economics)

Abstract

:
The successive phases of the global COVID-19 pandemic show some differences from the first wave in 2020. The most important of these is some experience in responding to its spread and in applying vaccines. However, new, more aggressive variants of COVID-19 mean that the pandemic is often taking on the nature of the one experienced by societies a year ago. So, the knowledge about the first wave of the COVID-19 pandemic is still up-to-date—significantly where the essential determinants of its spread have not changed. The article presents the Silesian Voivodeship case in Southern Poland, distinguished by different geographical conditions compared to the entire country. The authors showed the relationship between the spread of the COVID-19 epidemic and the characteristic attributes of the analysed area (post-)mining functions or urban shrinkage. The article conducted a dependence study using the Pearson correlation coefficient and the signs table method. In turn, the authors used thematic cartography to present the results of the analysis. It turned out that two attributes, namely (post-)mining and urban shrinkage, are essential in spreading the epidemic with the region analysed. This conclusion may be essential in implementing national and regional policies related to reducing the COVID-19 pandemic. However, a limitation in the scope of the presented applications is the fact that mining regions, such as the Silesian (Śląskie) Voivodeship, are currently less numerous in the world than, for example, those that develop based on services.

1. Introduction

The development of the COVID-19 epidemic in many countries has been slightly different. These differences are also visible inside these countries. This fact may indicate the influence of various internal factors contributing to the spread of the epidemic. The epidemic spread only to some neighboring regions and did not spread to others, which can be explained by local policy specificity. However, when its role is of secondary importance, as was the case in Poland, other attributes that determine the epidemic’s course come to the fore. Their knowledge is essential, especially in actions taken afterwards that may be insufficient or otherwise too restrictive. Therefore, the key to researching the COVID-19 epidemic is analysing this phenomenon’s spatial distribution globally, regionally, and locally. Although the terms “pandemic” or “epidemic” emphasise the mass nature of the phenomenon, its geographical spatial distribution is quite diverse [1,2].
The factors, such as urbanisation, population density, socio-economic development of societies, political and organisational conditions [3,4], also have a variable and non-uniform impact on infectious diseases. In geographic research, spatial analysis methods, cartographic methods, and GIS help explain epidemics [5,6,7]. This approach already has more than 160 years of tradition, which began with J. Snow in 1854 [8].
To consider the complicated background of various epidemics (including [9,10,11,12,13]), the authors also try to put together the region’s specific features. The article aims to answer the question: to what extent do the specific socio-economic and spatial characteristics of the Silesian (Śląskie) Voivodeship influence the diversification of confirmed COVID-19 cases in this region? To what extent do the attributes mentioned above cause it? Explanations of the specific factors behind the spread of the COVID-19 pandemic remain a research gap despite the emergence of new articles [14,15,16].

2. Research Review

The COVID-19 epidemic issues in the Silesian Voivodeship and its conditions are part of several essential scientific discourses. The first scientific discourse concerns understanding the social epidemic’s role and its multidimensional consequences [17,18,19]. Due to the research area adopted, a highly industrialised and urbanised region, two types of work are equally important. The first papers focus on spreading viruses in urban and urbanised environments [20,21,22,23]. The second studies describe specific conditions in urbanised regions, such as the forced interpersonal closeness of people or high frequency and contact stability [24]. While the issues mentioned above already have extensive scientific coverage (for obvious reasons), problems connected with COVID-19 are much less recognised globally.
The issue of the COVID-19 epidemic is presented in publications using two main approaches. First of all, the use of published data, the sources of which are official information on confirmed cases of COVID-19 infection, deaths caused by COVID-19, the number of people recovering, and information on the demographic structure of people who died after infection [25,26]. All this information is published as raw empirical data or is an attachment of short notes and generalised comments. On the other approaches, the second approach uses data on COVID-19 placed on interactive portals presenting a numerical and cartographic approach (see, among others, [27,28]).
The second approach focuses on analysing the COVID-19 epidemic affecting the territories of individual countries or parts of the world [2,29,30,31,32,33,34]. From the research area’s point of view, studies on the COVID-19 epidemic in Poland are important [35,36,37,38,39,40], especially in cities and an environment conducive to infections [41]. There is still insufficient research in this area. An element of scientific research that was important in explaining the specifics of the COVID-19 epidemic in the analysed region was publications devoted to the diversity and individuality (demographic, social, economic, spatial) of this region [42,43,44]. This trend of research fits into the broader background of research on issues such as shrinking cities [45,46], the socio-economic transformation of regions of the traditional economy [47], or the development of polycentric regions [48,49].

3. Socio-Economic Outline of the Transformation in the Silesian Voivodeship

The Silesian Voivodeship is one of the most populated (4.5 million inhabitants) and industrialised Poland regions. Traditional industry has been the basis of the region’s development for over 200 years (mainly hard coal mining, metallurgy, energy, machine industry, metallurgy). Due to the restructuring of the traditional industry, there has been a significant economic decline in the region. Starting from the beginning of the 21st century, some urban centres began to develop again due to the region’s partial reindustrialisation (mainly based on the automotive industry). Others are still regressing.
Currently, the region’s image in terms of economic structure and economic development is very diverse. Within its geographical space, there is a kind of mosaic pattern in this respect. This phenomenon was called ‘trans-industrialism’ [44]. The phenomenon of depopulation also overlapped with the economic crisis of the studied region in the 1990s. In the years 2000–2019, the Silesian Voivodeship population fell from 4.85 million to 4.52 million [50]. However, while some cities began to develop economically, depopulation affected all large and medium-sized cities. For example, Katowice’s population, the Silesian Voivodeship capital, dropped from 366,798 in 1990 to 294,510 in 2019 [50,51]. The aging of the population is a sign of the demographic crisis. The age dependency ratio of the elderly in the Silesian Voivodeship is steadily increasing. In 2003, it was 17.4, and in 2019 it had already reached 29.0 [42,50]. The effect of the phenomenon described is quite common where regional urban shrinkage is occurring. The most depopulated cities are located in the region’s central part and form a polycentric Katowice conurbation [42,43,44]. The Silesian Voivodeship has a rather specific spatial arrangement. A characteristic feature is polycentric urban agglomerations with a very complex, mosaic arrangement of spatial structures and connections [52,53].

4. Data and Methods

The course of the first wave of the COVID-19 epidemic in Poland and the attempt to define this issue on a regional scale in spatial terms determine the data and research methods’ scope. The article concerns the Silesian Voivodeship area in southern Poland, near the Polish border with the Czech Republic and Slovakia.
The research period covers the period from 4 March to 22 June 2020. The date of commencement of the analysis includes the first case of COVID-19 in Poland [54].
Demographic and economic data on confirmed COVID-19 cases, depending on their availability, were aggregated for municipalities (in polish-gmina; the NUTS-5 level of the European hierarchical classification of territorial units), poviats (NUTS-4), and the voivodeship area (NUTS-2) (comparative data with other Polish provinces). There are three types of gminas (NUTS-5) in the Silesian Voivodeship administrative division: urban communes, urban-rural communes, and rural communes. We distinguished the following types of communes for research from among these communes: mining, post-mining, depopulation, and communes with population growth (see Appendix A Table A1). Due to the subject of the study, the data used can into two groups.
The first of these includes general geographic data on the analyses region:
  • Number and distribution of the population and population dynamics, population density, number of employed persons [50].
  • Data on the operation of large mining plants [44,55,56,57].
  • Data on urban development classification in the region (Delimitation of Medium-Sized Cities Losing their Socio-Economic Functions [58]).
The second group of data is those on the COVID-19 epidemic in Poland and the Silesian Voivodeship. The primary data source was daily reports from 20 county Sanitary and Epidemiological Stations in the Silesian Voivodeship [59]. These data apply to both poviats and communes. In both cases, they include the number of confirmed cases of infection and the number of deaths, in the case of deaths, data from the Ministry of Health. Also, the data of the Practical Medicine portal [60].
In the first stage of the analysis, we compared the basic statistics characterising all types of the surveyed communes (Table A1) with confirmed cases and deaths of COVID-19 (Appendix B Table A2). The r-Pearson correlation coefficient was then calculated to determine the correlation between the selected variables and confirmed cases of infections and COVID-19 deaths during the first wave of the Silesian Voivodeship epidemic. These variables were: population, population density, population changes (2000–2019), employees, and in the case of mining municipalities, also employees in coal mines.
The next step of the analysis concerned the verification of the research goal. Statistical methods and techniques were applied consisting in determining the r-Pearson correlation coefficients for individual determinants together with the analysis of the significance of the indicators according to the following formula:
r x y = i = 1 n x i x ¯ y i y ¯ i = 1 n x i x ¯ 2 i = 1 n y i y ¯ 2
where xi, yi variables describe objects and x ¯ , y ¯ corresponds to the means of the two arrays of values x and y.
The r-Pearson linear correlation coefficient calculates the relationship between quantitative variables, also called the linear correlation coefficient [61]. It assumes values from the interval [−1; 1], the closer it is to “0”, the weaker the tested linear relationship between the variables [62]. The second important factor necessary for the correct interpretation of the r-Pearson correlation coefficient is determining its significance level (p). This index is strongly dependent on the sample size (size) for the adopted significance level α.
p = r x y 1 r x y 2 n 2
where n is the population size and r x y Pearson correlation coefficient
When interpreting the correlation coefficient (r), the significance level parameter (p) should be particularly taken into account if the calculations take into account a relatively small number of variables (n), which may affect the reliability of the interpretation of the results. The correlation result is reliable as long as it is greater than the studied correlation’s significance level.
The next step of the research was to compare the population density and population dynamics with confirmed cases and deaths from COVID-19 in individual communes of the Silesian Voivodeship. One of the typological methods [63,64] was used to compare this, the table of signs [65,66]. The signs table we use in the most straightforward division of a set into classes (types), carried out based on a small number of features.
The algorithm includes:
  • defining a data matrix.
  • the calculation for each feature of the arithmetic mean (or median).
  • comparing consecutive numerical quantities in columns with the mean (or median) in the case of a feature value higher than the mean (or median), we enter a plus sign, other-wise a minus sign.
  • the construction of a pattern table into which we enter all theoretical combinations of plus and minus signs (for two features, the combinations are four; for three features of a combination, there are eight; for four features of a combination, there are sixteen).
  • assigning the subsequently tested units to the appropriate classes in the model table.
Comparing two characteristics each time (population density and confirmed COVID-19 cases per 100,000 inhabitants and population dynamics and confirmed COVID-19 cases per 100,000 inhabitants), we obtained four typological classes. Then, choropleth maps (thematic cartography) were constructed for the distinguished typological classes. An essential aspect of the research was the use of thematic cartography [67]. The set of maps was created to facilitate reading the analyzed phenomena and structures in the Silesian Voivodeship.

5. Results

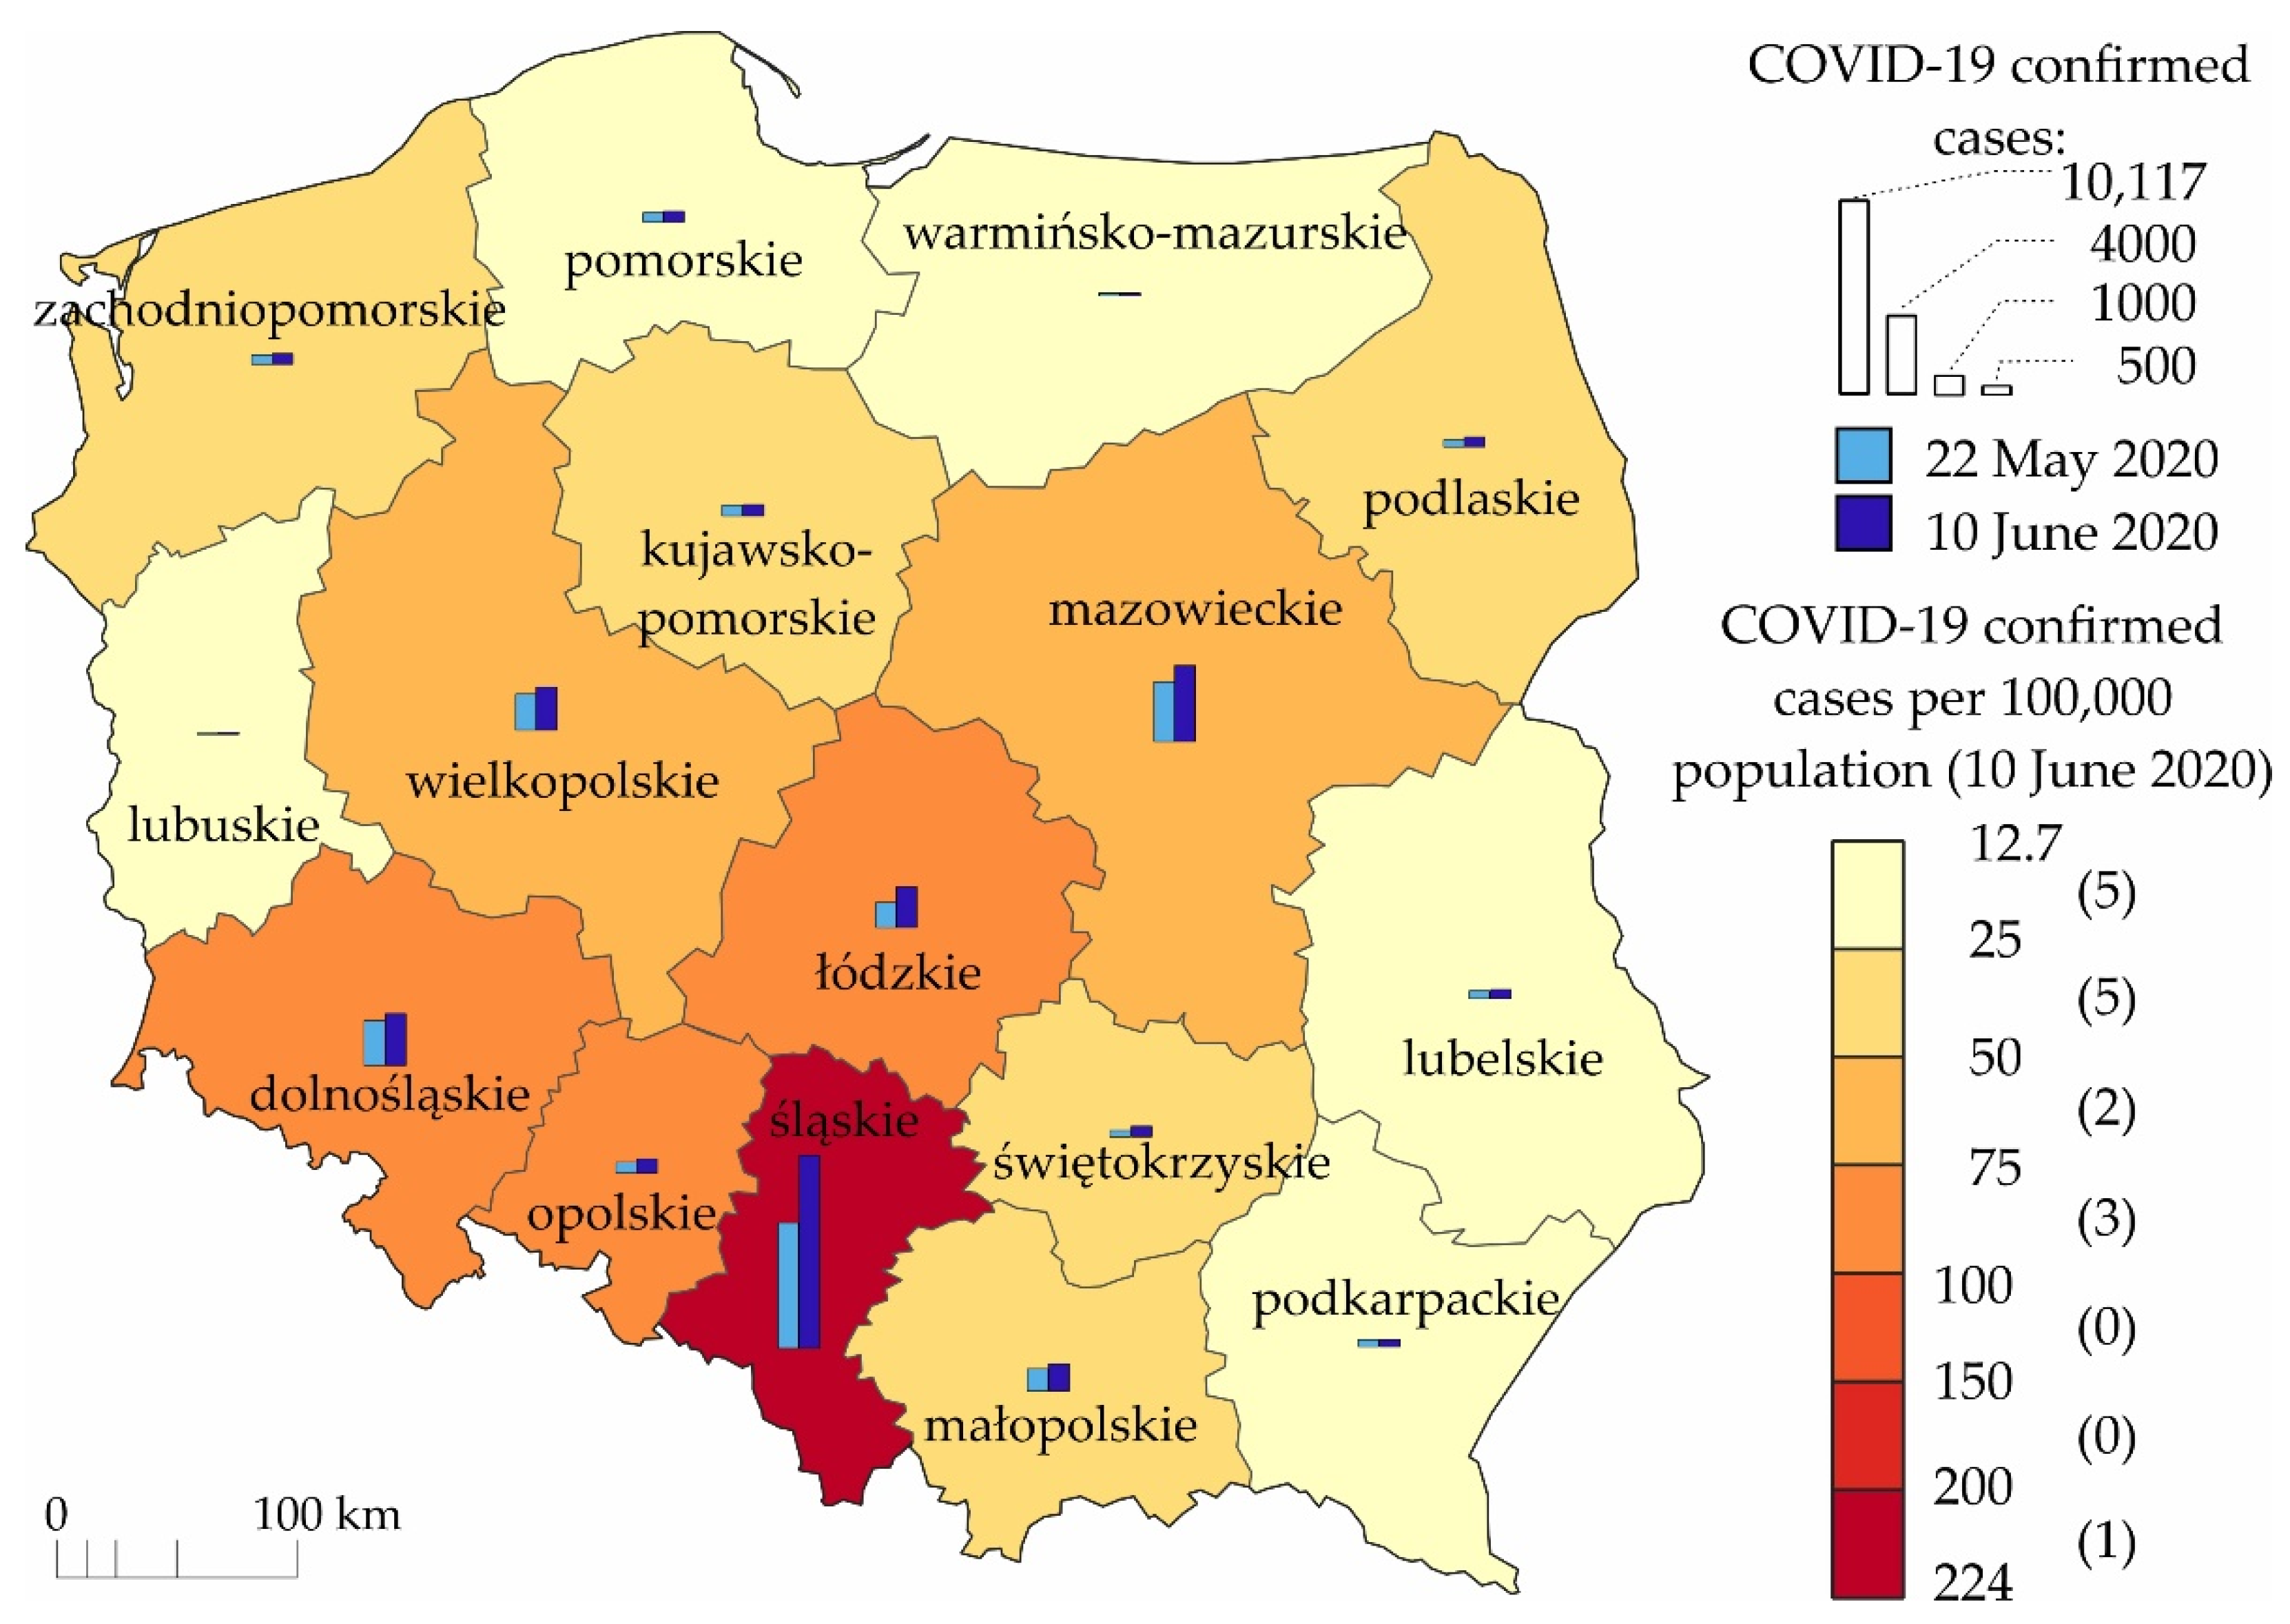
5.1. The First Wave of the Epidemic in Poland

The development of the COVID-19 epidemic, which appeared in Poland on 4 March 2020, progressed rapidly. As of early April, it has reached 300–500 confirmed cases per day. Until June 22, Poland had 32,227 COVID-19 cases and 1359 deaths due to coronavirus infection (the data comes from the Ministry of Health’s daily reports of 22 June 2020 [25]).
In Poland, since mid-April, most cases of COVID-19 have occurred in the Silesian Voivodeship in the southern part of the country. The development of the epidemic in Poland was twofold as early as May 2020 [39]. A significant percentage of confirmed cases in this period, from 20% to 50%, concerned epidemics in hospitals and social care institutions. The number of confirmed cases in all voivodships, except for the Silesian Voivodeship, started to decrease or remained at the same level. On the other hand, in the Silesian Voivodeship, the number of confirmed cases grew steadily and rapidly. At the beginning of June, as much as 36.7% of all reported COVID-19 infections in Poland concerned the Silesian Voivodeship (Figure 1).
Such a clear imbalance between the percentage of inhabitants with confirmed COVID-19 infection and the total population may indicate that it was not only a large number of inhabitants that caused an increase in the epidemic in the Silesian Voivodeship.
The duality of the COVID-19 epidemic in Poland has quickly become a significant political problem. The essential issue was that it hindered political decisions related to the economy’s dehibernation, social institutions, and interpersonal relations in public space. Undoubtedly, miners’ infections working in numerous hard coal mines were a significant proportion of such a large number of confirmed COVID-19 incidents in the Silesian Voivodeship. The miners account for more than half of the 11 thousand cases of infected people in the Silesian Voivodeship and almost 20 per cent of Poland’s nearly 30,000 cases of infection [68]. This fact indicates the regional specificity of the epidemic in this region and Poland as a whole, but it has broader conditions requiring explanation.

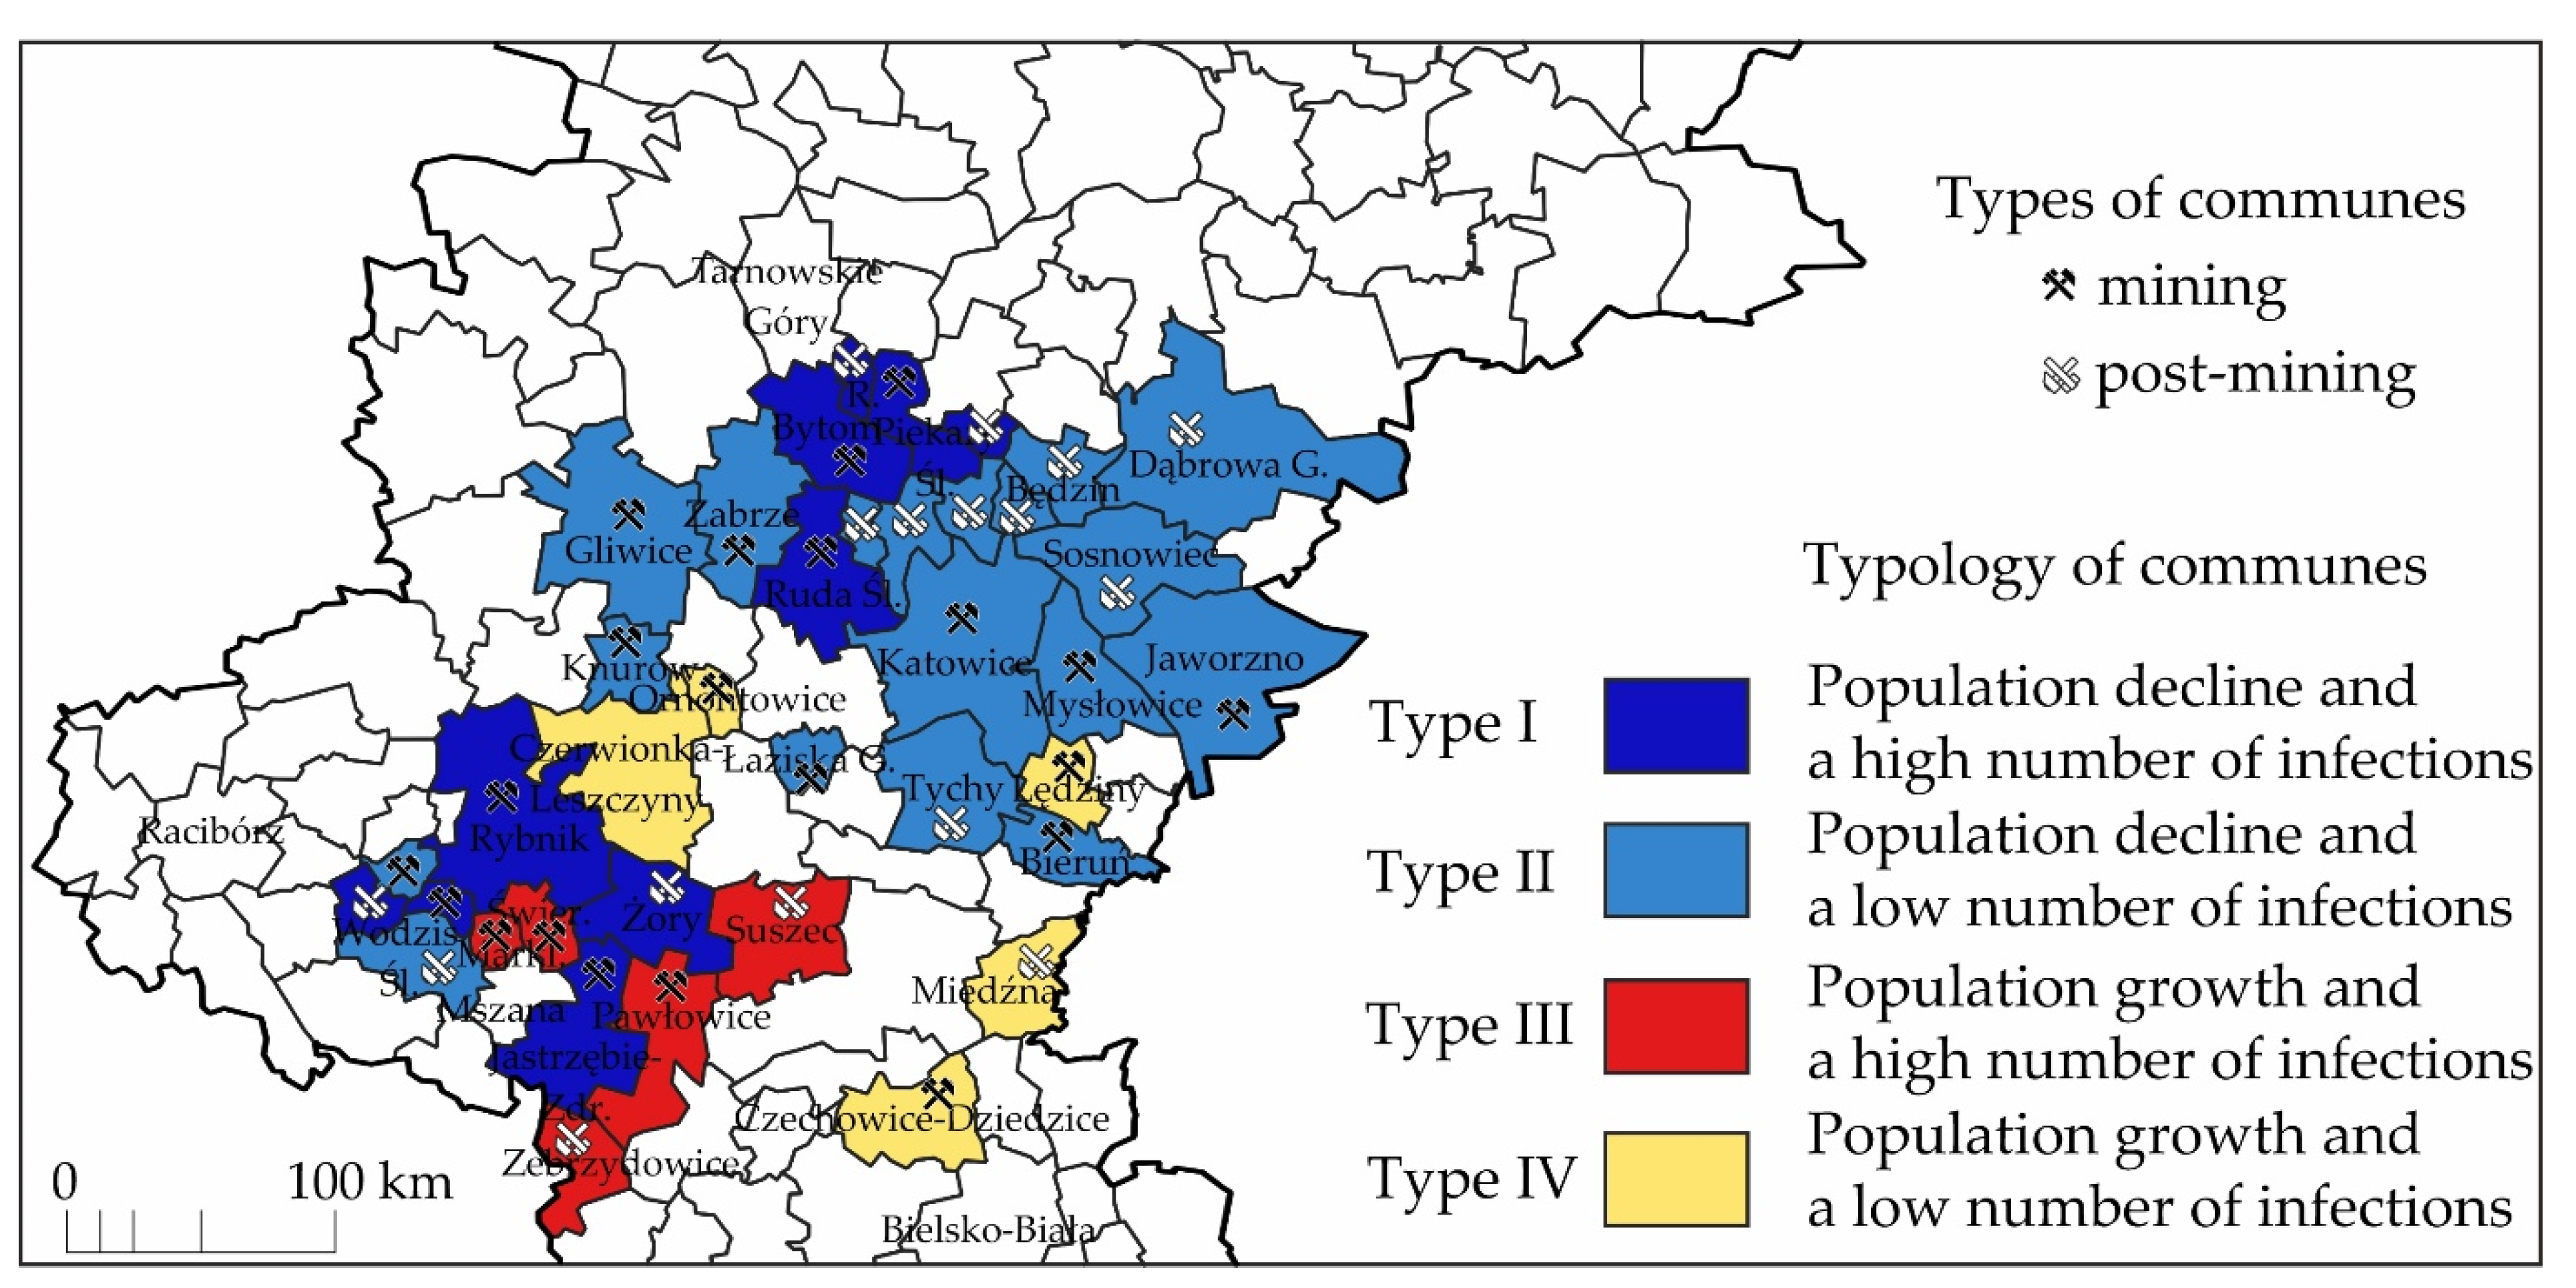
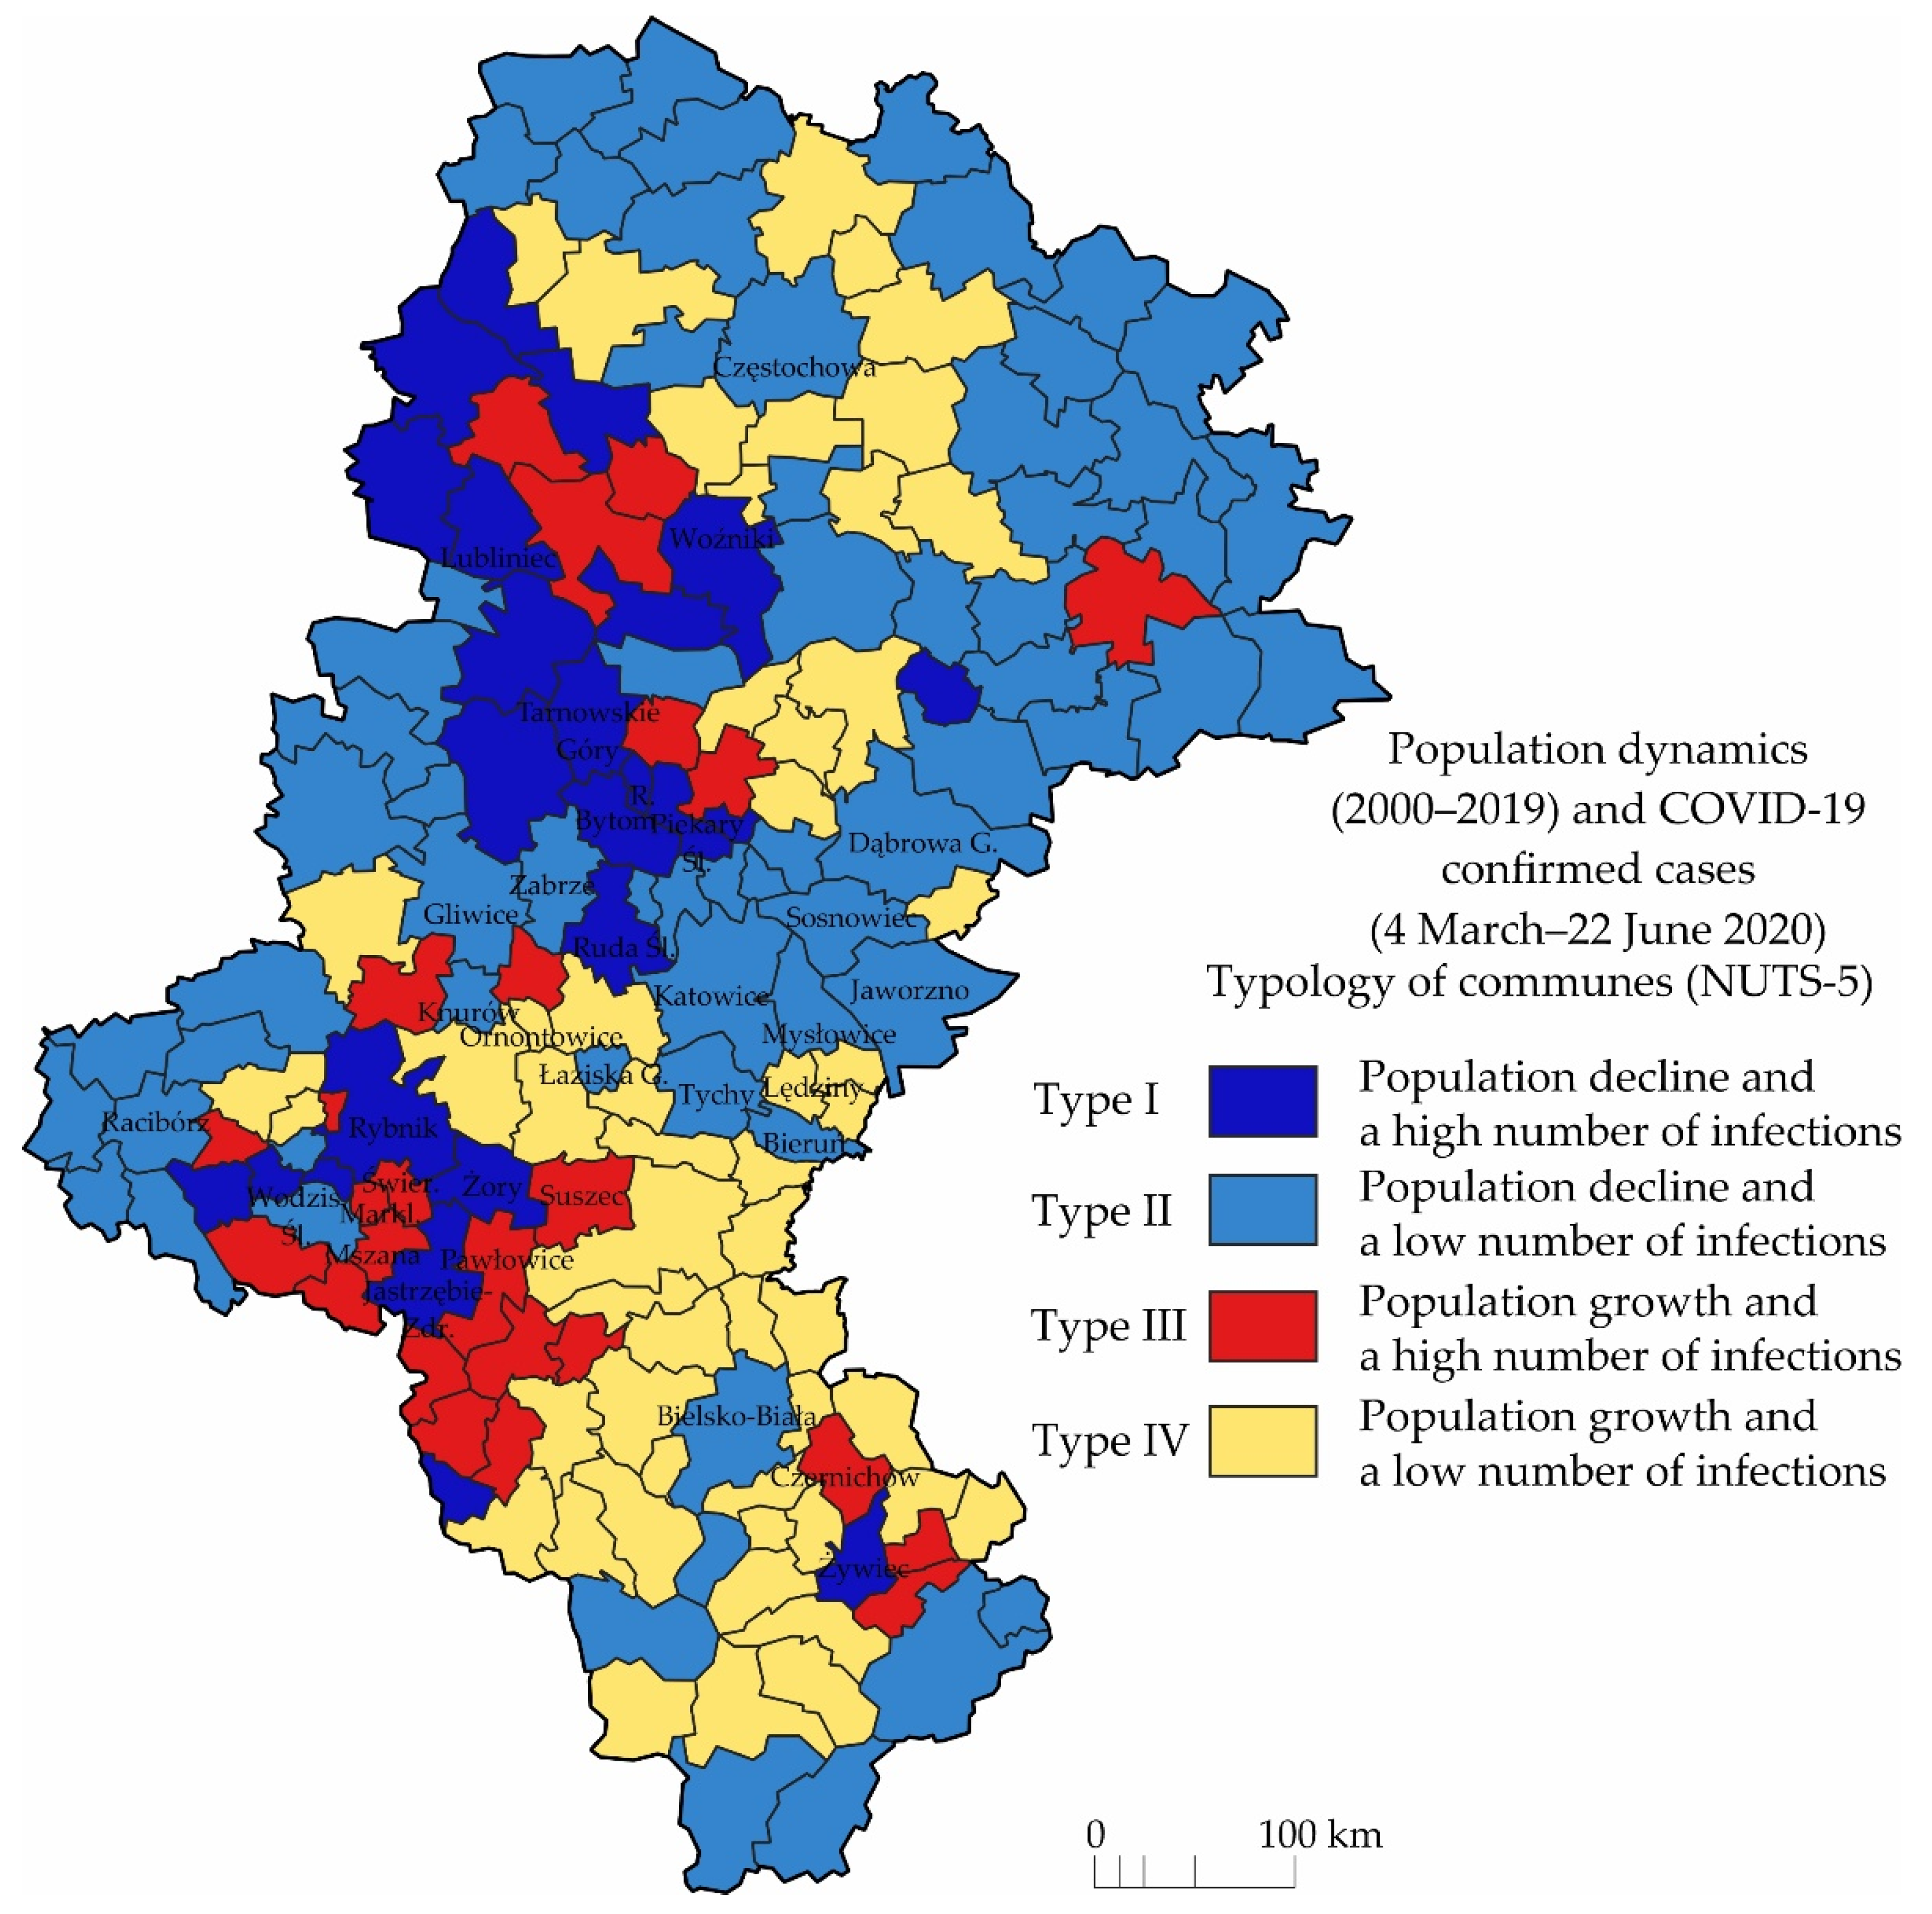
5.2. Conditions for the Development of the First Wave of the COVID-19 Epidemic in the Silesian Voivodeship

Although the COVID-19 epidemic’s research emphasises its socio-demographic dimension, economic factors are also crucial in its spread and consequences (see, among others [69,70]).
First, it examined the population’s concentration and how it influenced the Silesian Voivodeship epidemic scale. For this purpose, we compared the population density with many confirmed COVID-19 cases in municipalities of the investigated voivodeship (Figure 2). As a result, we obtained four typological classes. The average population density was 442 people per 1 km2. It turned out that only 9.0% of communes found themselves in the type characterised by a high population density and a high number of infections (Type I). However, in 17.0% of cases, few infections (Type II) were recorded despite the high population density.
The picture described the specific nature of the Silesian Voivodeship, both in the socio-economic and spatial dimensions, different from all other Polish voivodeships [71]. The spatial distribution and dynamics of the COVID-19 epidemic in this region are also somewhat different (Figure 3).
As mentioned above, this situation changed entirely in mid-May 2020, with a marked increase in the Silesian Voivodeship in terms of incidence, while other voivodeships had a slight increase or stagnation of confirmed infection cases. For example, on June 10, out of 27,757 confirmed cases, as many as 10,178 occurred in the Silesian Voivodeship (Ministry of Health). This fact should be associated with massive infections among miners. On May 13, there were over 1200 infected miners. In mid-June, there were over 5900 infected employees of mines [72]. This relationship is shown in Figure 4, which compares the number of infections per 100,000 inhabitants with mining and post-mining gminas distribution.
Interestingly, no mass infections have been reported in other industries—metallurgy, energy, automotive, or logistics. In mining, infections were unavoidable due to the specific organization of work in hard coal mines, especially the miners’ movement within the mine’s underground part (including elevators and mining railroads) (see [71]). The significance of confirmed infections in the mining sector is shown in Figure 4.
Coal mines affected by the epidemic were located in such communes as Rybnik, Bytom, Ruda Śląska, and Jastrzębie-Zdrój (Type I). This group of municipalities also includes post-mining communities: Żory, Pszów, Radzionków, and Wojkowice. Many miners commuting to mining towns live there. It is worth emphasizing, however, that infections in mining gminas also had uneven spatial distribution. Most infections were recorded in the northern (Piekary Śląskie, Ruda Śląska, Bytom) and southern (including Jastrzębie-Zdrój, Rybnik, Żory) zones. The epidemic was limited in the central (Knurów, Ornontowice, Łaziska Górne) and eastern zones (Bieruń, Lędziny). This distinction is due to delayed responses to the first cases of infection in the mines in the first group of mining cities and quick responses in the second group of municipalities. Measures to counteract the epidemic consisted of strengthening security procedures on the one hand and stopping mining operations on time on the other. Undoubtedly, the second action had a more significant effect.
Interestingly, the intense concentration of COVID-19 infection in mining did not directly reference the correlation index for mining municipalities (Appendix C Table A3). In the case of the infections themselves, it was related to the dispersion of miners’ residence places in other gminas. On the other hand, the low correlation ratio between deaths and mining gminas was because most of the infected were people aged 20–50, relatively more resistant to infection.
We noted many COVID-19 cases in some smaller municipalities located on large cities’ periphery (Figure 5). Their populations did not exceed 24,000 each, and infections occurred mainly in social and health care institutions. In these gminas (including Woźniki, Lubliniec, Kalety), the highest number of confirmed cases of COVID-19 occurred in the first period of the development of the epidemic. Nursing homes exist in almost all large and medium-sized cities of the region and some smaller ones. However, most cases of infection occurred in small towns, where the private sector dominates such care.
However, among large cities, the most challenging situation was in Bytom, where confirmed cases of COVID-19 concerned both public (hospital) and private (care centre) institutions. An epidemic in hospitals also took place in other larger cities (including Katowice, Ruda Śląska, Sosnowiec, Wodzisław Śląski).
The third group of cities where a large number of confirmed COVID-19 cases were noticeable are shrinking cities. These cities are located mainly in the central part of the Silesian Voivodeship [73]. In many of them, the consequences of the economic downturn, depopulation, and social problems pose a crucial challenge for local governments [74,75]. Figure 4 shows that the coal mining characteristic was of greater importance than the urban shrinkage. The mining towns with population growth and demographic decline show this well. The emerging question of why the largest indicator is not in mining and depopulated municipalities explains their demographic potential. The cities shrinking in the region are mainly medium and large cities (with 20,000–300,000 inhabitants), where only some of the inhabitants are related to mining. On the other hand, municipalities with a growing population are small (up to 20,000 inhabitants) and suburban, where hard coal mining is crucial.
We noticed the thesis’s confirmation about the overlapping of the attributes of mining and shrinking gminas municipalities after a thorough analysis of Type I’s centers in Figure 4. In type I, all cities had the highest (over 200 cases on average) number of infected persons per 100,000. Inhabitants, still (after services) the most crucial sector of the economy is mining (Rybnik, Jastrzębie-Zdrój). They live in these cities, large groups of miners commuting to the neighboring mining towns. However, the most telling example is Bytom—a model example of a city that is shrinking, with the highest number of registered unemployed, a high demographic decline rate, and many infrastructural, spatial, and social problems [75,76]. In this city, the infection rate per 100,000 inhabitants is the highest in large and medium Silesian Voivodeship and Poland cities.
In depopulating municipalities, r-Pearson’s correlation index between the number of confirmed COVID-19 cases and the number of inhabitants was 0.5626, p < 0.001, and it was higher than in mining communes (Table A3). The explanation for this may be the fact that the population of these communes inhabited them. On the other hand, in the case of mining municipalities, miners’ place of employment differed from residence.
The number of infections in depopulated gminas is also associated with a high proportion of older people, because older people had symptoms of infection much more often. A more significant proportion of younger age groups increases the chance of so-called asymptomatic infection, resulting in a lack of awareness of infection and its lack of registration in official statistics. As mentioned, in the 20–50 age group, over 90% of surveyed miners showed no symptoms.
The concentration of reported COVID-19 cases in mining cities and cities shrinking is also indirectly associated with the phenomenon of ‘trans-industrialism’ [43]. ‘Trans-industrialism’ is a process of uneven economic and social transformation of a traditional region. The existing mining and industrial region is transforming into a mosaic system. In this system, mining cities (in a broader context, mining gminas), post-industrial cities without new exogenous functions, co-industrialized cities, cities of new and creative industries, and service cities coexist same time. Out of this group, the epidemic has focused mainly on mining gminas and depopulating gminas.
It turned out that both phenomena: depopulation and the most significant scale of the spread of confirmed cases of COVID-19, were the same municipalities. The explanation of the increased incidence of COVID-19 in depopulating communes may be related to less-developed or underinvested social and health infrastructure and the inhabitants’ wealth structure [77,78].

6. Discussion

The COVID-19 epidemic in Poland affects social, demographic, or economic conditions (including social and demographic groups susceptible to infection, the distribution of social and economic institutions in which there is close physical contact between people, and weaker well-preparedness in terms of organization). In the Silesian Voivodeship, unlike most other voivodships in Poland, economic factors were of fundamental importance. The problem of confirmed COVID-19 cases in the hard coal mining industry was an essential element of the nationwide discourse on Poland’s epidemic in May 2020. It also turned out that, despite many infections, the epidemic’s character in this region was assortative (cf. [79]). According to official data, the first wave of the Silesian Voivodeship epidemic mainly concerned people employed in mines and miners’ families. The fact that population concentration in urban areas creates more excellent opportunities for people-to-people contact and therefore is of great importance for the transmission and evolution of communicable diseases in a broad sense [80] was not crucial here. It seems that this argument could also apply to urban shrinkage issues. If urbanization is one of the factors increasing the spread of the epidemic, then shrinking cities characterized by a regressive state of urban structures (social, demographic, economic, political) is a factor of much greater importance.
The first wave of the COVID-19 epidemic in the Silesian Voivodeship also affected Poland’s internal social and economic policy. Undoubtedly, the essential information was that over 98% of the miners surveyed with a confirmed infection had no symptoms or underwent very mild ones (in Poland, all miners had a COVID-19 test) [81]. Less than 2% needed hospitalisation, and very severe cases were incidental. This information triggered a nationwide discussion on the legitimacy of introducing lockdown, extending the deadline for some restrictions associated with it, as well as introducing certain restrictions and new rules where the economy and social institutions had already been dehibernated. These opinions are undoubtedly the voices of the environments that the lockdown has most harmed.
On the other hand, the persistent level of reported cases results in contrary reactions, which stress the need to maintain some restrictions. In this case, pro-social thinking dominates, focused primarily on protecting the elderly and those suffering from other diseases. The demographic aspect of the COVID-19 epidemic in the Silesian Voivodeship shows the gap between the social good (protecting seniors and those suffering from chronic diseases) and Poland’s economic good. The political dilemma that has arisen in this context concerns the question of the near future. Supporters of economic and social dehibernation as an argument in this discussion cite that Poland cannot afford such a deep lockdown. In any case, the so-called ‘handle removed from the well’ (cf. [8]), i.e., late control tests, already constituted a kind of test of the balance between the epidemic threat and the problematic situation of the Polish coal mining industry.
The issue of mass infections in hospitals, care centers, or coal mines is quite apparent, and it is related to the forced proximity of interpersonal contacts while at the same time not always meeting sanitary requirements. The problem of a large number of confirmed infections in shrinking cities may be more debatable. As noted in the literature on the subject, such cities are characterised by limited resilience, resulting from the shrinkage phenomenon’s effects and the causes that activate it [82,83,84]. Among these features, researchers [85,86] indicate a high proportion of older people (statistically weaker health) and a low proportion of children and adolescents (statistically better at bearing illness, or asymptomatic infection). Also, a higher unemployment rate and poverty level may impact on the maintenance of a personal sanitary regime, and fewer investment opportunities for cities (financial and organizational support for hospitals and other entities directly involved in combating the epidemic). In the Silesian Voivodeship, a significant increase in confirmed infections at the beginning of the epidemic was undoubtedly very significant in Bytom. Bytom has been a model example of a large city’s shrinkage in the post-industrial Katowice conurbation [87,88]. The systematic increase in the incidence of diseases among the inhabitants of communes not related to mining is also visible in other shrinking cities in the region.
The social discourse also raises the credibility of data on the number of infected people provided by the Ministry of Health. The limited number of tests performed means that even among experts, there is no consensus about whether 100,000 or even one million inhabitants have already had contact with the virus [89,90]. This argument, which is used primarily by supporters of lockdown, is further strengthened by more official statistical data. According to the Statistics Poland, the number of deaths in Poland in April 2020 (30,534 people) was lower than in April 2019 (33,613 people) and in April 2018 (34,639 people) [91]. Opponents of the argument about the ‘low harmfulness of COVID-19’ point to equally important facts: influenza infections decreased as a result of limited contacts, due to lockdown and a hotter spring, smog decreased significantly, which is exceptionally high in Poland during this period and how estimated responsible for over 40 thousand. Deaths per year [92]. Another important argument that will be verifiable in the future is the lower number of hospital admissions for organizational reasons and patient anxiety. Therefore, the discussion based on statistical data is problematic as much data is missing, most of the data will not be interpretable until later. On the other hand, in the public discourse, the exchange of views is based on the question: is it already so good, or is it seemingly so good?

7. Conclusions

Poland was one of the first countries in Europe to introduce a quick and deep lockdown in connection with the COVID-19 epidemic. Due to the limited possibilities of health care and social solidarity, this was the most appropriate solution, although very expensive, as in all other countries. After a few months of the epidemic, the critical question is: what will the situation look like in the coming year? Questions about the availability of vaccines and drugs during this period are intertwined with others regarding intergenerational solidarity and social challenges, resulting in age differences. The problematic questions are well illustrated by the example of Poland’s epidemic disparities, especially in the Silesian Voivodeship. Difficult social, economic, and spatial conditions that caused the epidemic in this region are evident at Poland’s scale as a whole and beyond. These considerations also charted a somewhat varied map of confirmed COVID-19 cases and, importantly, a map of challenges facing local and regional authorities. The example of the epidemic in Polish coal mining is also evidence of close interpersonal contacts in the spread of COVID-19 across society. The paradox is that this industry has become a specific and reliable research field for the COVID-19 epidemic in Poland. No professional group was tested earlier and currently so thoroughly (except for those employed in hospitals) demographically (the vast majority of men aged 20–50).
An important factor differentiating the number of confirmed COVID-19 cases in the Silesian Voivodeship about other Polish regions is the demographic and economic aspect, which we define as men’s participation age professionally associated with hard coal mining. In the Silesian Voivodship, it is so clear that the Ministry of Health’s announcements included days when the infected from one mine accounted for 50%–70% of all cases recorded for all of Poland. Because those working in mines in most cases live in municipalities where there are mines (or neighboring), the final picture of the mosaic pattern of confirmed COVID-19 cases in the Silesian Voivodeship mainly coincides with the distribution of hard coal mines. Demographic factors, such as depopulation and aging, are not that important. As already mentioned, the employment factor in mining is, however, a destimulant of recorded deaths caused by COVID-19. Many deaths due to COVID-19 concern demographically old or shrinking metropolitan municipalities (e.g., Sosnowiec). However, the most crucial finding in this article is that urbanisation (the concentration of many people in a highly urbanised area) may be of secondary importance in the spread of the epidemic. This finding is a research finding in a trans-industrial region, namely the Silesian Voivodeship under analysis.

Author Contributions

Conceptualisation, R.K.; methodology, R.K., I.K.-P., and T.S.; software, T.S.; validation, T.S.; formal analysis, R.K., I.K.-P., and T.S; investigation, R.K., I.K.-P., and T.S.; data curation, I.K.-P. and T.S.; writing—original draft preparation, R.K.; writing—review and editing, I.K.-P. and T.S.; visualisation, T.S.; supervision, R.K. All authors have read and agreed to the published version of the manuscript.

Funding

This research received no external funding.

Institutional Review Board Statement

Not applicable.

Informed Consent Statement

Not applicable.

Data Availability Statement

The data presented in this study are available on request from the corresponding author.

Conflicts of Interest

The authors declare no conflict of interest.

Appendix A

Table A1. Descriptive statistics 1 of the population, population density, population changes and employees in gminas (NUTS 5) of Silesian Voivodeship, Poland.
Gminas (NUTS 5)
of Silesian Voivodeship 2
Population (2019) [in Thousands]Population Density (2019)
[Persons in Thousands/km2]
TMinMaxMMdnSD MinMaxMMdnSD
Gminas (all types) (N = 167)4517.62.4292.827.011.344.7 0.033.70.40.20.6
Urban (N = 49)3270.55.7292.866.741.067.1 0.13.71.11.00.8
Urban-rural (N = 22)371.85.752.816.912.113.2 0.060.60.20.10.15
Rural (N = 96)875.32.424.49.17.94.3 0.030.60.180.140.13
Mining (N = 19)1466.85.2282.877.245.978.5 0.072.41.11.10.6
Post-mining (N = 19)1011.05.4199.953.242.152.0 0.23.71.30.971.0
‘Trans-industrial’ (N = 32)2608.48.5292.881.559.072.9 0.13.71.21.00.9
Depopulating (N = 79)3434.72.4292.843.513.560.4 0.043.70.60.190.8
Growing 3 (N = 88)1082.92.852.812.310.88.7 0.061.10.20.20.17
Gminas (NUTS 5)
of Silesian Voivodeship 2
Population Changes (2000–2019)
[in Thousands]
Employees (2019) [in Thousands]
TMinMaxMMdnSDTMinMaxMMdnSD
Gminas (all types) (N = 167)−248.0−37.85.2−1.50.076.412540.1171.87.51.618.6
Urban (N = 49)−310.6−37.82.8−6.3−1.810.210480.7171.821.411.230.2
Urban-rural (N = 22)6.5−1.73.80.3−0.31.476.10.517.33.51.94.1
Rural (N = 96)56.10.75.20.60.40.9130.00.110.01.31.01.3
Mining (N = 19)−156.6−37.82.5−8.2−1.312.4508.90.3171.826.810.939.8
Post-mining (N = 19)−85.0−34.52.1−4.4−1.068.5258.40.552.013.66.216.8
‘Trans-industrial’ (N = 32)−284.2−37.82.1−8.9−4.511.8794.10.7171.824.814.534.3
Depopulating (N = 79)−336.6−37.8−0.01−4.3−0.68.410540.1171.813.31.925.8
Growing 3 (N = 88)88.60.015.21.00.79.1199.90.217.32.21.42.9
1 Descriptive statistics: total (T), mean (M), median (Mdn), minimum (Min), maximum (Max), standard deviation (SD); 2 Urban gminas, urban-rural gminas, and rural gminas constitute 100% of Silesian Voivodeship units. The mining, post-mining, ‘trans-industrial,’ depopulating, and growing types are specific types of gminas distinguished for the research; 3 gminas with an increase in population.

Appendix B

Table A2. Descriptive statistics 1 of confirmed cases and deaths of COVID-19 in the first wave in the Silesian Voivodeship, Poland.
Gminas (NUTS 5)
of Silesian Voivodeship 2
Confirmed CasesDeaths
TMinMaxMMdnSDTMinMaxMMdnSD
Gminas (all types) (N = 167)12,6110129875.519164.263210371.914.0
Urban (N = 49)838551298171.169266.42050374.226.1
Urban-rural (N = 22)897017640.81357.4330131.50.52.8
Rural (N = 96)3329037834.71362.3830180.902.1
Mining (N = 19)507841298267.3107357970375.128.7
Post-mining (N = 19)270315542142.390129.5510152.723.4
‘Trans-industrial’ (N = 32)7539131298235.6119.6309.6160037537.2
Depopulating (N = 79)856701298108.426223.92130372.715.1
Growing 3 (N = 88)404403784616.568.31080181.202.5
1 Descriptive statistics: total (T), mean (M), median (Mdn), minimum (Min), maximum (Max), standard deviation (SD); 2 Urban gminas, urban-rural gminas, and rural gminas constitute 100% of Silesian Voivodeship units. The mining, post-mining, ‘trans-industrial,’ depopulating, and growing types are specific types of gminas distinguished for the research; 3 gminas with an increase in population.

Appendix C

Table A3. Correlation 1 between selected variables and confirmed cases and deaths of COVID-19 during the first wave of COVID-19 in the Silesian Voivodeship, Poland.
VariablesConfirmed CasesDeaths
Silesian Voivodeship—gminas
Population (2019)0.5681**0.6025**
Population density (2019)0.4330**0.4680**
Population changes (2000–2019)−0.4966**−0.6273**
Employees (2019)0.4523**0.4815**
Silesian Voivodeship—Urban gminas
Population (2019)0.4760**0.5970**
Population density (2019)0.2556 0.3830*
Population changes (2000–2019)−0.4339*−0.6529**
Employees (2019)0.3423 0.4325*
Silesian Voivodeship—Urban-rural gminas
Population (2019)0.6446**0.0048
Population density (2019)0.4204 0.0629
Population changes (2000–2019)0.5506*0.0428
Employees (2019)0.4053 0.0081
Silesian Voivodeship—Rural gminas
Population (2019)0.3924**0.1342
Population density (2019)0.3370**0.0351
Population changes (2000–2019)0.2760*0.0675
Employees (2019)0.4618**0.1031
Silesian Voivodeship—Mining gminas
Population (2019)0.5236 0.5895*
Population density (2019)0.4839 0.6595*
Population changes (2000–2019)−0.5840*−0.6976**
Employees (2019)0.3332 0.3560
Employees in coal mines (2019)0.3680 −0.0432
Silesian Voivodeship—Post-mining gminas
Population (2019)0.0878 0.7781**
Population density (2019)−0.1907 0.3537
Population changes (2000–2019)0.0681 −0.8071**
Employees (2019)0.0574 0.6628*
Silesian Voivodeship—‘Trans-industrial’ gminas
Population (2019)0.4290 0.5744**
Population density (2019)0.1525 0.3398
Population changes (2000–2019)−0.3501 −0.6400**
Employees (2019)0.3147 0.3902
Silesian Voivodeship—Depopulating gminas
Population (2019)0.5626**0.6623**
Population density (2019)0.4151**0.5140**
Population changes (2000–2019)−0.5022**−0.6957**
Employees (2019)0.4356**0.5142**
Silesian Voivodeship—Growing gminas 2
Population (2019)0.3429**0.0628
Population density (2019)0.1893 −0.0647
Population changes (2000–2019)0.2249 −0.0694
Employees (2019)0.2888*0.0451
1 Statistically important correlations (p < 0.05) are marked with bold letters. * Correlation significant an level p < 0.01; ** Correlation significant an level p < 0.001; 2 gminas with an increase in population.

References

  1. Campagna, M. Geographic Information and Covid-19 Outbreak Does the spatial dimension matter? TeMA-J. Land Use Mobil. Environ. 2020, 31–44. [Google Scholar] [CrossRef]
  2. Chung, C.K.L.; Xu, J.; Zhang, M. Geographies of Covid-19: How space and virus shape each other. Asian Geogr. 2020, 37, 99–116. [Google Scholar] [CrossRef]
  3. Grundy-Warr, C.; Lin, S. COVID-19 geopolitics: Silence and erasure in Cambodia and Myanmar in times of pandemic. Eurasian Geogr. Econ. 2020, 61, 493–510. [Google Scholar] [CrossRef]
  4. Wilkinson, A.; Ali, H.; Bedford, J.; Boonyabancha, S.; Connolly, C.; Conteh, A.; Dean, L.; Decorte, F.; Dercon, B.; Dias, S.; et al. Local response in health emergencies: Key considerations for addressing the COVID-19 pandemic in informal urban settlements. Environ. Urban 2020, 32, 503–522. [Google Scholar] [CrossRef]
  5. Kurland, K.S.; Gorr, W.L. GIS Tutorial for Health, 5th ed.; ESRI Press: Redlands, CA, USA, 2014. [Google Scholar]
  6. Tiboni, M.; Pezzagno, M.; Vetturi, D.; Alexander, C.; Botticini, F. Data analysis and mapping for monitoring health risk. What has the spread of the Covid-19 pandemic in northern Italy taught us? TeMA-J. Land Use Mobil. Environ. 2020. [Google Scholar] [CrossRef]
  7. Zhou, C.; Su, F.; Pei, T.; Zhang, A.; Du, Y.; Luo, B.; Cao, Z.; Wang, J.; Yuan, W.; Zhu, Y.; et al. COVID-19: Challenges to GIS with Big Data. Geogr. Sustain. 2020, 1, 77–87. [Google Scholar] [CrossRef]
  8. Kucharski, A.J. The Rules of Contagion: Why Things Spread—and Why They Stop, Wellcome Collection; Profile Books: London, UK, 2020. [Google Scholar]
  9. Baber, R. Pandemics: Learning from the past. Climacteric 2020, 23, 211–212. [Google Scholar] [CrossRef]
  10. Mayer, J.D. Geography, ecology and emerging infectious diseases. Soc. Sci. Med. 2000, 50, 937–952. [Google Scholar] [CrossRef]
  11. Shannon, G.W.; Pyle, G.F. The Origin and Diffusion of AIDS: A View from Medical Geography. Ann. Assoc. Am. Geogr. 1989, 79, 1–24. [Google Scholar] [CrossRef]
  12. Shannon, G.W.; Willoughby, J. Severe Acute Respiratory Syndrome (SARS) in Asia: A Medical Geographic Perspective. Eurasian Geogr. Econ. 2004, 45, 359–381. [Google Scholar] [CrossRef] [Green Version]
  13. Smallman–Raynor, M.; Johnson, N.; Cliff, A.D. The spatial anatomy of an epidemic: Influenza in London and the county boroughs of England and Wales, 1918–1919. Trans. Inst. Br. Geogr. 2002, 27, 452–470. [Google Scholar] [CrossRef]
  14. Davies, N.G.; Klepac, P.; Liu, Y.; Prem, K.; Jit, M.; Eggo, R.M. Age-dependent effects in the transmission and control of COVID-19 epidemics. Nat. Med. 2020, 26, 1205–1211. [Google Scholar] [CrossRef]
  15. Taubenböck, H.; Debray, H.; Qiu, C.; Schmitt, M.; Wang, Y.; Zhu, X.X. Seven city types representing morphologic configurations of cities across the globe. Cities 2020, 105, 102814. [Google Scholar] [CrossRef]
  16. Tantrakarnapa, K.; Bhopdhornangkul, B.; Nakhaapakorn, K. Influencing factors of COVID-19 spreading: A case study of Thailand. J. Public Health 2020. [Google Scholar] [CrossRef]
  17. Chakraborty, I.; Maity, P. COVID-19 outbreak: Migration, effects on society, global environment and prevention. Sci. Total Environ. 2020, 728, 138882. [Google Scholar] [CrossRef]
  18. Nicola, M.; Alsafi, Z.; Sohrabi, C.; Kerwan, A.; Al-Jabir, A.; Iosifidis, C.; Agha, M.; Agha, R. The socio-economic implications of the coronavirus pandemic (COVID-19): A review. Int. J. Surg. 2020, 78, 185–193. [Google Scholar] [CrossRef]
  19. Shaw, R.; Kim, Y.; Hua, J. Governance, technology and citizen behavior in pandemic: Lessons from COVID-19 in East Asia. Prog. Disaster Sci. 2020, 6, 100090. [Google Scholar] [CrossRef]
  20. Adler, P.; Florida, R.; Hartt, M. Mega Regions and Pandemics. Tijdschr. Econ. Soc. Geogr. 2020, 111, 465–481. [Google Scholar] [CrossRef]
  21. Liu, L. Emerging study on the transmission of the Novel Coronavirus (COVID-19) from urban perspective: Evidence from China. Cities 2020, 103, 102759. [Google Scholar] [CrossRef]
  22. Powell, T.; Chuang, E. COVID in NYC: What We Could Do Better. Am. J. Bioeth. 2020, 20, 62–66. [Google Scholar] [CrossRef]
  23. Tira, M. About the Sustainability of Urban Settlements. A first reflection on the correlation between the spread of Covid-19 and the regional average population density in Italy. TeMA-J. Land Use Mobil. Environ. 2020, 361–371. [Google Scholar] [CrossRef]
  24. He, D.; Zhao, S.; Lin, Q.; Zhuang, Z.; Cao, P.; Wang, M.H.; Yang, L. The relative transmissibility of asymptomatic COVID-19 infections among close contacts. Int. J. Infect. Dis. 2020, 94, 145–147. [Google Scholar] [CrossRef] [PubMed]
  25. Government of the Republic of Poland Mapa Zarażeń Koronawirusem [Map of Coronavirus Infection] (SARS-CoV-2). Available online: https://www.gov.pl/web/koronawirus/wykaz-zarazen-koronawirusem-sars-cov-2 (accessed on 29 July 2020).
  26. Goujon, A.; Natale, F.; Ghio, D.; Conte, A.; Dijkstra, L. Age, Gender, and Territory of COVID-19 Infections and Fatalities; Publications Office of the European Union: Luxembourg, 2020. [Google Scholar]
  27. Johns Hopkins Coronavirus Resource Center COVID-19 Map. Available online: https://coronavirus.jhu.edu/map.html (accessed on 29 July 2020).
  28. World Health Organization WHO Coronavirus (COVID-19) Dashboard. Available online: https://covid19.who.int/ (accessed on 29 July 2020).
  29. Joffé, G. COVID-19 and North Africa. J. N. Afr. Stud. 2020, 25, 515–522. [Google Scholar] [CrossRef]
  30. Kuebart, A.; Stabler, M. Infectious Diseases as Socio-Spatial Processes: The COVID-19 Outbreak in Germany. Tijdschr. Econ. Soc. Geogr. 2020, 111, 482–496. [Google Scholar] [CrossRef]
  31. Åslund, A. Responses to the COVID-19 crisis in Russia, Ukraine, and Belarus. Eurasian Geogr. Econ. 2020, 61, 532–545. [Google Scholar] [CrossRef]
  32. Ren, X. Pandemic and lockdown: A territorial approach to COVID-19 in China, Italy and the United States. Eurasian Geogr. Econ. 2020, 61, 423–434. [Google Scholar] [CrossRef]
  33. Ruiu, M.L. Mismanagement of Covid-19: Lessons learned from Italy. J. Risk Res. 2020, 23, 1007–1020. [Google Scholar] [CrossRef]
  34. Šantić, D.; Antić, M. Serbia in the time of COVID-19: Between “corona diplomacy”, tough measures and migration management. Eurasian Geogr. Econ. 2020, 61, 546–558. [Google Scholar] [CrossRef]
  35. Drozdowski, R.; Frąckowiak, M.; Krajewski, M.; Kubacka, M.; Modrzyk, A.; Rogowski, Ł.; Rura, P.; Stamm, A. Życie Codzienne w Czasach Pandemii. Raport z Pierwszego Etapu Badań; Uniwersytet im. Adama Mickiewicza w Poznaniu: Poznań, Poland, 2020. [Google Scholar]
  36. Gujski, M.; Raciborski, F.; Jankowski, M.; Nowicka, P.M.; Rakocy, K.; Pinkas, J. Epidemiological Analysis of the First 1389 Cases of COVID-19 in Poland: A Preliminary Report. Med. Sci. Monit. 2020, 26, e924702. [Google Scholar] [CrossRef] [PubMed]
  37. Jarynowski, A.; Wójta-Kempa, M.; Belik, V. Percepcja “koronawirusa” w polskim Internecie do czasu potwierdzenia pierwszego przypadku zakażenia SARS-CoV-2 w Polsce [Perception of “coronavirus” on the Polish Internet until arrival of SARS-CoV-2 in Poland]. Pielęgniarstwo Zdr. Publiczne 2020, 10, 89–106. [Google Scholar] [CrossRef]
  38. Pinkas, J.; Jankowski, M.; Szumowski, Ł.; Lusawa, A.; Zgliczyński, W.S.; Raciborski, F.; Wierzba, W.; Gujski, M. Public Health Interventions to Mitigate Early Spread of SARS-CoV-2 in Poland. Med. Sci. Monit. 2020, 26, e924730. [Google Scholar] [CrossRef]
  39. Śleszyński, P. Prawidłowości w przebiegu dyfuzji przestrzennej rejestrowanych zakażeń koronawirusem SARS-CoV-2 w Polsce w pierwszych 100 dniach epidemii [The regularity of spatial diffusion of recorded SARS-CoV-2 coronavirus infections of the epidemic in Poland in the first 100 days]. Czas. Geogr. 2020, 91, 5–18. [Google Scholar]
  40. Boguszewski, R.; Makowska, M.; Podkowińska, M. A Typology of Poles’ Attitudes toward COVID-19 during the First Wave of the Pandemic. Int. J. Environ. Res. Public Health 2021, 18, 2002. [Google Scholar] [CrossRef] [PubMed]
  41. Napierała, T.; Leśniewska-Napierała, K.; Burski, R. Impact of Geographic Distribution of COVID-19 Cases on Hotels’ Performances: Case of Polish Cities. Sustainability 2020, 12, 4697. [Google Scholar] [CrossRef]
  42. Runge, A. Procesy i struktury ludnościowe w województwie śląskim [Processes and demographic structures in the Śląskie Voivodeship]. In Procesy i Struktury Demograficzno-Społeczne na Obszarze Województwa Śląskiego w Latach 1988–2008 [Processes and Demographic-Social Structures in the Śląskie Voivodeship in 1988–2008]; Runge, J., Żurek, I., Eds.; Urząd Statystyczny w Katowicach: Katowice, Poland, 2010; pp. 33–83. [Google Scholar]
  43. Spórna, T.; Krzysztofik, R. ‘Inner’ suburbanization—Background of the phenomenon in a polycentric, post-socialist and post-industrial region. Example from the Katowice conurbation, Poland. Cities 2020, 104, 102789. [Google Scholar] [CrossRef]
  44. Krzysztofik, R.; Tkocz, M.; Spórna, T.; Kantor-Pietraga, I. Some dilemmas of post-industrialism in a region of traditional industry: The case of the Katowice conurbation, Poland. Morav. Geogr. Rep. 2016, 24, 42–54. [Google Scholar] [CrossRef] [Green Version]
  45. Haase, A.; Rink, D.; Grossmann, K. Shrinking Cities in Post-Socialist Europe: What Can We Learn From Their Analysis for Theory Building Today? Geogr. Ann. Ser. B Hum. Geogr. 2016, 98, 305–319. [Google Scholar] [CrossRef]
  46. Jaroszewska, E. Kurczenie się (Shrinkage) Starych Miast Przemysłowych i Przeciwdziałanie Jego Negatywnym Skutkom; Instytut Rozwoju Miast i Regionów, Uniwersytet im. Adama Mickiewicza w Poznaniu: Warszawa-Kraków-Poznań, Poland, 2019. [Google Scholar]
  47. Sailer-Fliege, U. Characteristics of post-socialist urban transformation in East Central Europe. GeoJournal 1999, 49, 7–16. [Google Scholar] [CrossRef]
  48. Davoudi, S. EUROPEAN BRIEFING: Polycentricity in European spatial planning: From an analytical tool to a normative agenda. Eur. Plan. Stud. 2003, 11, 979–999. [Google Scholar] [CrossRef]
  49. Riguelle, F.; Thomas, I.; Verhetsel, A. Measuring urban polycentrism: A European case study and its implications. J. Econ. Geogr. 2007, 7, 193–215. [Google Scholar] [CrossRef]
  50. Główny Urząd Statystyczny w Polsce [Statistics Poland] Bank Danych Lokalnych [Local Data Bank]. Available online: https://bdl.stat.gov.pl/BDL/ (accessed on 29 July 2020).
  51. WUS. Rocznik Statystyczny Województwa Katowickiego 1991 [Statistical Yearbook of Katowice Voivodship 1991]; Wojewódzki Urząd Statystyczny: Katowice, Poland, 1991. [Google Scholar]
  52. Runge, J.; Krzysztofik, R.; Kantor-Pietraga, I.; Spórna, T. Characteristic Features of Urbanization in the Area of Silesian Province (Poland) at the Beginning of 21st Century. Rom. Sociol. 2011, 3, 56–66. [Google Scholar]
  53. Spórna, T. The suburbanisation process in a depopulation context in the Katowice conurbation, Poland. Environ. Socio-Econ. Stud. 2018, 6, 57–72. [Google Scholar] [CrossRef] [Green Version]
  54. Ministerstwo Zdrowia [Ministry of Health]. Pierwszy przypadek koronawirusa w Polsce [The First Case of Coronavirus in Poland]. Available online: www.gov.pl/web/zdrowie/pierwszy-przypadek-koronawirusa-w-polsce (accessed on 29 July 2020).
  55. JSW Liczba Zakażeń w JSW [Number of Infections in JSW]. Available online: https://www.jsw.pl/media/wydarzenia/artykul/kolejne-przypadki-zachorowan (accessed on 20 July 2020).
  56. Sas, A. Share of Coronavirus Cases in Coal Mines in Poland 2020. Available online: www.statista.com/statistics/1124141/poland-coronavirus-cases-in-coal-mines/ (accessed on 29 July 2020).
  57. Frankowski, J.; Mazurkiewicz, J.; Sokołowski, J.; Lewandowski, P. Zatrudnienie w górnictwie węgla kamiennego w Zagłębiu Górnośląskim [Employment in coal mining in the Upper Silesian Basin]. IBS Res. Rep. 2020. Available online: https://ibs.org.pl/app/uploads/2020/09/IBS_Research_Report_01_2020.pdf (accessed on 29 July 2020).
  58. Śleszyński, P. Delimitacja Miast Średnich Tracących Funkcje Społeczno-Gospodarcze [Delimitation of Medium Cities Losing Socio-economic Functions]; Instytut Geografii i Przestrzennego Zagospodarowania PAN: Warszawa, Poland, 2016. [Google Scholar]
  59. Powiatowa Stacja Sanitarno-Epidemiologiczna [County Sanitary and Epidemiological Stations] Dane Dotyczące Aktualnej Sytuacji Epidemiologicznej SARS-CoV-2 [Data on the Current Epidemiological Situation of SARS-CoV-2]. Available online: https://www.psse.bielsko.pl/; https://psse.bytom.pl/; https://pssecieszyn.pis.gov.pl/; https://pssechorzow.pis.gov.pl/; http://psse.czest.pl/; https://pssedabrowagornicza.pis.gov.pl/; https://pssegliwice.pis.gov.pl/; https://pssejaworzno.pis.gov.pl/ (accessed on 2 July 2020).
  60. Solecka, M. Czy Koronawirus Zwiększył Śmiertelność? [Has the Coronavirus Increased the Death Rate?]. Available online: www.mp.pl/pacjent/choroby-zakazne/koronawirus/koronawirus-warto-wiedziec/234886,czy-koronawirus-zwiekszyl-smiertelnosc (accessed on 29 July 2020).
  61. Ebdon, D. Statistics in Geography. A Practical Approach; Basil Blackwell: Oxford, UK, 1977. [Google Scholar]
  62. Guilford, J.P. Fundamental Statistics in Psychology and Education, 4th ed.; McGraw-Hill: New York, NY, USA, 1965. [Google Scholar]
  63. Lazarsfeld, P.F. Some Remarks on Typological Procedure in Social Research. Z. Sozialforsch. 1937, 6, 119–139. [Google Scholar] [CrossRef]
  64. López Roldán, P. La construcción de tipologías: Metodología de análisis. Pap. Rev. Sociol. 1996, 48, 9. [Google Scholar] [CrossRef]
  65. Parysek, J.J.; Wojtasiewicz, L. Metody analizy regionalnej i metody planowania regionalnego [Methods of regional analysis and methods of regional planning]. In Studia. KPZK PAN; Państwowe Wydawnictwo Naukowe: Warszawa, Poland, 1979. [Google Scholar]
  66. Runge, J. Metody Badań w Geografii Społeczno-Ekonomicznej—Elementy Metodologii, Wybrane Narzędzia Badawcze [Research Methods in Socio-Economic Geography: Elements of Methodology, Selected Research Tools], 2nd ed.; Wydawnictwo Uniwersytetu Śląskiego [University of Silesia Publishing House]: Katowice, Poland, 2007; ISBN 978-83-226-1681-9. [Google Scholar]
  67. Thomas, I. Thematic cartography today: Recalls and perspectives. Cybergeo 2001. [Google Scholar] [CrossRef]
  68. Polnad in Polish Mines Prepare for Potential Second Wave of Infections. Available online: https://polandin.com/48537186/polish-mines-prepare-for-potential-second-wave-of-infections (accessed on 29 July 2020).
  69. Michie, J. The covid-19 crisis—and the future of the economy and economics. Int. Rev. Appl. Econ. 2020, 34, 301–303. [Google Scholar] [CrossRef]
  70. Creţan, R.; Light, D. COVID-19 in Romania: Transnational labour, geopolitics, and the Roma ‘outsiders’. Eurasian Geogr. Econ. 2020, 61, 559–572. [Google Scholar] [CrossRef]
  71. Krzysztofik, R.; Kantor-Pietraga, I.; Spórna, T. Spatial and functional dimensions of the COVID-19 epidemic in Poland. Eurasian Geogr. Econ. 2020, 61, 573–586. [Google Scholar] [CrossRef]
  72. WSSE (Wojewódzka Stacja Sanitarno-Epidemiologiczna w Katowicach). [Regional Sanitary-Epidemiological Station in Katowice] No Title. Available online: http://www.wsse.katowice.pl/ (accessed on 29 July 2020).
  73. Spórna, T.; Kantor-Pietraga, I.; Krzysztofik, R. Trajectories of Depopulation and Urban Shrinkage in the Katowice Conurbation, Poland. Espac. Popul. Sociétés 2016. [Google Scholar] [CrossRef]
  74. Bernt, M.; Haase, A.; Großmann, K.; Cocks, M.; Couch, C.; Cortese, C.; Krzysztofik, R. How does(n’t) Urban Shrinkage get onto the Agenda? Experiences from Leipzig, Liverpool, Genoa and Bytom. Int. J. Urban Reg. Res. 2014, 38, 1749–1766. [Google Scholar] [CrossRef]
  75. Rink, D.; Couch, C.; Haase, A.; Krzysztofik, R.; Nadolu, B.; Rumpel, P. The governance of urban shrinkage in cities of post-socialist Europe: Policies, strategies and actors. Urban Res. Pract. 2014, 7, 258–277. [Google Scholar] [CrossRef]
  76. Kantor-Pietraga, I.; Krzysztofik, R.; Runge, J.; Spórna, T. Problemy zarządzania miastem kurczącym się na przykładzie Bytomia [Problems of Urban Shrinkage Presented on the Example of the City of Bytom]. In Społeczna Odpowiedzialność w Procesach Zarządzania Funkcjonalnymi Obszarami Miejskimi [Social Responsibility in the Management Processes of Functional Urban Areas]; Markowski, T., Stawasz, D., Eds.; Komitet Przestrzennego Zagospodarowania Kraju: Warszawa, Poland, 2014; Volume 253, pp. 162–175. [Google Scholar]
  77. Khorram-Manesh, A.; Carlström, E.; Hertelendy, A.J.; Goniewicz, K.; Casady, C.B.; Burkle, F.M. Does the Prosperity of a Country Play a Role in COVID-19 Outcomes? Disaster Med. Public Health Prep. 2020, 1–10. [Google Scholar] [CrossRef] [PubMed]
  78. El Bcheraoui, C.; Weishaar, H.; Pozo-Martin, F.; Hanefeld, J. Assessing COVID-19 through the lens of health systems’ preparedness: Time for a change. Global. Health 2020, 16, 112. [Google Scholar] [CrossRef] [PubMed]
  79. Gupta, S.; Anderson, R.M.; May, R.M. Networks of sexual contacts: Implications for the pattern of spread of HIV. AIDS 1989, 3, 807–817. [Google Scholar] [CrossRef] [PubMed]
  80. Reyes, R.; Ahn, R.; Thurber, K.; Burke, T.F. Urbanization and Infectious Diseases: General Principles, Historical Perspectives, and Contemporary Challenges. In Challenges in Infectious Diseases; Fong, I.W., Ed.; Springer: New York, NY, USA, 2013; pp. 123–146. ISBN 978-1-4614-4496-1. [Google Scholar]
  81. Polska Grupa Górnicza Badania Przesiewowe w PGG, S.A. na Bezprecedensową w Europie Skalę [Screening Tests at PGG S.A. on an Unprecedented Scale in Europe]. Available online: https://www.pgg.pl/aktualnosci/z-zycia-firmy/1105,Badania+przesiewowe+w+PGG+S.A.+na+bezprecedensową+w+Europie+skalę (accessed on 29 July 2020).
  82. Rieniets, T. Shrinking Cities: Causes and Effects of Urban Population Losses in the Twentieth Century. Nat. Cult. 2009, 4, 231–254. [Google Scholar] [CrossRef]
  83. Reckien, D.; Martinez-Fernandez, C. Why Do Cities Shrink? Eur. Plan. Stud. 2011, 19, 1375–1397. [Google Scholar] [CrossRef]
  84. Mallach, A.; Haase, A.; Hattori, K. The shrinking city in comparative perspective: Contrasting dynamics and responses to urban shrinkage. Cities 2017, 69, 102–108. [Google Scholar] [CrossRef]
  85. Carbonaro, G.; Leanza, E.; McCann, P.; Medda, F. Demographic Decline, Population Aging, and Modern Financial Approaches to Urban Policy. Int. Reg. Sci. Rev. 2016, 41, 210–232. [Google Scholar] [CrossRef]
  86. Wolff, M.; Wiechmann, T. Urban growth and decline: Europe’s shrinking cities in a comparative perspective 1990–2010. Eur. Urban Reg. Stud. 2018, 25, 122–139. [Google Scholar] [CrossRef]
  87. Krzysztofik, R.; Runge, J.; Kantor-Pietraga, I. Paths of Shrinkage in the Katowice Conurbation. Case Studies of Bytom and Sosnowiec Cities; Wydział Nauk o Ziemi, Uniwersytet Śląski: Sosnowiec, Poland, 2011. [Google Scholar]
  88. Krzysztofik, R.; Runge, J.; Kantor-Pietraga, I. An Introduction to Governance of Urban Shrinkage. A Case of Two Polish Cities: Bytom and Sosnowiec; Wydział Nauk o Ziemi, Uniwersytet Śląski: Sosnowiec, Poland, 2012. [Google Scholar]
  89. Pazura, N. Testy na Koronawirusa na Milion Mieszkańców—Jak Polska Wypada na tle Europy i Nie Tylko? Zestawienie [Coronavirus Tests per Million Inhabitants—How Does Poland Compare to Europe and Beyond? Juxtaposition]. Available online: https://www.euractiv.pl/section/bezpieczenstwo-i-obrona/news/testy-na-koronawirusa-na-milion-mieszkancow-krotkie-zestawienie/ (accessed on 29 July 2020).
  90. Worldometer COVID-19 Coronavirus Pandemic. Available online: https://www.worldometers.info/coronavirus/ (accessed on 29 July 2020).
  91. Istel, M.; Fober, K. Jak Epidemia Wpłynęła na Statystyki Zgonów w Polsce? [How did the Epidemic Affect Death Statistics in Poland?]. Available online: https://konkret24.tvn24.pl/zdrowie,110/jak-epidemia-wplynela-na-statystyki-zgonow-w-polsce-analiza-konkret24,1015645.html (accessed on 29 July 2020).
  92. European Environment Agency. Air Quality in Europe—2019 Report; European Environment Agency: Luxembourg, 2019.
Figure 1. Confirmed case of COVID-19 in Poland, by provinces (22 May–10 June 2020). Source: own elaboration based on data on the current epidemiological situation of SARS-CoV-2 from County Sanitary and Epidemiological Stations [59].
Sustainability 13 04109 g001
Figure 2. Spatial distribution of COVID-19 incidence by population density. The table of signs. Source: By authors.
Sustainability 13 04109 g002
Figure 3. Confirmed case of COVID-19 in Silesian province by communes (22 June 2020). Source: own elaboration based on data on the current epidemiological situation of SARS-CoV-2 from County Sanitary and Epidemiological Stations [59].
Sustainability 13 04109 g003
Figure 4. Coal mining and confirmed cases of COVID-19 in Silesian province. The table of signs. Source: By authors.
Sustainability 13 04109 g004
Figure 5. Spatial distribution of COVID-19 incidence by population dynamics. The table of signs. Source: By authors.
Sustainability 13 04109 g005
Publisher’s Note: MDPI stays neutral with regard to jurisdictional claims in published maps and institutional affiliations.

